cfd study of drag and lift of sepak takraw ball at...
TRANSCRIPT
Research ArticleCFD Study of Drag and Lift of Sepak Takraw Ball atDifferent Face Orientations
Abdul Syakir Abdul Mubin,1 Norhafizan Ahmad,1 Azuddin Mamat,1
Zahari Taha,2 and Iskandar Hasanuddin3
1 Centre for Product Design & Manufacturing (CPDM), Department of Mechanical Engineering, Faculty of Engineering,University of Malaya, 50603 Kuala Lumpur, Malaysia
2 Intelligent Manufacturing and Mechatronics Lab, Faculty of Manufacturing, Universiti Malaysia Pahang,Gambang, 26300 Kuantan, Pahang, Malaysia
3 Department of Mechanical Engineering, Syiah Kuala University, Jalan Teuku Nyak Arief, Banda Aceh, Aceh 23111, Indonesia
Correspondence should be addressed to Norhafizan Ahmad; [email protected]
Received 22 April 2014; Revised 12 September 2014; Accepted 19 September 2014
Academic Editor: Jinjia Wei
Copyright © Abdul Syakir Abdul Mubin et al. This is an open access article distributed under the Creative Commons AttributionLicense, which permits unrestricted use, distribution, and reproduction in any medium, provided the original work is properlycited.
There have been a significant number of researches on computational fluid dynamic (CFD) analysis of balls used in sports suchas golf balls, tennis balls, and soccer balls. Sepak takraw is a high speed court game predominantly played in Southeast Asia usingmainly the legs and head. The sepak takraw ball is unique because it is not enclosed and made of woven plastic. Hence a study ofits aerodynamics would give insight into its behaviour under different conditions of play. In this study the dynamics of the fluidaround a static sepak takraw ball was investigated at different wind speeds for three different orientations using CFD. It was foundthat although the drag did not differ very much, increasing the wind velocity causes an increase in drag. The lift coefficient variesas the velocity increases and does not show a regular pattern. The drag and lift coefficients are influenced by the orientation of thesepak takraw ball.
1. Introduction
Most sports balls have spherical shapes and are subjected tothrowing, hitting, or kicking. As a result they are dynamicallyaffected by the surrounding fluid either air or water. One ofthe earliest researches on the aerodynamics of sports balls wasby Mehta [1]. Subsequent studies have focused on sports balldrag coefficient (𝐶
𝐷) values. Bearman andHarvey [2] studied
the drag and lift parameter for different types of golf ball ina wind tunnel test. For baseballs, the relationship betweenrotation and lateral forces was evaluated [3], as well as theeffects of seams on their aerodynamic properties [4]. Severalsimilar studies have investigated tennis balls [5], soccer balls[6–8], and cricket ball [9].
The sepak takrawball is unique since it is not enclosed likeany other balls, as such air can pass through the ball and thereare many seams on its surface. These features are expectedto produce great efficacy on its aerodynamic performance.
In this paper a numerical study of a nonspinning sepaktakraw ball was carried out to investigate the dependence ofits aerodynamic characteristics on the orientation of the ballface. The simulation was conducted for a nonrotating ballmodel for all three different orientations at different windspeeds using Ansys CFX as the CFD modelling tool.
2. Related Research
The flight of a sports ball can be influenced by two crucialaerodynamic properties, lift and drag. Lift can be defined asthe force acting on the ball whose direction is perpendicularto the ball’s flight path, while drag can be described as forceacting on the opposite direction of the ball’s trajectory. Lift ona ball is dedicated by several factors of the ball such velocityof the ball, orientation, geometry characteristic of the ball,and rotational speed [10]. Haake et al. [11] investigated theperformance of various sports balls as performance of sports
Hindawi Publishing CorporationAdvances in Mechanical EngineeringArticle ID 369137
at Universiti Malaya (S141/J/2004) on June 5, 2015ade.sagepub.comDownloaded from

2 Advances in Mechanical Engineering
(a)
𝛼
𝛽
y
x
z
(b)
Figure 1: (a) Actual sepak takraw ball; (b) CAD model of sepak takraw ball.
balls is directly influenced by the position of the separationpoints of the boundary layer. The most important part isthat these points are dedicated by the surface roughnessof the ball. The drag force is influenced by velocity of theball, orientation, surface geometry of the ball, and rotationalspeed; the same applies for lift force. For example, the dragforce for smooth spheres did not remain constant as velocityor surface roughness changed and, therefore, many scientistsbegan studying different spheres to prove this point. Lowerseam lengths and adding more surface smoothness decreasethe drag coefficient at high Reynolds number as shown byAlam at al. [12] with different types of soccer balls. Theaerodynamic parameters of a soccer by Barber at al. [13]also concluded that the seam width was found to have amore profound effect on 𝐶
𝐷than seam depth because the
separation points were affected directly by the width.Seo and Shibata [14] conducted experiments in a wind
tunnel on different orientations of sepak takraw ball aerody-namic characteristics.They found that the drag coefficient𝐶
𝐷
ranges between 0.42 and 0.52, while the lift coefficient (𝐶𝐿)
ranges between −0.1 and 0.1. Seo and Shibata [14] concludedthat the orientation affects the drag and lift component.Taha and Sugiyono [15] studied different diameters of twodifferent types of sepak takraw balls and their effect onthe ball aerodynamics. They used a smooth sphere with 12pentagonal holes which is a simple model of a sepak takrawball. They showed that the rubber padded on the surfaceof plastic balls produce slightly higher drag compared tothe ordinary plastic balls. In addition the rubber paddedballs which had a larger diameter produced negative lift. Theresearchers distinguished ball types by defining a differentsurface roughness for each type of ball.
3. Ball Description
The sepak takraw ball is constructed byweaving plastic strips.It has 12 holes and the surface consists of twenty intersections(see Figure 1). The regulation requires the ball diameter tobe approximately 0.135m. However the diameter can varyslightly depending on the manufacturer of the ball and also
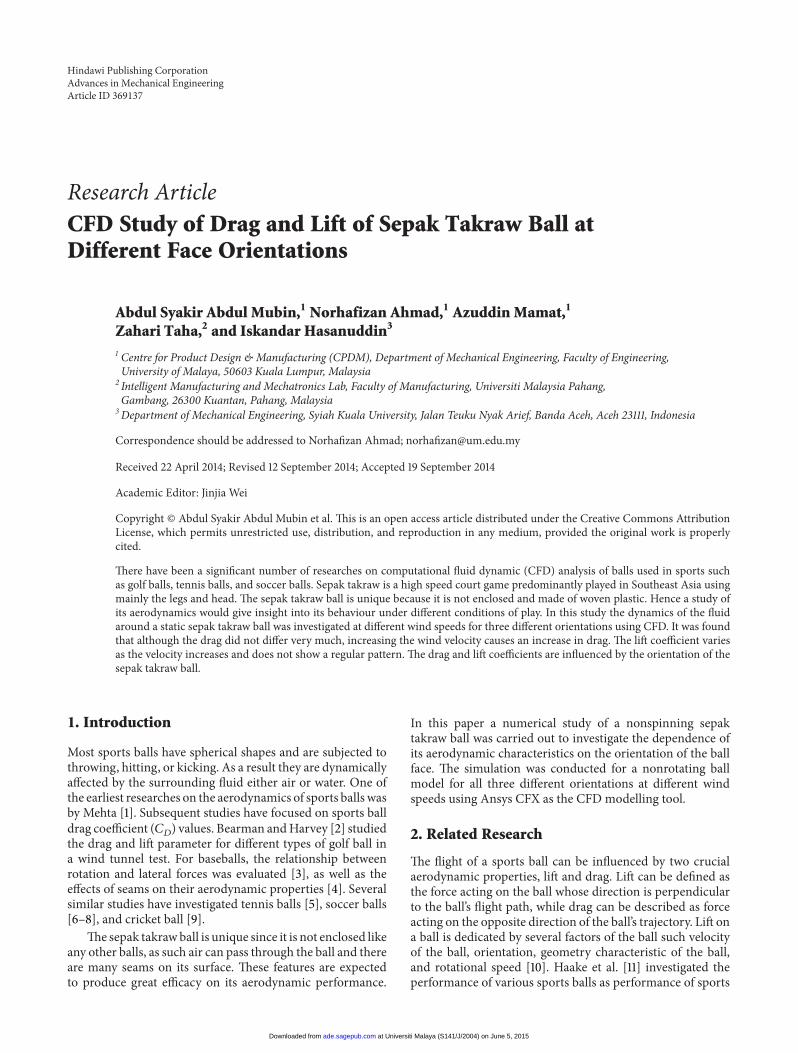
different categories of sepak takraw game. The ball shapepresents itself as a complex geometry; thus it is a challengeof understanding its aerodynamic behaviour. The traditionalball is made of rattan. In this study there are 3 different facesof the orientationwhich are investigated as shown in Figure 2.
4. Resources and Limitation
Considering the complex geometry of the ball limits thecapability to run simulation of rotating condition whichrequires a significant computational overhead; therefore non-rotating condition was chosen as almost all aerodynamicsports research started with nonrotating condition [2, 7, 12,16]. All different positions are defined as shown in Figure 2.The different kind of position distinguishes the differentholes position that affect the drag and lift performanceof the sepak takraw ball. The Reynolds number for eachorientation are around 4 × 10⁴ to 2.8 × 10⁵. Any effect fromvortices shedding is not considered in this study since thereis no past research considering effect of vortex sheddingin aerodynamics of sepak takraw. Due to computationallimitations, the CFD analysis will focus on the use of thesteady state Reynolds averaged Navier-Stokes (RANS) [15]and shear stress transport (SST) approach. These limitationsrequired the assumption of a fully turbulent boundary layer.It was thought that the drag crisis did not happen over therange of Re experienced by the flow around a sepak takrawball [14], and the aerodynamic properties would be largelyunaffected by this and a steady-state flow analysis would giveuseful information at a much lower computational cost.
5. Comparison
The results acquired from CFD analysis are compared usingdrag coefficient data experiment from the Seo and Shibata[14] where the drag coefficient was recorded as a functionof Reynolds number. Since the drag coefficient recordedthrough experiment does not drop dramatically, the assump-tion is that boundary layer in range of Re is expected to bein subcritical region. This further is confirmed later after the
at Universiti Malaya (S141/J/2004) on June 5, 2015ade.sagepub.comDownloaded from
Advances in Mechanical Engineering 3
y
x
(a) 𝛼 = 90∘, 𝛽 = 0∘
y
z
(b) 𝛼 = 0∘, 𝛽 = 0∘ (c) 𝛼 = 0∘, 𝛽 = 103∘
Figure 2: Definition of front view position used for CFD simulation where the flow is through to the front view (a) position 1(P1), (b) position2(P2), and (c) position 3(P3), respectively.
(a)
0.000
0.250
0.500
0.750
1.000
(m)
w
�
(b)
Figure 3: (a) Boundary layer meshing of sepak takraw ball model; (b) half cut view of volume mesh M2 of fluid domain surrounding sepaktakraw model.
data from CFD analysis is in good agreement with Seo andShibata [14].
6. Computational Simulation Modelling
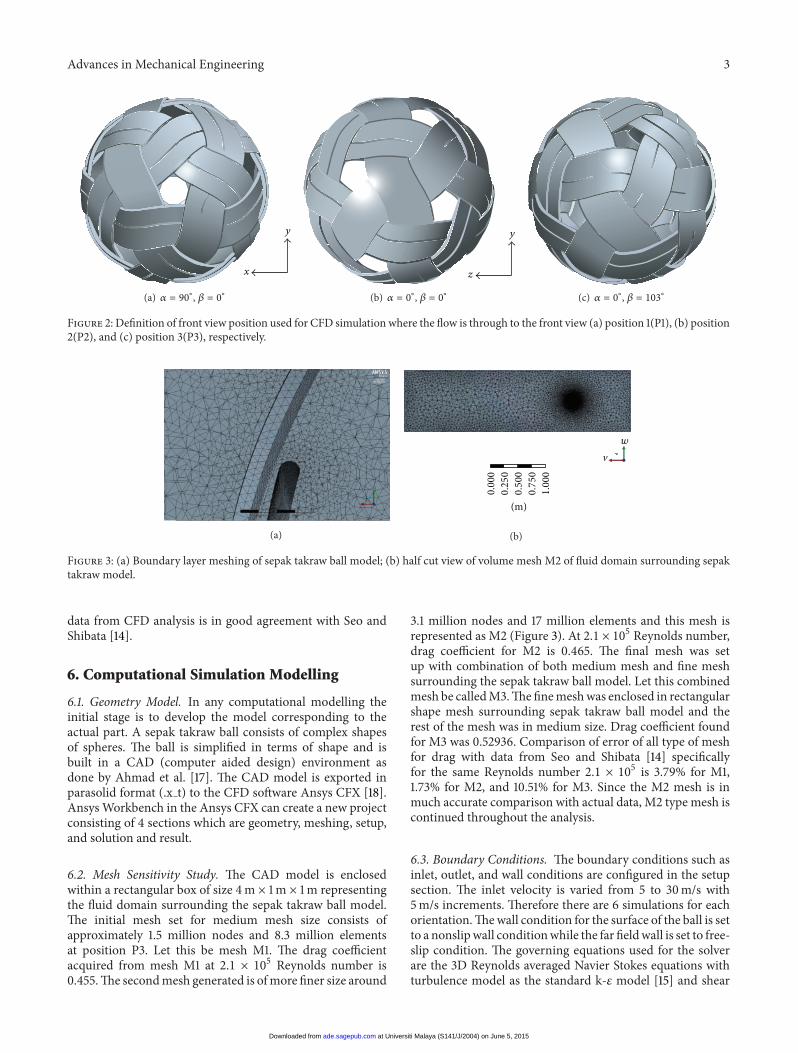
6.1. Geometry Model. In any computational modelling theinitial stage is to develop the model corresponding to theactual part. A sepak takraw ball consists of complex shapesof spheres. The ball is simplified in terms of shape and isbuilt in a CAD (computer aided design) environment asdone by Ahmad et al. [17]. The CAD model is exported inparasolid format (.x t) to the CFD software Ansys CFX [18].AnsysWorkbench in the Ansys CFX can create a new projectconsisting of 4 sections which are geometry, meshing, setup,and solution and result.
6.2. Mesh Sensitivity Study. The CAD model is enclosedwithin a rectangular box of size 4m × 1m × 1m representingthe fluid domain surrounding the sepak takraw ball model.The initial mesh set for medium mesh size consists ofapproximately 1.5 million nodes and 8.3 million elementsat position P3. Let this be mesh M1. The drag coefficientacquired from mesh M1 at 2.1 × 10⁵ Reynolds number is0.455.The secondmesh generated is ofmore finer size around
3.1 million nodes and 17 million elements and this mesh isrepresented as M2 (Figure 3). At 2.1 × 10⁵ Reynolds number,drag coefficient for M2 is 0.465. The final mesh was setup with combination of both medium mesh and fine meshsurrounding the sepak takraw ball model. Let this combinedmesh be calledM3.Thefinemeshwas enclosed in rectangularshape mesh surrounding sepak takraw ball model and therest of the mesh was in medium size. Drag coefficient foundfor M3 was 0.52936. Comparison of error of all type of meshfor drag with data from Seo and Shibata [14] specificallyfor the same Reynolds number 2.1 × 10⁵ is 3.79% for M1,1.73% for M2, and 10.51% for M3. Since the M2 mesh is inmuch accurate comparison with actual data, M2 type mesh iscontinued throughout the analysis.
6.3. Boundary Conditions. The boundary conditions such asinlet, outlet, and wall conditions are configured in the setupsection. The inlet velocity is varied from 5 to 30m/s with5m/s increments. Therefore there are 6 simulations for eachorientation.Thewall condition for the surface of the ball is setto a nonslipwall conditionwhile the far fieldwall is set to free-slip condition. The governing equations used for the solverare the 3D Reynolds averaged Navier Stokes equations withturbulence model as the standard k-𝜀 model [15] and shear
at Universiti Malaya (S141/J/2004) on June 5, 2015ade.sagepub.comDownloaded from
4 Advances in Mechanical Engineering
0
0.1
0.2
0.3
0.4
0.5
0.6
0 5 10 15 20 25 30 35
Dra
g co
effici
ent
P1 (SST)P2 (SST)P3 (SST)
P1 (k-epsilon)P2 (k-epsilon)P3 (k-epsilon)
Velocity (m s−1)
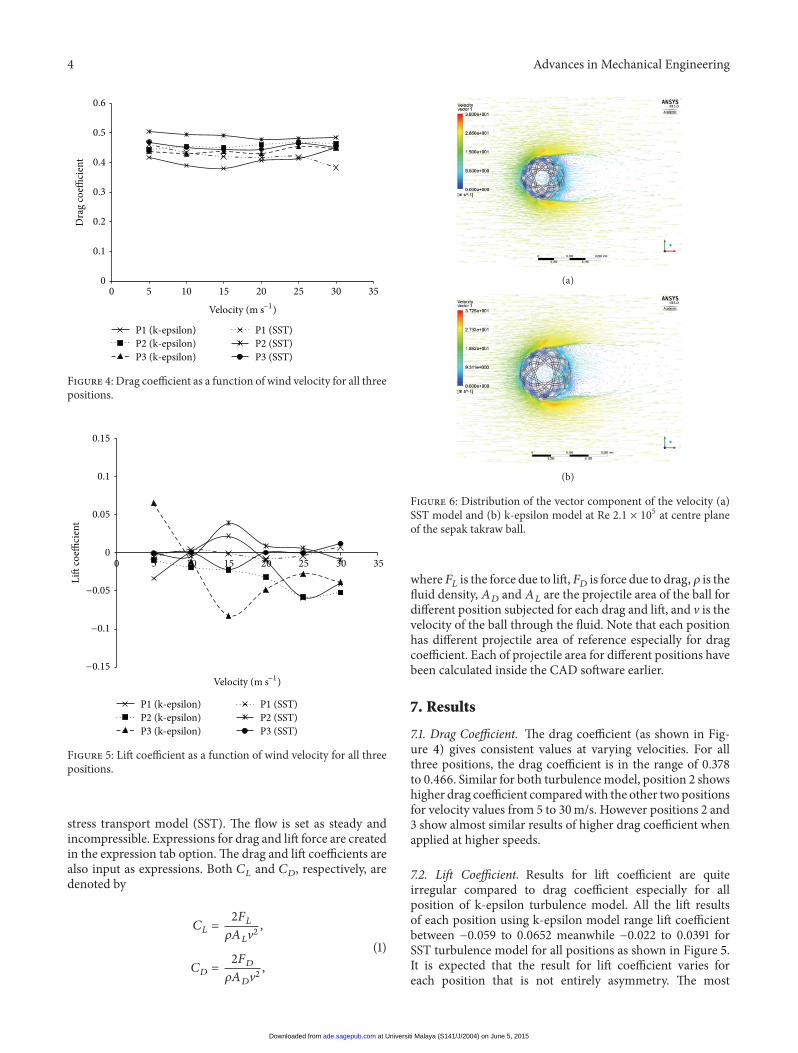
Figure 4: Drag coefficient as a function of wind velocity for all threepositions.
Lift
coeffi
cien
t
0 5 10 15 20 25 30 35
P1 (SST)P2 (SST)P3 (SST)
P1 (k-epsilon)P2 (k-epsilon)P3 (k-epsilon)
−0.15
−0.1
−0.05
0
0.05
0.1
0.15
Velocity (m s−1)
Figure 5: Lift coefficient as a function of wind velocity for all threepositions.
stress transport model (SST). The flow is set as steady andincompressible. Expressions for drag and lift force are createdin the expression tab option.The drag and lift coefficients arealso input as expressions. Both 𝐶
𝐿and 𝐶
𝐷, respectively, are
denoted by
𝐶𝐿=2𝐹𝐿
𝜌𝐴𝐿V2,
𝐶𝐷=2𝐹𝐷
𝜌𝐴𝐷V2,
(1)
(a)
(b)
Figure 6: Distribution of the vector component of the velocity (a)SST model and (b) k-epsilon model at Re 2.1 × 10⁵ at centre planeof the sepak takraw ball.
where𝐹𝐿is the force due to lift,𝐹
𝐷is force due to drag, 𝜌 is the
fluid density,𝐴𝐷and𝐴
𝐿are the projectile area of the ball for
different position subjected for each drag and lift, and V is thevelocity of the ball through the fluid. Note that each positionhas different projectile area of reference especially for dragcoefficient. Each of projectile area for different positions havebeen calculated inside the CAD software earlier.
7. Results
7.1. Drag Coefficient. The drag coefficient (as shown in Fig-ure 4) gives consistent values at varying velocities. For allthree positions, the drag coefficient is in the range of 0.378to 0.466. Similar for both turbulencemodel, position 2 showshigher drag coefficient comparedwith the other two positionsfor velocity values from 5 to 30m/s. However positions 2 and3 show almost similar results of higher drag coefficient whenapplied at higher speeds.
7.2. Lift Coefficient. Results for lift coefficient are quiteirregular compared to drag coefficient especially for allposition of k-epsilon turbulence model. All the lift resultsof each position using k-epsilon model range lift coefficientbetween −0.059 to 0.0652 meanwhile −0.022 to 0.0391 forSST turbulence model for all positions as shown in Figure 5.It is expected that the result for lift coefficient varies foreach position that is not entirely asymmetry. The most
at Universiti Malaya (S141/J/2004) on June 5, 2015ade.sagepub.comDownloaded from

Advances in Mechanical Engineering 5
0
0.075
0.150
0.225
0.300
(m)
Contour 14.068e + 002
2.493e + 002
9.182e + 001
−6.568e + 001
−2.232e + 002
−3.807e + 002
−5.382e + 002
−6.957e + 002
−8.532e + 002
−1.011e + 003
−1.168e + 003
Pres
sure
(Pa)
(a)
0
0.075
0.150
0.225
0.300
(m)
Contour 13.783e + 002
2.485e + 002
1.187e + 002
−1.118e + 001
−1.410e + 002
−2.709e + 002
−4.007e + 002
−5.305e + 002
−6.604e + 002
−7.902e + 002
−9.200e + 002
Pres
sure
(Pa)
(b)
0
0.050
0.100
0.150
0.200
(m)
XZ
Y
Contour 13.738e + 002
2.340e + 002
9.427e + 001
−4.551e + 001
−1.853e + 002
−3.251e + 002
−4.648e + 002
−6.046e + 002
−7.444e + 002
−8.842e + 002
−1.024e + 003
Pres
sure
(Pa)
(c)
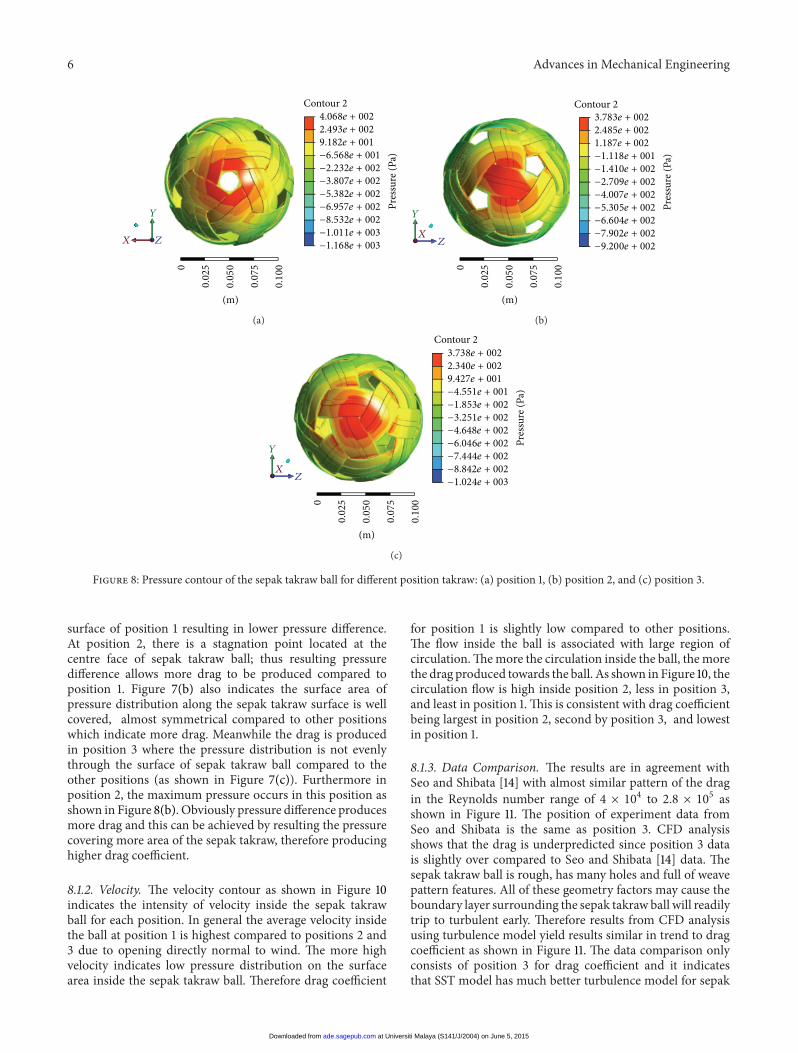
Figure 7: Pressure distribution on centre cut plane of sepak takraw at (a) position 1, (b) position 2, and (c) position 3.
symmetrical position out of all positions in the 𝑦-plane isposition 2. SST model predicts well for position 2 since thelift is the minimum range and closest to zero compared to k-epsilon model as shown in Figure 6.
8. Discussion
8.1. Drag Coefficient
8.1.1. Pressure. Drag is produced mainly due to the pressuredistribution surrounding blunt bodies [5], in this case thesepak takraw ball. The highest pressure point on the surface
area of the sepak takraw ball is at the stagnation point whichis located at the centre of the ball facing the wind direction[14]. Since at position 1 there are holes in the centre of thesepak takraw ball facing the direction of the wind, thereforethere is no stagnation point as shown in Figure 8(a). Thisresults in low drag since the drag depends on the pressuredifference between the front and back surface of the takrawball that faces the direction of the wind. Furthermore inposition 1, there is a lack of crucial surface area for maximumpressure distribution. As shown in Figure 7 in position 1although the pressure is themaximum compared to positions2 and 3, the maximum pressure is not distributed well on the
at Universiti Malaya (S141/J/2004) on June 5, 2015ade.sagepub.comDownloaded from
6 Advances in Mechanical Engineering
Contour 2
0
0.025
0.050
0.075
0.100
(m)
X Z
Y
4.068e + 002
2.493e + 002
9.182e + 001
−6.568e + 001
−2.232e + 002
−3.807e + 002
−5.382e + 002
−6.957e + 002
−8.532e + 002
−1.011e + 003
−1.168e + 003
Pres
sure
(Pa)
(a)
Contour 2
0
0.025
0.050
0.075
0.100
(m)
XZ
Y
3.783e + 002
2.485e + 002
1.187e + 002
−1.118e + 001
−1.410e + 002
−2.709e + 002
−4.007e + 002
−5.305e + 002
−6.604e + 002
−7.902e + 002
−9.200e + 002
Pres
sure
(Pa)
(b)
Contour 2
0
0.025
0.050
0.075
0.100
(m)
XZ
Y
3.738e + 002
2.340e + 002
9.427e + 001
−4.551e + 001
−1.853e + 002
−3.251e + 002
−4.648e + 002
−6.046e + 002
−7.444e + 002
−8.842e + 002
−1.024e + 003
Pres
sure
(Pa)
(c)
Figure 8: Pressure contour of the sepak takraw ball for different position takraw: (a) position 1, (b) position 2, and (c) position 3.
surface of position 1 resulting in lower pressure difference.At position 2, there is a stagnation point located at thecentre face of sepak takraw ball; thus resulting pressuredifference allows more drag to be produced compared toposition 1. Figure 7(b) also indicates the surface area ofpressure distribution along the sepak takraw surface is wellcovered, almost symmetrical compared to other positionswhich indicate more drag. Meanwhile the drag is producedin position 3 where the pressure distribution is not evenlythrough the surface of sepak takraw ball compared to theother positions (as shown in Figure 7(c)). Furthermore inposition 2, the maximum pressure occurs in this position asshown in Figure 8(b). Obviously pressure difference producesmore drag and this can be achieved by resulting the pressurecovering more area of the sepak takraw, therefore producinghigher drag coefficient.
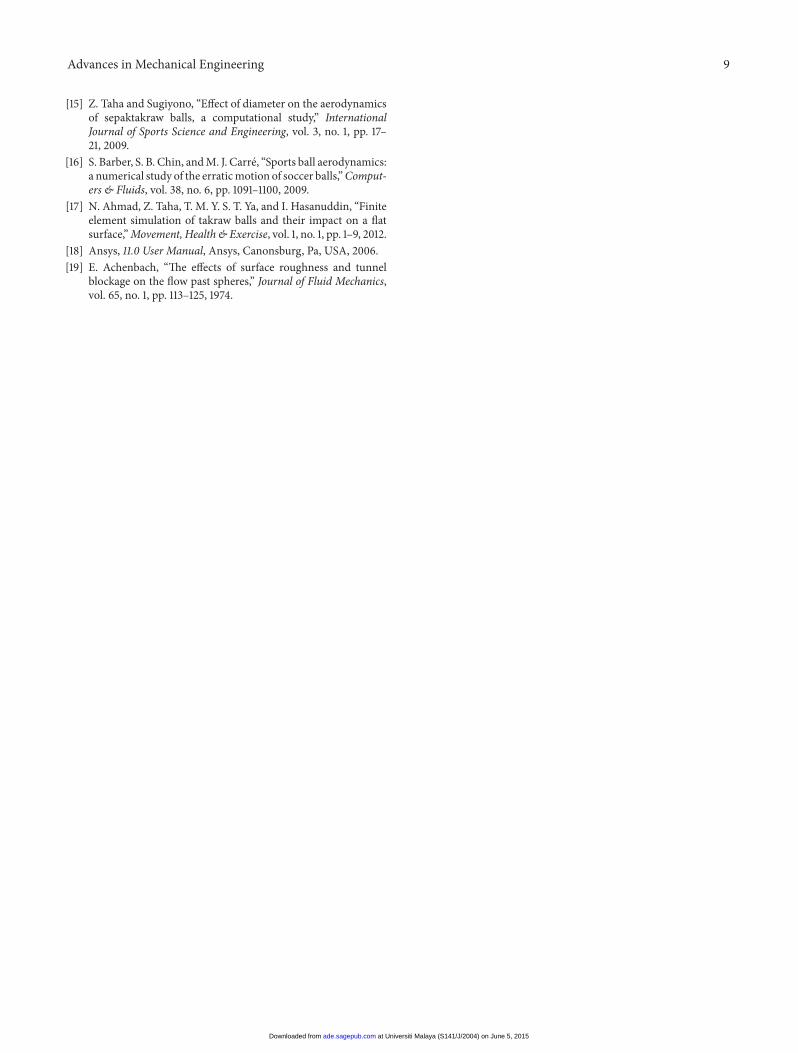
8.1.2. Velocity. The velocity contour as shown in Figure 10indicates the intensity of velocity inside the sepak takrawball for each position. In general the average velocity insidethe ball at position 1 is highest compared to positions 2 and3 due to opening directly normal to wind. The more highvelocity indicates low pressure distribution on the surfacearea inside the sepak takraw ball. Therefore drag coefficient
for position 1 is slightly low compared to other positions.The flow inside the ball is associated with large region ofcirculation.Themore the circulation inside the ball, the morethe drag produced towards the ball. As shown in Figure 10, thecirculation flow is high inside position 2, less in position 3,and least in position 1. This is consistent with drag coefficientbeing largest in position 2, second by position 3, and lowestin position 1.
8.1.3. Data Comparison. The results are in agreement withSeo and Shibata [14] with almost similar pattern of the dragin the Reynolds number range of 4 × 10⁴ to 2.8 × 10⁵ asshown in Figure 11. The position of experiment data fromSeo and Shibata is the same as position 3. CFD analysisshows that the drag is underpredicted since position 3 datais slightly over compared to Seo and Shibata [14] data. Thesepak takraw ball is rough, has many holes and full of weavepattern features. All of these geometry factors may cause theboundary layer surrounding the sepak takraw ball will readilytrip to turbulent early. Therefore results from CFD analysisusing turbulence model yield results similar in trend to dragcoefficient as shown in Figure 11. The data comparison onlyconsists of position 3 for drag coefficient and it indicatesthat SST model has much better turbulence model for sepak
at Universiti Malaya (S141/J/2004) on June 5, 2015ade.sagepub.comDownloaded from
Advances in Mechanical Engineering 7
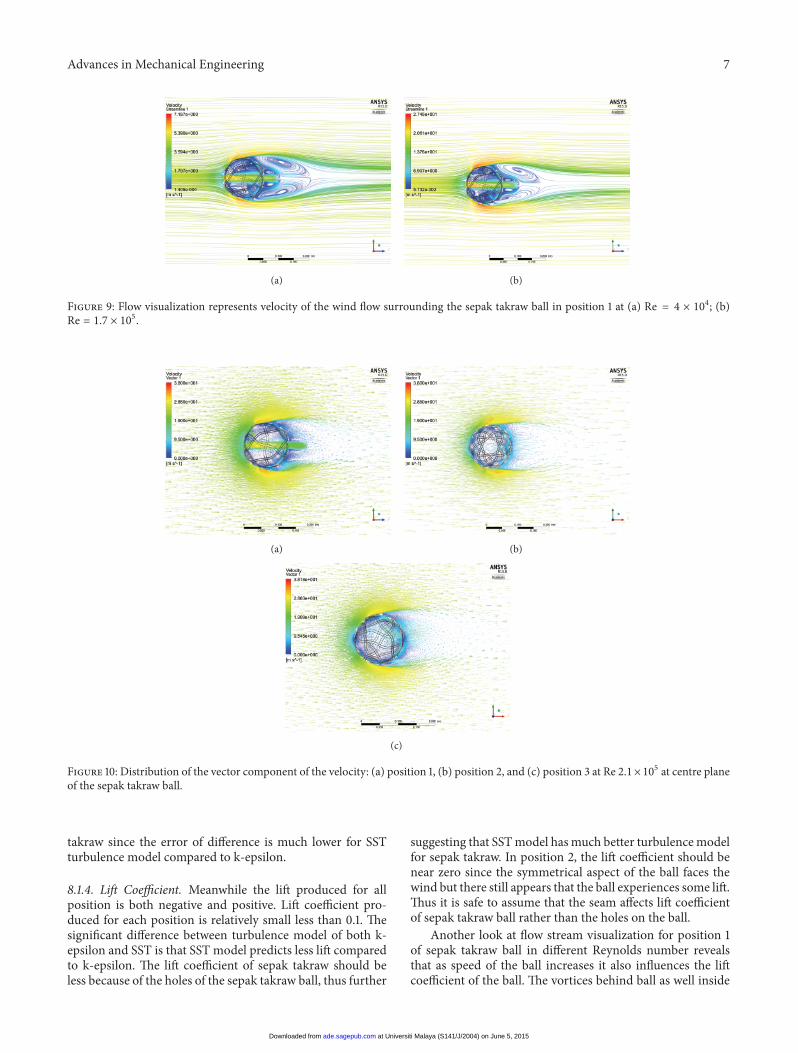
(a) (b)
Figure 9: Flow visualization represents velocity of the wind flow surrounding the sepak takraw ball in position 1 at (a) Re = 4 × 10⁴; (b)Re = 1.7 × 10⁵.
(a) (b)
(c)
Figure 10: Distribution of the vector component of the velocity: (a) position 1, (b) position 2, and (c) position 3 at Re 2.1×10⁵ at centre planeof the sepak takraw ball.
takraw since the error of difference is much lower for SSTturbulence model compared to k-epsilon.
8.1.4. Lift Coefficient. Meanwhile the lift produced for allposition is both negative and positive. Lift coefficient pro-duced for each position is relatively small less than 0.1. Thesignificant difference between turbulence model of both k-epsilon and SST is that SST model predicts less lift comparedto k-epsilon. The lift coefficient of sepak takraw should beless because of the holes of the sepak takraw ball, thus further
suggesting that SSTmodel hasmuch better turbulencemodelfor sepak takraw. In position 2, the lift coefficient should benear zero since the symmetrical aspect of the ball faces thewind but there still appears that the ball experiences some lift.Thus it is safe to assume that the seam affects lift coefficientof sepak takraw ball rather than the holes on the ball.
Another look at flow stream visualization for position 1of sepak takraw ball in different Reynolds number revealsthat as speed of the ball increases it also influences the liftcoefficient of the ball. The vortices behind ball as well inside
at Universiti Malaya (S141/J/2004) on June 5, 2015ade.sagepub.comDownloaded from

8 Advances in Mechanical Engineering
0.0
0.1
0.2
0.3
0.4
0.5
0.6
0.7
0.8
Dra
g co
effici
cent
Reynolds number
P3(SST)
1.E + 04 1.E + 05 1.E + 06
Smooth sphere (Achenbach E.)Sepak takraw experiment (Seo and Shibata)
P3 (k-epsilon)
Figure 11: Drag coefficient as a function of Reynolds number forposition 3, experimental data Seo et al. [14] and smooth sphere [19].
the ball becamemore chaotic as the speed increases as shownin Figure 9. For example in Re at 4 × 10⁴, the vorticesbehind the ball seem stable thus induce to positive lift. AsRe increases the vortices becamemore imbalanced, thereforeinducing negative lift. Although this irregular behaviour offlow contributes to varying lift either positive or negative, itgives just a little impact in the aerodynamic of sepak takrawsince the lift has only really small range from −0.022 to 0.0391for SST turbulence model.
9. Conclusion
CFD is a powerful tool for determining the drag and liftof a sepak takraw ball mode given within certain limitationsuch as computational resource and software capabilities.Thedrag coefficient for the sepak takraw ball modelled in AnsysCFX for several positions was found to be in the range of0.424 to 0.523 for velocities varying from 5 to 35m/s. Thedrag force shows consistency as the velocity increases forall positions. The turbulence model suitable for predictingthe drag coefficient for the sepak takraw was SST model.However lift force shows a varying behaviour value especiallyfor positions 1 and 3 due to the asymmetrical shapes of eachposition. Furthermore as velocity increases significant flowvisualization effect can be observedwhere the vortices behindthe sepak takraw ball became more irregular consistent withthe change in lift coefficient. The lift coefficient values varyfrom −0.105 to 0.116 for the same velocity range. It is clearthat the different position of the ball orientations influencesthe aerodynamic performance of this complex structure ofsepak takraw ball as Reynolds number increases. The highestdrag coefficient is recorded at position 2 and position 3 whereboth have the same stagnation point in the front area of themodel compared to position 1. Furthermore the positions ofholes at all positions and the seam roughness contributedsignificantly to the drag and lift parameters.
Conflict of Interests
The authors declare that there is no conflict of interestsregarding the publication of this paper.
Acknowledgments
Grateful thanks go to the University of Malaya for thefinancial support given to this project under the researchgrant of the Postgraduate Research Fund (PG079-2013B) andthe “Program Rakan Penyelidikan UM” (CG036-2013).
References
[1] R. D. Mehta, “Aerodynamics of sports balls,” Annual Review ofFluid Mechanics, vol. 17, pp. 151–189, 1985.
[2] P. W. Bearman and J. K. Harvey, “Golf Ball Aerodynamics,”Aeronaut Q, vol. 27, no. 2, pp. 112–122, 1976.
[3] L. W. Alaways and M. Hubbard, “Experimental determinationof baseball spin and lift,” Journal of Sports Sciences, vol. 19, no. 5,pp. 349–358, 2001.
[4] T. Asai and K. Kamemoto, “Flow structure of knuckling effectin footballs,” Journal of Fluids and Structures, vol. 27, no. 5-6, pp.727–733, 2011.
[5] R. D.Mehta and J.M. Pallis, “The aerodynamics of a tennis ball,”Sports Engineering, vol. 4, no. 4, pp. 177–189, 2001.
[6] F. Alam, H. Chowdhury, H. Moria et al., “Aerodynamics ofcontemporary FIFA soccer balls,” Procedia Engineering, vol. 13,pp. 188–193, 2011.
[7] M. Passmore, D. Rogers, S. Tuplin, A. Harland, T. Lucas, andC. Holmes, “The aerodynamic performance of a range of FIFA-approved footballs,” Proceedings of the Institution of MechanicalEngineers, Part P: Journal of Sports Engineering and Technology,vol. 226, no. 1, pp. 61–70, 2011.
[8] M. J. Carre, S. R. Goodwill, and S. J. Haake, “Understanding theeffect of seams on the aerodynamics of an association football,”Proceedings of the Institution of Mechanical Engineers C: Journalof Mechanical Engineering Science, vol. 219, no. 7, pp. 657–666,2005.
[9] C. Baker, “A unified framework for the prediction of cricketball trajectories in spin and swing bowling,” Proceedings ofthe Institution of Mechanical Engineers P: Journal of SportsEngineering and Technology, vol. 227, no. 1, pp. 31–38, 2013.
[10] R. D. Mehta and J. M. Pallis, Sports Ball Aerodynamics: Effectsof Velocity, Spin and Surface Roughness, Minerals, Metals andMaterials Society/AIME, Materials and Science in Sports, 2001.
[11] S. J. Haake, S. R. Goodwill, and M. J. Carre, “A new measure ofroughness for defining the aerodynamic performance of sportsballs,” Proceedings of the Institution ofMechanical Engineers PartC: Journal of Mechanical Engineering Science, vol. 221, no. 7, pp.789–806, 2007.
[12] F. Alam, H. Chowdhury, M. Stemmer, Z. Wang, and J. Yang,“Effects of surface structure on soccer ball aerodynamics,”Procedia Engineering, vol. 34, pp. 146–151, 2012.
[13] S. Barber, S. J. Haake, and M. Carre, “Using CFD to understandthe effects of seam geometry on soccer ball aerodynamics,”TheEngineering of Sport, vol. 6, pp. 127–132, 2006.
[14] K. Seo and M. Shibata, “Aerodynamic characteristics of a sepaktakraw ball on its face orientation,” inThe Impact of technologyon Sport III, pp. 372–382, 2009.
at Universiti Malaya (S141/J/2004) on June 5, 2015ade.sagepub.comDownloaded from
Advances in Mechanical Engineering 9
[15] Z. Taha and Sugiyono, “Effect of diameter on the aerodynamicsof sepaktakraw balls, a computational study,” InternationalJournal of Sports Science and Engineering, vol. 3, no. 1, pp. 17–21, 2009.
[16] S. Barber, S. B. Chin, andM. J. Carre, “Sports ball aerodynamics:a numerical study of the erraticmotion of soccer balls,”Comput-ers & Fluids, vol. 38, no. 6, pp. 1091–1100, 2009.
[17] N. Ahmad, Z. Taha, T. M. Y. S. T. Ya, and I. Hasanuddin, “Finiteelement simulation of takraw balls and their impact on a flatsurface,”Movement, Health& Exercise, vol. 1, no. 1, pp. 1–9, 2012.
[18] Ansys, 11.0 User Manual, Ansys, Canonsburg, Pa, USA, 2006.[19] E. Achenbach, “The effects of surface roughness and tunnel
blockage on the flow past spheres,” Journal of Fluid Mechanics,vol. 65, no. 1, pp. 113–125, 1974.
at Universiti Malaya (S141/J/2004) on June 5, 2015ade.sagepub.comDownloaded from