cfe fd model solutions - member | soa · cfe fd spring 2016 solutions page 3 1. continued (b) (i)...
TRANSCRIPT
CFE FD Spring 2016 Solutions Page 1
CFE FD Model Solutions
Spring 2016
1. Learning Objectives: 1. The candidate will understand how a business enterprise funds its activities with
considerations for its business model, and the cost and constraints of the sources
of capital.
2. The candidate will understand how an enterprise’s structure and policies allow its
management to prioritize and select among projects or business activities that are
competing for scarce capital resources especially when opposing factors are key
decision criteria.
Learning Outcomes:
(1b) Evaluate capital budgeting approaches and structure policy for insurance and non-
insurance organizations.
Assess whether the risky return from a new project or ongoing business is
sufficient to employ investor capital using key factors, market drivers
(including return on employed capital such as NPV, IRR and payback period).
Design real options that allow an otherwise non-viable project to get funding.
Compare and contrast the methods of capital allocation towards the goal of
optimization for best possible value-creation.
(2d) Evaluate the capital efficiency of using reinsurance or securitizations for a given
risk.
Sources:
F-119-15 McKinsey, Capital Management: Banking’s New Imperative
F-113-14 Trainer & Cummins, Securitization, Insurance, and Reinsurance
Case Study
Commentary on Question:
Candidates generally did well on this question. In order to receive full credit, candidates
had to fully describe the methods rather than just identifying them. Some candidates did
not receive full credit because they did not describe the buffer added in the going-
concern method.

CFE FD Spring 2016 Solutions Page 2
1. Continued
Solution:
(a)
(i) Describe two methods that can be used to align regulatory capital and
economic capital.
(ii) Recommend one of the methods from (i) for Big Ben to use. Support your
recommendation.
Commentary on Question:
Candidates generally did well on this question. In order to receive full credit for
part i, candidates needed to fully describe the methods rather than just identifying
them. Some candidates did not receive full credit because they did not describe
the buffer added in the going-concern method.
For part ii, candidates needed to describe pros and cons of both methods and
make a recommendation in order to receive full credit.
(i) Scale Economic Capital to Regulatory Capital – Use a factor to convert
between the capital regimes
Going Concern Management – Use regulatory capital as a minimum and
add a buffer to reduce the risk of falling below certain trigger points to an
acceptable level (primarily the risk of breaching Tier 1 minimum capital
targets)
(ii) Recommendation – Use the going concern method
The scaling method is simpler to implement, but does not quantify the
capital buffer needed on top of the regulatory minimum. The economic
capital level typically only considers the risk of default, leaving the
company vulnerable to the volatility of risk-weighted assets forcing the
bank below minimum regulatory capital requirements.
Big Ben should use the going concern method in order to capture the
diversification effects of its various business lines. The going concern
method is more involved than the scaling method, but reflects the fact that
management is concerned with more events than just the risk of default.
This framework requires a more granular measurement of capital needs,
but presents a more holistic picture of the capital requirement. The
additional insights from this method justify the additional cost and
implementation effort involved with the going concern model.

CFE FD Spring 2016 Solutions Page 3
1. Continued
(b)
(i) Assess the capability of Big Ben’s current budget process for allocating
the appropriate amount of capital to the above items. Justify your answer.
(ii) Recommend possible improvements to Big Ben’s capital budget allocation
process.
Commentary on Question:
Many candidates did well on this question. Some candidates discussed the capital
needs of the different projects without describing how Big Ben’s current budget
process would or would not allocate an appropriate amount of capital.
(i) Big Ben’s current budget allocation process would not allocate the
appropriate amount of capital to each project. Big Ben’s current budget
process uses the same hurdle rate for all divisions, without considering the
risks or growth opportunities associated with different projects. The
current process would allocate too much capital to higher risk projects,
and could ignore projects that create economic value. The four projects
above have different risks and growth opportunities, and using the same
hurdle rate would result in a poor allocation.
(ii) Improvements:
Big Ben should use consistent metrics at the project level to determine
where to allocate capital, taking into account the risks of each project
Big Ben should consider risk-adjusted return on capital, revenue
growth, and the size of the business
Big Ben should factor in the through-the-cycle performance of the
portfolio/project
Big Ben should invest in business with a return above the hurdle rate,
sell business with a return below its cost of capital, and keep (but not
invest in) business earning between the cost of capital and the hurdle
rate.
(c) Recommend whether Darwin should follow Big Ben’s CFO’s suggestion. Justify
your recommendation.
Commentary on Question:
Many candidates did well on this question. To earn full credit, candidates
generally had to describe Darwin’s liabilities and why reinsurance or
securitization would be appropriate for addressing these liabilities.

CFE FD Spring 2016 Solutions Page 4
1. Continued
Darwin should not follow the CFO’s suggestion. Darwin’s products are generally
term and universal life insurance and annuities, which generally have small,
numerous, and independent risks. With these risks, the amount of capital required
for the reinsurer is generally small, leading to a low capital charge and a price of
insurance that’s close to the expected loss plus the expense loading. Securitization
generally is more appropriate to transfer risks that are highly correlated and highly
skewed risks that are uncorrelated with the market. Given the moderate size of
Darwin and the nature of Darwin’s risks, reinsurance would be a less costly
option than securitization.

CFE FD Spring 2016 Solutions Page 5
2. Learning Objectives: 3. The candidate will understand how and when to apply various stochastic
techniques to situations which have uncertain financial outcomes.
4. The candidate should understand how and when to apply various advance
techniques to evaluate risk or uncertainty in any business enterprise especially
non-insurance organizations.
Learning Outcomes:
(3c) Recommend the use of techniques to reduce the computational demand when
applying stochastic methodology.
(3e) Interpret the results of a given application of stochastic modeling and the impact
of the chosen calibration process used.
(4a) Compare and contrast the approaches for their ability to be calibrated effectively,
to provide interpretable results and to give insights on the underpinning asset
management strategy.
(4d) Explain how to quantify risk when there is limited data.
Sources:
Korn, Monte Carlo Methods and Models in Finance and Insurance, Ch 3, Sections 3.1,
3.2, 3.3.1, and 3.3.2 to p72
Korn, Monte Carlo Methods and Models in Finance and Insurance, Ch 8
Hubbard, How to Measure Anything, Ch 4
Hubbard, How to Measure Anything, Ch 6
Hubbard, How to Measure Anything, Ch 8
Hubbard, How to Measure Anything, Ch 9
Hubbard, How to Measure Anything, Ch 10
Commentary on Question:
Candidates performed poorly on this question. The majority of the question tests
fundamental statistical concepts, e.g. confidence interval, probability and yet most
candidates could not compute the calculations correctly.
CFE FD Spring 2016 Solutions Page 6
2. Continued
Solution:
(a) Estimate the 90% confidence interval for the true mean purchase rate using the
simple methodology in Douglas Hubbard’s, How to Measure Anything.
Commentary on Question:
Successful candidates used the simple “no math” approach to calculate the
confidence interval.
Distance from 3rd smallest to 3rd largest is an easy way to estimate 90% C.I.
3rd smallest - 70 cents
3rd largest - 87 cents
So rough 90% confidence interval using a short cut method is 70-87 cents
(b) Calculate the 90% confidence interval for true mean of the purchase rate using the
same 11 years of data.
Commentary on Question:
Candidates did poorly on this section. Common errors included:
Some candidates incorrectly used the t-distribution. Question states the data
is normally distributed and population variance is given, therefore the t-
distribution should not be used.
Some candidates incorrectly adjusted the population variance to be sample
variance.
Some candidates did not realize confidence interval was dependent on number
of data points, and hence did not divide the population variance by number of
data points.
Several candidates would have benefited from performing a reasonableness test
on their responses.
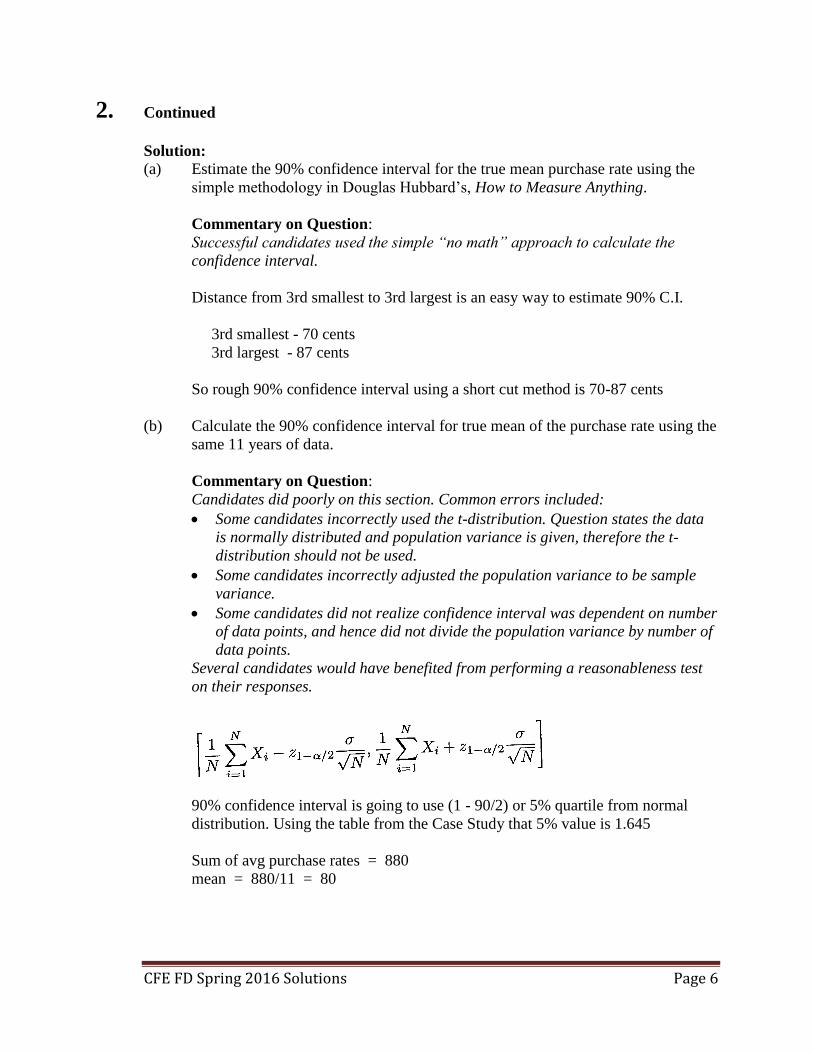
90% confidence interval is going to use (1 - 90/2) or 5% quartile from normal
distribution. Using the table from the Case Study that 5% value is 1.645
Sum of avg purchase rates = 880
mean = 880/11 = 80

CFE FD Spring 2016 Solutions Page 7
2. Continued
If variance is 150, then standard deviation is 12.25
Plug & Chug formula = 80 +/- 1.645 x (12.25/√11)
lower bound 73.93
upper bound 86.07
So rough 90% confidence interval is calculated as 73.9-86.1 cents
(c) Determine the probability that the true average purchase rate is less than 75 cents.
Show your work.
Commentary on Question:
Candidates did poorly on this section.
Use variance/standard deviation and mean that were calculated in part b or were
given.
Plugging into the formula 75 = 80 - x[√150/√11]
Rearranging x = 5 * √11/√150
x = 1.354
From standard normal table, z-score is 0.9115
Therefore, probability is (1 - 0.9115) or 8.85%
(d) Recalculate Blue Ocean’s probability of a successful program. Show your work.
Commentary on Question:
Candidates in general did well on this section. Most applied Bayes’ Theorem to
get their answer. Candidates who had an error in part c but made consistent use
of that information received credit.
Formula Pr (success) = Pr (success| ≥ 75¢) Pr (≥ 75¢) + Pr (success| < 75¢) Pr ( <
75¢)
= (90%) x (1 - 0.0885) + (25%) x (0.0885)
= 0.9 x 0.9115 + .25 x 0.0885
= 0.8204 + 0.0221
= 0.8425 or 84
(e) Provide three reasons why Brown’s 90% confidence interval might not represent
a 90% probability.
Commentary on Question:
Candidates performed satisfactorily on this section. Better candidates explained
their “reasons.”

CFE FD Spring 2016 Solutions Page 8
2. Continued
Acceptable answers include:
Most people are not really risk neutral. That makes them value losses greater
than the benefits of positive outcomes. For Brown, it is unlikely that his
confidence interval is symmetrical.
Brown could have some "expectancy bias" in making his prediction. He
wants the solar power proposal to work so he could unconsciously have
viewed the data to support this result.
Not everyone adheres to a Bayesian interpretation of probability which treats
probability as an expression of uncertainty. For example frequentists,
wouldn't view it this way.
Estimators that have not been "calibrated" tend to have less precision in their
estimates. Either they are under or over-confident in their ability to estimate
true probabilities. Fortunately, this skill can be learned.
CFE FD Spring 2016 Solutions Page 9
3. Learning Objectives: 3. The candidate will understand how and when to apply various stochastic
techniques to situations which have uncertain financial outcomes.
4. The candidate should understand how and when to apply various advance
techniques to evaluate risk or uncertainty in any business enterprise especially
non-insurance organizations.
Learning Outcomes:
(3a) Explain the mathematical foundation of stochastic simulation.
(4a) Compare and contrast the approaches for their ability to be calibrated effectively,
to provide interpretable results and to give insights on the underpinning asset
management strategy.
(4d) Explain how to quantify risk when there is limited data.
(4f) Quantify the probability of risks taken in a given business or project, their
outcome as losses/gains, and their potential impact on Employed Capital.
Sources:
Hubbard, How to Measure Anything, ch. 5-7
Berk and Demarzo, Corporate Finance, ch. 30
Commentary on Question:
This question tested the ability of candidates to express uncertainty through the use of
probability, identify reasons for using Monte Carlo simulation, implement Monte Carlo
in practice and explain the value of information.
Solution:
(a) Identify three methods to improve probability calibration appropriate for Frenz.
Commentary on Question:
Candidates were generally able to identify at least two methods to improve
probability calibration. One common response was repetition and feedback,
which would not be appropriate for Frenz since they don’t have the ability to set
up an experiment on market-based coffee prices in Vietombia where repetition
and feedback could be utilized.
Reverse the Anchoring Effect.
Equivalent Bets.
Avoid Anchoring.

CFE FD Spring 2016 Solutions Page 10
3. Continued
(b) Explain how two of the three methods from (a) can be used to estimate the 95th
percentile of potential losses.
Commentary on Question:
Candidates were usually able to explain the chosen calibration methods from part
(a), but often did not connect it to the 95th percentile of potential losses.
Equivalent Bets - Individual would be indifferent to winning X dollars if the loss
on any given sample is less than the 95th percentile of losses and spinning a dial
(or some other game of chance) where they win X dollars 95% of the time.
Reverse the Anchoring Effect - Start with an extremely wide range and then
eliminate extreme or absurd potential values until you believe that the 5% of most
extreme losses have been accounted for.
(c)
(i) Briefly describe Monte Carlo Simulation.
(ii) Evaluate the appropriateness of Monte Carlo Simulation for estimating the
risk of loss from coffee price fluctuations.
Commentary on Question:
Most candidates were able to describe Monte Carlo to various extents, and some
correctly identified reasons why it was appropriate for use in estimating the risk
of loss from coffee price fluctuations.
(i) Monte Carlo simulation is the generation of a large number of scenarios
based on probabilities for inputs. For each scenario, a specific value is
generated from a random number generator and used to calculate each of
the unknown variables. The values of these variables then go into a
formula to compute an output for that scenario. This process is usually
repeated for thousands of iterations, forming a distribution of potential
results.
(ii) Monte Carlo is appropriate because as soon as we start adding,
multiplying, etc. different distributions together, the problem we are trying
to solve can become unsolvable or have no solution. By simulating these
results thousands of times, we can estimate the probabilities and thus
distribution of the results we are measuring.
(d) Identify the least profitable of the five simulations above. Show your work.

CFE FD Spring 2016 Solutions Page 11
3. Continued
Commentary on Question:
Performance on this question was bifurcated, with some candidates doing very
well while others struggled to use the cumulative normal function or plug back
some of the variables into the earnings equation.
Variables in the earnings equation for simulations 3 and 5 are solved for in the
table below using the cumulative distribution function values provided in the
question:
Simulation ER SCP OR
3 5+N-1(.1587)=4 0.6*4+N-1(.9918)=4.80 U-1(.6)=2*0.6=1.2
5 5+N-1(.758)=5.7 0.6*5.7+N-1(.3085)=2.92 U-1(.1)=2*0.1=0.2
Earnings equation is Earnings = (5*(.2*ER)-SCP-OR)*(10*(10-P)), meaning that
variables solved for above along with assumed Price of 5 need to be input into the
equation for both simulation 3 and 5.
Earnings (sim 3) = (5*(.2*4)-4.8-1.2)*(10*(10-5)) = -100
Earnings (sim 5) = (5*(.2*5.7)-2.92-.2)*(10*(10-5)) = 129
The earnings for simulation 3 of -100 is the lowest of all simulations.
(e)
(i) Describe how the components of the earnings equation might change.
(ii) Explain the impact on both average earnings and volatility of earnings.
Commentary on Question:
Almost all candidates were able to identify one or two components of the earnings
equation that might change, although many missed that Vietombia pegs their
currency and thus volatility in ER could decrease. The explanation of impact on
earnings was generally pretty good based on the components identified in part (i)
of the question.

CFE FD Spring 2016 Solutions Page 12
3. Continued
(i) Frenz is consolidating ER in a country that pegs its currency at below
market rates. This may cause the constant term in the ER formula to
change and would either eliminate or reduce the variance term. This
change in ER would also reduce volatility of supply-chain prices (SCP),
which depends on price volatility of suppliers (Frenz will be vertically
integrating in Vietombia). Operational risk (OR) may increase as
Vietombia still does not have a modern banking system. Demand (D)
could increase if the quality of the product manufactured by Frenz
improves.
(ii) Pegging of ER at below market rates and corresponding decrease in SCP
should increase average earnings while reducing volatility. However, the
increase in size and volatility of OR will have the opposite effect, reducing
average earnings while increasing earnings variability. If D does go up,
average earnings will improve.
(f)
(i) Explain why further research should begin by focusing on operational risk.
(ii) Explain why measuring operational risk may appear difficult to Frenz’s
risk managers.
(iii) Identify two operational risks (Case Study 4.3, Exhibit 2) that would
increase due to entering the Vietombia production deal. Support your
answer.
Commentary on Question:
Candidates did well on this question, although many did not fully integrate the
value of information concept into their responses.
(i) Beginning with operational risk makes sense because additional
uncertainty reduction becomes more expensive and less beneficial as
uncertainty is reduced or approaches zero. Uncertainty tends to fall away
quickly at the beginning of measurement. Since operational risk has yet to
be measured significantly, there is likely a high benefit and low costs to
getting a little information on it.
(ii) It may appear difficult to measure operational risk because many people
believe when you have a lot of uncertainty about something, you need a
lot of information to reduce uncertainty significantly, but in reality the
opposite is true.

CFE FD Spring 2016 Solutions Page 13
3. Continued
(iii) One operational risk that would increase is Personnel issues. It may be
more difficult to convince personnel to move to Vietombia than other
Frenz locations and likewise more difficult to hire and keep good local
Vietombian personnel because Frenz hasn't operated in that country before
and doesn't know the employment culture. Also, the extent and terms &
conditions of negotiations with the Vietombian government is an
operational risk that would increase. Frenz is negotiating with the
Vietombian government to get an exclusive production agreement, but this
might be less enforceable with the unstable government of Vietombia than
normal contract negotiations in developed countries.

CFE FD Spring 2016 Solutions Page 14
4. Learning Objectives: 5. The candidate will understand how to identify and recommend appropriate risk
assessment and monitoring techniques for financial risk management.
Learning Outcomes:
(5b) Describe the types of models and the sources of model risk.
(5c) Assess the methods and process for quantifying and managing model risk within
any business enterprise.
Sources:
Dowd, Ch. 16, Korn_Ch. 5
Commentary on Question:
Commentary listed underneath question component.
Solution:
(a)
(i) Define model risk.
(ii) Label each of the three principal risk models (I, II, and III above) as a
fundamental, descriptive, or statistical model.
Commentary on Question:
Most candidates did well on part i. The most common mistake was providing a
narrow definition, for example, only describing assumption-setting risk or
implementation risk, or not describing how the actions would specifically affect
the output or lead to incorrect management decisions.
Most candidates did poorly on part ii. About half did not receive any credit.
(i) Model risk is the risk of error in our estimated risk measures due to
inadequacies in the risk models.
(ii) The Credit Risk model is Descriptive because the credit scores use a
simplified story instead of explicitly modeling probable cash flows.
Similarly, the Interest Rate model is Descriptive because it uses durations.
Equity model for hedging program is Fundamental as it directly ties
outputs to inputs with appropriate relationships.

CFE FD Spring 2016 Solutions Page 15
4. Continued
(b) Assess the following for each principal risk model. Include the impact on
satisfying risk appetite statement provisions.
(i) Missing risk factors
(ii) Misspecified relationships
Commentary on Question:
Most candidates did well on part i, particularly on credit risk and interest rate
risk. Fewer candidates did well on equity risk.
Most candidates did poorly on part ii on interest rate risk and equity risk. A
common mistake was to comment further upon missing risk factors, without tying
the company’s practice in these areas with the company’s stated goals.
(i)
a. Credit Risk- Missing risk factors include not including sub-category
ratings (i.e. + or -); not accounting for systemic risk, that is the risk
that defaults may be highly correlated during adverse financial events;
or ignoring sector-descriptions, that is a financial bond may exhibit
different behavior than a municipal or industrial bond.
b. Interest Rate Risk- Does not account for convexity; does not account
for key-rate durations.
c. Equity Risk- Does not account for policyholder behavior.
(ii)
a. Credit Risk- Linear function of the company’s credit rating system
does not align with highly non-linear function of default risk and
impact on capital and earnings for each credit rating.
b. Interest Rate Risk- Assets and Liabilities are not equal due to presence
of Surplus. Being duration-matched does not mean the company’s
Surplus position is insulated. Dollar-weighted Surplus should be
matched.
c. Equity Risk- Hedging economic factors will not be the same as
hedging STAT or GAAP capital or earnings. This means the AA
statutory requirements may be understated, thereby threatening the
financial rating.
(c) Evaluate Tim’s plan with respect to model risk.
Commentary on Question:
Most candidates did poorly on part-c. Very few recognized that it was a
programming risk.

CFE FD Spring 2016 Solutions Page 16
4. Continued
The step size is very small (10^-6), and the precision may lead to rounding errors
in the calculation. This form of model risk is a programming problem.
(d) Propose two practices to manage specific model risks at Darwin while not
disrupting Darwin’s strategic focus. Support your proposals.
Commentary on Question:
Most candidates did well on this question. A common mistake, however, was not
providing enough support for the recommendations. Some candidates simply
listed two improvements, rather than defending their recommendation by tying it
sufficiently to the model risk it was intended to address. Another common mistake
was to try to address programming risk or other technical modeling
improvements, rather than recommending approaches to reduce the risk of the
current model.
(i) Documentation- The model assumptions, process, and limitations should
be well-documented. This way, the model can be better-understood by
management and/or auditors, as well as reduce any key-person risk by
making the model easier to hand-off.
(ii) Model Ownership- The modeling should be owned by a centralized,
independent modeling team that is independent from the business line.
This will ensure separation of duties and reduce risk of model
manipulation or agency risk.
(iii) Validation- The model assumptions should be validated against historical
data, specifically the approach to modeling credit risk with the simplified
method the company is employing. The projection of default rates under
this approach should be compared to historical data for reasonableness and
possible adjustment.
(iv) Model Run Frequency- Risk factor calculation is occurring quarterly, but
hedges are updated weekly. The model could be run more frequently to
support the hedging team.

CFE FD Spring 2016 Solutions Page 17
5. Learning Objectives: 5. The candidate will understand how to identify and recommend appropriate risk
assessment and monitoring techniques for financial risk management.
Learning Outcomes:
(5d) Design an appropriate stress-testing process and evaluate its limitations for a
given risk position.
Sources:
Dowd, Measuring Market Risk 2nd ed, Ch 16
Korn, Monte Carlo Methods and Models in Finance and Insurance, Ch 5
Case Study
Commentary on Question:
This question was designed to test candidates' familiarity with various forms of stress
testing. No formulas or calculations were involved. Instead, candidates were required to
provide qualitative statements and judgments. Overall, candidates performed well,
answering most of the parts. Points were missed for not drawing comparisons or for not
designing a scenario in relation to the case study.
Solution:
(a) Compare mechanical stress testing with scenario analysis.
Commentary on Question:
Definitions for each were not sufficient. Points were lost for not comparing the
two. Often only one comparison was made when two comparisons were necessary
for full credit.
Scenario analysis uses hypothetical scenarios while mechanical stress testing uses
mathematically defined possibilities to determine the most damaging combination
of events and the loss it would produce.
Mechanical stress tests can give some indication of the likelihood. Scenario
analysis does not.
(b)
(i) Design a single stress test using scenario analysis to measure Frenz’s
exposure to currency, liquidity, and supply chain risk in Vietombia.
(ii) Identify the type of scenario used in the single stress test.

CFE FD Spring 2016 Solutions Page 18
5. Continued
Commentary on Question:
Candidates were asked to design one scenario. However, credit was awarded for
defining three independent scenarios. The scenario needed to appropriately tie to
each risk and have relevance to Frenz. Candidates often got part (ii) right.
(i) A political revolution occurs in Vietombia, resulting in:
the Rubiaceae is forced off its peg, causing the exchange rate to fluctuate
unexpectedly – currency risk
cost of doing business in Vietombia rises and credit conditions deteriorate,
forcing Frenz to use available cash to pay suppliers draining capital –
liquidity risk
facilities and supplies are repatriated by the revolutionary government –
supply chain risk
(ii) The political revolution is a hypothetical one-off event.
(c) Critique the COO's statements. Support your critique.
Commentary on Question:
Many candidates effectively made one to two critiques. At least three critiques
were required for full credit. Some candidates mistakenly said that stress testing
is not a coherent risk measure.
The COO is wrong, Stress testing is a coherent risk measure.
The COO is correct, VaR is not a coherent risk measure.
The COO is correct, VaR and ES are good for determining the probability of a
loss.
(d) Critique the CRO's statements. Support your critique.
Commentary on Question:
For full credit, candidates needed to make two correct critiques of the CRO's
statement and provide supporting arguments for those critiques. Candidates
tended to only focus on the first or second of his statements but not both.
It is not true that VaR and ES give a good "big picture" view.
Stress testing can give more information about losses in the tail than VaR and
ES.
It is true that stress tests can require a large amount of computational power.
Advances in technology are removing this problem.

CFE FD Spring 2016 Solutions Page 19
5. Continued
(e) Identify three common pitfalls of scenario analysis.
Commentary on Question:
Very few candidates received credit for this part. Most candidates critiqued the
use of scenario analysis. Correct responses identified the reasons for failure to
utilize scenario analysis effectively.
No buy-in from senior management.
Evaluated by managers who lack authority to take remedial action.
"What-if" scenarios may be confused for worst case scenarios.

CFE FD Spring 2016 Solutions Page 20
6. Learning Objectives: 2. The candidate will understand how an enterprise’s structure and policies allow its
management to prioritize and select among projects or business activities that are
competing for scarce capital resources especially when opposing factors are key
decision criteria.
Learning Outcomes:
(2a) Evaluate how the legal form of an organization, corporate governance and/or
compensation dynamics impact decision-making on projects or business
activities.
Sources:
Jonathan Berk and Peter Demarzo, Corporate Finance, Third Edition, Ch 1: Corporation
Jonathan Berk and Peter Demarzo, Corporate Finance, Third Edition, Ch 29 Corporate
Governance
Case Study
Commentary on Question:
Most candidates showed that they understood the differences between partnerships and
U.S. corporations. Most candidates also demonstrated knowledge about the role of
corporate governance. One stumbling block that several candidates had was confusing
the Sarbanes-Oxley Act with the Dodd-Frank Act in part C.
Solution:
(a) Compare U.S. corporations and partnerships in terms of:
(i) Ownership structure
(ii) Owners’ liability
(iii) Tax implications
(iv) Organization longevity

CFE FD Spring 2016 Solutions Page 21
6. Continued
Partnership US Corporation
Ownership Structure Owned and run by more
than one person
Legally defined,
artificial being, separate
from its owners
Owners’ Liability All partners are liable
for the firm’s debt
Each owner has limited
liability
Tax Implication Profits are taxed once Profits are taxed twice
Organization Duration Ends on death or
withdrawal of any
partner
Perpetual life
(b) Describe the role of corporate governance.
Commentary on Question:
Many candidates simply defined corporate governance. The best answers also
described the role of corporate governance in an organization.
Corporate governance refers to the system of controls, regulations and incentives
designed to prevent fraud. The role of corporate governance is to mitigate the
conflict of interest that results from the separation of ownership and control
without unduly burdening managers with the risk of the firm.
(c)
(i) Describe the requirements under the Dodd-Frank Act that are meant to
strengthen corporate governance.
(ii) Recommend four changes to Frenz’s board structure (Case Study 4.3,
Exhibit 1) to enhance the effectiveness of corporate governance. Justify
your recommendations.
Commentary on Question:
Below are examples of acceptable answers. One common answer for (ii) that was
not given credit was a recommendation to add a Risk Committee to the Board.
(i) The Dodd-Frank Act requires that firms:
Choose independent compensation committee
Allow long-term shareholders to nominate directors
Allow shareholders to vote on executive pay and golden parachutes
Establish clawback provision
Disclose how executive pay compares with that of the median
employee as well as how it is related to the firm's financial
performance

CFE FD Spring 2016 Solutions Page 22
6. Continued
(ii)
The Board is not independent as more than half of the Board are inside
and grey directors: two are Board members of the holding company and
five are executive officers of Frenz
Recommendation: The Board should contain more independent directors
so that the Board can act and make decisions objectively.
The Chair of the Compensation Committee is Gilroy Clyde who is CEO of
the holding company; Olivier Collignon is a committee member and he's a
director of the holding company --> does not meet the requirement under
Dodd-Frank Act
Recommendation: All members of the Compensation Committee should
be independent.
The Governance and Nominating Committee is led by the current CEO of
Frenz and the rest of the committee members are inside directors
Recommendation: Most members of the Governance and Nominating
Committee should be independent directors.
Audit Committee is led by the current CFO of Frenz --> will impact the
audit process, not independent
Recommendation: The Chair of the Audit Committee should be an
independent director.
Most of the directors have been with the Board for a long time --> higher
chance of being "captured"
Recommendation: The Board should have more frequent elections and
change of directors.

CFE FD Spring 2016 Solutions Page 23
7. Learning Objectives: 3. The candidate will understand how and when to apply various stochastic
techniques to situations which have uncertain financial outcomes.
Learning Outcomes:
(3a) Explain the mathematical foundation of stochastic simulation.
(3e) Interpret the results of a given application of stochastic modeling and the impact
of the chosen calibration process used.
(3g) Explain what risk exposures are or are not identified with a given risk metric and
which metric should be used for a specific risk (e.g., instrument, exposure or
portfolio).
Sources:
Korn, Monte Carlo Methods and Models in Finance and Insurance, Ch 8
Commentary on Question:
Commentary listed underneath question component.
Solution:
(a) Critique each of Violet’s assertions. Support your answers.
Commentary on Question:
Candidates performed satisfactorily in this section. A handful of candidates,
however, did not support their answers as requested by the question. A common
response that cannot receive full credit is “Violet’s assertion is incorrect because
semi-variance of a random variable can be estimated via simulation”.
I. This statement is incorrect.
The semi variance is defined as E{max[0, X-E(X)]2} and though unlike
the variance, this cannot be computed in one step, one can proceed as
follows
1) Simulate N=N1 + N2. Samples X1, …., XN and estimate the mean E(X)
using N1 samples by X = Σi≤ N1 Xi/N
2) Now compute the semi-variance via Σi> N1 max[0,Xi-X]2/ N2
II. This statement is correct.
Let ρ be a risk measure then the convexity property is: ρ(λX+(1-λ)Y) ≤
ρ(λX) + ρ((1-λ)Y), λ є [0,1], whereas the positive homogeneity property
is: ρ(λX) = λρ(X), λ > 0.

CFE FD Spring 2016 Solutions Page 24
7. Continued
Choose λ=1/2 to get ρ(½X+½Y) ≤ ρ(½X) + ρ(½Y)
Convexity and Positive homogeneity enables us to factor out ½ to get
ρ(X+Y) ≤ ρ(X) + ρ(Y) which is the sub-additive property for ρ
(b) Show that the upper and lower tail dependence of the current portfolio and the
new portfolio are, respectively:
( , ) ,U X Y and
0 if 1( , ) .
1 if 1L X Y
Commentary on Question:
About half the candidates worked through the equations to an answer. The other
half skipped this section or did not understand how to demonstrate tail
dependence.
ΛU(X, Y) = limu->1 P(X>FX-1(u)|Y>FY
-1(u))
= limu->1 P(X>FX-1(u), Y>FY
-1(u))/ P(Y>FY-1(u))
= limu->1 (u2-β -2u+1)/ (1-u)
= limu->1 -(2-β) u1-β+2 (l'Hopital's rule)
= β
ΛL(X, Y) = limu->0 P(X≤FX-1(u)|Y≤FY
-1(u))
= limu->0 P(X≤FX-1(u), Y≤FY
-1(u))/ P(Y≤FY-1(u))
P(X≤FX-1(u), Y≤FY
-1(u))
= 1- P(X>FX-1(u) or Y>FY
-1(u))
= 1-[P(X>FX-1(u)) + P(Y>FY
-1(u)) - P(X>FX-1(u), Y>FY
-1(u))]
= 1- P(X>FX-1(u)) - P(Y>FY
-1(u)) + P(X>FX-1(u), Y>FY
-1(u))
= 1-2+2u+ u2-β-2u+1
= u2-β
ΛL(X, Y) = limu->0 u1-β
= 0 if β ≠ 1 and 1 if β =1

CFE FD Spring 2016 Solutions Page 25
7. Continued
(c) Identify, in the table below, the scenario(s) for which you would recommend the
new investment strategy. Justify your recommendation(s).
Expectation Value of Beta
0 1 1.5
The current portfolio is expected to experience a
dramatic rise (i) (ii) (iii)
The current portfolio is expected to experience a
dramatic decline (iv) (v) (vi)
The current portfolio is expected to experience a
dramatic change with unknown direction (vii) (viii) (ix)
Commentary on Question:
Candidates did satisfactorily on this section. Successful candidates compared the
portfolio returns for the current investment strategy versus the new one in each
expectation.
Want to invest new money in the new strategy only in those situations where the
new strategy does better than the current strategy in good situations or less worse
than the current strategy in poor situations.
Since we are concerned how the new strategy performs in the tails, use the tail
dependence information from part b.
In the first expectation, where rates are “expected to experience a dramatic rise”
we want upper tail dependence to be positive….i.e. the new portfolio performs
better than the old portfolio.
Scenario (ii) - invest since upper tail dependence is positive
Scenario (iii) - invest since upper tail dependence is positive
With β at 0, we don’t do any better investing in the new portfolio than we would
have in the current portfolio.

CFE FD Spring 2016 Solutions Page 26
7. Continued
With the expectation that the portfolio is going to “experience a dramatic decline”
we want to invest in the new portfolio where we DO NOT have lower tail
dependence.
Scenario (iv) - invest since there is no lower tail dependence
Scenario (vi) - invest since there is no lower dependence
With β at 1, there is lower tail dependence so we don’t do better investing in the
new portfolio.
The expectation where we have the “unknown direction” means we care about
both upper and lower tail dependence.
Scenario (ix) - invest since there is upper tail dependence but no lower
tail dependence

CFE FD Spring 2016 Solutions Page 27
8. Learning Objectives: 2. The candidate will understand how an enterprise’s structure and policies allow its
management to prioritize and select among projects or business activities that are
competing for scarce capital resources especially when opposing factors are key
decision criteria.
Learning Outcomes:
(2a) Evaluate how the legal form of an organization, corporate governance and/or
compensation dynamics impact decision-making on projects or business
activities.
Sources:
Jonathan Berk and Peter Demarzo, Corporate Finance, Third Edition, Ch 28 Merger and
Acquisition
Commentary on Question:
Most candidates did well on describing the Free Rider problem and calculating the
initial capital requirement for acquiring Lavendre. However, some candidates confused
market value of equity with book value of equity and did not do well on the profit
calculation. Since it was the last question of the morning session, only a few candidates
completed part (e) and most missed the point that a tender offer would be extended to all
shareholders.
Solution:
(a) Describe the free rider problem.
Commentary on Question:
Most candidates provided a general description of the free ride problem.
An acquirer may plan to increase the value of a firm through a takeover, but
existing shareholders are inclined to not tender their shares because it is more
profitable to hold onto the shares. This may force an acquirer to raise the tender
offer, causing the acquirer to sacrifice much of its potential profit. Existing
shareholders do not have to invest time and effort, but they still participate in all
the gains that the acquirer generates from the takeover.
(b) Calculate the amount of capital Eggshell Company needs to raise to purchase 50%
of Lavendre.
Commentary on Question:
Candidates generally did well on this part.
Cost of 10% toehold shares = $35 x 10% x 300 million = $1.05 billion
Cost of $40 tender offer for remaining 40% = $40 x 40% x 300 million = $4.8
billion

CFE FD Spring 2016 Solutions Page 28
8. Continued
(c) Calculate the Consortium’s profit after completing the LBO.
Commentary on Question:
Common errors included using book value of equity instead of market value of
equity, not reflecting 50% ownership, and incorrectly reflecting the Bank Loan
amount in the profit calculation.
Consortium contributed 40% of the capital needs = 40% x $5.85 billion =
$2.34 billion
Bank loan for 60% of the capital needs = 60% * $5.85 billion = $3.51 billion
After the LBO, Lavendre's market value of equity = $3 billion + $9 billion -
$3.51 billion = $8.49 billion
Consortium profit = 50% x $8.49 billion - $2.34 billion = $1.9 billion
(d) Calculate the Consortium’s profit from the LBO under the new terms.
Commentary on Question:
Common errors included using book value of equity instead of market value of
equity, not reflecting 50% ownership, incorrectly reflecting the Bank Loan
amount in the profit calculation, and using bid price for the 50% share purchase.
Eggshell Company capital needs = ($35 x 10% + $44 x 40%) x 300 million =
$6.33 billion
Consortium contribution = 40% x $6.33 billion = $2.53 billion
Bank loan = 60% x $6.33 billion = $3.8 billion
After the LBO, Lavendre market value of equity = $3 billion + $9 billion -
$3.8 billion = $8.2 billion
Consortium profit = 50% x $8.2 billion - $2.53 billion = $1.57 billion
(e)
(i) Calculate the share price of Lavendre after completion of the LBO
takeover.
(ii) Recommend whether the Consortium should pursue the takeover of
Lavendre. Support your recommendation.
Commentary on Question:
Few candidates were able to complete this section and correctly calculate total
cost with tender offer extended to all shareholders.

CFE FD Spring 2016 Solutions Page 29
8. Continued
(i) Share price = $8.2 billion (from part d) / 300 million = 27.33
(ii) The Consortium should not pursue the takeover of Lavendre.
At $44 tender offer, the Consortium may have to purchase the entire
company at a cost of $12.9 billion
(= 300 million * (10% * 35 + 90% * 44)).
The cost is greater than the initial value plus the expected value added:
$12.9 billion > $9 billion + $3 billion.
The Consortium would not profit from this deal.

CFE FD Spring 2016 Solutions Page 30
9. Learning Objectives: 1. The candidate will understand how a business enterprise funds its activities with
considerations for its business model, and the cost and constraints of the sources
of capital.
Learning Outcomes:
(1a) Identify and critique the available sources of funding to start or grow a business
entity.
Describe the steps to procuring capital funding (treasury function).
Assess the various features and implications of various sources of capital
funding and recommend the optimal approach for funding.
Explain how much capital funding is derived from a financial reinsurance or
securitization arrangement.
(1b) Evaluate capital budgeting approaches and structure policy for insurance and non-
insurance organizations.
Assess whether the risky return from a new project or ongoing business is
sufficient to employ investor capital using key factors, market drivers
(including return on employed capital such as NPV, IRR and payback period).
Design real options that allow an otherwise non-viable project to get funding.
Compare and contrast the methods of capital allocation towards the goal of
optimization for best possible value-creation.
Sources:
Jonathan Berk and Peter Demarzo, Corporate Finance, Third Edition, Ch 8:
Fundamentals of Capital Budgeting
Jonathan Berk and Peter Demarzo, Corporate Finance, Third Edition, Ch 18: Capital
Budgeting and Valuation with Leverage
F-125-15 Froot, Risk Management, Capital Budgeting, and Capital Structure Policy for
Insurers and Reinsurers
Commentary on Question:
This question tests whether the candidate is able to calculate NPV appropriately in order
to assess risk returns from projects, according to certain capital policies. It also requires
the candidate to know the benefits and risks of using debt as a source of capital, and how
the level of debt impacts insurance companies.
Solution:
(a)
(i) Calculate the Net Present Value (NPV) of the acquisition, using the
Weighted Average Cost of Capital (WACC) method.
(ii) Recommend whether Azure should pursue the acquisition based on the
NPV calculated.

CFE FD Spring 2016 Solutions Page 31
9. Continued
Commentary on Question:
Most candidates did not recalculate WACC for Azure based on Azure’s capital
policy. Most candidates were able to make a recommendation based on the NPV
calculation.
(i) Since the acquisition is of a company from another industry, the NPV
cannot be calculated using Azure's WACC. The candidate will need to
first calculate the unleveraged cost of capital of the project using Teal's
current WACC, and re-calculate the project's WACC for Azure based on
Azure's capital policy.
r(U) = 70% * 10% + 30% * 5.5% =8.65%
r(E) = r(U) + D/E * [r(U) - r(D)] = 8.65% + 40% / 60% * (8.65% - 6%)
=10.42%
WACC = 60% * 10.42% + 40% * 6% * (1 - 35%) = 7.81%
NPV = -80 + 15 / (7.81%-2%) = 178.18
(ii) Since the NPV calculated is positive, it is recommended to go ahead with
the acquisition.
(b)
(i) Calculate the NPV of the acquisition based on the new information.
(ii) Recommend whether Azure should pursue the acquisition based on the
new information.
Commentary on Question:
Very few candidates applied the concept of periodically adjusting debt. Most
candidates were able to make a recommendation based on the NPV calculation.
(i) First, calculate the unleveraged value of the acquisition:
V(U) = 15 / (10% - 2%) = 187.5
Next, calculate the interest shield:
1st year's interest shield = 30 * 6% * 35% = 0.63
2nd year's interest shield = 0.63 * 1.02
3rd year's interest shield = 0.63 * 1.02^2
The value of the acquisition grows by 2% every year, and debt is adjusted
annually to maintain a constant debt ratio.

CFE FD Spring 2016 Solutions Page 32
9. Continued
PV(tc * Int(t)) = 0.63/[1+r(D)] + 0.63*1.02/[1+r(D)]/[1+r(U)] +
0.63*1.02^2/[1+r(D)]/[1+r(U)]^2 + …
= 0.63/[1+r(D)] * {1 + 1.02/[1+r(U)] + 1.02^2/[1+r(U)]^2 + …}
= 0.63/[1+r(D)] * { 1 / [1 - 1.02/(1+r(U))] }
= 0.63/1.06 * {1 / (1 - 1.02/1.1)}
= 8.17
So, the leveraged value of the project is Vu+PV tax shield =
187.5+8.17=195.67
Lastly, NPV = 195.67-80 = 115.67
(ii) Since the NPV calculated is positive, it is recommended to go ahead with
the acquisition.
(c) Describe how scenario analysis can help Azure further analyze the risks of this
investment.
Commentary on Question:
Candidates did well on this question. Almost all candidates were able to describe
what scenario analysis is and how it can be used. Acceptable answer needed to be
relevant to Azure's specific project and explain how scenario analysis can deepen
the understanding of the risk.
Scenario analysis involves creating plausible scenarios in which multiple factors
change together consistently, and determining the change in NPV relative to the
base scenario.
Scenario analysis helps a company analyze risk exposures and identify the
possible deteriorated states of the project.
(d)
(i) Describe features of insurance companies and market imperfections that
combine to cause increased sensitivity to the cost of holding risk.
(ii) Design a scenario for each of the features of insurance companies from
part (i) to capture specific risks of acquiring an insurer.
Commentary on Question:
Candidates did moderately well on this question. Successful candidates identified
two specific insurance company features and pointed out that these features
mixed with market imperfections impacted pricing and capital allocation. For the
second part, successful candidates listed scenarios that can be used and how
these scenarios address features of an insurance company.
CFE FD Spring 2016 Solutions Page 33
9. Continued
(i) First Feature: Customers of insurance companies, especially retail
policyholders are sensitive to the financial standing of the insurer. They
are even more risk averse than capital providers. This is because of the
following:
Individuals value certainty; they are willing to pay higher prices for an
insurance company that has a very safe capital structure.
Customers of insurance have a high cost of diversifying their portfolio
(they do not diversify their portfolio among a large number of
insurers), thus they are very risk averse to the risk of one company.
Customers do not like the hassles of dealing with an insurance
company in distress.
Second feature: the negative asymmetry in an insurance company's
profile. Many insurance portfolios contain exposures that create
correlation in realized losses across large numbers of contracts and
policies. Safe cash flows can support larger debts. Due to these potentially
large and negative outcomes (negative skewness), the capital structure of
an insurance company is generally conservative to minimize the
probability of stress.
For the above two features to affect pricing and capital allocation, capital
market imperfections need to exist to prevent Modigliani Miller
irrelevance theorems from applying ( If MM holds, company can just hold
large amount of capital as buffer to alleviate the effect from the above two
features)
Imperfection 1: "carrying" cost of capital, such as corporate taxation and
agency concerns, limits the amount of external equity capital a single firm
can raise;
Imperfection 2: "adjustment" cost of capital, under asymmetric
information, it is expensive for the firm to use external funds to add to
existing internal capital
(ii) Following is a list of scenarios that can be used:
Company has been downgraded and needs to cut premiums to gain
customers
A competitor with much better financial standing decides to enter LTC
market
A new type of disease has been spreading and patients lose the ability
to take care of themselves in the long run
New regulation forces existing policies to expand coverage to
homemaker service

CFE FD Spring 2016 Solutions Page 34
10. Learning Objectives: 1. The candidate will understand how a business enterprise funds its activities with
considerations for its business model, and the cost and constraints of the sources
of capital.
2. The candidate will understand how an enterprise’s structure and policies allow its
management to prioritize and select among projects or business activities that are
competing for scarce capital resources especially when opposing factors are key
decision criteria.
Learning Outcomes:
(1a) Identify and critique the available sources of funding to start or grow a business
entity.
Describe the steps to procuring capital funding (treasury function).
Assess the various features and implications of various sources of capital
funding and recommend the optimal approach for funding.
Explain how much capital funding is derived from a financial reinsurance or
securitization arrangement.
(2c) Recommend an optimal capital structure and how to implement it for a given
business or strategy.
Sources:
F-120-15, JP Morgan, Creating Value Through Best-In-Class Capital Allocation
Jonathan Berk and Peter Demarzo, Corporate Finance, Third Edition, Ch 18: Capital
Budgeting and Valuation with Leverage
Commentary on Question:
Candidates generally did well on this question. Some candidates used an alternative
solution for (c)-(i) by referring to the Pecking Order and Tax Shield benefits of debt
without calculating the NPVs. For part (c)-(ii), some candidates either did not calculate
the MVAs correctly, or discounted the EVAs by WACC instead of ROIC. Most candidates
did well on parts (a) and (d).
Solution:
(a) Your manager says: “ROE is the only measure I look at because it focuses on
return to shareholders, which ties to our goal of maximizing shareholder value.”
Critique your manager’s comment.

CFE FD Spring 2016 Solutions Page 35
10. Continued
ROE is not a market based measure, it’s an accounting measure.
Ignoring measures other than ROE does not take into account leverage (or
capital structure). Comparing ROEs doesn’t tell you anything about the
capital structure.
ROE is not directly tied to value creation.
(b) Calculate Market Value Added (“MVA”) of your company using three years of
data.
Use Method 1 or Method 2 below to calculate the EVA to be 0.96.
Discount 3 years of EVA to time 0 using r=10% to calculate the MVA:
MVA = 0.96 * (1+10%)^-1 + 0.96 * (1+10%)^-2 + 0.96 * (1+10%)^-3 = 2.39
Method 1: EVA = (ROIC - WACC) * Total Capital
For each projection year:
(Total) Capital = D+E = 60 + 40 = 100
ROIC = NOPAT / Total Capital = 10/100 = 10%
WACC = D/(D+E) * d * (1-t) + E/(D+E) * k = 0.6 * 12% * (1-30%) + 0.4
* 10% = 9.04%
EVA for each year = (ROIC - WACC) * Total Capital = (10% - 9.04%) *
100 = 0.96
Method 2: EVA = NOPAT - Cost of Capital
For each projection year:
WACC = 9.04% (same calculation as Method 1)
Cost of capital = (D+E) * WACC = 100 * 9.04% = 9.04
EVA for each year = NOPAT - Cost of Capital = 10 - 9.04 = 0.96
(c)
(i) Recommend the optimal funding source for the new office. Support your
recommendation.
(ii) Recommend whether Sepia should invest in the new office, based on
MVA using three years of data. Show your work.
If capital is raised by issuing debt:
Method 1:
EVA = (ROIC - WACC) * Total Capital
(Total) Capital = D+E = 70 + 40 = 110 (for all projection years)

CFE FD Spring 2016 Solutions Page 36
10. Continued
WACC = D/(D+E) * d * (1-t) + E/(D+E) * k = 70/110 * 12% * (1-30%) +
40/110 * 10% = 8.98% (for all years)
ROIC_t = NOPAT_t/Capital = 5.5%/9.1%/16.4% for year 1 to 3,
respectively
EVA_t = (ROIC_t - WACC) * Total Capital = -3.88/0.12/8.12 for year 1
to 3, respectively
Method 2:
EVA = NOPAT - Cost of Capital
WACC = 8.98% (same for all years, same calculation as Method 1)
Cost of capital = (D+E) * WACC = 110 * 8.98% = 9.88 (for all years)
EVA_t = NOPAT_t - Cost of Capital = -3.88/0.12/8.12 for year 1 to 3,
respectively
MVA when debt is issued = All EVA_t discounted to time 0 = 2.6
If capital is raised by issuing equity:
Method 1:
EVA = (ROIC - WACC) * Total Capital
(Total) Capital = D+E = 60 + 50 = 110
WACC = D/(D+E) * d * (1-t) + E/(D+E) * k = 60/110 * 12% * (1-30%) +
50/110 * 10% = 9.13% (for all years)
ROIC_t = NOPAT_t/Capital = 5.5%/9.1%/16.4% for year 1 to 3,
respectively
EVA_t = (ROIC_t - WACC) * Total Capital = -4.04/-0.04/7.96 for year 1
to 3, respectively

CFE FD Spring 2016 Solutions Page 37
10. Continued
Method 2:
EVA = NOPAT - Cost of Capital
WACC = 9.04% (same calculation as Method 1)
Cost of capital = (D+E) * WACC = 110 * 9.04% = 10.04 (for all years)
EVA_t = NOPAT_t - Cost of Capital = -4.04/-0.04/7.96 for year 1 to 3,
respectively
MVA when equity is issued = All EVA_t discounted to time 0 = 2.27
(i) Conclusion: Sepia should raise extra capital by issuing debt because the
MVA with a debt issue is higher than the MVA with an equity issue.
(ii) Sepia should invest in the project because the MVA with debt capital is
higher than the MVA in part (b).
(d) Critique your manager’s comments using two lessons learned during the 2008
financial crisis.
A lower ROIC does not necessarily mean less shareholder value. Strategic
decision makers should focus on returns relative to risk to create shareholder
value, not on the project's ROIC as a standalone metric or the firm's average
ROIC.
The source of funds is not the primary consideration when assessing the value of
new investments. The decision to allocate capital to a specific investment should
be independent of a firm's excess cash position. When strategic decision makers
evaluate new investment opportunities, the return on invested capital should
always be benchmarked against the risk associated with that investment, not the
returns currently generated on excess cash balances.

CFE FD Spring 2016 Solutions Page 38
11. Learning Objectives: 4. The candidate should understand how and when to apply various advance
techniques to evaluate risk or uncertainty in any business enterprise especially
non-insurance organizations.
Learning Outcomes:
(4b) Critique and apply the market value margin concept in a market consistent
valuation.
Sources:
Manistre, Down but not Out: A Cost of Capital Approach to Fair Value Risk Margins
F-107-13 CRO Forum, Market Cost of Capital Approach to Market Value Margins
Commentary on Question:
Overall, candidates performed poorly on this question, with many struggling with the
formulas in parts (c) and (d). Most candidates were able to compare the percentile and
MCoC approach, but many did not mention how these relate specifically to Tiny, as the
question asks.
Solution:
(a) Compare the percentile and MCoC approaches to calculate MVMs specifically for
Tiny.
Commentary on Question:
Candidates who did not tie their comparisons to Tiny being a small life insurance
company received no credit.
MCoC approach ensures cost of risk measured purely based on economic cost of
holding capital to support non-hedgeable risk. Percentile approach may include
prudence in both reserves and capital, resulting in a double-counting of risk. Tiny
is not large enough for this capital inefficiency.
Percentile approach is complex to implement, especially for smaller entities who
do not have advanced modelling capabilities. MCoC is far easier to implement,
which is good for a company Tiny's size.
(b) Describe the “Down But Not Out” approach to calculating a fair value risk
margin.

CFE FD Spring 2016 Solutions Page 39
11. Continued
If there is a 1 in N year event that wipes out a company's capital, there should still
be enough risk margin on the balance sheet that the company can either attract a
new investor to replace the lost capital or pay a similar healthy enterprise to take
on its obligations. The enterprise is not out because appropriate risk margins are
still available in case the parameters were incorrectly calculated. The company
should be able to raise more capital because the new balance sheet (after the 1 in
N year event) has credibility with investors. This credibility stems from the
actuarial profession's standards of practice.
(c) Calculate the Return on Capital used in the above table for Tiny’s 5-year term life
insurance business.
𝑀𝑎𝑟𝑔𝑖𝑛𝑡 =𝑀𝑎𝑟𝑔𝑖𝑛𝑡+1 ∗ (1 − 𝑞𝑡+1) + 𝐶𝑎𝑝𝑖𝑡𝑎𝑙𝑡 ∗ 𝜋
1 + 𝑖
𝜋 = 10%
(d) Calculate the values for (i), (ii), and (iii) in the table above.
Commentary on Question:
Many candidates tried to calculate (iii) first and then back into (ii). The formula
to calculate (iii) prospectively using t=2 and t+1=3 requires knowing (ii) in
advance, so this method is not possible. However, candidates who calculated (iii)
retrospectively using t=1 and t+1=2 were successfully able to get the correct
answer to (iii) first and then back into (ii). This was a full-credit answer.
(i) Question states the same mortality shock multiple is used for every
projection year. Taking the ratio of any �̂�𝑥+𝑡
𝑞𝑥+𝑡⁄ yields a 10% multiple.
For t=3, 0.00117 * (1 + 10%) = 0.00129.
(ii) �̂�2 − 𝑉2
=�̂�3∗𝐹+(1−�̂�3)∗ �̂�3
−{𝑞3∗𝐹+(1−𝑞3)∗ 𝑉3 }
1+𝑖+𝜋
�̂�2 − 𝑉2
=0.00129 ∗ 10,000 + (1 − 0.00129) ∗ 27.184 − {0.00117 ∗ 10,000 + (1 − 0.00117) ∗ 24.679}
1 + 0.05 + 0.10
�̂�2 − 𝑉2
= 3.52225

CFE FD Spring 2016 Solutions Page 40
11. Continued
(iii) �̂� =2
�̂�3∗𝐹+(1−�̂�3)∗ �̂�+𝜋( 𝑉2 − 𝑉)2
3
1+𝑖
�̂� =2
0.00129 ∗ 10,000 + (1 − 0.00129) ∗ 27.184 + 10% ∗ 3.52225
1 + 0.05
�̂� =2 38.47722
(e) “Most of our mortality risk capital is gone because of the flu pandemic, which
obviously means our five-year term product had negative returns. However,
because we have sufficient loadings in future mortality rates we can expect a
reasonable return on investment if we replace the lost capital now. If this capital
is replaced we can be sure that this will not happen again for at least another 100
years. You can also gain comfort knowing that our approach includes margin for
parameter risk in case our mortality assumption is incorrect.”
Critique the CFO’s statement.
The CFO is incorrect that returns were obviously negative in the year of the
pandemic. Returns don't necessarily have to be negative after a 1-in-100 year
event if Tiny is properly capitalized beforehand.
The CFO is correct that a reasonable return on new investments can be
expected as long as the capital is replaced now.
The CFO is incorrect in promising that this won't ever happen again if the
capital is replaced now, as a 1-in-N year event does not mean it happens every
N years.
The CFO is correct that the calculation for capital (V^ - V) helps cover Tiny
in the event that the mortality assumption is wrong and must be revised

CFE FD Spring 2016 Solutions Page 41
12. Learning Objectives: 3. The candidate will understand how and when to apply various stochastic
techniques to situations which have uncertain financial outcomes.
5. The candidate will understand how to identify and recommend appropriate risk
assessment and monitoring techniques for financial risk management.
Learning Outcomes:
(3a) Explain the mathematical foundation of stochastic simulation.
(3c) Recommend the use of techniques to reduce the computational demand when
applying stochastic methodology.
(3g) Explain what risk exposures are or are not identified with a given risk metric and
which metric should be used for a specific risk (e.g., instrument, exposure or
portfolio).
(5a) Evaluate the methods and processes for measuring and monitoring market risk
positions.
(5d) Design an appropriate stress-testing process and evaluate its limitations for a
given risk position.
Sources:
Dardis, Layering Your Own Views into a Stochastic Simulation; Market Consistency, Ch
4 & 7;
Korn, Monte Carlo Methods and Models in Finance and Insurance, Ch 2, Sections 2.1
and 2.4-2.7;
Dowd, Measuring Market Risk 2nd ed, Ch 10 & 13
Commentary on Question:
Commentary listed underneath question component.
Solution:
(a) State two benefits of calculating the market implied volatility.
Commentary on Question:
Most candidates did well on part a. There were many acceptable answers, a few
are listed below.

CFE FD Spring 2016 Solutions Page 42
12. Continued
It provides a price quotation convention that is more consistent across
different related instruments than price in isolation;
It can allow for pricing of similar, but less liquid, instruments;
It can be updated frequently based on market information and layered into a
forward-looking projection;
It potentially helps to understand sensitivities of different instruments.
(b)
(i) Define delta of a European put option.
(ii) State the formula for delta of a European put option using Black-Scholes.
Commentary on Question:
Most candidates accurately defined a European put as a price sensitivity of a put
option to the price of the underlying security. Few candidates correctly answered
part ii, with the most common mistake being not defining d1.
(i) Delta of a European put option is the price sensitivity of the option to the
underlying security.
(ii) ∂u/∂S=uS = -e-q(T-t)N(-d1) = e-q(T-t)(N(d1)-1)
for d1=[log(S/K)+(r-q+σ2/2)(T-t)]/(σ*sqrt(T-t))
(c) Determine how an increase in the following variables would affect the delta of a
long European Black-Scholes put option:
(i) Risk-free rate
(ii) Strike price
(iii) Market implied volatility
(i) Increase delta
(ii) Decrease delta
(iii) Increase delta

CFE FD Spring 2016 Solutions Page 43
12. Continued
(d)
(i) Identify two examples for each of ex-post and ex-ante portfolio risk
measures.
(ii) Recommend a specific risk measure to analyze the effectiveness of an
interest rate hedge. Justify your recommendation.
(iii) Design a stress test using the risk measure in (ii) to determine the
effectiveness of an interest rate hedge. Support your answer.
Commentary on Question:
Most candidates did well on part i. Fewer did well on part ii, with a common
trend being not using a risk measure identified in part i to measure the
effectiveness of the hedge.
For part iii, fewer candidates did well, with many candidates either not
describing a severe enough shock (for example, a 1 basis point parallel shift to
the yield curve) or by confusing a tail metric with a stress test shock (for example
describing how to calculate a CTE90, without shocking any of the input
assumptions).
(i) Ex-post measures: drawdown; historic tracking error; skew/kurtosis;
risk/return comparisons (i.e. sharpe ratio); peer group benchmarks.
Ex-ante measures: forward-looking tracking error; VaR, TVaR / CTE;
expected shortfall.
(ii) CTE70 since it is a tail metric that will capture moderately adverse
scenarios, and is also a comprehensive risk measure. Additionally, the
confidence level can be specified and looked at different levels for
understanding security, and is relatively easy to explain.
(iii) Create a stylized scenario by analyzing past behavior of the yield curve
and apply a shock that both increases and inverts the yield curve to
measure the effect on the hedge position. If the hedge position and the
CTE70 remain relatively stable compared to our base runs, then we can
have confidence that the hedge position is well-designed to withstand
volatile interest rate movements.
(e) List four quality criteria for a random number generator.
Commentary on Question:
Most candidates did well on part e

CFE FD Spring 2016 Solutions Page 44
12. Continued
The period must be long enough to avoid using the same random numbers
again
Unpredictability
The sequence of the random numbers should be reproducible
Portability
Ability to use parallel processors
Minimal correlation between random numbers
No large gaps in the number space
Easy to implement
(f) Explain how to use entropy to improve the stochastic simulation.
Commentary on Question:
Most candidates did well on part f. To receive full credit though candidates had to
describe how entropy could be used to insert “own views” into the simulation,
and also define maximum entropy. Some candidates did one part, but not the
other.
Entropy is a reweighting of the scenarios so that management can insert their own
views into the simulations, or it can be used to reduce the number of simulations
run in order to increase model efficiency or reduce runtimes. Maximum entropy is
achieved when all model scenarios have an equal weight of occurring, and after
inserting our own views and own weights, the result should be close to maximum
entropy to retain model output that fits closely to the original distribution.

CFE FD Spring 2016 Solutions Page 45
13. Learning Objectives: 1. The candidate will understand how a business enterprise funds its activities with
considerations for its business model, and the cost and constraints of the sources
of capital.
4. The candidate should understand how and when to apply various advance
techniques to evaluate risk or uncertainty in any business enterprise especially
non-insurance organizations.
Learning Outcomes:
(1b) Evaluate capital budgeting approaches and structure policy for insurance and non-
insurance organizations.
Assess whether the risky return from a new project or ongoing business is
sufficient to employ investor capital using key factors, market drivers
(including return on employed capital such as NPV, IRR and payback
period).
Design real options that allow an otherwise non-viable project to get funding.
Compare and contrast the methods of capital allocation towards the goal of
optimization for best possible value-creation.
(4a) Compare and contrast the approaches for their ability to be calibrated effectively,
to provide interpretable results and to give insights on the underpinning asset
management strategy.
(4d) Explain how to quantify risk when there is limited data.
(4f) Quantify the probability of risks taken in a given business or project, their
outcome as losses/gains, and their potential impact on Employed Capital.
Sources:
Jonathan Berk and Peter Demarzo, Corporate Finance, Third Edition, Ch 8:
Fundamentals of Capital Budgeting
Hubbard, How to Measure Anything, Ch 10
Jonathan Berk and Peter Demarzo, Corporate Finance, Third Edition, Ch 2: Financial
Statement Analysis
Commentary on Question:
Candidates were able to do many of the calculations correctly. Some candidates mixed
up discount rate and WACC on part c. Some candidates had trouble calculating Net
Working Capital. Overall though, candidates did very well on this question.
Solution:
(a) Calculate the probability that alcohol will be profitable for Cornflower given that
it was successful in the test market. Show your work.

CFE FD Spring 2016 Solutions Page 46
13. Continued
Commentary on Question:
Candidates generally did very well on this part.
Let S be success in the test market and P be that alcohol is profitable. Then we
are calculating P(P|S):
P(P|S) = P(P)P(S|P)/P(S)
P(P)=1-P(~P)=1-0.4=0.6
P(S|P)=0.8
P(S|~P)=0.25
P(S)=P(S|P)P(P)+P(S|~P)P(~P)=0.8 * 0.6 + 0.25 * 0.4 = 0.58
P(P|S)=0.6 * 0.8 / 0.58= 0.83
(b)
(i) Define heterogeneous benchmark.
(ii) Explain how it could apply to Cornflower.
Commentary on Question:
Candidates could get credit on part (ii) for a wide variety of answers. Candidates
received credit if they were able to apply the heterogeneous benchmark to
Cornflower.
(i) Heterogeneous benchmark: A method where calibrated estimators are
given other quantities as benchmarks to estimate an uncertain quantity,
even when those quantities seem only remotely related.
(ii) Cornflower could use alcohol profitability in competitor restaurants as a
proxy for its own.
(c) Calculate the NPV of selling alcohol in Cornflower’s restaurants. Show your
work.
Net Working Capital = Cash + Inventory + Accounts Receivable - Accounts
payable
Year 1 Year 2 Year 3
NWC 5 13 13.5
Change in NWC 5 8 0.5
EBIT = Revenues - Cost of Goods Sold - Depreciation - Selling General and
Administrative
Taxes = EBIT * 35%

CFE FD Spring 2016 Solutions Page 47
13. Continued
Year 1 Year 2 Year 3
EBIT 12 42 62
Less Taxes 4.2 14.7 21.7
Plus Depreciation 2 2 2
Less Change in
NWC
5 8 0.5
Free Cash Flow 4.8 21.3 41.8
NPV = FCFt / (1+WACC)t =-50 + 4.8/1.12 + 21.3/1.122 + 41.8/1.123 = 1.018
(d) Assess whether Cornflower should begin selling alcohol in its restaurants.
Support your assessment.
0.55 * 0.60 + (1 - 0.55) * 0.4 = 0.51
The expected value of the initial costs will be 0.51 * 65 + 0.49 * 50 = 57.65
The NPV of the project will be 1.018+50-57.65 = -6.63 (or 57.65-50 = 7.65;
1.018-7.65= -6.63)
-6.63 < -5 that will be lost by decreased sales, Cornflower should not implement
alcohol sales in its stores.