cgd policy paper 111 november 2017 - center for global ... · cgd policy paper 111 november 2017...
TRANSCRIPT

CGD Policy Paper 111November 2017
When Do Subsidy Reforms Stick? Lessons from Iran, Nigeria, and India
Subsidies cost the world trillions of dollars each year. Governments provide subsidies for multiple reasons, yet many economists consider subsidies largely regressive, poorly targeted toward intended beneficiaries, and economically distortive and inefficient. Since energy subsidies are relatively large, it is useful to examine the motivations and implications of providing energy subsidies in particular. This paper covers qualitative case studies from Iran, Nigeria, and India to illustrate a series of lessons for governments implementing subsidy reform policies. From these three country experiences, we find that fostering public support to implement lasting reform may depend on four measures: (1) forming a public engagement plan and a comprehensive reform policy that are then clearly communicated to the public in advance of price increases; (2) phasing in price adjustments over a period of time to ease absorption; (3) providing a targeted compensatory cash transfer to alleviate financial impacts on low- to middle-income households; and (4) capitalizing on favorable global macroeconomic conditions.
www.cgdev.org
Center for Global Development2055 L Street NWFifth FloorWashington DC 20036202-416-4000 www.cgdev.org
This work is made available under the terms of the Creative Commons Attribution-NonCommercial 4.0 license.
Abstract
Priscilla Atansah, Masoomeh Khandan, Todd Moss, Anit Mukherjee, and Jennifer Richmond. 2017. “When Do Subsidy Reforms Stick? Lessons from Iran, Nigeria, and India.” CGD Policy Paper. Washington, DC: Center for Global Development. https://www.cgdev.org/publication/when-do-subsidy-reforms-stick-lessons-iran-nigeria-and-india
CGD is grateful for contributions from the Bill & Melinda Gates Foundation in support of this work.
Priscilla Atansah, Masoomeh Khandan, Todd Moss, Anit
Mukherjee, and Jennifer Richmond

Contents
1. Introduction .................................................................................................................................. 1
2. Case studies ................................................................................................................................... 3
2.1. Iran: raising the price at the pump ..................................................................................... 3
2.2. Nigeria: learning from a false start to reform ................................................................ 10
2.3. India: transforming cooking gas subsidy to a direct benefit transfer ......................... 15
3. Conclusions ................................................................................................................................. 20
4. References ................................................................................................................................... 25
5. Appendix ..................................................................................................................................... 28

1
1. Introduction
Subsidies cost the world trillions of dollars each year. Fossil fuel subsidies alone accounted for US$5.3 trillion in government expenditures in 2015, or 6.5 percent of global GDP.1 Agricultural subsidies cost nearly US$500 billion among the top 21 food-producing countries in 2012 (composing about 80 percent of all agricultural subsidies worldwide),2 or about 1 percent of global GDP. There are many different types of subsidies that directly or indirectly support certain industries or goods, including direct discounts, tax credits, loan guarantees, grants, rebates, levies, and trade quotas or restrictions.
Governments provide subsidies for multiple reasons: to reduce financial barriers for consumers to purchase necessities (e.g., medicines and heating oil), to promote certain goods and services, to encourage growth in chosen sectors and industries, and to cut the cost of doing business by discounting inputs for producers. However, many economists consider subsidies largely regressive, poorly targeted toward intended beneficiaries, and economically distortive and inefficient.3
Developing countries are generally more susceptible than richer countries to the negative implications of subsidizing goods and services related to energy, agriculture, and medicine. Developing countries have tighter budgetary constraints, are more vulnerable to international commodity market fluctuations, and are more likely to be saddled by debt that stifles investment and economic progress. Conversely, developing countries also have the most to gain from reforming their subsidy regimes. Subsidy reform would generate government revenue that could be spent on public goods and services or redistributed as direct payments to low-income households.
Since energy subsidies consume a relatively large part of the global budget, it is useful to examine the motivations and implications of providing energy subsidies in particular. Governments commonly state they subsidize fuel to help poor consumers gain access to energy. But while subsidizing fuel can expand energy access in some cases, evidence shows that subsidies are highly inefficient at targeting poor households. In developing countries, the richest 20 percent of households capture the vast majority of fossil fuel subsidies.4 Deeply inequitable consumption suggests that alternative mechanisms may be more effective at promoting energy access among the poor. Governments that continue to funnel revenue into subsidies also diminish the amount of resources available for other public spending needs, such as health, education, infrastructure, long-term investment, and social welfare
1 This is a post-tax estimate. The IMF had previously estimated global subsidies to cost US$2 trillion in their 2013 publication of “Energy Subsidy Reform: Lessons and Implications,” but they later revised this estimate to nearly double the cost at US$4.2 trillion in 2011. The new figure accounts for the World Health Organization’s estimates of the costs of pollution on human health. “Counting the Cost of Energy Subsidies,” 2016. 2 “Agricultural Subsidies Remain a Staple in the Industrial World,” 2012. 3 “Chapter 2: The effects of subsidies,” 2017. 4 Whitley, 2013.

2
programs. In other words, governments must engage in a tradeoff between spending on subsidies versus public goods and services on which citizens depend.
Although maintaining subsidies clearly poses threats to fiscal stability and market efficiency, there are significant obstacles to reform. In many cases, price adjustments have been met with public protests and resistance. Research suggests that resistance stems from several factors, including misinformation about the implications of reform, lack of trust in leadership, poor perceptions of government effectiveness, and inadequate compensation for poor households that are most severely impacted by price increases. In the past, strong organized public resistance has often resulted in a partial or full reinstatement of subsidies. The ability of governments to institute permanent and stable reform, therefore, hinges in part on gaining public support and mitigating opposition.
The following qualitative case studies from Iran, Nigeria, and India illustrate a series of lessons for governments implementing subsidy reform policies, adding to the substantial literature on this issue, much of it published by researchers at the IMF or World Bank.5 From these three country experiences, we find that fostering public support to implement lasting reform may depend on four key measures: (1) forming a public engagement plan and a comprehensive reform policy that are then clearly communicated to the public in advance of price increases; (2) phasing in price adjustments over a period of time to ease absorption;6 (3) providing a targeted compensatory cash transfer to alleviate financial impacts on low- to middle-income households; and (4) capitalizing on favorable global macroeconomic conditions (e.g., low oil prices) that lessen the burden both on consumers during price increases as well as the government when providing substitutes for subsidies.
This paper is one of the first background pieces in a broader program of work at CGD on subsidy reform, biometric identification systems, and direct payment systems.
5 E.g., Verme and Araar, 2017; Clements et al., 2013; blogs at http://www.imf.org/external/np/fad/subsidies/ and http://blogs.worldbank.org/futuredevelopment/lessons-reducing-energy-subsidies 6 Clements et al., 2013.

3
2. Case studies
2.1. Iran: raising the price at the pump
Subsidies have been in place in Iran for nearly four decades. During the Iran-Iraq War of 1980 to 1988, the government began subsidizing basic consumer goods such as food, medicine, and utilities (water, sewage, and power) to support its struggling population. Once in place, the subsidies proved politically difficult to reduce or remove.
Iran’s large oil industry and the volatility of oil prices compared to other commodities have made it especially difficult for the government to reform gasoline subsidies. Past reform attempts incited public backlash, typically prompting a full reinstatement of the subsidy. Although previous efforts failed, several domestic catalysts eventually pushed the government to implement a comprehensive reform policy without backsliding. Catalysts included skyrocketing consumption and fiscal strain, US sanctions, inefficient fuel usage, smuggling, air pollution and human health problems, and traffic congestion.7
2.1.1. Subsidy reform policy goals
The government’s overall goal was to increase the country’s economic competitiveness by creating more jobs and using its oil resources more efficiently. Subsidy reform was designed as part of a larger set of structural economic reforms within the finance and tax sectors. Although the focus of reform was not on mitigating fiscal strain, there is no doubt that fiscal problems escalated as Iran continued to phase in the reform; the government’s inability to stabilize spending became an economic and political hurdle that it has struggled to overcome.
Several factors contributed to Iran’s growing fiscal imbalance over the past few decades, including the country’s population boom in the 1980s. Following the 1979 Islamic Revolution, a conservative Shia government took power, led by Ayatollah Khomeni. The new administration abolished a popular nationwide family planning program that it considered an encroachment of Western ideals.8 Iran’s population surged, reaching 50 million in 1986 while climbing at one of the highest population growth rates in the world at the time, 3 percent. The burgeoning population became a major drain on national coffers by the end of the decade as oil prices rose and the pool of consumers of end-user gasoline subsidies increased.
Iran’s dependence on oil exports has had a deep impact on its economy in recent years. Prior to 2002, domestic oil prices remained high enough to cover the cost of domestic oil production; however, during the commodity boom of 2002-2008, international oil prices and export revenues soared, causing fiscal spending and credit growth to rise in tandem.
7 Guillaume, Dominique et al., 2011. 8 Roudi, 2012.

4
Subsequently, the economy overheated and inflation spiked. Then, during the global financial crisis of 2008-2009, there was a sharp decline in oil exports, output, and inflation.9
By the late 2000s, Iran had the highest rates of energy subsidies in the world. However, the rich (the top quintile) were capturing the vast majority—65 percent—of energy subsidies, while low-income (bottom quintile) households were capturing just 8 percent. With a growing need to reform regressive and costly subsidies that muted oil market volatility at the government’s expense, the Iranian Parliament approved a policy designed to increase household welfare and create a redistribution system to provide more equitable benefits to households than subsidies had. This goal also fit the political objectives of the populist Ahmadinejad administration, which had taken power in 2009.10 The government advertised its reform program as a redistribution scheme that would help the poorest households instead of threatening to simply phase out or eliminate subsidies, as with botched reform attempts in the past.
Iran’s high domestic inflation rate and exchange rate depreciation have contributed to the erosion of domestic energy prices compared to the international benchmark. In 2002, Iran’s domestic prices were only US$0.20 and US$0.10 per liter of gasoline and crude oil, respectively. Meanwhile, international oil prices approached US$150 per barrel and free on board (FOB) gasoline prices floated around $2 per liter.11 The disparity between domestic and international markets, especially compared to neighboring countries, helped create a black market for cheaper fuel smuggled across borders. According to Iranian State media in 2013, between 7-10 million liters of gasoline and diesel were being smuggled out of Iran every day. Smuggled fuel was sold to neighboring countries for up to 10 times the Iranian sticker price, and rampant smuggling led to an approximate 7 percent increase in fuel consumption in 2013.12 Low domestic energy prices, pervasive smuggling, and population growth led to a surge in domestic energy consumption. As a result, Iran became one of the most energy-intensive economies in the world by the early 2000s, exhibiting a level of energy intensity three times the global average and 2.5 times the Middle Eastern average. In per capita terms, Iran annually consumed 15 times the amount of energy as Japan and 10 times the amount of the entire European Union.13
2.1.2. Creating more equitable consumption and competitive markets
Work on reform legislation resumed in early 2009. Deteriorating economic conditions caused by the global recession, a new U.N. Security Council, unilateral sanctions leveled against Iran, and the increasingly blatant wealth disparity in subsidy capture all contributed to the heightened political urgency to find a solution. As Harris14 put it, Ahmadinejad “rarely missed a chance to...[say] that 70 percent of the nation [received] 30 percent of the subsidies.” On
9 Guillaume, Dominique et al., 2011. 10 Anderson, 2009. 11 Clements et al., 2013. 12 Khalaj, Monavar, 2013. 13 Taghizadeh, 2010. 14 Harris, 2010.

5
January 5, 2010, parliament passed the Targeted Subsidies Reform Act. The government planned to phase in reform pricing and redistribution over the course of a five-year period, and the revenue from price increases was estimated to be US$20 billion in the first year of reform. The policy would adjust fuel prices to 90 percent of the FOB Persian Gulf level and help equilibrate Iran’s pricing to its neighbors’ rates and diminish black market incentives.15 Parliament considered more than 200 pricing scenarios to evaluate the tradeoffs between increasing government revenue and raising energy prices for producers and consumers. Parliament ultimately aimed to reduce excessive demand, discourage inefficient substitution between compressed natural gas and liquid fuels, and balance the need for households to access natural gas for home heating in winter, which is the largest energy-related expense for most low-income households.
By December 2010, the government began to roll out the first phase of the Targeted Subsidies Reform Act after 36 years of heavily subsidized fuel. (Within days of the start of Iran’s reform, Bolivia and Pakistan also attempted to phase out their energy subsidies by raising national prices on oil and gas products. Both countries quickly abandoned their reform policies and reinstated prices to previous levels in the face of massive public opposition.) Although Iran faced obstacles and moderate public opposition during the initial implementation, the government persisted in pushing the reform policy forward. However, in late 2012, parliament stalled on the second phase of the policy because of the proposed increase in the budget for cash distribution as well as intended energy price increases. Macroeconomic conditions were worsening: inflation was rising and the national currency was depreciating, which were exacerbated by crippling international sanctions. In preparing for the first phase of reform in 2010, the government had worked with the central bank to ensure favorable macroeconomic conditions by curbing inflation and appreciating the currency. However, the government was unable to achieve similar macroeconomic conditions prior to the planned rollout of the second phase, which was slated to take effect in mid-2012. This phase would have provided larger cash transfers while increasing gasoline prices.
Energy subsidies indirectly promote higher rates of pollution that can elevate threats to environmental and human health; Iran’s government planned to improve air quality as a co-benefit of reform. After President Obama ordered sanctions on Iran in 2010 to penalize the country’s oil exports, Iran invested heavily in expanding its domestic refining and production capacity. However, its domestic petroleum resources and refining capabilities were, and continue to be, far less efficient at minimizing pollutants. Iran’s gasoline reportedly contains 10 times more contaminants than imported fuel; the country’s diesel fuel has 800 times the international standard for sulfur. Air pollution in Iran’s major cities is among the highest in the world, and about 70-80 percent of it is caused by transportation sources while industrial and residential sources make up the remainder.
15 Guillaume, Dominique et al., 2011.

6
2.1.3. Analysis
Iran’s relatively smooth rollout of reform was due, in large part, to effective communication and messaging, and to the creation of online platforms for public dissemination and feedback. The government created a website to encourage registered households to verify whether they had received their transfers and established phone hotlines to answer questions about the reform policy’s implications. The government also worked proactively with the private sector in the months leading up to the first phase of reform to address business concerns about rising energy costs. The authorities led a systematic analysis of more than 12,000 enterprises, of which 7,000 were selected to receive financial assistance and fuel discounts to counter the financial hardship incurred by price increases.16 In addition to clear communication, the government ensured citizens could easily register online or in person to receive cash transfers. Post offices, internet providers, and district and provincial governors’ offices were commissioned to help register citizens across the country to set up accounts. Citizens were also allowed to register accounts on a rolling basis, providing needed flexibility among different segments of the population.
Another key to Iran’s reform policy was the government’s ability to ensure cash transfers were distributed to households before prices increased.17 At about US$45 per household,18 the transfers were considered generous enough to mitigate any economic shocks. In 2011, transfers were greater than the monthly expenditures of 2.8 million of Iran’s poorest citizens. Transfers were also equivalent to 28 percent of median per capita expenditures for a family of four, and about 10 percent of the monthly wage of an unskilled worker.19 This helped cancel out negative financial impacts among the poorest households as well as political and social unrest among citizens.
The Iranian banking system also played a critical role in the reform policy rollout. Banks collectively opened an estimated 16 million new accounts to enable all eligible households to access their transfers. Additionally, the banking sector upgraded its infrastructure and payment systems to guarantee seamless access to accounts as reform pricing took effect. Finally, banks expanded the ATM network to include many rural regions which did not previously have ATM access.20
Iran implemented its reform policy with careful preparation, innovative price increase sequencing, and a cash transfer mechanism to mitigate the financial impacts from rising energy prices. The reform policy also included multi-tier tariffs for electricity, natural gas, and water, and these were introduced based on the consumption rate and geographical location.21 By March 2011, the program redistributed revenue saved by reform to 80 percent of (61 millions) the country’s citizens. Transfers (at least initially) pulled millions of people
16 Guillaume, Dominique et al., 2011. 17 Widerquist, Karl and Michael Howard, 2012, 17-32. 18 Salehi-Isfahani, Djavad, 2011. 19 Salehi-isfahani, Djavad et al., 2015. 20 Guillaume, Dominique et al., 2011. 21 Hassanzadeh, Elham, 2012.

7
out of poverty, including about 8 percent of the rural population (1.8 million people) and 3.2 percent of the urban population (1.7 million people).22
Impacts from reform were evident almost immediately. In the year following implementation of the Targeted Subsidies Reform Act, consumption of most energy products declined due to price increases: fuel oil consumption decreased by 36.4 percent, petrol by 5.6 percent, diesel by 9.8 percent, kerosene by 2.9 percent, LPG by 10.6 percent, electricity by 1.7 percent, water by 6 percent, and natural gas by 1.5 percent. These are significant savings, especially when compared to 10 percent-per-year growth in energy product consumption just prior to reform.23 In the first year of implementation, reform pricing raised an estimated US$20 billion in additional revenue from price increases. Three years before the program’s implementation, the country spent US$5 billion on 73 million liters of petroleum. Post-reform, it only consumed 59 million liters. In 2010, Iran spent US$5 billion on petroleum imports; this number decreased to US$830 million in 2011 after the policy took effect.24
The government provided universal cash transfers to all households when reform first took effect, but it remains unclear how long universal transfers will stay in place because of the immense fiscal burden on the national budget. The government is attempting to trim the pool of recipients by excluding wealthier households from receiving transfers. However, there is currently no simple method for estimating household welfare to determine which households are wealthiest and should be removed from the cash transfer registry. Using a combination of survey research and existing data, experts are currently constructing a proxy measurement model to estimate household wealth.25 Initially, 50,000 households have been removed from the beneficiary list. A small segment (about 9 percent) of those who were dropped from the registry did protest being removed, but resistance was relatively minimal. As targeting ramped up, another 100,000 of the country’s wealthiest households were removed. To date, about four million households have been removed from the registry, and about 200,000 households continue to be removed monthly. The government intends to continue removing recipients in order to balance its fiscal commitments.
Since reform pricing began late in 2010, the policy has achieved mixed success. Fundamentally, the gap between domestic and international gasoline prices is closing, allowing the market to have more control of gasoline pricing (Figure 1). However, Iran’s subsidy reform has not been without complications. Facing increased scrutiny of rising energy prices and redistribution costs, and a less favorable macroeconomic environment, parliament postponed phase two of the reform. Public and private sector leaders primarily questioned the ability of the government to sustain universal cash transfers over time because of the country’s dependence on oil revenue. However, the government continued to
22 Salehi-Isfahani, Djavad, et al., 2014. 23 Salehi-Isfahani, Djavad et al., 2013. 24 The national Oil Product Distribution Company. 25 A statistical procedure using an orthogonal transformation to convert a set of observations of possibly correlated variables into a set of values of linearly uncorrelated variables

8
dole out payments on a universal basis, despite exceeding the program’s savings. While universal transfers are a fiscal drain, providing them to all households has undoubtedly helped ease social and political resistance to reform to ensure a smoother transition to market-based pricing.
Figure 1: Pump price for gasoline (USD per liter)
Source: The World Bank and Iran’s authorities
Additionally, international sanctions (which were tightened drastically and constrained oil exports substantially after mid-2012) increased the financial burden on the government. Sanctions, along with a sharp national currency devaluation, led to a surge in the cost of living in Iran and have made reform efforts difficult. The IMF declared that “external shocks could significantly undermine the hard-won stability of Iran’s currency and the envisaged relative price adjustment.”26 Despite the obstacles that remain, the government’s adaptive approach to implementation has been central to improving the country’s capabilities to deal with macroeconomic instability.
Finally, as mentioned previously, the government’s (at least partial) inclusion and protection of private enterprises and businesses has been pivotal in moving subsidy reform forward as seamlessly as possible. Government offices consulted with business leaders to structure a reform policy and compensation mechanism that helped make the adjustment to higher energy prices more palatable. Over half of Iran’s enterprises received some form of government assistance during the transition or were granted discounts on certain fuel products. However, businesses have not necessarily adjusted in terms of adopting energy-saving technologies; to date, there has been no measurable increase in energy-efficient technologies employed by private enterprises.
Iran’s success in implementing reform and continuing to align more closely with market-based pricing will depend on a number of factors, including more selective targeting for cash
26 Argus, 2014.
$-
$0.30
$0.60
$0.90
$1.20
$1.50
USD
Pric
e pe
r lite
r
World Iran

9
transfers, maintaining macroeconomic balance, and continuing to clearly communicate any future pricing changes to both the public and private business community.
2.1.4. Status of reform
When a new government took power in 2013 under Hassan Rouhani, Iran revived its reform efforts. The parliament passed the second phase in 2014, which increased energy prices by 20 to 25 percent.27 With currency depreciation, cash transfers to households (worth about US$45 in 2010) have become much less valuable over time and provide less benefit to low-income households as prices continue to rise.
Post-reform measures of poverty and inequality in Iran appear to have improved, at least initially. The poverty rate in Iran dropped 5 percentage points during the first three months of reform, and the Gini coefficient decreased from 0.41 in 2009/2010 to 0.37 in 2011/2012.28 However, the amount of projected revenue from subsidy savings has not been fully realized by the government, contributing to cash flow imbalances and delays in reform phase implementation. The government’s push to remove wealthy households from the cash transfer redistribution program has helped to ease the fiscal imbalance slightly, but it will remain voluntary and marginal until a systematic wealth measurement is established. With a relatively unstable exchange rate, recurrent inflation, and external shocks such as sanctions, Iran will need to continuously reevaluate the impacts from reform during initial years of transitional price increases.
27 Hassanzadeh, Elham, 2014. 28 Demirkol, et al., 2014, 9.

10
2.2. Nigeria: learning from a false start to reform
As a major oil producer, Nigeria has applied fuel subsidies for consumers for decades. In 2011, it spent a record amount on fuel subsidies; by December, the government had paid US$8.4 billion in gasoline subsidies—equivalent to 4.1 percent of GDP and US$6.88 billion more than allocated in the appropriations bill.29 Although the government reinstated the gasoline subsidy at a pump price markup, fuel subsidy expenditures amounted to 3.6 percent of GDP at the end of 2012.30
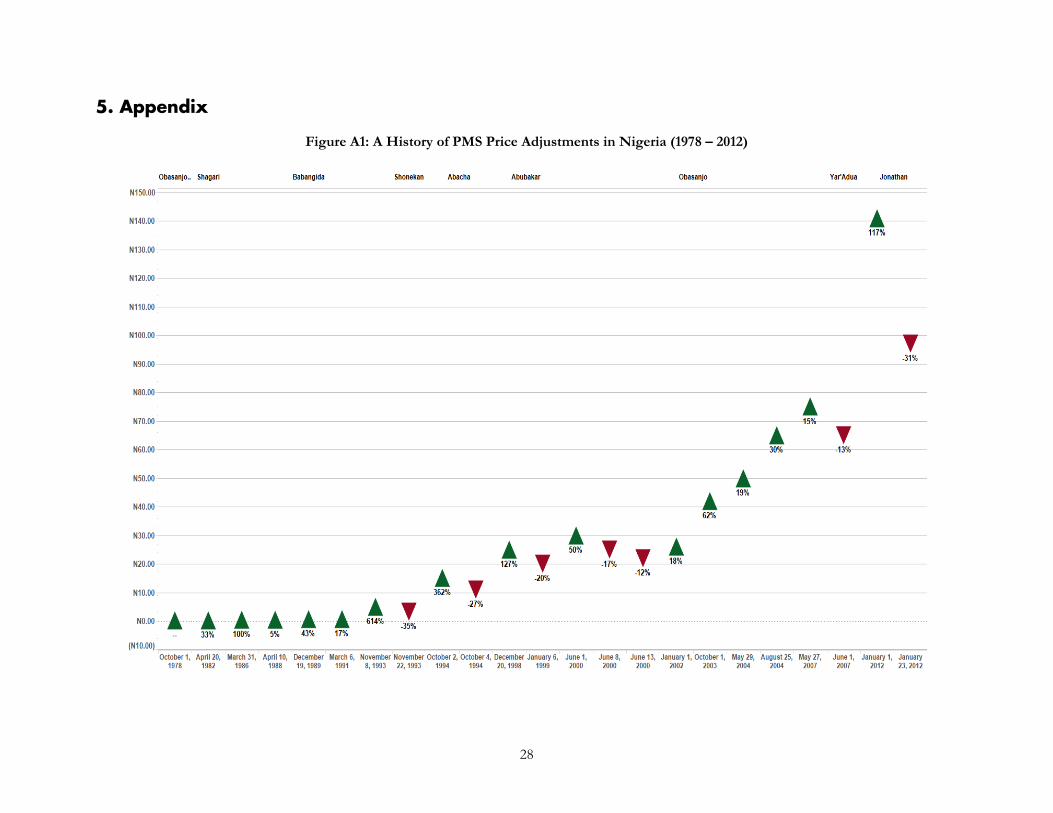
In a surprise announcement on January 1, 2012, the Federal Government of Nigeria rescinded its 30-year-old petroleum subsidy.31 Prior governments’ attempts to deregulate petroleum products had failed, and President Goodluck Jonathan’s attempt also proved largely unsuccessful, resulting in a two-week strike by the country’s workers. Widespread public protests forced the government to partially reinstate the subsidy, dashing hopes of structural reform. (See Figure A1 in the Appendix: A History of Gasoline Price Adjustments in Nigeria.)
2.2.1. Addressing Nigeria’s swelling fiscal imbalances
The fiscal and budgetary burden of the fuel subsidy regime largely stems from the government’s own pricing formula for gasoline, which is mandated by the Nigerian Petroleum Products Pricing Regulatory Agency (PPPRA). Of the products PPPRA regulates—gasoline (PMS), diesel, low-pour fuel, household kerosene, and aviation turbine kerosene—the government subsidizes the two consumed most by the majority of the country: gasoline and household kerosene.32 The federal government sets a fixed pump price for gasoline and then pays the difference towards PPPRA’s open market price, which depends on the price of global crude and refined petroleum imports. (See Table 1 below for the PPPRA pricing template.)33 From 2006 to 2011, the gasoline pump price was fixed at $0.41/liter. In 2011—the fiscal year before the Jonathan administration’s attempt to phase out the PMS subsidy—global crude prices reached a five-year high with an average open market price of $0.87/liter. Subsequently, the subsidy amount for each liter of gasoline was $0.46,34 costing the government over $13 billion in 2011 alone.35
29 “A Citizens’ Guide to Energy Subsidies in Nigeria,” 11. 30 Clements et al., “Case Studies on Energy Subsidy Reform,” 6. 31 “Nigeria: Fuel Subsidy,” 5. 32 PPPRA calculates a quarterly Expected Open Market Price (EOMP). The EOMP is comprised of gasoline landing costs; distribution margins to transporters, retailers, and dealers; administrative costs; and contributions to a bridging fund (Annex 1). 33 “A Citizens’ Guide to Energy Subsidies in Nigeria.” 34 Okonjo-Iweala, “Brief on Fuel Subsidy.” 35 “A Citizens’ Guide to Energy Subsidies in Nigeria.”

11
Table 1: PPPRA Expected Open Market Price Template for December 2011
Exchange rate = 159.76 Naira : 1 USD. Source: PPRA, 2011
The direct link to global crude prices breeds volatility, especially as fuel markets become increasingly destabilized. There are also many endogenous deficiencies in the regulatory market pricing that exacerbate the impact of this volatility. First, the pricing formula guarantees returns to all parties in the supply chain, disproportionately transfers financial risk from sector operators to consumers, and lacks a strong empirical basis for a number of cost elements.36 Most obviously, it does not include taxation. Deutsche Gesellschaft für
36 Adenikinju, “Energy Pricing and Subsidy Reforms in Nigeria.”
Cost element $/MT Naira/Liter
Cost + Freight 951.68 113.38
Trader's Margin 10.00 1.19
Lightering Expenses 33.17 3.95
NPA 5.25 0.63
Financing 21.52 2.56
Jetty Depot Thru’ Put Charge 6.72 0.80
Storage Charge 25.18 3.00
Bridging Fund 49.10 5.85
Marine Transport Average 1.26 0.15
Admin Charge 1.26 0.15
Benchmark Landing Cost 1,105.14 131.66
Retailers 38.61 4.60
Transporters 25.10 2.99
Dealers 14.69 1.75
Subtotal Distribution Margins 78.40 9.34
Highway Maintenance 0 0
Government Tax 0 0
Import Tax 0 0
Fuel Tax 0 0
Subtotal Taxes 0 0
Total EOMP (landing cost + distribution margins + taxes)
1,183.54 141.00
Government-approved pump price 65.00

12
Internationale Zusammenarbeit (GIZ), in its International Fuel Prices 2014 report, suggests that to finance road maintenance, “a minimum added tax of 10 US-cents per liter” should be included in retail fuel prices.37 But in PPPRA’s pricing formula, there are zero taxes levied on gasoline imports and consumption. In the absence of government, highway, import, and fuel taxes, the baseline pricing model—which was the model used in 2011 at the time of reform and remains the current model—wastes opportunities for the government to accrue capital for critical infrastructure expenditure.
Opportunity aside, the real cost of the fuel subsidy has been to fiscal reserves. Payments are made from Nigeria’s Sovereign Wealth Fund (formerly Excess Crude Account) and not its annual consolidated revenue.38 At the end of 2014, fiscal reserves had diminished by more than 50 percent to US$2 billion, and the World Bank noted that the US$35 billion spent on subsidizing fuel between 2010 and 2014 was the primary reason for Nigeria’s inability to accumulate fiscal reserves in the SWF.39 Granted, such a drastic fiscal burden provides a clear incentive for policy action, but a complete phase out is not possible without increasing domestic gasoline supply. To lessen the fiscal imbalance and burden of market-price gasoline on the end consumer, Nigeria will have to supply enough gasoline domestically to satisfy demand at cheaper prices.
Although Nigeria contains 28.5 percent of crude oil reserves in Africa and produces 26 percent of the continent’s oil, over 80 percent of gasoline was imported in 2011.40 This high net import is attributable to limited refining capacity. Nigeria’s four refineries have a production capacity of 445,000 bpd, but operations are consistently inefficient with utilization rates as low as 22 percent.41 The deficient supply of local petroleum products has been the main justification for the fuel subsidy, which compensates consumers for the government’s inability to offer working refineries.42 Ironically, several years of fuel subsidization has discouraged investment in domestic refining capacity and encouraged Nigeria’s dependency on fuel imports: of 20 refinery licenses issued since 2000, none have been used because the current market structure does not allow investors to fully cover their operational costs.43, 44
While market incentives are a major consideration in the case for reform, corruption has been the starkest hallmark of the subsidy program, drawing the most public critique of the government. In 2012, following the failed reform attempt, the House of Representatives established a committee to review state expenditure on the subsidy program and its accounting loopholes. Investigating three years of the program (2009–2011), the committee found
37 Wagner, “International Fuel Prices 2014,” 3. 38 Budget Office of the Federation, “2012-2015 Medium Term Expenditure Framework (MTEF) and Fiscal Strategy Paper (FSP),” 8. 39 World Bank, “Nigeria Economic Report.” 40 “International Energy Statistics - EIA.” 41 US Energy Information Administration, “Nigeria Energy Profile,” 11. 42 Okoroafor, “The 52-Year Long (ongoing) Project That Is Nigeria’s Oil Refineries.” 43 Clements et al., “Case Studies on Energy Subsidy Reform,” 50. 44 Okonjo-Iweala, “Brief on Fuel Subsidy.”

13
deliberate neglect for record keeping, payments for billions of liters that were never supplied, and refunds due to the Treasury in excess of $6.8 billion.45
Among the staggering amounts lost to the Nigerian National Petroleum Corporation’s unauthorized withdrawals from the excess crude account, the report showed that a large part of the subsidy payments never reached the target population. While the government paid a daily subsidy on 59 million liters of gasoline, Nigerians only consumed 35 million liters per day.46 At an average subsidy of $0.46/liter in 2011, the government lost about $11 million to companies making false subsidy claims on undelivered fuel and smuggling to neighboring countries.
Such leakages support critiques that the government “has been subsidizing corruption and inefficiency.”47 Indeed, regressive distribution, weak price enforcement, and embezzlement have prevented consumers from accessing the subsidy’s benefits. A study of households’ expenditure data in 2009/2010 showed that the top 20 percent of Nigerian households benefited twice as much from the fuel subsidies as did the bottom 20 percent of households.48 While the study showed that absorption of the kerosene subsidy was evenly distributed across income groups, absorption of the gasoline subsidy was grossly unequal because pump prices steadily exceeded that set by the government.49
2.2.2. A revised approach to reform
The Jonathan administration first confirmed its intent to phase out the gasoline subsidy in 2012 during the president’s presentation of the 2012-2015 Medium Expenditure Framework and Fiscal Strategy Paper, in October 2011.50 Projecting $6.4 billion in savings for the 2012 fiscal year, the government emphasized that part of the subsidy savings would be used to provide safety nets for the poor and to replenish the SWF for critical infrastructure spending.51 However, the government provided no further details about the timeline of the phase out or social programs to mitigate the effects of subsidy removal on the poor. Following the October announcement, the government continued to consult with stakeholders and labor groups, who threatened to protest the new policy.
Opposition from political and labor leaders centered on mistrust of the government’s ability to successfully redistribute the subsidy funds towards transparent initiatives that would benefit the Nigerian people. Conflicting accounts from the government suggested that subsidies would not automatically be removed on January 2012.52 In late December 2011, senior officials
45 House of Representatives, “Report of the Ad-Hoc Committee to Verify and Determine the Actual Subsidy Requirements and Monitor the Implementation of The Subsidy Regime in Nigeria.” 46 “Nigeria’s President Jonathan ‘Must Act over Fuel Scam.’” 47 Saharaadminfour, “Misconceptions On Fuel Subsidy By Femi Falana.” 48 Soile and Mu, “Who Benefit Most from Fuel Subsidies?” 49 World Bank, “Nigeria Economic Report,” 16. 50 “RPT-Nigeria to End Fuel Subsidies, up Capital Spending.” 51 Budget Office of the Federation, “2012-2015 Medium Term Expenditure Framework (MTEF) and Fiscal Strategy Paper (FSP).” 52 Ogunwa Samuel Adetola, “Nigeria Democracy and Oil Subsidy Removal: Lessons and Consequences,” 310.

14
continued to speak on the proposed policy, but the government refrained from setting an exact date for the planned removal.53
Thus PPPRA’s January 1 announcement of the subsidy’s formal removal, which more than doubled the pump price of $0.41/liter, came as a shock to Nigerians. Service providers were now expected to “procure products and sell in accordance with the indicative benchmark price to be published [by the PPPRA].”54 The two-week nationwide strike and protests that ensued prompted the government to quickly reinstate the subsidy, bringing pump prices down to $0.60 from the unregulated price of $0.86/liter.
President Jonathan stressed that his government would continue to pursue full deregulation, and in February 2012 he launched the Subsidy Reinvestment and Empowerment Programme (SURE-P)55, 56—a reinvestment plan designed to alleviate the burden of deregulated fuel through social programs in four areas: (1) maternal and child health services, (2) urban mass transit, (3) vocational training, and (4) public works for unemployed youth and women.57 Although SURE-P was discontinued in May 2015, savings from the subsidy reduction were allocated to SURE-P from 2012 to 2014 at an annual accrual of $1.2 billion.58 SURE-P would have been more successful, and might have survived, if subsidy reform had been more thoroughly implemented and the target population received visible benefits more quickly. Instead, the federal government’s weak credibility diminished the public’s acceptance of SURE-P as a viable and worthy alternative to the subsidy.
2.2.3. Status of reform
A new administration took office in May 2015 under President Muhammadu Buhari, promising to attack corruption rather than scrap the subsidy entirely.59 In January 2016, the government took advantage of the recent dip in international oil prices to suspend the subsidy and slowly raise fuel prices—a move the IMF applauded as fiscally wise. But in April 2016 subsidy payments resumed at $0.03 per liter and President Buhari has yet to reinstate SURE-P or a similar redistribution program to signal a complete phase out.
53 Clements et al., “Case Studies on Energy Subsidy Reform,” 52. 54 “Nigeria Announces Removal Of Petrol Subsidy.” 55 Clements et al., “Case Studies on Energy Subsidy Reform,” 52. 56 Budget Office of the Federation, “Citizen’s Guide to the Federal Budget 2014,” 27. 57 International Monetary Fund, “Nigeria: Staff Report for the 2011 Article IV Consultation,” 37. 58 Budget Office of the Federation, “Citizen’s Guide to the Federal Budget 2014,” 27. 59 “Fuel Subsidies in Nigeria: There Are Better Ways to Help the Poor (and the Economy and the Environment) | IISD.”

15
2.3. India: transforming cooking gas subsidy to a direct benefit transfer
India imports nearly 80 percent of its hydrocarbon needs and subsidizes the final products—petrol, diesel, cooking gas, and kerosene—for the consumers. Such heavy dependence on imports has left it vulnerable to external price shocks, which was painfully evident during a steep spike in international oil prices during the mid-late 2000s. To lessen its fiscal burden, the government of India embarked on a set of reforms to deregulate administered prices of petroleum products, with the exception of kerosene. Petrol prices were decontrolled in June 2010 and diesel prices in October 2014, thus bringing the market price in line with the input cost and reducing subsidies on what is known as the “oil pool account.”
The direct benefit transfer for LPG (DBTL), currently known as PAHAL,60 is the other leg of the subsidy reform agenda. After a few false starts in 2013, it now covers over 190 million beneficiaries, or over 95 percent of all households using cooking gas in the country. The strategy was to cap the number of subsidized cylinders per household per year and provide the subsidy in the form of a direct cash transfer to a designated bank account. PAHAL leveraged the opportunity provided by Aadhaar, the unique biometric ID numbers assigned to all residents, and a financial inclusion drive started in August 2014 that has opened nearly 300 million new bank accounts. Although rigorous impact evaluations at the household level are not yet available, the PAHAL scheme has relieved the fiscal burden of subsidies to a considerable extent.
2.3.1. Policy rationale, fiscal distortions, and pricing
LPG in India is primarily marketed by the three public-sector oil-marketing companies—Indian Oil Corporation Limited (IOCL), Bharat Petroleum Corporation Limited (BPCL), and Hindustan Petroleum Corporation Limited (HPCL). For household use, LPG is largely supplied in 14.2 kg cylinders, and is sold at both domestic (subsidized) and commercial (nonsubsidized) rates, with domestic sales accounting for around 80 percent of consumption in FY 2012/13.61
According to the 2011 census, less than a third of 240 million households reported LPG as their main source of cooking fuel.62 In the nationwide, large-scale sample survey conducted in 2012, the estimated number of households with cooking gas connections was around 90 million.63 There was, therefore, a difference of around 50-60 million between administrative numbers and population-level estimates vis-à-vis the number of households with LPG connections in the country.
60 More information on PAHAL can be found here: http://petroleum.nic.in/dbt/, Government of India, Ministry of Petroleum and Natural Gas 2016. 61 Petroleum Planning and Analysis Cell (PPAC), Ministry of Petroleum and Natural Gas (MoPNG) 62 Registrar General of India, Census of India 2011 63 National Sample Survey Organisation (2014), Energy Sources of Indian Households for Cooking and Lighting, 68th Round (July 2011- June 2012)

16
The data seemed to support the hypothesis that the cooking gas sector suffered from over-reporting by LPG distributors and public-sector oil-marketing companies, the presence of duplicate or “ghost” connections, and the misallocation of subsidies to urban areas and upper-income quintiles. There was a significant opportunity to reduce the total subsidy burden and to target more efficiently. Moreover, fiscal savings from subsidy reform could be reinvested in expanding the coverage of LPG to underserved rural areas; households in these areas often lack access to clean cooking fuel, and instead use biomass (firewood and dung) and kerosene that have adverse environmental and health consequences. The case for reform was strong, but it meant taking on entrenched interests, namely those who profited from the black market in LPG and the diversion of domestic LPG to commercial uses, including transportation.64 According to some estimates, the savings could be as much as US$5 billion, or nearly 40 percent of the total subsidy of US$12 billion provided in the fiscal year 2013-14.65
2.3.2. Moving to direct benefit transfer of LPG subsidy
The critical mechanism for successful implementation of DBTL was to remove price distortions in the LPG market. This was achieved by moving the point of delivery of the subsidy from the bottling plant to the consumer, who would then buy the cylinder at the market price. The subsidy amount is then transferred directly to their bank account so the net cost of the cylinder remains the same.
“The retail sales price of an LPG cylinder, or RSP build-up, is calculated on the basis of the free on board (FOB) price of LPG in the middle east region, where most shipments to India originate.” The import parity price is calculated by adding cost and freight and import charges, which determines the Refinery Transfer Price (RTP) for domestic LPG. The final retail selling price is the sum of various input costs in the production and distribution chain as well as the distributor commission. The detailed steps are provided in Table 2.
64 Barnwal, P. (2014), Curbing Leakage in Public Programs with Biometric Identification Systems: Evidence from India’s Fuel Subsidies. Manuscript. Columbia University 65 Bhattacharjee, Subhomoy, 2014.

17
Table 2: Subsidized Domestic LPG price in Delhi
Sr. No. Elements Price (Rs. (₹) /Cylinder) (1/10/2013)
Price (Rs. (₹) /Cylinder) (03/01/2016)
1 FOB Gulf Price of LPG 859.76 305.95
2 Import Parity Price 832.58 326.40
3 Refinery Transfer Price (RTP) for Domestic LPG (Price Paid by the Oil Marketing Companies to Refineries)
832.58 326.40
4 Total Desired price (incl. inland freight, marketing cost and bottling charges)
928.85 410.07
5 Subsidy by Central Government 22.58 -
6 Subsidy by oil-marketing companies (under recoveries)
532.86 -
7 Bottling Plant Price (4-5-6) 373.41 410.07
8 Retail Selling Price (including delivery charges and distributor’s commission)
410.50 513.50
9 Cash compensation on LPG by Govt. under Direct Benefit Transfer)
94.37
10 Subsidized Retail Selling Price (Effective Cost to Consumer after Subsidy on 12 cylinders/year)
410.50 419.13
Source: Petroleum Planning and Analysis Cell, Ministry of Petroleum and Natural Gas, Government of India (Please note that the highlighted rows above provide a cost comparison pre- and post-reform. The change in Bottling Plant Price, specifically, from 2013 to 2016 reflects the phase-out of the subsidy. (Exchange rate = 53.32 Rs. : 1 USD for January 2013; exchange rate = 66.26 Rs. : 1 USD for March 2016)
There are two key inferences from the data presented in Table 2. First, it shows the impact of external oil price shocks to the exchequer. Between October 2013 and March 2016, the FOB price of LPG fell by nearly one-third. Since the final subsidized cost to consumers remained the same, the total subsidy paid on each cylinder of LPG decreased from Rs.555 to Rs.94, which is only 20 percent of the previous payout. This is a direct saving on subsidies that has accrued to the exchequer.

18
Second, the point of subsidy payments is different. Before the Direct Benefit Transfer of LPG (DBTL) came into force, subsidies were incorporated in the bottling price and the retail sales price, which was, by definition, the subsidized price of LPG cylinders. Post-DBTL, the subsidy is paid directly to bank accounts of consumers, while they pay the prevailing market price, which is now the retail sales price. Moving to DBTL, therefore, has established a market price for LPG at which consumers can freely purchase LPG over and above their 12 subsidized cylinders. It also creates space for existing downstream private-sector distributors and retailers who would be able to purchase cylinders from bottling plants and sell them directly to consumers in the future, with the caveat that this should not lead to rationing of subsidized cooking gas for the consumers.
The path to the current DBTL system, however, has not been smooth. As noted earlier, the policy reform agenda evolved over a period of three years when the government tried to rein in LPG subsidies in the face of steep rises in the price of imports. On September 13, 2012, the central government announced an annual cap of six subsidized LPG cylinders per household. On January 16, 2013, following sustained political pressure, it announced an increase in the annual cylinder quota per household from six to nine. In April 2014, one month before the start of the general elections, the government again succumbed to political pressure and increased the quota to 12.
During this period, from June 2013, the government decided to phase in DBTL. The method was exactly as it is now—the consumer pays the market price and the subsidy is transferred to bank accounts linked to Aadhaar, the unique biometric ID number.
The DBTL rollout was sudden and caught both administrators and consumers by surprise. Furthermore, Aadhaar penetration was still less than 50 percent in most of the 241 districts where the program was implemented, with very low linkage of bank accounts. The approaching general elections also offered an opportunity for vested interests to block the reform. Consequently, the controversy surrounding the yearly cap and the complaints of non-receipt of DBTL led to its suspension in March 2014.
The change in government following the general elections in May 2014, paradoxically, restarted the reform agenda. The new government fast-tracked Aadhaar enrollment and launched a countrywide campaign to open new bank accounts. It also started the “GiveItUp”66 campaign, encouraging high-income households to give up their subsidy voluntarily. Consumers were also given the option of availing the subsidy without Aadhaar linkage by using a 17-digit LPG connection number and filing separate paperwork with banks and distributors. Therefore, the policy was inclusive and provided alternative options for consumers to access DBTL.
The figures released by the Government show impressive achievement over the last two years, with the caveat that these figures have not been independently verified. There are
66 More information on the “GiveItUp” campaign can be found here: http://www.givitup.in/. Government of India, Ministry of Petroleum and Natural Gas 2016.

19
currently 190.2 million beneficiaries, with a total subsidy payout of nearly US$9 billion as of February 2016. The government also claims that over 30 million duplicate connections have been terminated, saving nearly US$2 billion in subsidy payouts.
2.3.3. Analysis
These numbers look impressive. However, they do not provide information on the distributional consequences of the move to DBTL. It is certainly true that over 10.5 million people have given up their LPG subsidy voluntarily, but there is no estimate of how many of them were duplicates in the first place. For DBTL to be transformational, it needs to demonstrate that the savings are being invested to expand access to the poorest households. Providing every household access to clean energy for their daily needs should be the ultimate goal of reform.

20
3. Conclusions
There is broad consensus among economists, policy experts, and international organizations such as the IMF and the World Bank that subsidies, especially fossil fuel subsidies, are economically regressive, fiscally burdensome, and socially and environmentally harmful. Due to commodity market volatility, government expenditures on subsidies may vary drastically from year to year, potentially leading to fiscal crises during periods of price spikes. Spending on subsidies also crowds out other federal funding priorities, incentivizes inefficient consumption, exacerbates fiscal imbalances that may inhibit economic growth, blunts market signals, and indirectly promotes environmental pollution and subsequently threatens human health.
Many governments continue to sustain subsidy expenditures to appease constituents and retain political support, provide a basic safety net for the poorest households to purchase fuel, and prevent resistance or unrest that has historically followed many reform efforts. However, it is unsustainable for governments to continue promoting inefficient consumption of nonrenewable fuels while relying on subsidies as political handouts. Considering that the wealthiest households capture the majority of subsidies in developing countries, intended policy goals remain largely unfulfilled. There is mounting evidence that subsidy reform will yield major benefits. Eliminating all fossil fuel subsidies in 2013 would have led to an estimated drop in 55 percent of air pollution deaths, 21 percent less carbon emissions, 2.2 percent gain in social welfare, and a 4 percent gain in global revenue.67 As we have explored in Iran, Nigeria, and India, there are several measures that appear to be associated with more successful implementation of reform.
First, the government should clearly communicate its planned reform and ensure public support and awareness. Establishing feedback channels and addressing public concerns preemptively can reduce public resistance. In Nigeria, for example, public perceptions of government effectiveness and accountability are relatively poor. The administration realistically anticipated an adverse public reaction to its proposed policy change, and yet, the government presented its plan in pieces over only a short six-month period leading up to the implementation date. The Ministry of Finance released a short series of briefs explaining certain parts of the reform, but there was little comprehensive information shared with the public in advance of implementation. The scattered communications approach did little to build trust and improve the perception of the government’s ability to effectively manage the recovered subsidy revenue and follow through with benefits redistribution under SURE-P (IMF 2013).
Second, price increases are more manageable when phased in over a period of years. This helps households and businesses adjust gradually to pricing changes and avoid economic shocks. In Iran, for instance, the government worked with the Central Bank to ensure favorable macroeconomic conditions by curbing inflation and appreciating the currency prior to the first phase of reform pricing; however, prior to the second phase two
67 Coady et al., 2017.

21
years later, the government was unable to stabilize the economy in the same way, in large part due to damaging international sanctions. This delayed the implementation of the second phase of reform pricing until it finally took effect two years later under the Rouhani government in 2014. Iran’s adaptable approach to reform has allowed Iran’s parliament to reserve price increases for more economically stable periods and protect consumers and businesses from compound shocks.
Third, instituting a targeted transfer system can efficiently insulate poor households from price shocks while alleviating fiscal burdens. Cash transfer systems can also be tailored to countries’ contexts to capitalize on existing infrastructure. In Iran, the government built a network of ATM machines throughout the country—even in remote, rural communities—for citizens to easily withdraw their transfers. Citizens were notified repeatedly in advance of the reform date about the policy change implications and how to collect benefits under the new redistribution scheme. In India, the government designed a cash transfer system to take advantage of a universal ID system, Aadhaar, which was already in place. Having learned from the previous administration’s mistakes in attempting reform, the new government waged a communications campaign, made a push to establish bank accounts, and also created an alternative method to collect transfers outside of the Aadhaar system.
Finally, global macroeconomic conditions affect the chances of success. Although reforms require considerable political effort and management, the decline in international oil prices in recent years has increased the appetite and feasibility for reform. Low international oil prices alleviate the shock of deregulation because the gap between subsidized and market prices narrows, as has been the case since oil prices began falling in 2014.68 Lower oil and gas prices also help to reduce the government’s fiscal burden of providing direct transfers.
In summary, Table 3 below shows several indicators for subsidy policies before and after reform for each of our country case studies:
68 Benes et al., 2015, 9.

22
Table 3: Indicators of subsidy reform policies
Indicators Iran Nigeria India
Pre-reform Post-reform Pre-reform Post-reform Pre-reform Post-reform
Length of subsidy program
1980 – Dec. 2010 NA 1978 – Jan. 2012 NA 1976 – Jan. 2013 March – May 201469
Subsidy amount US$0.61 (regular petrol)
US$0.00 for regular petrol (market)
US$0.30 for regular petrol (semi-subsidized)
US$0.61 for regular petrol (government fleet only)70
US$0.37 for regular petrol71
US$0.45 for regular petrol72
Direct subsidy: ₹ US$0.42 (per 14.2 kg cylinder)
Under recoveries: US$10.01 (per 14.2 kg cylinder)73
Combined total subsidy: US$10.44
US$1.78 (cash transfer for monthly LPG purchases)
Subsidized price as a percentage of market value
87% of market price Phase I: 75% (2012)
Phase II: 25% (2014)74
Phase III: 10% (expected)
48%75 43%76, 77 56%78 18%79
Percentage of total national budget
72%80, 81 7%82 38%83, 84 41%85, 86 5%87 4%88

23
Percentage of population with access to subsidized fuel/subsidy redistribution
100% 93% 100% 0.001%89 15% 12%
Targeting institution or agency
Ministry of Oil and Energy
Targeting Subsidies Organization90
Ministry of Petroleum Resources
SURE-P (Subsidy Re-investment and Empowerment Programme)91
Ministry of Petroleum and Natural Gas
Ministry of Petroleum and Natural Gas
69 LPG subsidies were temporarily reinstated for three months from March – May 2014. 70 Post-reform, Iran created three tiers of fuel pricing: free market (IRR 7000), semi-subsidized (IRR 4000), and subsidized (IRR 1000) gasoline. Subsidized rates are only allowed for government fleets, and semi-subsidized rates are only allowed for domestically manufactured vehicles with an engine smaller than 2,000 cubic centimeters. 71 This subsidy rate varies depending on the international market price. 72 The amount of the subsidy fluctuates according to the market price. In January 2012, although subsidies had been reduced, the market rate for petrol increased from pre-reform rates. This accounts for the increase in the subsidy despite the percentage reduction of subsidies applied to petrol prices. 73 “India’s Fuel Subsidies: Q & A,” 2012. 74 “Iran: Overview,” 2015. 75 This is calculated by dividing the average subsidy amount in 2011 (₦ 59.3) by the retail value of gasoline in 2011 (₦ 124.3). 76 This is calculated by comparing the post-reform semi-subsidized rate with the free market rate in 2011. 77 A complete removal of the subsidy was only in place for two weeks before civil unrest pushed the government to reinstate part of the subsidy. Therefore, the pump price was set at ₦97 for the majority of 2012, while the prevailing market price was ₦169.13. “A Citizen’s Guide to Energy Subsidies in Nigeria.” 2012. 78 This is calculated by comparing the subsidized retail selling price to the total desired price in the 2013 column of Table 2. 79 This is calculated by comparing the subsidized retail selling price to the retail selling price in the 2016 column of Table 2. The total subsidy/cash transfer amount decreased from about INR 555 in 2013 to about INR 94 in 2016. LPG sales prices vary by location; for our purposes, we focus on Delhi’s rates. More information on historical pricing of 14.2 kg LPG containers can be found here: https://www.iocl.com/products/indanegas.aspx. 80 Iran paid US$66 billion for subsidies in FY 2009-2010. The total government budget was US$92 billion. “Subsidy Watch.” Issue 42, February 2011. 81 “Iran Budget Law for Year 2009-2010 (1388).” 2016. 82 Subsidies only accounted for US$38.2 billion FY 2011-2012. 83 Subsidies accounted for US$8billion of a total of US$21.1 billion in annual expenditure in FY 2011-2012.

24
“Factbox: Nigeria's $6.8 billion fuel subsidy scam,” 2012. 84 Akpodiete, Alex O. Atawa. 2012. 85 Subsidies accounted for $$10 billion of $24.5 billion in annual expenditures in FY 2011-2012. “Nigeria's Senate passes N4.8trn 2012 budget,” 2012. 86 The $10 billion subsidy figure is calculated based on a projection by the IMF. The projection of ₦ 1.57 trillion was converted to USD based on the foreign exchange rate in Dec. 2012 (₦ 155.9/$1). 87 Subsidies accounted for about US$12 billion of US$250 billion in annual expenditures in FY 2013-2014. “Key Feature Budget 2013-2014.” 88 Subsidies accounted for about US$10 billion of US$265 billion in annual expenditure of in FY 2014-2015. “Budget Estimates,” 2015. 89 There were initially only about 200,000 recipients of SURE-P. 90 This is a private company that was created by the Iranian government to implement cash distribution as part of the country’s subsidy reform policy. 91 For more information on the SURE-P Committee or its formation, refer to the website here: http://sure-p.gov.ng/history/.

25
4. References
“A Citizens’ Guide to Energy Subsidies in Nigeria.” Global Subsidies Initiative. Winnipeg: International Institute for Sustainable Development. September 2012. http://www.iisd.org/gsi/sites/default/files/ffs_nigeria_czguide.pdf.
Adenikinju, Adeola. “Energy Pricing and Subsidy Reforms in Nigeria.” 2009. https://search.oecd.org/tad/events/42987402.pdf.
“Agricultural Subsidies Remain a Staple in the Industrial World.” 2016. http://www.worldwatch.org/agricultural-subsidies-remain-staple-industrial-world-0.
Anderson, Jon Lee. “Can Iran Change?” The New Yorker. April 13, 2009. http://www.newyorker.com/magazine/2009/04/13/can-iran-change.
Budget Office of the Federation. “2012-2015 Medium Term Expenditure Framework (MTEF) and Fiscal Strategy Paper (FSP),” October 2011. http://budgetoffice.gov.ng/pdfs/2012-2015+FSP_+website+version.pdf.
“Citizen’s Guide to the Federal Budget 2014.” Federal Ministry of Finance, n.d. http://www.budgetoffice.gov.ng/pdfs/2014/Citizen’s%20Guide%20to%20the%20Federal%20Budget.pdf.
“Chapter 2: The effects of subsidies.” Global Subsidies Initiative. 2017. http://www.iisd.org/gsi/effects-subsidies.
Clements, Benedict et al. “Case Studies on Energy Subsidy Reform: Lessons and Implications,” January 28, 2013. http://www.greenfiscalpolicy.org/wp-content/uploads/2013/08/Case-Studies-on-Energy-Subsidy-Reform.-Lessons-and-Implications.pdf.
Coady, David et al. “How Large Are Global Fossil Fuel Subsidies?” Elsevier: World Development 90. March 2017. http://www.sciencedirect.com/science/article/pii/S0305750X16304867.
Demirkol, Ozgur et al. “Targeted Subsidy Reform in Iran.” International Monetary Fund. April 2014. https://www.imf.org/external/pubs/ft/scr/2014/cr1494.pdf.
“Fuel Subsidies in Nigeria: There Are Better Ways to Help the Poor (and the Economy and the Environment) | IISD.” July 23, 2015. https://www.iisd.org/blog/fuel-subsidies-nigeria-there-are-better-ways-help-poor-and-economy-and-environment.
“GDP (current US$).” World Bank. 2016. http://data.worldbank.org/indicator/NY.GDP.MKTP.CD.
Hassanzadeh, Elham. “Iran's Subsidies Reform.” Oxford Insitute for Energy Studies. 2014. https://www.esmap.org/sites/esmap.org/files/DocumentLibrary/Session%202%20-%20Iran_energy%20subsidies-Hassanzadeh_ESMAP_KEF.pdf.
Harris, K. The Politics of Subsidy Reform in Iran. Middle East Report 40. 2010. House of Representatives. “Report of the Ad-Hoc Committee to Verify and Determine the
Actual Subsidy Requirements and Monitor the Implementation of Teh Subsidy Regime in Nigeria,” April 18, 2012. http://www.premiumtimesng.com/docs_download/KGB%202015%20subsidy.pdf.
“International Energy Statistics.” Energy Information Administration. n.d. http://www.eia.gov/cfapps/ipdbproject/iedindex3.cfm?tid=5&pid=62&aid=2&cid=NI,&syid=2010&eyid=2014&unit=TBPD.
26
Khalaj, Monavar. “Iran sees boom in cross-border fuel and goods smuggling.” Financial Times. May 8, 2013. https://www.ft.com/content/235e02e4-b7dd-11e2-9f1a-00144feabdc0.
“Nigeria Announces Removal of Petrol Subsidy.” Sahara Reporters. January 18, 2013. http://saharareporters.com/2012/01/01/nigeria-announces-removal-petrol-subsidy.
“Nigeria Economic Report.” World Bank. November 2015. “Nigeria: Fuel Subsidy.” Center for Public Policy Alternatives. 2015.
http://cpparesearch.org/wp-content/uploads/2015/01/Fuel-Subsidy_Study-Report_2011.pdf.
“Nigeria’s President Jonathan ‘Must Act over Fuel Scam.’” BBC News. May 29, 2012. http://www.bbc.com/news/world-africa-18238973.
“Nigeria : Staff Report for the 2011 Article IV Consultation.” International Monetary Fund. Country Report No. 12/194. July 24, 2012.
Ogunwa Samuel Adetola. “Nigeria Democracy and Oil Subsidy Removal: Lessons and Consequences.” Journal of Social Sciences and Humanities 1, no. 4: 308–22. September 2015.
Okonjo-Iweala, Ngozi. “Brief on Fuel Subsidy.” Presented at the FMF/BOF/CEA, Abuja. 2011.
Okoroafor, Thia. “The 52-Year Long (ongoing) Project That Is Nigeria’s Oil Refineries.” Ventures Africa. September 4, 2015. http://venturesafrica.com/the-52-year-long-ongoing-project-that-is-nigerias-oil-refineries/.
Roudi, Farzaneh. “Iran is Reversing Its Population Policy.” Wilson Center. August 2012. https://www.wilsoncenter.org/sites/default/files/iran_is_reversing_its_population_policy.pdf.
“RPT-Nigeria to End Fuel Subsidies, up Capital Spending.” Reuters UK. October 5, 2011. http://uk.reuters.com/article/nigeria-budget-idUKL5E7L51P820111005.
Saharaadminfour. “Misconceptions On Fuel Subsidy By Femi Falana.” Sahara Reporters, November 3, 2011. http://saharareporters.com/2011/11/03/misconceptions-fuel-subsidy-femi-falana.
Salehi-Isfahani, Djavad. “Iran: Subsidy Reform amid Regional Turmoil.” Brookings. March 3, 2011. https://www.brookings.edu/opinions/iran-subsidy-reform-amid-regional-turmoil/.
Soile, Ismail, and Xiaoyi Mu. “Who Benefit Most from Fuel Subsidies? Evidence from Nigeria.” Energy Policy 87: 314–24. December 2015.
Taghizadeh, Reza. “Sanctions and Iran's Achilles Heel.” June 9, 2010. http://www.rferl.org/a/Sanctions_And_Irans_Achilles_Heel/2066744.html
US Energy Information Administration. “Country Analysis Brief: Nigeria,” February 27, 2015. http://www.eurasiareview.com/28022015-nigeria-energy-profile-largest-oil-producer-in-africa-analysis/.
Verme, Paolo et al. The Quest for Subsidy Reforms in the Middle East and North Africa Region. Washington, DC: Springer, 2017. Wagner, Armin. “International Fuel Prices 2014.” Deutsche Gesellschaft für Internationale
Zusammenarbeit. 2015. https://www.giz.de/expertise/downloads/giz-2015-en-ifp2014.pdf.

27
Whitley, Shelagh. “Time to change the game,” Overseas Development Institute. 2013. https://web.archive.org/web/20131225094615/http://www.odi.org.uk/sites/odi.org.uk/files/odi-assets/publications-opinion-files/8668.pdf.
28
5. Appendix
Figure A1: A History of PMS Price Adjustments in Nigeria (1978 – 2012)