ch12 highway concepts - university of idaho materials/hcm2k12.pdf · highway capacity manual 2000...
TRANSCRIPT

Highway Capacity Manual 2000
12-i Chapter 12 - Highway Concepts
CHAPTER 12
HIGHWAY CONCEPTS
CONTENTS
I. INTRODUCTION..................................................................................................... 12-1II. MULTILANE HIGHWAYS........................................................................................ 12-1
Multilane Highway Capacity ............................................................................. 12-2Free-Flow Speed.............................................................................................. 12-2Relationships Between Highway Types ........................................................... 12-3Speed-Flow and Density-Flow Relationships................................................... 12-3Factors Affecting FFS ...................................................................................... 12-3
Lane Width and Lateral Clearance............................................................ 12-4Median Type ............................................................................................. 12-5Access Points............................................................................................ 12-6Other Factors ............................................................................................ 12-6
Factors Affecting Flow Rate ............................................................................. 12-7Heavy Vehicles ......................................................................................... 12-7Driver Population ...................................................................................... 12-7
LOS .................................................................................................................. 12-7Required Input Data and Estimated Values ..................................................... 12-8
Lane Width and Lateral Clearance............................................................ 12-8Median ...................................................................................................... 12-9Access-Point Density ................................................................................ 12-9Specific Grade or General Terrain ............................................................ 12-9Base FFS ................................................................................................ 12-10Length of Analysis Period ....................................................................... 12-10PHF......................................................................................................... 12-10Percentage of Heavy Vehicles ................................................................ 12-10Driver Population Factor ......................................................................... 12-10
Service Volume Table .................................................................................... 12-10III. TWO-LANE HIGHWAYS....................................................................................... 12-11
Classification of Two-Lane Highways ............................................................ 12-12Base Conditions ............................................................................................. 12-13Basic Relationships ........................................................................................ 12-13Passing Lanes on Two-Lane Highways ......................................................... 12-15LOS ................................................................................................................ 12-15Required Input Data and Estimated Values ................................................... 12-17
Highway Classes .................................................................................... 12-17Lane Width and Shoulder Width ............................................................. 12-17Access-Point Density .............................................................................. 12-17Specific Grade or General Terrain .......................................................... 12-17Percentage of No-Passing Zones ........................................................... 12-17Base FFS ................................................................................................ 12-18Length of Passing Lane .......................................................................... 12-18Length of Analysis Period ....................................................................... 12-18PHF......................................................................................................... 12-18Directional Split ....................................................................................... 12-18Percentage of Heavy Vehicles ................................................................ 12-19
Service Volume Table .................................................................................... 12-19IV. REFERENCES ...................................................................................................... 12-19

Highway Capacity Manual 2000
Chapter 12 - Highway Concepts 12-ii
EXHIBITS
Exhibit 12-1. Speed-Flow Relationships on Multilane Highways ............................... 12-4Exhibit 12-2. Density-Flow Relationships on Multilane Highways .............................. 12-4Exhibit 12-3. Required Input Data for Multilane Highways......................................... 12-9Exhibit 12-4. Default Access-Point Density ................................................................ 12-9Exhibit 12-5. Example Service Volumes for Multilane Highways ............................. 12-11Exhibit 12-6. Speed-Flow and Percent Time-Spent-Following Flow
Relationships for Two-Way Segments with Base Conditions .............. 12-14Exhibit 12-7. Speed-Flow and Percent Time-Spent-Following Flow
Relationships for Directional Segments with Base Conditions............ 12-15Exhibit 12-8. Plan View of a Typical Passing Lane .................................................. 12-15Exhibit 12-9. Required Input Data: Two-Lane Highways ......................................... 12-17Exhibit 12-10. Summary of Two-Lane Highway Classes ........................................... 12-17Exhibit 12-11. Default Values for Percentage of No-Passing Zones.......................... 12-18Exhibit 12-12. Optimal Lengths of Passing Lanes ..................................................... 12-18Exhibit 12-13. Default Values for Directional Split on Two-Lane Highways ............... 12-18Exhibit 12-14. Default Heavy-Vehicle Percentages on Two-Lane Highways............. 12-19Exhibit 12-15. Example Service Volumes for a Class I Two-Lane Rural Highway .... 12-19

Highway Capacity Manual 2000
12-1 Chapter 12 - Highway ConceptsIntroduction
I. INTRODUCTION
This chapter introduces capacity and quality-of-service concepts for highwayfacilities with points of access that are not fully controlled. This chapter can be used inconjunction with Chapter 20, which provides a methodology for two-lane highways, andChapter 21, which provides a methodology for multilane highways.
II. MULTILANE HIGHWAYSTraffic signals spaced at 2.0mi or less create urban streetconditions
Multilane highways generally have posted speed limits of 40 to 55 mi/h. Theyusually have a total of four or six lanes, counting both directions, often with medians ortwo-way left-turn lanes (TWLTL); however, they also may be undivided.
Multilane highways typically are located in suburban communities, leading intocentral cities, or along high-volume rural corridors connecting two cities or twosignificant activities that generate a substantial number of daily trips. Such highwaysoften have traffic signals; but traffic signals spaced at 2.0 mi or less typically create urbanstreet conditions.
Traffic volumes on multilane highways vary but might range from 15,000 to 40,000veh/day. In some cases, volumes as high as 100,000 veh/day have been observed whenaccess across the median is restricted and when all major crossings are grade separated.
Illustrations 12-1 through 12-4 show typical multilane highways.
ILLUSTRATION 12-1. Divided multilane highway in arural environment.
ILLUSTRATION 12-2. Divided multilane highway in asuburban environment.

Highway Capacity Manual 2000
Chapter 12 - Highway Concepts 12-2Multilane Highways
ILLUSTRATION 12-3. Undivided multilane highway in arural environment.
ILLUSTRATION 12-4. Undivided multilane highway in asuburban environment.
MULTILANE HIGHWAY CAPACITY
Multilane highways in suburban and rural settings have different operationalcharacteristics from freeways, urban streets, and two-lane highways. Most notably,multilane highways are not completely access controlled—they can have at-gradeintersections and occasional traffic signals.
Multilane highways canbe similar to freeways orcan approach urbanstreet conditions
Friction caused by opposing vehicles on undivided highways and the access toroadside development contribute to a different operational setting from that of freeways.Multilane highways range from the uninterrupted flow of freeways to the flow conditionson urban streets, which are frequently interrupted by signals.
The capacity of a multilane highway is the maximum sustained hourly flow rate atwhich vehicles reasonably can be expected to traverse a uniform segment underprevailing roadway and traffic conditions.
FREE-FLOW SPEED
Free-flow speed (FFS) is the speed of traffic at low volume and low density. It is thespeed at which drivers feel comfortable traveling under the physical, environmental, andtraffic-control conditions on an uncongested section of multilane highway. Free-flowspeeds will be lower on sections of highway with restricted vertical or horizontalalignments. FFS tend to be lower when posted speed limits are lower. The importance of

Highway Capacity Manual 2000
12-3 Chapter 12 - Highway ConceptsMultilane Highways
FFS is that it is the starting point for analyzing capacity and level of service (LOS) foruninterrupted-flow conditions.
Field studies of FFSField determination of FFS requires travel time studies during periods of low-to-moderate volume. Operating speed, as defined in previous capacity manuals and indocuments produced by the American Association of State Highway and TransportationOfficials, is similar to FFS under low-volume conditions. For multilane highways, theupper limit for low volume is 1,400 passenger cars per hour per lane (pc/h/ln).
The FFS for multilane highways is the mean speed of passenger cars under low-to-moderate traffic flow. The LOS for multilane highways is based on density, which iscalculated by dividing per-lane flow by speed.
RELATIONSHIPS BETWEEN HIGHWAY TYPES
Certain characteristics distinguish multilane suburban and rural highways fromfreeways. Vehicles may enter or leave multilane highways at intersections anddriveways, and they can encounter traffic signals.
Design standards for multilane highways tend to be lower than those for freeways,although a multilane highway approaches freeway conditions as its access points andturning volumes approach zero. Moreover, the visual setting and the developed frontagealong multilane highways have a greater impact on drivers than they do along freeways.
The multilane highway is similar to urban streets in many respects, although it lacksthe regularity of traffic signals and tends to have greater control on the number of accesspoints per mile. Also, its design standards are generally higher than those for urbanstreets. The speed limits on multilane highways are often 5 to 15 mi/h higher than speedlimits on urban streets. Pedestrian activity, as well as parking, is minimal, unlike onurban streets.
Multilane highways differ substantially from two-lane highways, principally becausea driver on a multilane highway is able to pass slower-moving vehicles without usinglanes designated for oncoming traffic. Multilane highways also tend to be located nearurban areas and often connect urban areas; they usually have better design features thantwo-lane highways, including horizontal and vertical curvature.
SPEED-FLOW AND DENSITY-FLOW RELATIONSHIPS
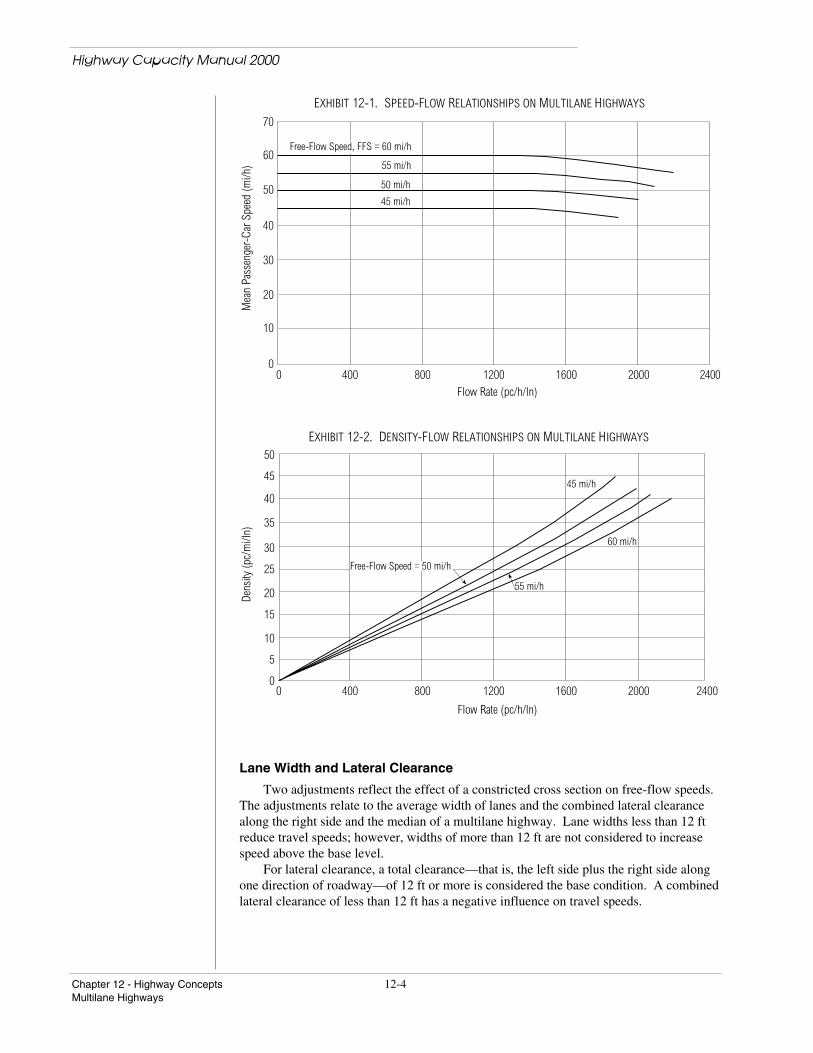
The speed-flow and density-flow relationships for a typical uninterrupted-flowsegment on a multilane highway under either base or nonbase conditions in which theFFS is known are shown in Exhibits 12-1 and 12-2. Because drivers on multilanehighways allow for potential conflicts with turning traffic—even when there are noaccess points in the immediate vicinity—the operating characteristics may be slightly lessfavorable than for a freeway.
As indicated in Exhibit 12-1, the speed of traffic on a multilane highway is notaffected by traffic volume with a flow rate of less than 1,400 pc/h/ln. As the exhibitshows, the capacity of a multilane highway under base conditions is 2,200 pc/h/ln forhighways with an FFS of 60 mi/h. For flow rates of 1,400 to 2,200 pc/h/ln, the speed ona multilane highway with an FFS of 60 mi/h drops by 5 mi/h. Exhibit 12-2 shows thatdensity varies continuously throughout the range of flow rates.
The capacity value of 2,200 pc/h/ln represents the maximum 15-min flow rateaccommodated under base conditions for highways with an FFS of 60 mi/h. Capacitieson specific multilane highways may vary.
FACTORS AFFECTING FFS
Several traffic control, physical, and traffic conditions affect the FFS along amultilane highway. These conditions are described in the following sections.
Highway Capacity Manual 2000
Chapter 12 - Highway Concepts 12-4Multilane Highways
EXHIBIT 12-1. SPEED-FLOW RELATIONSHIPS ON MULTILANE HIGHWAYS
0 400 800 1200 1600 2000 2400
70
60
50
40
30
20
10
0
Free-Flow Speed, FFS = 60 mi/h
55 mi/h
50 mi/h
45 mi/h
Flow Rate (pc/h/ln)
Mea
n Pa
ssen
ger-
Car S
peed
(mi/h
)
EXHIBIT 12-2. DENSITY-FLOW RELATIONSHIPS ON MULTILANE HIGHWAYS
0 400 800 1200 1600 2000 2400
Flow Rate (pc/h/ln)
Dens
ity (p
c/m
i/ln)
50
45
40
35
30
25
20
15
10
5
0
Free-Flow Speed = 50 mi/h
45 mi/h
60 mi/h
55 mi/h
Lane Width and Lateral Clearance
Two adjustments reflect the effect of a constricted cross section on free-flow speeds.The adjustments relate to the average width of lanes and the combined lateral clearancealong the right side and the median of a multilane highway. Lane widths less than 12 ftreduce travel speeds; however, widths of more than 12 ft are not considered to increasespeed above the base level.
For lateral clearance, a total clearance—that is, the left side plus the right side alongone direction of roadway—of 12 ft or more is considered the base condition. A combinedlateral clearance of less than 12 ft has a negative influence on travel speeds.

Highway Capacity Manual 2000
12-5 Chapter 12 - Highway ConceptsMultilane Highways
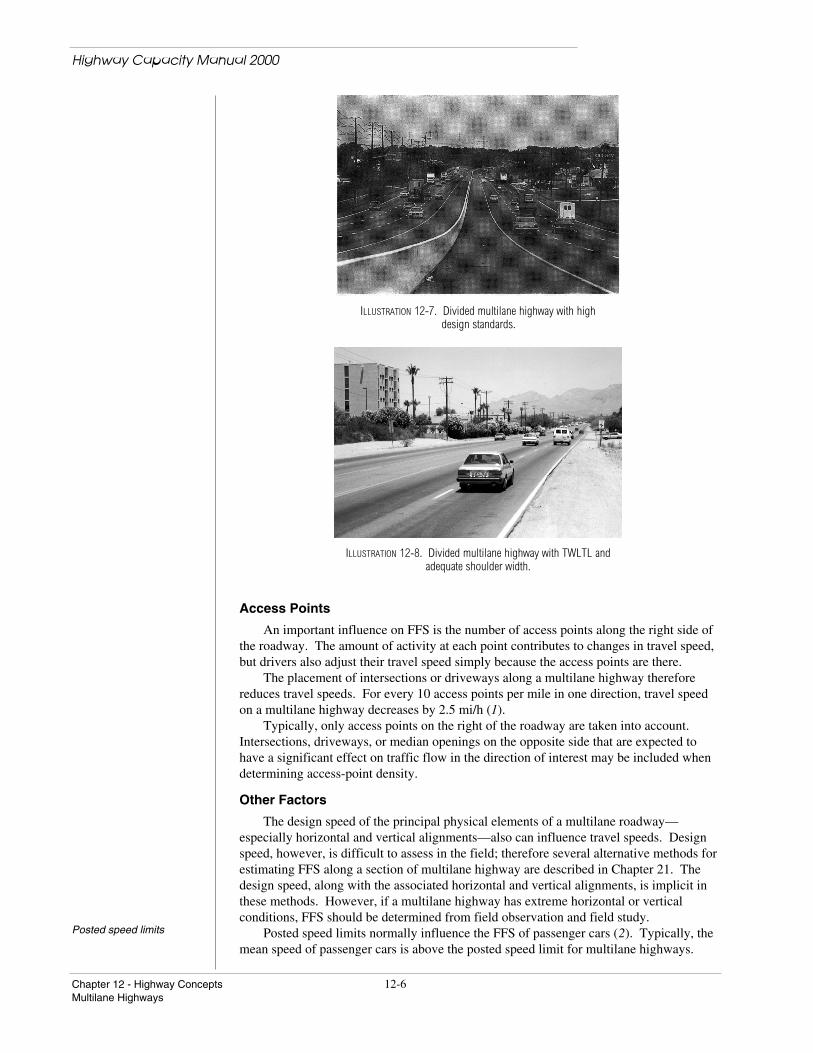
Roadside obstructionsWhether roadside and median objects and barriers present true obstructions is amatter of judgment. These obstructions might be continuous—such as a retaining wall—or not continuous—such as light supports or bridge abutments. In some cases, driversbecome accustomed to certain types of obstructions, so that the effect on traffic flowbecomes negligible. For example, continuous reinforced-concrete and W-beam barriershave little or no impact on speeds, even when less than 6 ft from the travel lanes.Illustrations 12-5 through 12-8 show various types of roadside and median treatments thatcan affect the flow on multilane highways.
Median Type
Typically, there are three types of medians along multilane rural and suburbanhighways:
• Undivided medians composed of a striped centerline;• TWLTL medians composed of a full-width lane; and• Medians composed of a raised curb, barrier, or natural terrain or landscaping.A raised curb in the median, even when interrupted with regular openings should be
considered a raised median; however, short sections of raised or flush median (less than500 ft long) should not.
ILLUSTRATION 12-5. Bridge pier in center of normally undividedsuburban multilane highway.
ILLUSTRATION 12-6. Inadequate shoulder width and other obstructionsalong multilane highway.
Highway Capacity Manual 2000
Chapter 12 - Highway Concepts 12-6Multilane Highways
ILLUSTRATION 12-7. Divided multilane highway with highdesign standards.
ILLUSTRATION 12-8. Divided multilane highway with TWLTL andadequate shoulder width.
Access Points
An important influence on FFS is the number of access points along the right side ofthe roadway. The amount of activity at each point contributes to changes in travel speed,but drivers also adjust their travel speed simply because the access points are there.
The placement of intersections or driveways along a multilane highway thereforereduces travel speeds. For every 10 access points per mile in one direction, travel speedon a multilane highway decreases by 2.5 mi/h (1).
Typically, only access points on the right of the roadway are taken into account.Intersections, driveways, or median openings on the opposite side that are expected tohave a significant effect on traffic flow in the direction of interest may be included whendetermining access-point density.
Other Factors
The design speed of the principal physical elements of a multilane roadway—especially horizontal and vertical alignments—also can influence travel speeds. Designspeed, however, is difficult to assess in the field; therefore several alternative methods forestimating FFS along a section of multilane highway are described in Chapter 21. Thedesign speed, along with the associated horizontal and vertical alignments, is implicit inthese methods. However, if a multilane highway has extreme horizontal or verticalconditions, FFS should be determined from field observation and field study.
Posted speed limits Posted speed limits normally influence the FFS of passenger cars (2). Typically, themean speed of passenger cars is above the posted speed limit for multilane highways.

Highway Capacity Manual 2000
12-7 Chapter 12 - Highway ConceptsMultilane Highways
The posted speed limit correlates significantly with the speed at which vehicles movealong the highway. When no other estimate is available, the FFS can be calculated basedon the posted speed limit.
Vehicular speeds, and the proportion of vehicles exceeding the speed limit, areaffected by speed enforcement. However, several studies (3–5) have found thatenforcement effects are limited, both temporally and spatially. The effect of enforcementdepends on its type and duration. In general, a stationary enforcement activity affects nomore than a 8 to 10 mi of roadway; moreover, its effect decays exponentiallydownstream. Nonetheless, the speeds at the site may be affected for up to 2 to 3 daysafterwards. If the roadway is located in a community that regularly enforces speed limits,local measurements can be used to calibrate the relationship between 85th-percentilespeed and FFS. These measurements should be taken, therefore, when the averageanticipated enforcement efforts are under way.
FACTORS AFFECTING FLOW RATE
The volume estimate is adjusted by factors relating to both the composition andfluctuation of traffic, so that all roadways can be compared with an equivalent measure ofpassenger cars per hour per lane (pc/h/ln).
Peak-hour factorThe basis for traffic volumes is a 15-min peak-period flow during a peak hour of theday. Therefore, volumes in two time periods are required: a peak-hour volume and theflow rate within the peak 15 min of the peak hour. The hourly volume divided by thepeak-hour factor (PHF) yields a flow rate. The PHF is the ratio of total hourly volume tofour times the highest 15-min volume within the peak hour.
Heavy Vehicles
The second adjustment to the volume relates to heavy vehicles—the number oftrucks, buses, and recreational vehicles (RVs) are converted into an equivalent number ofpassenger cars. Two categories of heavy vehicles are used: trucks and RVs. For analysispurposes, buses on multilane highways are categorized as trucks.
Converting heavy vehicles to equivalent passenger cars is especially important whenanalyzing sections of highway with grades. On level terrain and for near-capacityconditions, trucks, buses, and RVs tend to operate like passenger cars, so that theequivalency factor approaches 1.
Driver Population
The base conditions for multilane highway flow include a driver population primarilyof commuters. Studies have shown that commuter and noncommuter driver populationsdo not display the same characteristics. Capacities for recreational traffic can be up to 20percent lower than for commuter traffic on the same highway; however, the FFS does notseem to be similarly affected. If this possible effect of driver population is taken intoaccount, locally derived data should be obtained and used carefully, according to themethodology for multilane highways.
LOS
A multilane highway is characterized by three performance measures:• Density, in terms of passenger cars per mile per lane;• Speed, in terms of mean passenger car speed; and• Volume to capacity ratio.
Each of these measures indicates how well the highway accommodates traffic flow.Density defines LOS formultilane highways
Density is the assigned primary performance measure for estimating LOS. The threemeasures of speed, density, and flow or volume are interrelated. If the values of two ofthese measures are known, the remaining measure can be computed.
LOS A describes completely free-flow conditions. The operation of vehicles isvirtually unaffected by the presence of other vehicles, and operations are constrained only

Highway Capacity Manual 2000
Chapter 12 - Highway Concepts 12-8Multilane Highways
by the geometric features of the highway and by driver preferences. Maneuverabilitywithin the traffic stream is good. Minor disruptions to flow are easily absorbed without achange in travel speed.
LOS B also indicates free flow, although the presence of other vehicles becomesnoticeable. Average travel speeds are the same as in LOS A, but drivers have slightlyless freedom to maneuver. Minor disruptions are still easily absorbed, although localdeterioration in LOS will be more obvious.
In LOS C, the influence of traffic density on operations becomes marked. Theability to maneuver within the traffic stream is clearly affected by other vehicles. Onmultilane highways with an FFS above 50 mi/h, the travel speeds reduce somewhat.Minor disruptions can cause serious local deterioration in service, and queues will formbehind any significant traffic disruption.
At LOS D, the ability to maneuver is severely restricted due to traffic congestion.Travel speed is reduced by the increasing volume. Only minor disruptions can beabsorbed without extensive queues forming and the service deteriorating.
LOS E represents operations at or near capacity, an unstable level. The densitiesvary, depending on the FFS. Vehicles are operating with the minimum spacing formaintaining uniform flow. Disruptions cannot be dissipated readily, often causing queuesto form and service to deteriorate to LOS F. For the majority of multilane highways withFFS between 45 and 60 mi/h, passenger-car mean speeds at capacity range from 42 to 55mi/h but are highly variable and unpredictable.
LOS F represents forced or breakdown flow. It occurs either when vehicles arrive ata rate greater than the rate at which they are discharged or when the forecast demandexceeds the computed capacity of a planned facility. Although operations at thesepoints—and on sections immediately downstream—appear to be at capacity, queues formbehind these breakdowns. Operations within queues are highly unstable, with vehiclesexperiencing brief periods of movement followed by stoppages. Travel speeds withinqueues are generally less than 30 mi/h. Note that the term LOS F may be used tocharacterize both the point of the breakdown and the operating condition within thequeue.
For a detailed discussionof flow breakdown onuninterrupted-flowfacilities, see Chapter 13,“Freeway Concepts”
Although the point of breakdown causes the queue to form, operations within thequeue generally are not related to deficiencies along the highway segment.
REQUIRED INPUT DATA AND ESTIMATED VALUES
Exhibit 12-3 lists the default values that may be used for input parameters in theabsence of local data. However, taking field measurements for use as inputs to ananalysis is the most reliable means of generating parameter values. Only when this is notfeasible should default values be considered.
Lane Width and Lateral Clearance
Field inspection, aerial photos, as-built plans, and local highway operating agencypolicies are sources of information for existing facilities. The standard lane width fornew highway construction in the United States is 12 ft. The standard shoulder width is 6ft (6). These standards may be reduced to accommodate special historical,environmental, or topographical constraints. In Canada, the standard lane width is 12.1 ft(3.7 m).
Default values of 12 ft for lane widths and 6 ft for lateral clearance may be used inthe absence of field data or local data. If lane widths vary within a segment, either thesegment should be split into subsegments of uniform widths or the distance-weightedaverage of the lane widths should be computed and used to determine the effects on FFS.

Highway Capacity Manual 2000
12-9 Chapter 12 - Highway ConceptsMultilane Highways
EXHIBIT 12-3. REQUIRED INPUT DATA FOR MULTILANE HIGHWAYS
Required Data Default
Geometric Data
Number of lanes -Lane width 12 ftLateral clearance 6 ftMedian (Yes/No) -Access-point density Exhibit 12-4Specific grade or general terrain LevelBase FFS 60 mi/h
Demand
Length of analysis period 15 minPHF 0.88 rural, 0.92 urbanHeavy vehicles (%) 10% rural, 5% urbanDriver population factor 1.00
The same weighted averaging method may be used if there are only minor variationsin lane width within a segment, or for varying shoulder or median widths. However, ifvariations in lane or shoulder widths extend for 2,500 ft or more, the segment should bedivided into shorter segments with consistent physical features.
Median
Either a divided or undivided highway must be selected for analysis. In estimatingFFS, there is no distinction among two-way left-turn lanes, unpaved medians, landscapedmedians, and medians with barriers—all are considered divided highways. An undividedhighway has an FFS about 2 mi/h slower than that of a divided highway. The FFS affectsthe facility’s estimated capacity.
Access-Point Density
Access-point density is the total number of active intersections and driveways on theright side of the road divided by the length of the facility. The density should beaveraged over a minimum of 3 mi if data are available. In the absence of local data,default values from Exhibit 12-4 may be used.
EXHIBIT 12-4. DEFAULT ACCESS-POINT DENSITY
Development Type Default Value Access Points/mi (one side)
Rural 8 0–10Low-Density Suburban 16 11–20High-Density Suburban 25 ≥ 21
Specific Grade or General Terrain
The general terrain type can be used instead of the specific grade, if there is no singlegrade on the segment that extends for more than 1 mi or that exceeds 3 percent for morethan 0.5 mi.
The maximum extended grade for rural highways ranges between 5 percent and 8percent (6) in mountainous terrain. Lower maximum grades of 3 percent to 5 percent arespecified for highways in level terrain. The higher grades within each range typify lower-speed facilities with FFS less than 50 mi/h.
If field measurement is not possible, and construction plans are not available,extended grades can be approximated using the analyst’s general knowledge of the local

Highway Capacity Manual 2000
Chapter 12 - Highway Concepts 12-10Multilane Highways
terrain. In the absence of local data, default values of 3 percent may be used for anextended grade in otherwise level terrain, 5 percent for an extended grade in rollingterrain, and 7 percent for an extended grade in mountainous terrain.
Base FFS
If field measurements are unavailable, FFS can be estimated by applying adjustmentsto a base FFS. A base FFS of 60 mi/h may be used for a rural or a suburban multilanehighway. The base FFS must be reduced to account for the effects of lateral clearance atthe shoulder and median, median type, lane width, and density of access points.
Length of Analysis Period
The planning, design, and analysis policies, and the available resources of an agencywill determine the length of the analysis period or periods. The analyst may want toevaluate the peak hours occurring during the morning commute, midday, and eveningcommute on a typical weekday, or perhaps a peak hour during a Saturday or Sunday ifthe roadway segment carries a high volume of weekend recreational traffic. Within eachhour analyzed, the highest 15-min volume is of primary interest. A PHF is applied toconvert the hourly volume to a peak 15-min flow rate. Chapter 8 describes a procedure tocompute peak direction and peak-hour demand from an average daily traffic volume.
PHF
The ratio of hourly demand to four times the peak 15-min demand typically rangesfrom 0.75 to 0.95. The higher values tend to occur as demand approaches capacity on thefacility. Default values of 0.88 for rural areas and 0.92 for urban areas may be used in theabsence of local data.
Percentage of Heavy Vehicles
The local Highway Performance Management System (HPMS) may be used toobtain local information on the percentage of heavy vehicles by facility and area type. Ifthe relative proportions of RVs, trucks, and buses are not known, the heavy vehicles canbe considered trucks when determining passenger-car equivalents and computing theheavy-vehicle adjustment factor. In the absence of local data, a default value of 5 percentheavy vehicles—including all types—may be used for urban areas, and 10 percent forrural areas.
Driver Population Factor
The reciprocal of the driver population factor is used to increase the flow rate toaccount for a driver population not familiar with the multilane highway. The factorshould normally be 1.00 but can be reduced to 0.85 for the analysis of weekendconditions in a recreational area.
SERVICE VOLUME TABLE
Exhibit 12-5 can be used to estimate the number of lanes required to provide adesired LOS for default conditions. The impact of different FFS, the truck percentage,and the type of terrain also can be determined from this exhibit.
Highway Capacity Manual 2000
12-11 Chapter 12 - Highway ConceptsMultilane Highways
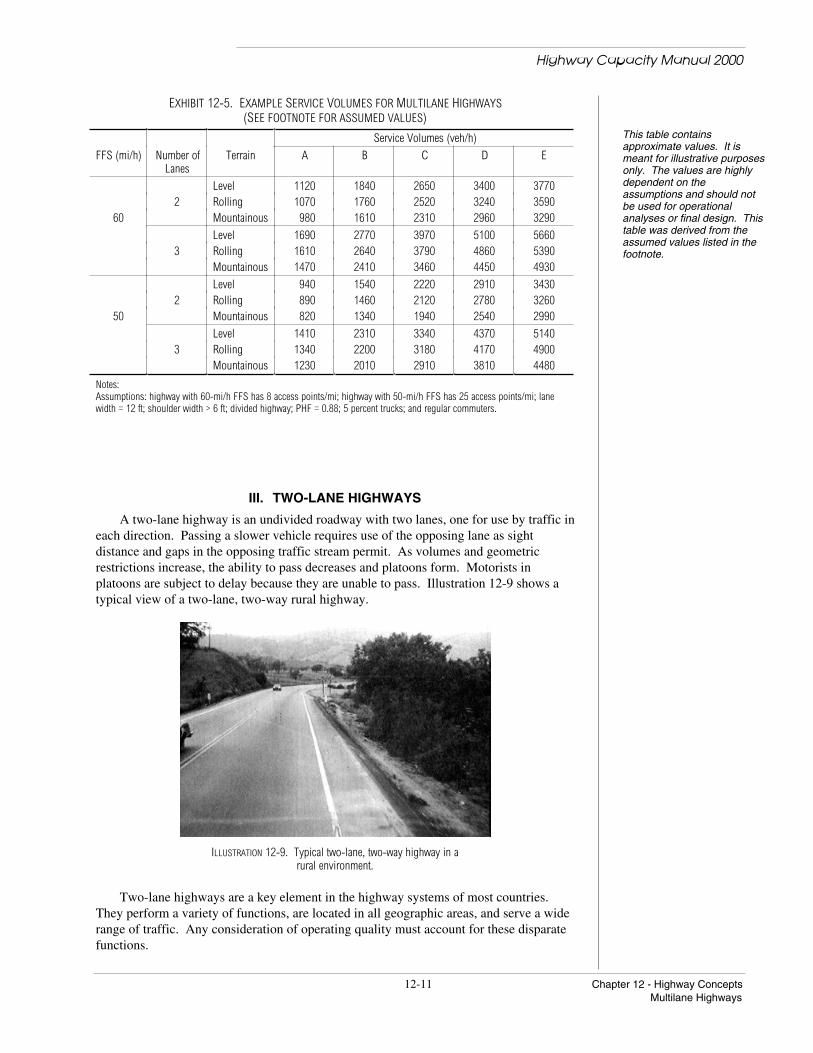
EXHIBIT 12-5. EXAMPLE SERVICE VOLUMES FOR MULTILANE HIGHWAYS(SEE FOOTNOTE FOR ASSUMED VALUES)
This table containsapproximate values. It ismeant for illustrative purposesonly. The values are highlydependent on theassumptions and should notbe used for operationalanalyses or final design. Thistable was derived from theassumed values listed in thefootnote.
Service Volumes (veh/h)
FFS (mi/h) Number ofLanes
Terrain A B C D E
Level 1120 1840 2650 3400 37702 Rolling 1070 1760 2520 3240 3590
60 Mountainous 980 1610 2310 2960 3290
Level 1690 2770 3970 5100 56603 Rolling 1610 2640 3790 4860 5390
Mountainous 1470 2410 3460 4450 4930
Level 940 1540 2220 2910 34302 Rolling 890 1460 2120 2780 3260
50 Mountainous 820 1340 1940 2540 2990
Level 1410 2310 3340 4370 51403 Rolling 1340 2200 3180 4170 4900
Mountainous 1230 2010 2910 3810 4480
Notes:Assumptions: highway with 60-mi/h FFS has 8 access points/mi; highway with 50-mi/h FFS has 25 access points/mi; lanewidth = 12 ft; shoulder width > 6 ft; divided highway; PHF = 0.88; 5 percent trucks; and regular commuters.
III. TWO-LANE HIGHWAYS
A two-lane highway is an undivided roadway with two lanes, one for use by traffic ineach direction. Passing a slower vehicle requires use of the opposing lane as sightdistance and gaps in the opposing traffic stream permit. As volumes and geometricrestrictions increase, the ability to pass decreases and platoons form. Motorists inplatoons are subject to delay because they are unable to pass. Illustration 12-9 shows atypical view of a two-lane, two-way rural highway.
ILLUSTRATION 12-9. Typical two-lane, two-way highway in arural environment.
Two-lane highways are a key element in the highway systems of most countries.They perform a variety of functions, are located in all geographic areas, and serve a widerange of traffic. Any consideration of operating quality must account for these disparatefunctions.

Highway Capacity Manual 2000
Chapter 12 - Highway Concepts 12-12Two-Lane Highways
Traffic operations on two-lane, two-way highways differ from those on otheruninterrupted-flow facilities. Lane changing and passing are possible only in the face ofoncoming traffic in the opposing lane. Passing demand increases rapidly as trafficvolumes increase, and passing capacity in the opposing lane declines as volumes increase.Therefore, on two-lane highways, unlike other types of uninterrupted-flow facilities,normal traffic flow in one direction influences flow in the other direction. Motorists mustadjust their travel speeds as volume increases and the ability to pass declines.
Efficient mobility is the principal function of major two-lane highways that connectmajor traffic generators or that serve as primary links in state and national highwaynetworks. These routes tend to serve long-distance commercial and recreationaltravelers, and long sections may pass through rural areas without traffic-controlinterruptions. Consistent high-speed operations and infrequent passing delays aredesirable for these facilities.
Other paved, two-lane rural highways serve for accessibility. They provide all-weather access to an area, often for relatively low traffic volumes. Cost-effective accessis the dominant consideration. Although beneficial, high speed is not the principalconcern. Delay—as indicated by the formation of platoons—is more relevant as ameasure of service quality.
Two-lane roads also serve scenic and recreational areas in which the vista andenvironment are meant to be experienced and enjoyed without traffic interruption ordelay. A safe roadway is desired, but high-speed operation is neither expected nordesired. For these reasons, there are two performance measures to describe servicequality for two-lane highways: percent time-spent-following and average travel speed.
Percent time-spent-following defined
Car-following criterion is3 s
Percent time-spent-following represents the freedom to maneuver and the comfortand convenience of travel. It is the average percentage of travel time that vehicles musttravel in platoons behind slower vehicles due to the inability to pass. Percent time-spent-following is difficult to measure in the field. However, the percentage of vehiclestraveling with headways of less than 3 s at a representative location can be used as asurrogate measure.
Average travel speeddefined
Average travel speed reflects the mobility on a two-lane highway: it is the length ofthe highway segment divided by the average travel time of all vehicles traversing thesegment in both directions during a designated interval.
LOS criteria use both these performance measures. On major two-lane highways, forwhich efficient mobility is paramount, both percent time-spent-following and averagetravel speed define LOS. However, roadway alignments with reduced design speeds willlimit the LOS that can be achieved. On highways for which accessibility is paramountand mobility less critical, LOS is defined only in terms of percent time-spent-following,without consideration of average travel speed.
CLASSIFICATION OF TWO-LANE HIGHWAYS
Two-lane highways are categorized into two classes for analysis:Class I highways • Class I—These are two-lane highways on which motorists expect to travel at
relatively high speeds. Two-lane highways that are major intercity routes, primaryarterials connecting major traffic generators, daily commuter routes, or primary links instate or national highway networks generally are assigned to Class I. Class I facilitiesmost often serve long-distance trips or provide connecting links between facilities thatserve long-distance trips.
Class II highways • Class II—These are two-lane highways on which motorists do not necessarilyexpect to travel at high speeds. Two-lane highways that function as access routes toClass I facilities, serve as scenic or recreational routes that are not primary arterials, orpass through rugged terrain generally are assigned to Class II. Class II facilities mostoften serve relatively short trips, the beginning and ending portions of longer trips, ortrips for which sightseeing plays a significant role.

Highway Capacity Manual 2000
12-13 Chapter 12 - Highway ConceptsTwo-Lane Highways
The classes of two-lane roads closely relate to their functions—most arterials areconsidered Class I, and most collectors and local roads are considered Class II. However,the primary determinant of a facility’s classification in an operational analysis is themotorist’s expectations, which might not agree with the functional classification. Forexample, an intercity route that passes through rugged mountainous terrain might bedescribed as Class II instead of Class I if motorists recognize that a high-speed route isnot feasible in that corridor.
For Class I highways, twocriteria define LOS: percenttime-spent-following andaverage travel speed. ForClass II highways, LOS isbased only on percent time-spent-following.
The LOS for Class I highways on which efficient mobility is paramount is defined interms of both percent time-spent-following and average travel speed. On Class IIhighways, mobility is less critical, and LOS is defined only in terms of percent time-spent-following. Drivers generally tolerate higher levels of percent time-spent-followingon a Class II facility than on a Class I facility, because Class II highways usually serveshorter trips and different trip purposes.
BASE CONDITIONS
The base conditions for a two-lane highway are the absence of restrictive geometric,traffic, or environmental factors. Base conditions are not the same as typical or defaultconditions. The methodology in Chapter 20 accounts for the effects of geometric, traffic,or environmental conditions that are more restrictive than the base conditions. The baseconditions include
• Lane widths greater than or equal to 12 ft;• Clear shoulders wider than or equal to 6 ft;• No no-passing zones;• All passenger cars;• No impediments to through traffic, such as traffic control or turning vehicles; and• Level terrain.For the analysis of two-way flow (i.e., both directions), a 50/50 directional split of
traffic is also considered a base condition. Most directional distribution on rural two-lanehighways ranges from 50/50 to 70/30. On recreational routes, the directional distributionmay be as high as 80/20 or more during holiday or other peak periods. Some variation inspeed and percent time-spent-following occurs with changing directional distribution andvolume. For directional analysis (i.e., separate analysis of each direction), directionaldistribution is not a base condition.
Traffic can operate ideally only if lanes and shoulders are wide enough not toconstrain speeds. Lane and shoulder widths less than the base values of 12 ft and 6 ft,respectively, are likely to reduce speeds and may increase percent time-spent-following.
No-passing zone
The sight distance value of1,000 ft is equivalent to thatused by the Manual onUniform Traffic ControlDevices for passing and no-passing zones on highwayswith an 85th-percentile speedof 55 mi/h
The frequency of no-passing zones is used to characterize roadway design and toanalyze expected traffic conditions along a two-lane highway. A no-passing zone is anyzone marked for no passing or any section of road with a passing sight distance of 1,000ft or less. The average percentage of no-passing zones in both directions along a sectionis used for the analysis of two-way flow. The percentage of no-passing zones for aparticular direction of travel is used in directional analysis.
No-passing zones typically range from 20 to 50 percent of a rural two-lane highway.Values approaching 100 percent can be found on sections of winding, mountainous roads.No-passing zones have a greater effect in mountainous terrain than in level or rollingterrain. Heavy platoon formation along a highway section also can cause greater-than-expected operational problems on an adjacent downstream section with restricted passingopportunities.
BASIC RELATIONSHIPS
Exhibit 12-6 shows the relationship of flow rate, average travel speed, and percenttime-spent-following for base conditions on an extended two-way facility (7).
Highway geometric features include a general description of longitudinal sectioncharacteristics and specific roadway cross-section information. Longitudinal section

Highway Capacity Manual 2000
Chapter 12 - Highway Concepts 12-14Two-Lane Highways
characteristics are described by the average percentage of the highway with no-passingzones in either direction. Roadway cross-section data include lane width and usableshoulder width. Geometric data and design speed are considered in estimating the FFS.
EXHIBIT 12-6. SPEED-FLOW AND PERCENT TIME-SPENT-FOLLOWING FLOW RELATIONSHIPS FORTWO-WAY SEGMENTS WITH BASE CONDITIONS
Analysis of two-way flowusually is performed onextended lengths; butdirectional analysis isapplied to relativelyshort, uniform segments
Two-Way Flow Rate (pc/h)
100
80
60
40
20
0Perc
ent T
ime-
Spen
t-Fol
lowi
ng
0 500 1000 1500 2000 2500 3000 3500
6560
50
40
30
20
10
0
Aver
age
Trav
el S
peed
(mi/h
)
Two-Way Flow Rate (pc/h)
a. Average Travel Speed vs. Two-Way Flow
b. Percent Time-Spent-Following vs. Two-Way Flow
0 500 1000 1500 2000 2500 3000 3500
FFS = 65 mi/h60 mi/h55 mi/h50 mi/h45 mi/h
Two-way segments anddirectional segments
Two-lane highways can be analyzed either as two-way segments obtaining trafficperformance measures for both directions of travel combined, or as directional segments,with each direction of travel considered separately. Separate analysis by direction isappropriate for steep grades and for segments with passing lanes.
Exhibit 12-7 illustrates the relationship of flow rate, average travel speed, andpercent time-spent-following for base conditions of a directional segment of a two-wayfacility (7). These relationships are conceptually analogous to the relationships for thetwo-way segments in Exhibit 12-6; however, the relationships for directional segmentsincorporate the effect of the opposing flow rate on the average travel speed and percenttime-spent-following. In Exhibit 12-7(a), the y-intercept represents the FFS in theanalysis direction, incorporating the effect of the demand flow rate in the opposingdirection. Exhibit 12-7(b) graphs the relationships between directional flow rate andpercent time-spent-following when opposing flow rates range from 200 to 1,600 pc/h.

Highway Capacity Manual 2000
12-15 Chapter 12 - Highway ConceptsTwo-Lane Highways
EXHIBIT 12-7. SPEED-FLOW AND PERCENT TIME-SPENT-FOLLOWING FLOW RELATIONSHIPS FORDIRECTIONAL SEGMENTS WITH BASE CONDITIONS
100
80
60
40
20
0
Directional Flow Rate (pc/h)
Perc
ent T
ime-
Spen
t-Fol
lowi
ng
b. Percent Time-Spent-Following vs. Directional Flow
0 200 400 600 800 1000 1200 1400 1600 1800 2000Directional Flow Rate (pc/h)
a. Average Travel Speed vs. Directional Flow6560
50
40
30
20
10
0
Aver
age
Trav
el S
peed
(mi/h
)
Opposing Flow = 200 pc/h
Opposing Flow = 1600 pc/h
FFS = 65 mi/h60 mi/h55 mi/h50 mi/h45 mi/h
0 200 400 600 800 1000 1200 1400 1600 1800 2000
PASSING LANES ON TWO-LANE HIGHWAYS
A passing lane is a lane added in one direction of travel on a conventional two-lanehighway to improve opportunities for passing. The addition of a passing lane to a two-lane highway provides a three-lane cross section with two lanes in one direction of traveland one lane in the other. Exhibit 12-8 illustrates a typical passing lane on a two-lanehighway. Depending on local practice, traffic in the opposing direction may beprohibited from passing or may be permitted to pass if adequate sight distance isavailable, as shown in Exhibit 12-8. On some two-lane highways, passing lanes areprovided intermittently or at intervals for each direction of travel. On other highways,added passing lanes alternate continuously between the two directions of travel. Passinglanes also can be provided in both directions of travel at the same location, resulting in ashort section of four-lane undivided highway with improved passing opportunities in bothdirections.
EXHIBIT 12-8. PLAN VIEW OF A TYPICAL PASSING LANE
Lane addition
taper
Passing lane Lane drop
taper
LOS
The primary measures of service quality for Class I two-lane highways are percenttime-spent-following and average travel speed. For Class II two-lane highways, service

Highway Capacity Manual 2000
Chapter 12 - Highway Concepts 12-16Two-Lane Highways
quality is based only on percent time-spent-following. LOS criteria are defined for peak15-min flow periods and are intended for application to segments of significant length.
LOS A describes the highest quality of traffic service, when motorists are able totravel at their desired speed. Without strict enforcement, this highest quality would resultin average speeds of 55 mi/h or more on two-lane highways in Class I. The passingfrequency required to maintain these speeds has not reached a demanding level, so thatpassing demand is well below passing capacity, and platoons of three or more vehiclesare rare. Drivers are delayed no more than 35 percent of their travel time by slow-moving vehicles. A maximum flow rate of 490 pc/h total in both directions may beachieved with base conditions. On Class II highways, speeds may fall below 55 mi/h, butmotorists will not be delayed in platoons for more than 40 percent of their travel time.
LOS B characterizes traffic flow with speeds of 50 mi/h or slightly higher on level-terrain Class I highways. The demand for passing to maintain desired speeds becomessignificant and approximates the passing capacity at the lower boundary of LOS B.Drivers are delayed in platoons up to 50 percent of the time. Service flow rates of 780pc/h total in both directions can be achieved under base conditions. Above this flow rate,the number of platoons increases dramatically. On Class II highways, speeds may fallbelow 50 mi/h, but motorists will not be delayed in platoons for more than 55 percent oftheir travel time.
LOS C describes further increases in flow, resulting in noticeable increases inplatoon formation, platoon size, and frequency of passing impediments. The averagespeed still exceeds 45 mi/h on level-terrain Class I highways, even though unrestrictedpassing demand exceeds passing capacity. At higher volumes the chaining of platoonsand significant reductions in passing capacity occur. Although traffic flow is stable, it issusceptible to congestion due to turning traffic and slow-moving vehicles. Percent time-spent-following may reach 65 percent. A service flow rate of up to 1,190 pc/h total inboth directions can be accommodated under base conditions. On Class II highways,speeds may fall below 45 mi/h, but motorists will not be delayed in platoons for morethan 70 percent of their travel time.
LOS D describes unstable traffic flow. The two opposing traffic streams begin tooperate separately at higher volume levels, as passing becomes extremely difficult.Passing demand is high, but passing capacity approaches zero. Mean platoon sizes of 5to 10 vehicles are common, although speeds of 40 mi/h still can be maintained under baseconditions on Class I highways. The proportion of no-passing zones along the roadwaysection usually has little influence on passing. Turning vehicles and roadside distractionscause major shock waves in the traffic stream. Motorists are delayed in platoons fornearly 80 percent of their travel time. Maximum service flow rates of 1,830 pc/h total inboth directions can be maintained under base conditions. On Class II highways, speedsmay fall below 40 mi/h, but in no case will motorists be delayed in platoons for more than85 percent of their travel time.
At LOS E, traffic flow conditions have a percent time-spent-following greater than80 percent on Class I highways and greater than 85 percent on Class II. Even under baseconditions, speeds may drop below 40 mi/h. Average travel speeds on highways withless than base conditions will be slower, even down to 25 mi/h on sustained upgrades.Passing is virtually impossible at LOS E, and platooning becomes intense, as slowervehicles or other interruptions are encountered.
The highest volume attainable under LOS E defines the capacity of the highway,generally 3,200 pc/h total in both directions. Operating conditions at capacity areunstable and difficult to predict. Traffic operations seldom reach near capacity on ruralhighways, primarily because of a lack of demand.
LOS F represents heavily congested flow with traffic demand exceeding capacity.Volumes are lower than capacity and speeds are highly variable.

Highway Capacity Manual 2000
12-17 Chapter 12 - Highway ConceptsTwo-Lane Highways
REQUIRED INPUT DATA AND ESTIMATED VALUES
Exhibit 12-9 lists default values for input parameters that may be used in the absenceof local data. However, taking field measurements for use as inputs to an analysis is themost reliable means of generating parameter values. Only when this is not feasibleshould the default values be considered.
EXHIBIT 12-9. REQUIRED INPUT DATA: TWO-LANE HIGHWAYS
Required Data Default
Geometric Data
Highway class Exhibit 12-10Lane width 12 ftShoulder width 6 ftAccess-point density Exhibit 12-4Specific grade or general terrain LevelPercent no-passing Exhibit 12-11Base FFS -Length of passing lane Exhibit 12-12
Demand
Length of analysis period 15 minPHF 0.88 rural, 0.92 urbanDirectional split Exhibit 12-13Heavy vehicles percentages Exhibit 12-14
Highway Classes
Two-lane highways are categorized into two classes. The general description ofthese classes is summarized in Exhibit 12-10.
EXHIBIT 12-10. SUMMARY OF TWO-LANE HIGHWAY CLASSES
Class Description
I Highways on which motorists expect to travel at relatively high speeds,including major intercity routes, primary arterials, and daily commuter routes
II Highways on which motorists do not necessarily expect to travel at highspeeds, including access routes, scenic and recreational routes that are notprimarily arterials, and routes through rugged terrain
Lane Width and Shoulder Width
Refer to the description of lane width and lateral clearance under the required inputdata and estimated values for multilane highways.
Access-Point Density
Refer to the description of access-point density under the required input data andestimated values for multilane highways.
Specific Grade or General Terrain
Refer to the description of specific grade or general terrain under the required inputdata and estimated values for multilane highways.
Percentage of No-Passing Zones
The percentage of each segment length in which passing is prohibited should beestimated from local data. In the absence of such data, Exhibit 12-11 may be used.

Highway Capacity Manual 2000
Chapter 12 - Highway Concepts 12-18Two-Lane Highways
EXHIBIT 12-11. DEFAULT VALUES FOR PERCENTAGE OF NO-PASSING ZONES
Terrain Type No-Passing Zones (%)
Level 20Rolling 50
Mountainous 80
Base FFS
The base FFS for a two-lane highway is observed at base conditions and ranges from45 to 65 mi/h, depending on the highway’s characteristics.
Length of Passing Lane
Passing lanes on two-lane highways range in length from 0.2 to 3.0 mi (8). Researchhas shown that the optimal lengths for passing lanes range from 0.5 to 2.0 mi, dependingon the traffic flow rate, as shown in Exhibit 12-12.
EXHIBIT 12-12. OPTIMAL LENGTHS OF PASSING LANES
Directional Flow Rate (pc/h) Optimal Passing Lane Length (mi)
100 ≤ 0.50200 > 0.50–0.75400 > 0.75–1.00
≥ 700 > 1.00–2.00
Source: Harwood and St. John (8).
Length of Analysis Period
Refer to the description of the length of analysis period under the required data andestimated values for multilane highways.
PHF
When feasible, the PHF should be determined from local field data. If field data arenot available, the factors presented in Exhibit 12-9 may be used for two-way anddirectional two-lane highway analysis. In general, lower PHFs are typical of rural oroff-peak conditions, but higher PHFs are typical of urban or suburban peak-hourconditions. Default PHF values of 0.88 for rural areas and 0.92 for urban areas may beused in the absence of local data.
Directional Split
Directional distribution is defined as 50/50 for base conditions. Most directionaldistributions on rural two-lane highways range from 50/50 to 70/30. On recreationalroutes, the directional distribution may be as high as 80/20 or more during holiday orother peak periods. Exhibit 12-13 lists default directional splits that may be used if field-observed data are not available.
EXHIBIT 12-13. DEFAULT VALUES FOR DIRECTIONAL SPLIT ON TWO-LANE HIGHWAYS
Type Directional SplitRural Highways 60/40Urban Highways 60/40Recreational Highways 80/20

Highway Capacity Manual 2000
12-19 Chapter 12 - Highway ConceptsTwo-Lane Highways
Percentage of Heavy Vehicles
The local HPMS may be used to obtain local information on the percentage of heavyvehicles by facility and area type. When estimates of the traffic mix are not available,Exhibit 12-14 presents default values that may be used for primary routes. Recreationalroutes typically would have a higher proportion of RVs and often a lower proportion oftrucks than shown in Exhibit 12-14.
EXHIBIT 12-14. DEFAULT HEAVY-VEHICLE PERCENTAGES ON TWO-LANE HIGHWAYS
Type of Heavy Vehicle Rural (%) Urban (%)
Trucks (including buses) 14 2RVs 4 0
SERVICE VOLUME TABLE
An example service volume table for Class I highways is provided in Exhibit 12-15.From the exhibit, the hourly volume that can be accommodated at a given LOS, terrain,and FFS can be determined under specified conditions.
EXHIBIT 12-15. EXAMPLE SERVICE VOLUMES FOR A CLASS I TWO-LANE RURAL HIGHWAY(SEE FOOTNOTE FOR ASSUMED VALUES)
This table containsapproximate values and ismeant for illustrative purposesonly. The values depend onthe assumptions and shouldnot be used for operationalanalyses or final design. Thistable was derived usingassumed values listed in thefootnote.
Service Volumes (veh/h)
FFS (mi/h) Terrain A B C D E
Level 260 480 870 1460 277065 Rolling 130 290 710 1390 2590
Mountainous N/A 160 340 610 1300
Level 260 480 870 1460 277060 Rolling 130 290 710 1390 2590
Mountainous N/A 160 340 610 1300
Level N/A 330 870 1460 277055 Rolling N/A 170 710 1390 2590
Mountainous N/A 110 340 610 1300
Level N/A N/A 330 1000 277050 Rolling N/A N/A 170 790 2590
Mountainous N/A N/A 110 420 1300
Level N/A N/A N/A 330 277045 Rolling N/A N/A N/A 170 2590
Mountainous N/A N/A N/A 110 1300
Note:Assumptions: 60/40 directional split; 20-, 40-, and 60-percent no-passing zones for level, rolling, and mountainous terrain,respectively; 14 percent trucks; and 4 percent RVs.N/A = not achievable for the given conditionSource: Harwood et al. (7).
IV. REFERENCES
1. Reilly, W., D. Harwood, J. Schoen, and M. Holling. Capacity and LOSProcedures for Rural and Urban Multilane Highways. NCHRP Project 3-33 FinalReport, JHK & Associates, Tucson, Ariz., May 1990.
2. Tignor, S.C. Driver Speed Behavior on U.S. Streets and Highways. Compendiumof Technical Papers, Institute of Transportation Engineers, August 5–8, 1990.

Highway Capacity Manual 2000
Chapter 12 - Highway Concepts 12-20References
3. Hool, J. N., S. Maghsoodloo, A. D. Veren, and D. D. Brown. Analysis ofSelective Enforcement Strategy Effects on Rural Alabama Traffic Speeds. InTransportation Research Record 910, TRB, National Research Council,Washington, D.C., 1983, pp. 74–81.
4. Armour, M. The Effect of Police Presence on Urban Driving Speeds. AustraliaRoad Research, Vol. 14, No. 3, Sept. 1984, pp. 142–148.
5. Hauer, E., and F. J. Ahlin. Speed Enforcement and Speed Choice. AccidentAnalysis and Prevention, Vol. 14, No. 4, 1982, pp. 267–278.
6. American Association of State Highway and Transportation Officials. A Policy onGeometric Design of Highways and Streets. Washington, D.C., 1990.
7. Harwood, D. W., A. D. May, I. B. Anderson, L. Leiman, and A. R. Archilla.Capacity and Quality of Service of Two-Lane Highways. Final Report, NCHRPProject 3-55(3), Midwest Research Institute, 1999 (forthcoming).
8. Harwood, D. W., and A. D. St. John. Operational Effectiveness of Passing Laneson Two-Lane Highways. Report No. FHWA/RD-86/196, FHWA, U.S.Department of Transportation, Washington, D.C., 1986.