challenges? - thinkingpower.careference case with 5 additional years to 2030) coal ... • china...
TRANSCRIPT

Coal In the U.S.
National Energy Technology Laboratory
Office of Fossil Energy
Coal In the U.S.
National Energy Technology Laboratory
Office of Fossil Energy
The Future of Coal in Ontario Conference
Kenneth E. Markel, Jr. Director of the Office of Major
Demonstrations 51007
2
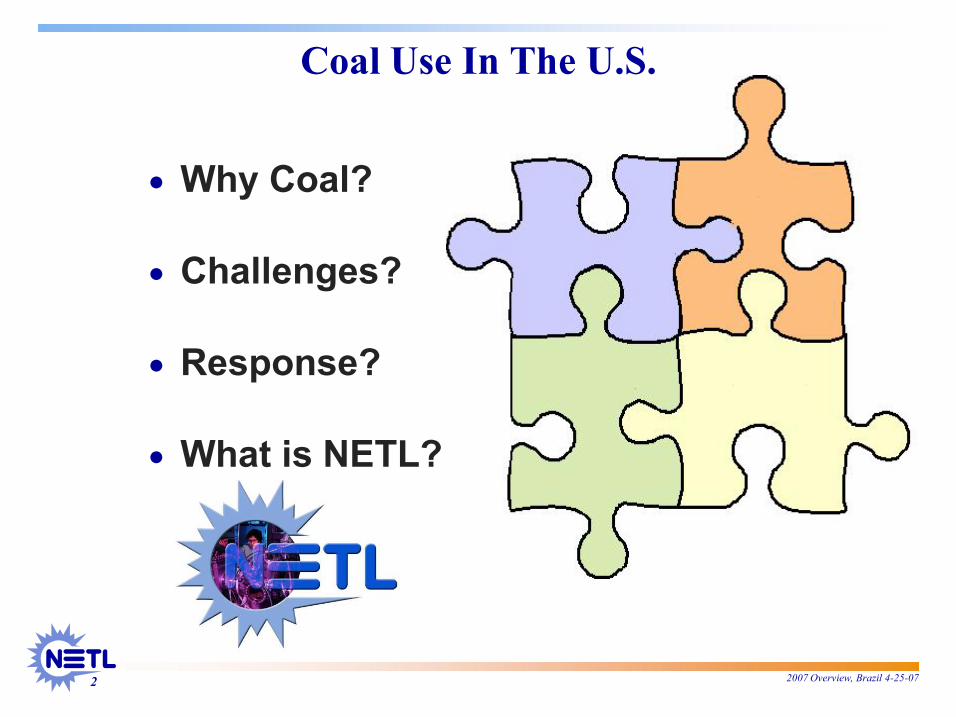
Coal Use In The U.S.
• Why Coal?
• Challenges?
• Response?
• What is NETL?
2007 Overview, Brazil 42507
Coal Use In The U.S.

3
United States
World
Energy Demand Today
U.S. data from EIA, Annual Energy Outlook 2007, years 2006 and 2030; world data from IEA, World Energy Outlook 2006, years 20
475 QBtu / Year 80% Fossil Energy
Fossil Energy Will Continue to Dominate
101 QBtu / Year 85% Fossil Energy
United States
World
2007 Overview, Brazil 42507
United States
World
Coal 26% Coal 26%
Nuclear 5%
Nuclear 5%
Renewables 14%
Renewables 14%
Oil 33% Oil 33%
Gas 23% Gas 23%
U.S. data from EIA, Annual Energy Outlook 2007, years 2006 and 2030; world data from IEA, World Energy Outlook 2006, years 2004 and 2030
725 QBtu / Year 81% Fossil Energy
Oil 40% Oil 40%
Coal 26% Coal 26%
Gas 21% Gas 21% Nuclear
7% Nuclear 7%
Renewables 7%
Renewables 7%
Energy Demand 2030
Fossil Energy Will Continue to Dominate
131 QBtu / Y ear 86% Fossil Energy
United States
World

4
Coal use linked to economic growth
U.S. Coal Utilization Outlook
Coal 57.4%
Natural Gas 16.1% Nuclear 15.5% Renewables 9.0% Oil 1.8%
U.S. Electricity Generation
80
120
160
200
240
1970
Index: 1973 = 100
0
1
2
3
1970 1990 2010 2030 Year
Billion kW
h
49.6%
2007 Overview, Brazil 42507
Upper figure: DOE EIA, AEO 2006, Figure 5 Lower figure: Energy & Electricity per DOE EIA, AER 2004
GDP per U.S. DOC, Bureau of Economic Analysis
Coal dominates electricity generation
U.S. Coal Utilization Outlook
Coal 57.4%
Natural Gas 16.1% Nuclear 15.5% Renewables 9.0% Oil 1.8%
Coalfired Generation
80
120
160
200
240
1970 1980 1990 2000 Year
Total Electricity Generation Total Energy Consumption
GDP CoalBased Electricity Generation

5
Coal use linked to economic growth
U.S. Coal Utilization Outlook
Coal
Natural gas Nuclear Renewables Oil
U.S. Electricity Generation
80
120
160
200
240
1970
Index: 1973 = 100
0
1
2
3
1970 1990 2010 2030 Year
Billion kW
h
Print 2007 Overview, Brazil 42507
Upper figure: DOE EIA, AEO 2006, Figure 5 Lower figure: Energy & Electricity per DOE EIA, AER 2004
GDP per U.S. DOC, Bureau of Economic Analysis
Coal dominates electricity generation
U.S. Coal Utilization Outlook
Coal
Natural gas Nuclear Renewables
Coalfired Generation
80
120
160
200
240
1970 1980 1990 2000 Year
Total Electricity Generation Total Energy Consumption
GDP CoalBased Electricity Generation

6
Energy = Quality of Life Poverty Reduces Global Security
Poverty
Eritrea
Congo
Peru
Mexico
UK
100
1,000
10,000
100,000
100 1,000
GDP pe
r Cap
ita
($ / pe
rson
/ yr)
Annual Energy Consumption per Capita (kgoe* / person / yr)
2007 Overview, Brazil 42507
Energy = Quality of Life Poverty Reduces Global Security
World Resources Institute Database, accessed June 1, 2005 http://earthtrends.wri.org/searchable_db/
*kilograms of oil equivalent
Affluence
Bulgaria
South Africa
Bahrain
U.S.
Qatar
10,000 100,000
Annual Energy Consumption per Capita / person / yr)

7
0 1,000 2,000 3,000 4,000 5,000 6,000 7,000 8,000 9,000 10,000 11,000 12,000 13,000 14,000 15,000 16,000 17,000 18,000 19,000 20,000
1970 1975 1980 1985 1990 1995 0
1,000 2,000 3,000 4,000 5,000 6,000 7,000 8,000 9,000 10,000 11,000 12,000 13,000 14,000 15,000 16,000 17,000 18,000 19,000 20,000
1970 1975 1980 1985 1990 1995
174 Added GW Double the 87 GW in AEO’05 (Reference case with 5 additional years to 2030)
Coal Adds 154 GW New Capacity Plus 19 GW of CTL
MW Add
ition
s
1973 additions greater than total for last 16 years
2007 Overview, Brazil 42507
2000 2005 2010 2015 2020 2025 2030 2000 2005 2010 2015 2020 2025 2030
Double the 87 GW in AEO’05 (Reference case with 5 additional years to 2030)
EIA, Annual Energy Review 2004, Annual Energy Outlook 2006
Coal Adds 154 GW New Capacity Plus 19 GW of CTL
AEO’06
1973 additions greater than total for last 16 years

8 2007 Overview, Brazil 42507 “Tracking New Power Plants. Coal’s Resurgence in Electric Power Generation” NETL, January 24, 2007, www.netl.doe.gov

9
U.S. Fossil Fuel Reserves / Production Ratio
EIA, Advance Summary U.S. Crude Oil, Natural Gas, and Natural Gas Liquids Reserves, 2003 Annual Report, September 22, 2004
250 Year Supply at Current Demand Levels !
258
11.7
0
100
200
300
Anthracite & Bituminous
Sub Bituminous
& Lignite
2007 Overview, Brazil 42507
U.S. Fossil Fuel Reserves / Production Ratio
Sources: BP Statistical Review, June 2004, for coal reserves data World Energy Council; EIA, Advance Summary U.S. Crude Oil, Natural Gas, and Natural Gas Liquids Reserves, 2003 Annual Report, September 22, 2004 for oil and gas reserves data
250 Year Supply at Current Demand Levels !
11.7 9.7
Coal
Oil
Natural Gas

10
DOE Strategic Plan
1.1 Energy Diversity – Increase our energy options and reduce dependence on oil, thereby reducing vulnerability to disruption and increasing the flexibility of the market to meet U.S. needs.
1.2 Environmental Impacts of Energy Improve the quality of the environment by reducing greenhouse gas emissions and environmental impacts to land, water, and air from energy production and use.
1.3 Energy Infrastructure – Create a more flexible, more reliable, and higher capacity U.S. energy infrastructure
1.4 Energy Productivity – Costeffectively improve the energy efficiency of the U.S. economy.
2007 Overview, Brazil 42507
DOE Strategic Plan
Increase our energy options and reduce dependence on oil, thereby reducing vulnerability to disruption and increasing the flexibility of the market
Environmental Impacts of Energy Improve the quality of the environment by reducing greenhouse gas emissions and environmental impacts to land, water, and air from energy production and use.
Create a more flexible, more reliable, and higher capacity
effectively improve the energy efficiency of the U.S.

11
Recent Activities
• 2007 U.S.EU Summit Statement − Key Priorities: 1. Advanced commercial deployment of clean coal and carbon capture and storage technologies including. . . advanced, clean, and near zero emissions coal technologies are critical in tackling global C02 emissions, importance in meeting current and future energy needs for developed and developing countries;
• U.S. Japan Joint Statement on Energy Security, Clean Development, and Climate Change − We are accelerating the development and deployment of these technologies by providing policy incentives to reduce the cost barriers to their full commercialization. We especially note the importance of advancing: energy efficiency and renewable energy, alternative and renewable fuels, hydrogen, emissions coal, nuclear energy, and fusion energy.
2007 Overview, Brazil 42507
Recent Activities
EU Summit Statement April 30, 2007 Key Priorities: 1. Advanced commercial deployment of clean coal and carbon capture and storage technologies including. . . advanced, clean, and near zero emissions coal technologies are critical in tackling global C02 emissions, given coal’s importance in meeting current and future energy needs for developed and developing countries;
Japan Joint Statement on Energy Security, Clean Development, and Climate Change – April 27, 2007
We are accelerating the development and deployment of these technologies by providing policy incentives to reduce the cost barriers to their full commercialization. We especially note the importance of advancing: energy efficiency and renewable energy, alternative and renewable fuels, hydrogen, nearzero
, nuclear energy, and fusion energy.

12
Difficult to Postulate Affordable, Secure Alternatives to Coal Nuclear
Cost, Permitting, Waste Disposal?
Biomass Cost, Gigantic, Infrastructure?
2007 Overview, Brazil 42507
Difficult to Postulate Affordable, Secure Alternatives to Coal
Waste Disposal?
Infrastructure?
Wind / Solar Cost,
Land use, Intermittency?
Hydro / Geothermal
Availability of sites?

13
R&D Challenges for Coal Technology
• “Nearzero” emissions
• CO 2 management
• High efficiency
• Water use
• Byproduct utilization
• Flexible (feedstocks, products, siting)
• Cost competitive with other energy choices
2007 Overview, Brazil 42507
R&D Challenges for Coal Technology
zero” emissions
management
product utilization
Flexible (feedstocks, products, siting)
Cost competitive with other energy

14
Index: 1970 = 1
Year
Coal Getting Cleaner While Demand Increases !
0
1
2
3
4
1970 1980 1990
2007 Overview, Brazil 42507
Particulate Matter
Coal Use Electricity Generation
NO x SO 2
Year EPA, National Air Quality and Emissions Trends Report, 1999 (March 2001) DOE, EIA Annual Energy Review
Projections for NO x and SO 2 : Clear Skies Initiative
Coal Getting Cleaner While Demand Increases !
2000 2010 2020

15
DOE’s Office of Fossil Energy Advanced (Coal) Power Systems Goals
• 2010: −4550% Efficiency (HHV) −99% SO 2 removal −NOx< 0.01 lb/MM Btu −90% Hg removal −$1,000/kW (2002 $)
• 2012: −90% CO 2 capture −<10% increase in COE with carbon sequestration
• 2015 −Multiproduct capability (e.g, power + H −60% efficiency (measured without carbon capture)
2007 Overview, Brazil 42507
DOE’s Office of Fossil Energy Advanced (Coal) Power Systems Goals
50% Efficiency (HHV)
<10% increase in COE with
product capability (e.g, power + H 2 ) 60% efficiency (measured without carbon capture)

16
Strategic Center for Coal
• Clean Coal Power Initiative
Demonstration Program
• Integrated sequestration, hydrogen, and power research facility
FutureGen
2007 Overview, Brazil 42507
All Programs Support Presidential Initiatives:
• Clear Skies • Climate Change • Energy Security
Strategic Center for Coal
Integrated sequestration, Core R&D Program
17
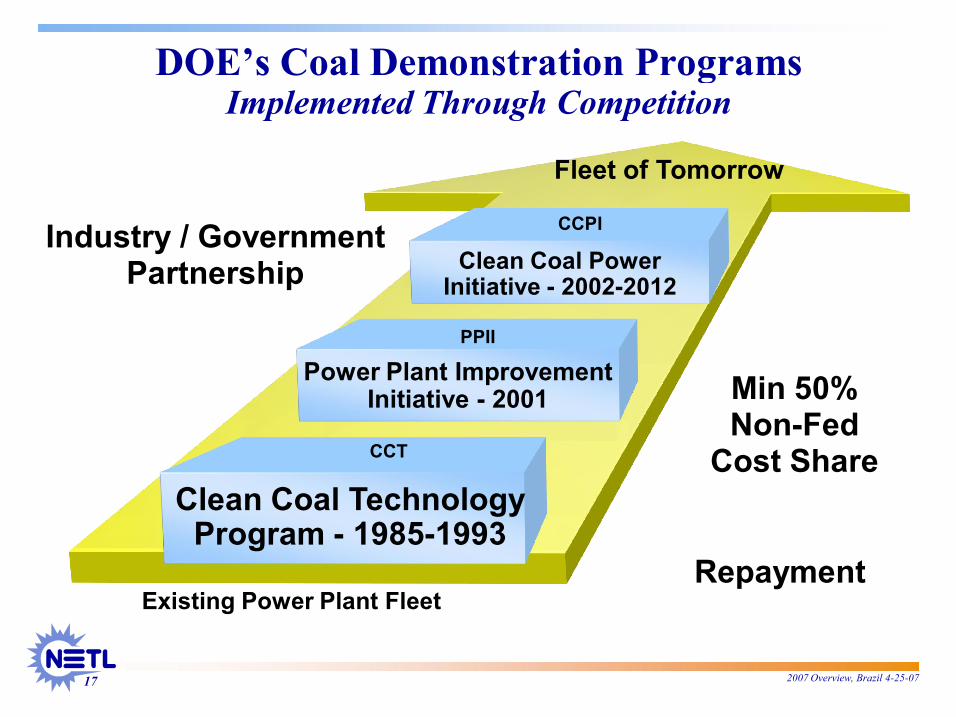
Clean Coal Technology Program 19851993
Power Plant Improvement Initiative
Clean Coal Power Initiative
DOE’s Coal Demonstration Programs Implemented Through Competition
Industry / Government Partnership
Existing Power Plant Fleet
CCT
PPII
2007 Overview, Brazil 42507
Clean Coal Technology 1993
Power Plant Improvement 2001
Clean Coal Power Initiative 20022012
DOE’s Coal Demonstration Programs Implemented Through Competition
Min 50% NonFed
Cost Share
Fleet of Tomorrow
PPII
CCPI
Repayment

18
• Five competitive solicitations, 1985 • All 33 projects completed • $1.3B DOE and $1.9B industry cost share
Clean Coal Technology (CCT) Program
2007 Overview, Brazil 42507
Power generation Environmental control Coal processing Industrial applications
Five competitive solicitations, 1985 1993 All 33 projects completed $1.3B DOE and $1.9B industry cost share
Clean Coal Technology (CCT) Program

19
Advanced Pollution Controls • Installed on 75% of U.S. coal plants • 1/2 to 1/10 cost of older systems
CCT Program Success Stories
JEA CFBC
Hazardous Air Pollutants (HAPS) & Mercury Data •Quantified HAPS Levels •Basis for Mercury Regulations
$
time
Advanced Coal Power Systems • World’s largest combustion (CFBC)
• Two “super
2007 Overview, Brazil 42507
LowNO x Burners
CCT Program Success Stories
Tampa IGCC
Wabash IGCC
FGD Scrubbers
Advanced Coal Power Systems World’s largest circulating fluidized bed combustion (CFBC) power plant Two “superclean” coalbased IGCC

20
IGCC Technology in Early Commercialization U.S. CoalFueled Plants
• Wabash River − 1996 Powerplant of Year Award* − Achieved 95% availability
• Tampa Electric − 1997 Powerplant of Year Award* − First dispatch power generator
Nation’s first commercialscale IGCC plants, each achieving
> 95% sulfur removal > 90% NO X reduction
2007 Overview, Brazil 42507
IGCC Technology in Early Commercialization Fueled Plants
1996 Powerplant of Year Award*
Powerplant of Year Award*
*Power Magazine

21
Clean Coal Power Initiative • 10 yr • 4 rounds of solicitations • Drivers
− Overall • Clear Skies Initiative • Reduced carbon intensity • Zero emissions technology target • Energy/economic security
− Round 1 (Broad) • Advanced coalbased power generation • Efficiency, environmental & economic improvements
− Round 2 (Prioritized) • Gasification • Hg control
2007 Overview, Brazil 42507
Clean Coal Power Initiative
Zero emissions technology target
based power generation Efficiency, environmental & economic improvements

22
Demonstration Projects Locations and Cost Share
Southern Co. Services IGCC Southern Co. Services IGCC
Excelsior Energy IGCC $2,155M – Total $36M – DOE
Excelsior Energy IGCC $2,155M – Total $36M – DOE
Pegasus Technologies Adv. Sensor / Optimization
Hg / Multipollutant $15.5M – Total $6.1M – DOE
Pegasus Technologies Adv. Sensor / Optimization
Hg / Multipollutant $15.5M – Total $6.1M – DOE
NeuCo, Inc. Integrated Optimization Software
$19M – Total $8.5M – DOE
NeuCo, Inc. Integrated Optimization Software
$19M – Total $8.5M – DOE
Great River Energy Lignite Fuel Enhancement
$31.5M – Total $13.5M – DOE
Great River Energy Lignite Fuel Enhancement
$31.5M – Total $13.5M – DOE
Western Greenbrier Clean Coal CoProduction
$215M – Total $107.5M – DOE
Western Greenbrier Clean Coal CoProduction
$215M – Total $107.5M – DOE
CUB
FBC
FGC
Fuel
Gasification
Optimization
Awarded
In Negotiation
2007 Overview, Brazil 42507
Demonstration Projects Locations and Cost Share
Southern Co. Services IGCCTransport Gasifier
$844M – Total $294M – DOE
Southern Co. Services IGCCTransport Gasifier
$844M – Total $294M – DOE
WMPI PTY., LLC Coalto Clean Fuels and Power
$612M – Total $100M – DOE
WMPI PTY., LLC Coalto Clean Fuels and Power
$612M – Total $100M – DOE
Western Greenbrier Production Total DOE
Western Greenbrier Production Total DOE
Wisconsin Electric Power Co. TOXECON MultiPollutant Control
$53M – Total $24.9M – DOE
Wisconsin Electric Power Co. TOXECON MultiPollutant Control
$53M – Total $24.9M – DOE
CONSOL/Greenidge MultiPollutant Control
$33.1M – Total $14.5M – DOE
CONSOL/Greenidge MultiPollutant Control
$33.1M – Total $14.5M – DOE
Total Part. Gov. $3,978M $3,372M $605M
100% 84% 16%

23
Tentative Priority Technologies Future CCPI Rounds
• Integrated Gasification Combined Cycle − Improved efficiency/lower capital cost − CO2 capture friendly
• CO2 Capture and Storage
• Emission control −Mercury −NO X
Round 2 Round 3 Round 4
$250M 2007 Overview, Brazil 42507
Tentative Priority Technologies Future CCPI Rounds
Technologies For Zero Carbon Emission Plants
Integrated Gasification Combined
Improved efficiency/lower capital cost
Technologies for Clear Skies
Compliance
Round 2 Round 3 Round 4 Program Goals

24
One billion dollar, 10 world’s first coalbased, zero
electricity and hydrogen plant President Bush, February 27, 2003
• Broad U.S. participation − DOE contemplates implementation by consortium
• International collaboration
FutureGen: A Global Partnership Effort
2007 Overview, Brazil 42507
One billion dollar, 10year project to create based, zeroemission
electricity and hydrogen plant President Bush, February 27, 2003
International collaboration
FutureGen: A Global Partnership Effort

25
CoalFired IGCC
Refinery
CO 2 Pipeline
Oil Pipeline
Hydrogen Pipeline
Enhanced O il Recovery
CoalFired IGCC
Refinery
CO 2 Pipeline
Oil Pipeline
Hydrogen Pipeline
Enhanced O il Recovery Geological Sequestration
CO
Refinery
FutureGen
•H 2 10lb/sec •Electricity 275 MW
2007 Overview, Brazil 42507
Fired IGCC
Pipeline
Electricity
Hydrogen Pipeline
Geologic Sequestration
and / or
Fired IGCC
Pipeline
Electricity
Hydrogen Pipeline
Geologic Sequestration
and / or
Geological Sequestration
CO 2
FutureGen Concept
•Virtually no air pollutants •Capture & store CO2 10 6 tons/yr •Fullscale Integrated operations

26
FutureGen FutureGen Uses Cutting
• Can accommodate technology innovations with minimal modifications −Emerging from national or international R&D pipelines −Slipstream or fullscale tests −Over life of project
• Some emerging new technologies −Membranebased O 2 and H 2
−Highefficiency hydrogen turbines −Highthroughput gasifiers −Monitoring systems −Fuelcells FutureGen FutureGen
showcase of very best technology options for coal with near
2007 Overview, Brazil 42507
Uses CuttingEdge Technologies
Can accommodate technology innovations with
Emerging from national or international R&D pipelines
Some emerging new technologies 2 separation
efficiency hydrogen turbines
FutureGen FutureGen will be a global showcase of very best technology options for coalbased systems with nearzero carbon emissions

27
FutureGen FutureGen Industrial Alliance, Inc. Signed Cooperative Agreement with DOE on Dec. 2, 2005
• American Electric Power • AngloAmerican • BHP Billiton • China Huaneng Group • CONSOL Energy • E.ON U.S.
2007 Overview, Brazil 42507
Industrial Alliance, Inc. Signed Cooperative Agreement with DOE on Dec. 2, 2005
• Foundation Coal • Peabody Energy • PPL • Rio Tinto Energy America • Southern Company • Xstrata Coal

28
FutureGen FutureGen Project Schedule
BP 0 BP 3 BP 2 BP 1
Dec. 2, 2005
Jan 31, 2007
January 2008
March 2009
November 2012
Siting, NEPA, and Permitting
Project Structuring
& Conceptual Design
Phase 2 Cooperative Agreement Negotiations
Preliminary Design
Final Design
Facilities Construction
Plant StartUp
& Shakedown
Limited Cooperative Agreement Awarded
Full Scope Cooperative Agreement Awarded
NEPA ROD September October 2007
Final Site Selection Long Lead Time Orders Sept.October 2007
2007 Overview, Brazil 42507
Project Schedule
BP 4 BP 5
November 2012 November 2015
November 2017
Up
Shakedown
Initial Full Scale Plant Operations Full Scale Plant Operation Continues
Site Monitoring

29
FutureGen Project Supporting FutureGen is a Major Goal of the R&D Programs
• Industryled project with government oversight & international participation − Signed Cooperative Agreement with DOE on Dec. 2, 2005
− Project structuring to Jan. 2007 − Design to July 2009 − Construction to July 2012 − Operations to July 2016 − Site monitoring to July 2018
• Industry will choose project site & backbone technologies − Downselected to four potential sites
2007 Overview, Brazil 42507
FutureGen Project Supporting FutureGen is a Major Goal of the R&D Programs
Tuscola
Mattoon
Illinois
Odessa Brazos
Texas
led project with government oversight & international participation
Signed Cooperative Agreement
Project structuring to Jan. 2007
Industry will choose project site & backbone
selected to four potential sites

30
Core R&D Program
• Carbon Sequestration • Innovations for Existing Plants • Advanced Integrated Gasification Combined Cycle
• Hydrogen & Syngas • Fuel Cells • Advanced Research • Advanced Turbines
2007 Overview, Brazil 42507
Core R&D Program
Innovations for Existing Plants Advanced Integrated Gasification

31
Carbon Storage – Storage mechanisms vary by target class; generally multiple
processes which improve over time Physical trapping • • Impermeable cap rock Impermeable cap rock • • Either geometric or Either geometric or hydrodynamic stability hydrodynamic stability
Residual phase trapping Residual phase trapping • • Capillary forces Capillary forces immobilized fluids immobilized fluids • • Sensitive to pore geometry Sensitive to pore geometry (<25% pore vol.) (<25% pore vol.)
Solution/Mineral Trapping Solution/Mineral Trapping • • Slow kinetics Slow kinetics • • High permanence High permanence
Gas adsorption Gas adsorption • • For organic minerals only For organic minerals only
(coals, oil shales) (coals, oil shales) 2007 Overview, Brazil 42507
– How does it work? Storage mechanisms vary by target class; generally multiple
processes which improve over time
For organic minerals only For organic minerals only
1.0 MgCO 3
0.2 NaAlCO 3 (OH) 2
Source: S Benson, LBNL

32
DOE’s Carbon Sequestration Program
CORE R&D
Technology
Needs
Technology
Solutions
Sequestration Partnerships CO2 Capture
Lessons Learned
Carbon Storage
Monitoring, Mitigation, and Verification
NonCO2 Greenhouse Gas Control
Breakthrough Concepts
2007 Overview, Brazil 42507
DOE’s Carbon Sequestration Program
Validation
Characterization
DEMONSTRATION AND DEPLOYMENT
Regional Carbon Sequestration Partnerships
Other Commercial Opportunities
• LargeScale Projects • International Showcase
Deployment
FutureGen
• Carbon Sequestration
• Power Generation plus Hydrogen Production

33
Benefits of the RCSP Initiative
• Better understanding of regional opportunities − Match sources and sinks − Define scenarios for implementation
• Test and refine geologic models
• Measure fate of CO 2 and compare technologies
• Best management practices to address site selection, well design, operations, monitoring, and closeout
• Engagement of regional stakeholders − Implement public outreach and education
2007 Overview, Brazil 42507
Benefits of the RCSP Initiative
Better understanding of regional opportunities
Define scenarios for implementation
Test and refine geologic models
and compare technologies
Best management practices to address site selection, well design, operations, monitoring,
Engagement of regional stakeholders Implement public outreach and education
33

34
Regional Carbon Sequestration Partnerships
Characterization Phase − 24 months (20032005) − $16M DOE funds
Validation Phase − 4 years (2005 2009) − 7 Partnerships (41 states) − 25 Geologic field validation tests
− $112M DOE funds
Deployment Phase − 10 years (20082017)
• FY07 Initiated
− Several large injection tests in different geology
2007 Overview, Brazil 42507
Regional Carbon Sequestration Partnerships Representing:
• >340 Organizations • 41 States • 4 Canadian Provinces • 3 Indian Nations • 34% cost share

35
Validation Phase Field Tests • 25 Geologic Sequestration Injection Tests − 10 Saline Formation Tests − 9 EOR Tests − 5 ECBM Tests − 1 EGR Test
• 11 Terrestrial Sequestration Tests − Croplands − Rangelands − Wetlands − Forestlands
Injecting between 750
2007 Overview, Brazil 42507
Validation Phase Field Tests
Injecting between 750 – 525,000 tons of CO 2
Validating Storage Options Throughout the U.S.

36
Deployment Phase Scaling Up Towards Commercialization
• FY 20082017 (10 years)
• Several Large Volume Sequestration tests in North America
• Injection rates up to 1,000,000 tons per year for several years
• Scale up is required to provide insight into several operational and technical issues in different formations
2007 Overview, Brazil 42507
Deployment Phase Scaling Up Towards Commercialization
Sequestration tests in North
1,000,000 tons per year for
provide insight into several operational and technical issues in different formations
Years 13
Site selection and characterization; Permitting and NEPA compliance; Well completion and testing; Infrastructure development Years 47
CO 2 procurement and transportation; Injection operations;
Monitoring activities
Years 810
Site closure; Post injection monitoring; Project assessment
Phase III Timeline

37
Baseline Drilling
Summary of RCSP Phase II Field Activities
Partnership Geologic Field Test
Big Sky MSU Basalt and Mafic Rock Field Validation Test
MRCSP Battelle
Appalachian Basin Geologic Test
Cincinnati Arch Geologic Test
Michigan Basin Geologic Test
MGSC ISGS
Saline Formation Tests
Enhanced Oil Recovery Tests (Huff 'n Puff)
Enhanced Coalbed Methane Tests
PCOR EERC
Lignite in North Dakota Field Validation Test
Zama Field Validation Test
Beaver Lodge EOR Field Test
SECARB SSEB
Gulf Coast Stacked Storage Project
Black Warrior Basin Coal Test
Central Appalachian Basin Coal Test
Saline Reservoir Field Test: Mississippi Test Site
SWPCS UNMIMT
Paradox Basin, Utah: Aneth EOR/ Deep Saline Tests
Permian Basin, Texas: SACROCClaytonville EOR
San Juan Basin, New Mexico: ECBM Test
WESTCARB CEC
Rosetta Resources Stacked Gas/Saline Project
Northern Arizona Saline Formation CO2 Pilot
2007 Overview, Brazil 42507
rilling Injection MMV
FY 2006 FY 2007 FY 2008 FY 2009
Q 1
Q 2
Q 3
Q 4
Q 1
Q 2
Q 3
Q 4
Q 1
Q 2
Q 3
Q 4
Q 1
Q 2
Q 3
Q 4
Paradox Basin, Utah: Aneth EOR/ Deep Saline Tests
38
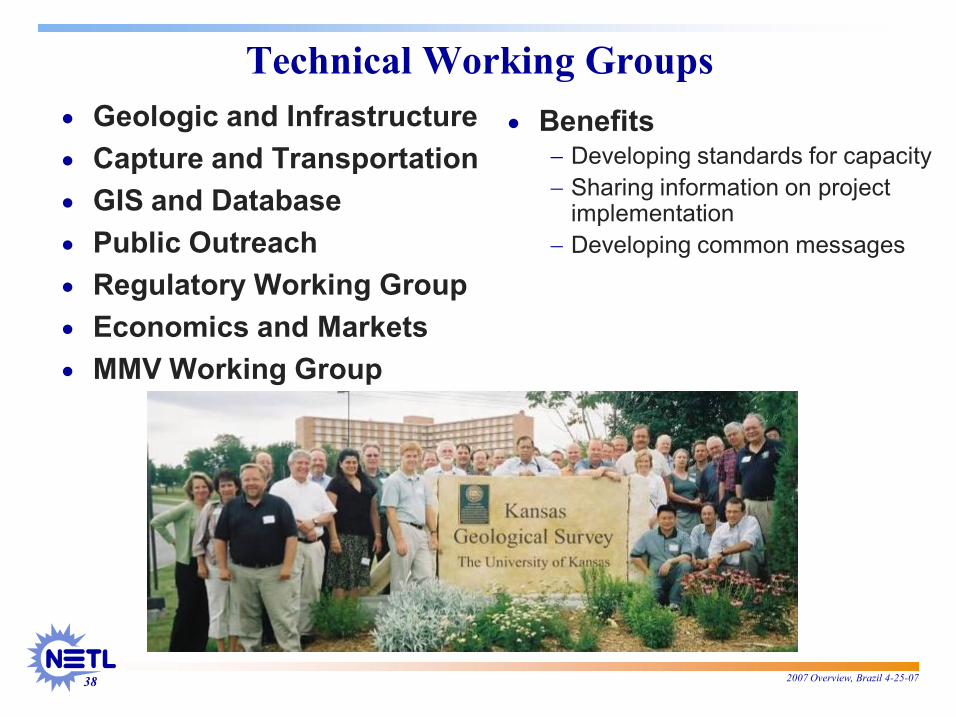
Technical Working Groups • Geologic and Infrastructure • Capture and Transportation • GIS and Database • Public Outreach • Regulatory Working Group • Economics and Markets • MMV Working Group
2007 Overview, Brazil 42507
Technical Working Groups • Benefits
− Developing standards for capacity − Sharing information on project implementation
− Developing common messages
39
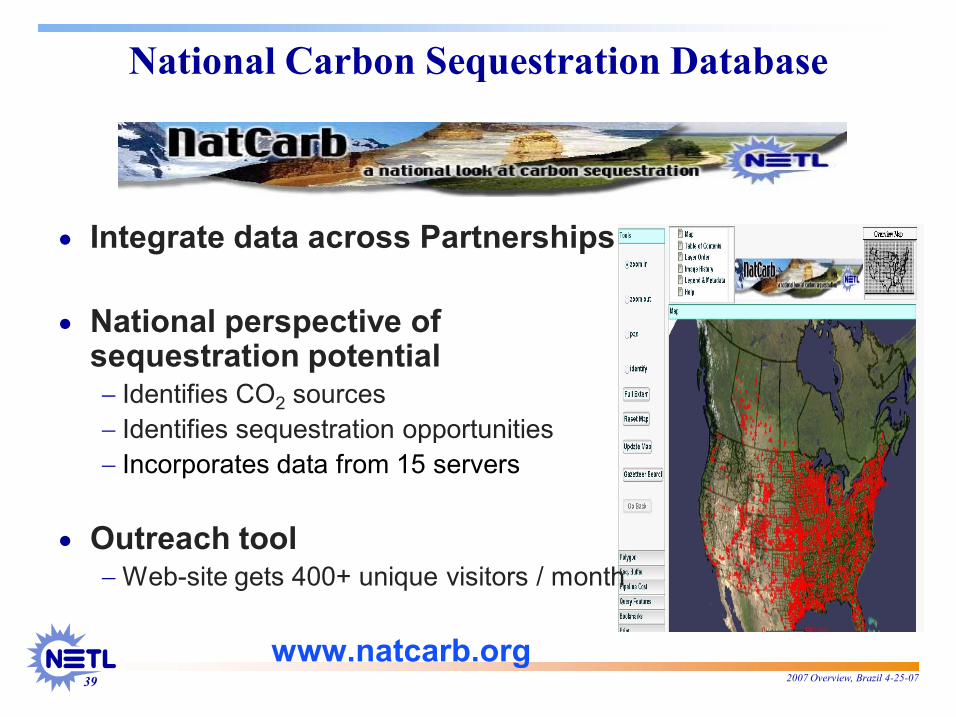
National Carbon Sequestration Database
• Integrate data across Partnerships
• National perspective of sequestration potential − Identifies CO 2 sources − Identifies sequestration opportunities − Incorporates data from 15 servers
• Outreach tool − Website gets 400+ unique visitors / month
www.natcarb.org 2007 Overview, Brazil 42507
National Carbon Sequestration Database
Integrate data across Partnerships
Identifies sequestration opportunities Incorporates data from 15 servers
site gets 400+ unique visitors / month
www.natcarb.org

40
National Atlas Highlights CO 2 Sources Documented in NatCarb
CO 2 Emission (Million Tons)
Number of Facilities
CO 2 Sources 3,809 4365
U.S. ~ 6 GT CO 2 /yr all sources 2007 Overview, Brazil 42507
National Atlas Highlights
North American CO 2 Storage Potential (Giga Tonnes)
Sink Type Low High
Saline 969 3,223
Unmineable Coal Seams 70 97
Oil and Gas Fields 82 83

41
Federal Support Advanced Coal Technology
$0
$50,000
$100,000
$150,000
$200,000
$250,000
$300,000
$350,000
$400,000
$450,000
$500,000
FY08* FY07 FY06 FY05 *Proposed
RD&D Budget
2007 Overview, Brazil 42507
Federal Support Advanced Coal Technology
FY04
Tax Credits •$1.65 B Total
•$1.3 B Power •$350 M Syn Gas
•$1.0 B Allocated • 15% / 20%
Loan Guarentee
• Up to 80%
• 30 Years

42
National Energy Technology Laboratory Mission
Implement research, development, and demonstration programs to resolve the
environmental, supply, and reliability constraints of producing and using fossil resources
2007 Overview, Brazil 42507
National Energy Technology Laboratory Mission
Implement research, development, and demonstration programs to resolve the
environmental, supply, and reliability constraints of producing and using fossil resources

43
NETL Mission Areas
Strategic Center for Coal
Strategic Center for Natural Gas
and Oil
2007 Overview, Brazil 42507
NETL Mission Areas
Strategic Center for Natural Gas
and Oil
Project Management
Center

44
National Energy Technology Laboratory
Albany, OR 0 100 200
Other
B.S
M.S.
Ph.D.
Fairbanks, AK
1,200 employees ½ Federal ½ Contractor
Fundamental Science >>> Commercial Demos
Scientists Engineers Technical
Administrative Professional
Other 0
2007 Overview, Brazil 42507
National Energy Technology Laboratory
Pittsburgh, PA
Morgantown, WV
Tulsa, OK
300 400
DOE’s Fossil Energy National Laboratory
0 50 100 150 200 250

45
1918 Petroleum Research Begins In
Bartlesville, OK
1910 Coal
Research Center Opens in
Pittsburgh, PA 1948
Pittsburgh Facility
Grows with Synthetic
Fuel Interest
1946 Synthesis
Gas Research Begins in
Morgantown, WV 1975
Centers Begin Managing Contracted Research
1954 Station Opens at Current
Morgantown Site
Department Names Energy Technology
NETL History
2007 Overview, Brazil 42507
Centers Begin Managing Contracted Research
1996 Birth of the Federal Energy
Technology Center (FETC)
1977 New
Department Names Energy Technology Centers
1999 FETC
Becomes National
Laboratory
1998 Bartlesville Facility Closes
2001 Arctic Energy Office Opens
2000 NPTO Joins
NETL
NETL History
2006 Materials Research Albany
Research Center

46
1918 Petroleum Research Begins In
Bartlesville, OK
1910 Coal
Research Center Opens in
Pittsburgh, PA 1948
Pittsburgh Facility
Grows with Synthetic
Fuel Interest
1946 Synthesis
Gas Research Begins in
Morgantown, WV 1975
Centers Begin Managing Contracted Research
1954 Station Opens at Current
Morgantown Site
Department Names Energy Technology
NETL History
Print 2007 Overview, Brazil 42507
Centers Begin Managing Contracted Research
1996 Birth of the Federal Energy
Technology Center (FETC)
1977 New
Department Names Energy Technology Centers
1999 FETC
Becomes National
Laboratory
1998 Bartlesville Facility Closes
2001 Arctic Energy Office Opens
2000 NPTO Joins
NETL
NETL History
2006 Materials Research Albany
Research Center

47
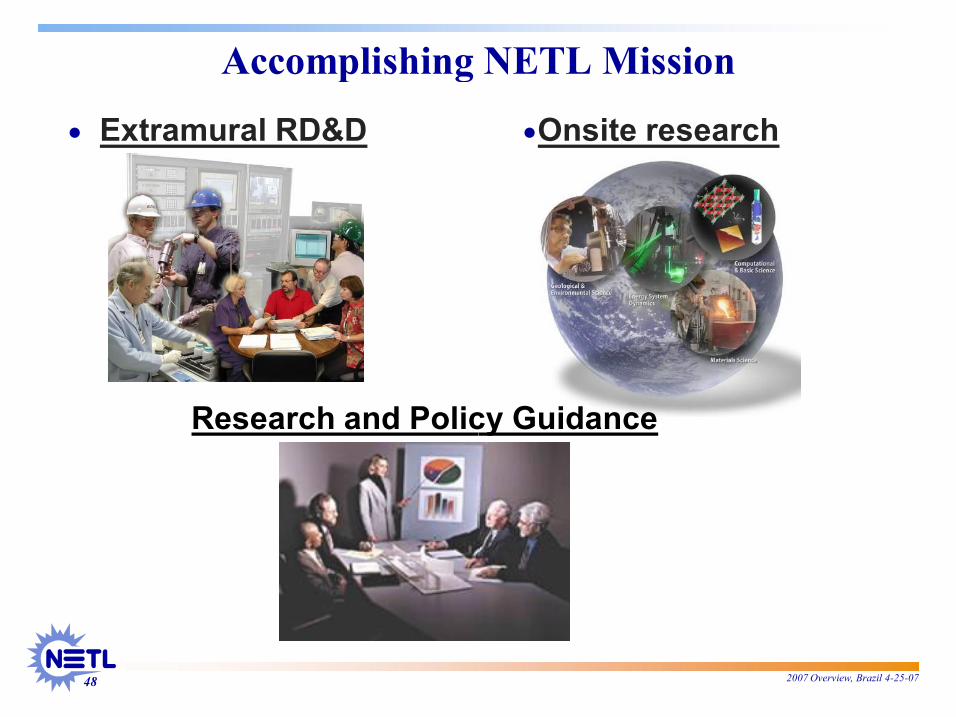
Accomplishing NETL Mission
• Extramural RD&D >1,800+ activities 45 states 40 countries
>$9 billion total $5 billion cost share
>Geological & Environmental Science
>Energy System Dynamics >Material Science >Computational & Basic Science
Research and Policy Guidance
> Systems analysis > Life cycle analysis > Benefits quantification
> Forecasts and trend analysis > Technology implications
> Assessment of natural resource requirements
2007 Overview, Brazil 42507
Accomplishing NETL Mission
•Onsite research Geological & Environmental Science Energy System Dynamics Material Science Computational & Basic Science
Research and Policy Guidance
Forecasts and trend analysis Technologyregulatory implications Assessment of natural resource requirements
48
Accomplishing NETL Mission
• Extramural RD&D
Research and Policy Guidance
2007 Overview, Brazil 42507
Accomplishing NETL Mission
•Onsite research
Research and Policy Guidance

49
Accomplishing NETL Mission
• Extramural RD&D >1,800+ activities 45 states 40 countries
>$9 billion total $5 billion cost share
>Geological & Environmental Science
>Energy System Dynamics >Material Science >Computational & Basic Science
Research and Policy Guidance
> Systems analysis > Life cycle analysis > Benefits quantification
> Forecasts and trend analysis > Technology implications
> Assessment of natural resource requirements
2007 Overview, Brazil 42507
Accomplishing NETL Mission
•Onsite research Geological & Environmental Science Energy System Dynamics Material Science Computational & Basic Science
Research and Policy Guidance Forecasts and trend analysis Technologyregulatory implications Assessment of natural resource requirements
50 2007 Overview, Brazil 42507

51
Advanced Energy Technologies Can Resolve the Environmental, Supply, and Reliability
Constraints of Producing and Using Fossil Fuels
2007 Overview, Brazil 42507
Advanced Energy Technologies Can Resolve the Environmental, Supply, and Reliability
Constraints of Producing and Using Fossil Fuels

52
Visit Our Websites
Fossil Energy website: www.fe.doe.gov
2007 Overview, Brazil 42507
NETL website: www.netl.doe.gov
Visit Our Websites