challenges related to analysis of anions in degraded
TRANSCRIPT

1876-6102 © 2016 The Authors. Published by Elsevier Ltd. This is an open access article under the CC BY-NC-ND license (http://creativecommons.org/licenses/by-nc-nd/4.0/).Peer-review under responsibility of the Programme Chair of the 8th Trondheim Conference on CO
2 Capture, Transport and Storage
doi: 10.1016/j.egypro.2016.01.019
Energy Procedia 86 ( 2016 ) 181 – 196
ScienceDirect
The 8th Trondheim Conference on CO2 Capture, Transport and Storage
Challenges related to Analysis of Anions in degraded Samples from Pilot and Lab Experiments
Solrun Johanne Vevelstada* and Hallvard F. Svendsenb aSINTEF Materials and Chemistry, 7465 Trondheim, Norway
bNorwegian University of Science and Technology, 7491 Trondheim, Norway
Abstract
Analyses of degraded samples from CO2 capture experiments and pilots are complicated because of the diversity of the degradation compounds and the high amine and CO2 contents in the samples. Little work has been conducted focusing on the analytical techniques and factors influencing qualitative and quantitative results. Uncertainties in the results have to be considered. Matrix effects can mask the degradation compounds and thereby influence quantification. Separation of the analytes can be a problem and any identification must be supported by reasonable formation mechanisms for the system. In this study a large range of samples from lab experiments and pilots have been analysed using two different IC columns: IonPac AS 15 and AS11-HC. Factors influencing qualitative and quantitative analyses were investigated, for example matrix interactions, baseline separation, differences between columns and sample pre-treatment. Additionally, quantitative uncertainties were estimated such as reproducibility, comparisons between columns and effect of dilution. The two columns used give different separation of the anions. Acetate and glycolate are only separated on IonPac AS15, while IonPac AS11-HC showed better separation of sulphate and oxalate. Formate and HEOX were not baseline separated on any of these columns. The amine matrix influenced retention time for early eluting peaks and made baseline separation more difficult. Extra peaks caused by the matrix were seen for KGly and in general an amino acid matrix, such as KSAR and KGly, created signal noise, thereby impairing quantification. Sample pre-treatment with an OnGuard II H cartridge was tested and found to be of limited use. It should be used with care not to falsify the analyses. The analytical uncertainty was influenced by missing baseline separation between some analytes, low concentrations of analytes and wide peaks due to low eluent concentration. © 2015 The Authors. Published by Elsevier Ltd. Peer-review under responsibility of the Programme Chair of The 8th Trondheim Conference on CO2 Capture, Transport and Storage.
* Corresponding author..
E-mail address: [email protected]
Available online at www.sciencedirect.com
© 2016 The Authors. Published by Elsevier Ltd. This is an open access article under the CC BY-NC-ND license (http://creativecommons.org/licenses/by-nc-nd/4.0/).Peer-review under responsibility of the Programme Chair of the 8th Trondheim Conference on CO
2 Capture, Transport and Storage
brought to you by COREView metadata, citation and similar papers at core.ac.uk
provided by Elsevier - Publisher Connector

182 Solrun Johanne Vevelstad and Hallvard F. Svendsen / Energy Procedia 86 ( 2016 ) 181 – 196
Keywords: CO2 capture; amine; anion analysis; matrix effect; sample pre-treatment; uncertainty considerations
1. Introduction
Amines are commonly used as absorbents in post-combustion CO2 capture. The exhaust gas composition and the variable conditions in a CO2 capture plant cause different types of degradation such as thermal degradation with or without CO2 and oxidative degradation. The degradation of amines in post-combustion carbon capture plants is known to cause problems both related to process operation (fouling, foaming, and corrosion), to the economy by loss of solvent and to the environment through emissions [1-3]. A wide variety of species and degradation compounds of highly different nature exist in the solvent, e.g. amines, oxazolidinones, imidazoles, piperazinones, carboxylic acids, aldehydes, amides, carbonate and carbamate. There is no universal single method by which a solvent phase can be fully mapped and it is therefore necessary to combine several methods. GC-MS (Gas Chromatography – Mass Spectrometry), LC-MS (Liquid Chromatography – Mass Spectrometry) and IC (Ion Chromatography) are the most commonly used analytical techniques for identification and quantification [3-11].
Ion Chromatography is an old technique and anion IC is well-known in the research groups working on CO2 capture. It has successfully been used for analysing degraded samples with anionic components [4, 6-9, 12] from both pilot and lab experiments. Few, e.g. Kadnar and Reidel [6], have focused on the analytical technique itself and challenges and problems related to analysis of anion compounds in these matrices.
Common problems for ion analyses are interferences due to the eluent or from the sample matrix. The sample matrix can co-elute with ions of interest, contaminate ions, shift the retention time, disrupt the baseline, overload the column and could be retained irreversibly on the packing [13-15]. The quality of the eluent depends on the quality of the water and salt sources. In most cases sample pre-treatment prior to determining inorganic anions by IC techniques only involves simple operations such as filtration, sample dilution, pH adjustment, protein precipitation and extraction plus concentrating up of the analyte. However, sometimes samples require more complex preparation procedures. This occurs, e.g., when the concentration of anions in the samples is very low, when the concentration of sample matrix anions is high relative to the analytes, or when matrix constituents are a source of interference in the IC separation [16]. Solid-phase extraction is one technique used to eliminate sample acidity or basicity. Sample preparation can result in loss, dilution or alteration of components and the effect of using sample pre-treatment techniques has to be carefully evaluated [14, 15].
Samples from a CO2 capture pilot or experiments in the laboratory will typically have high contents of amine and CO2 which create problems for the analysis. This paper focuses on Anion Chromatography and experience obtained working on degraded samples from a diverse collection of laboratory and pilot experiments and is based on a large number of different samples. The paper aims at discussing challenges related to analyses of such samples and covers sensitivity and uncertainty related to both qualitative and quantitative analyses as well as sample pre-treatment.
Nomenclature
BHEOX N,N'-Bis(2-hydroxyethyl)oxamide (1871-89-2) GC-MS Gas Chromatography – Mass Spectrometry HEOX 2-[(2-hydroxyethyl)amino]-2-oxo-acetic acid (5270-73-5) IC Ion Chromatography LC-MS Liquid Chromatography – Mass Spectrometry MEA 2-ethanolamine (141-43-5)
2. Experimental
An ICS-5000 Dual RFIC Ion Chromatography Dionex System was used for the analyses, for more details of the system see Vevelstad et al.[11]. Two different columns were used; IonPac AG15 guard column (2*50mm)/AS15

Solrun Johanne Vevelstad and Hallvard F. Svendsen / Energy Procedia 86 ( 2016 ) 181 – 196 183
analytical column (2*250mm) and IonPac AG11HC guard column (2*50mm)/AS11HC analytical column (2*250mm) with KOH as eluent. A gradient method starting at respectively 6 mM and 1 mM KOH for IonPac AS15 and AS11-HC was used. Both methods ended at 60 mM KOH.
All samples were diluted in deionized water (18.2 M ). The level of dilution was decided for each individual set of degradation samples, and the dilutions were performed in several steps (diluting the sample 10 or 50 times in each step).
Qualititative analyses: Anions in degraded samples were identified based on external standards and/or spiking the sample with the anion of interest. Commercial available anions used for qualitative analysis were: glycolate, acetate, formate, propionate, nitrite, nitrate, sulphate, chloride, oxamate and oxalate.
Quantitative analyses: To quantify a compound, different concentrations of the commercial standards were prepared. Both volumetric and mass based quantification was performed, however mass was preferred. A 1000 ppm (mg/kg) (~1mg/mL) standard solution was prepared and was obtained by adding 100 mg of each analyte (Xi) to a 100 mL flask; weight was noted for each analyte. Deionized water (18.2 M ) was added to the volumetric mark and weight noted. The standard solution was then diluted with deionized water to the necessary concentrations. Preferred concentrations for the calibration curve were: 10 - 5 - 2.5 - 1 - 0.5 ppm. However the calibration curve could be expanded depending on difficulties of finding a good dilution for the degraded sample such that all the analytes would be within the range of the calibration curve. The peak shape of some of the compounds and the close retention times for in particular the organic acids made it difficult to integrate accurately at the higher concentrations (>10 ppm). Generally two standard solutions were prepared, one included formate, nitrate, acetate, sulphate and oxalate and in some cases also glycolate. The second standard only contained nitrite. Variations were needed depending on the analytes to be quantified. Standards were prepared fresh for new analyses. Plotting of the peak area towards the concentrations gave a linear calibration curve for each analyte, which was then fitted by linear regression. The peak area of each analyte was obtained by integrating automatically or manually using the Dionex Chromeleon 7.1 software. The detection limit was also determined for each analyte for each experiment. The standard curve in water typically gave a detection limit of 0.5 ppm.
Quantification of compounds in degraded samples was obtained by using appropriate dilution of the unknown samples and injecting the sample using the same method as for the standards. The real concentrations of compounds in a degraded sample were found from the calibration curve and the dilution used for the sample.
2.1. Tests conducted
As mentioned earlier, this work is based on a large number of analyses, but to illustrate the problems arising, a set of samples were chosen as examples. Challenges that are discussed are: shift in retention time, matrix interactions, sample pre-treatment, misinterpretation of unknown peaks and differences between columns. For most of the tests end samples from lab experiments or pilot samples are used for illustration, and in some cases the time series is also shown. An overview of the original samples used as examples, with matrix information, background for the sample and which tests were conducted for the sample, is given in table 1. Descriptions of experimental conditions used to obtain the samples are given in detail in the given references.

184 Solrun Johanne Vevelstad and Hallvard F. Svendsen / Energy Procedia 86 ( 2016 ) 181 – 196
Table 1: Samples used in different tests
Sample Matrix Experiment Reference Test Sample 1 2-ethanolaminea (MEA) Open batch system [4, 17] Identification of analytes Sample 2 MEAa Closed batch system [10] Columns & sample pre-treatment Sample 3 Potassium Glycinea (KGly) Closed batch system [10] Matrix and shift in retention time Sample 4 Potassium Sarcosinea
(KSAR) Closed batch system [10] Matrix and shift in retention time
Sample 5 MEAa Pilot [4, 17] Sample pre-treatment Sample 6 Diethanolamineb (DEA) Pilot [18] Sample pre-treatment Sample 7 MEAa Pilot [18] Sample pre-treatment Sample 8 MEAa Pilot [18] Sample pre-treatment Sample 9 Lab experiment [19]
aDegradation lab or pilot experiment conducted on 30 wt% amine or aminoacid concentration bDegradation lab or pilot experiment conducted on 50 wt% amine or aminoacid concentration
In order to compare analyses of samples with known standards, several standard mixtures were prepared and used in different tests.
Standards were prepared fresh before each particular test and the combination of anions in the standards varied depending on which column was used and what analysis was performed. The standards were used for the tests for matrix interference, the shift in retention time tests and in the sample pre-treatment tests as described later.
In the following the procedures used to investigate the various problems that can occur are described individually. These are meant as examples and, if to be used for other purposes, must be adjusted to the problem at hand.
2.2. Interpretation of unknown peak (retention time 12.5 minutes, IonPac AS11-HC).
In Sample 1 an unknown peak occurred and identification was desired. Three tests were performed: 1) The MEA degraded sample (sample 1) from this experiment was treated with 5M NaOH to investigate if the
peak was an amide. The details of the method are given by Sexton [8]. The degraded sample and 5M NaOH were weighed out (1:1, 100 μl each), mixed and left over night. The degraded samples before and after NaOH treatment were then diluted 100 times and analysed on IonPac AS11-HC.
2) Testing for oxamic acid and propionic acid: 4 samples of sample 1 were analysed on the IonPac AS11-HC column with a total dilution of 1000. The first sample contained only the degraded sample and deionized water for comparison, the second sample was spiked with oxamic acid and propionic acid giving a concentration of 10 ppm of each of them, the third sample was only spiked with oxamic acid and the fourth sample only with propionic acid.
3) Testing for a non-available anion: An anion that was not commercially available was synthesised as described by Vevelstad et al. [11] and used for identification of 2-[(2-hydroxyethyl)amino]-2-oxo-acetic acid (HEOX).
2.3. Shift in retention time/matrix effect
The standards used to investigate matrix effects were prepared adding the desired amount of 30 wt% unloaded amine or loaded with CO2 ( =0.4 mol CO2/mol amine) to the diluted standards and the samples were then analysed on the IonPac AS15 column. Quantification of the analytes was compared to known concentrations of the analytes in the standards.
Additionally a test was conducted where the standard was spiked with 30 wt% amine (1/10 dilution of 30 wt% amine). Analytes in degraded samples were quantified using both the standard spiked with the same amine and a normal standard in water. The results were compared using IonPac AS15.
2.4. Sample pre-treatment (pre-treatment beyond dilution)
Tests were conducted for pre-treatment of samples 2 and 5-9 using Dionex OnGuard II H cartridges [20] to investigate the possible use of OnGuard or InGuard cartridges to improve the chromatograms for these systems.

Solrun Johanne Vevelstad and Hallvard F. Svendsen / Energy Procedia 86 ( 2016 ) 181 – 196 185
Diluted and concentrated degraded samples were filtered through the cartridge. The concentrated samples were diluted with deionized water after filtration. All samples were analysed on IonPac AS15.
2.5. Uncertainty
Two columns were used for analysing the degraded samples. The columns behave differently depending on degradation product analysed for and amine system used. Thus, quantification of the same anion in the same sample on the two columns may be slightly different. A time series from the experiment giving sample 2 as end sample was analysed on the IonPac AS15 column at two different points in time, 1 year in between, and the last time the samples were also analysed on IonPac AS11-HC column. Standard deviations ( ) and mean values were calculated for the IonPac AS15 column and for all three analyses.
3. Results and discussion
Samples from degradation experiments and pilot plants contain degradation compounds of different nature and at highly different concentrations. However, the amine or amino acid content in these samples will be dominating and they most likely will influence the chromatograms. Observations and experience working with such samples have illustrated challenges, problems and important factors necessary to consider for the interpretations to be correct.
3.1. Sensitivity
In the ICS-5000 compounds could be identified and quantified down to 0.5 ppm (weight based (mg/kg)) for samples in water. This gives a sensitivity of 50 ppm in dilutions of 100 times. However, sensitivity varied depending on the matrix of the sample and the analyte.
3.2. Interpretation of peaks for analyte identification
Analytes are normally identified based on external standards and retention time. As will be shown, this method has some weaknesses and can lead to misinterpretation of the chromatogram. In the MEA degraded sample (sample 1) a peak was first misinterpreted as propionate. This was due to an increase in the peak area of one of the peaks in the chromatogram when the sample was spiked with propionate (see Fig. 1, blue curve). However, propionate has a chain of three carbons and C-C bond formation in this way is not likely to be a main mechanism in MEA degradation. Tests were therefore conducted to further verify or dismiss propionate as a degradation compound in MEA degradation samples.
An hypothesis was that this peak could be an amide; for example oxamic acid. An amide hydrolysis, adding sodium hydroxide to the degraded sample as described by Sexton [8], was conducted to verify this hypothesis. Untreated and treated (with NaOH) samples were then diluted in deionized water to give the same total dilution. The peak believed to be propionate (retention time ~13 min, Fig. 1) decreased when sodium hydroxide was added while the formate and oxalate peaks increased. The nitrite and nitrate peaks seemed to remain unchanged. The same behaviour was observed for several samples. The reduction of the peak with retention time ~13 min suggested that the peak was an amide and not acid such as propionic acid. Further tests were conducted to verify if the unidentified peak could be oxamic acid. Three samples of sample 1 were analysed on the IonPac AS11-HC column with a total dilution of 1000 times and the results are given in Fig. 1 for retention times between 10 and 20 minutes. The chromatograms for retention times lower than 10 and higher than ~15 minutes (formate peak) were similar for the three samples; however, a small increase in oxalate concentration was seen for the sample spiked with oxamic acid. In Fig. 1 black is the original sample 1, green was spiked with oxamic acid and blue was spiked with propionic acid giving a concentration of 10 ppm of each of them.
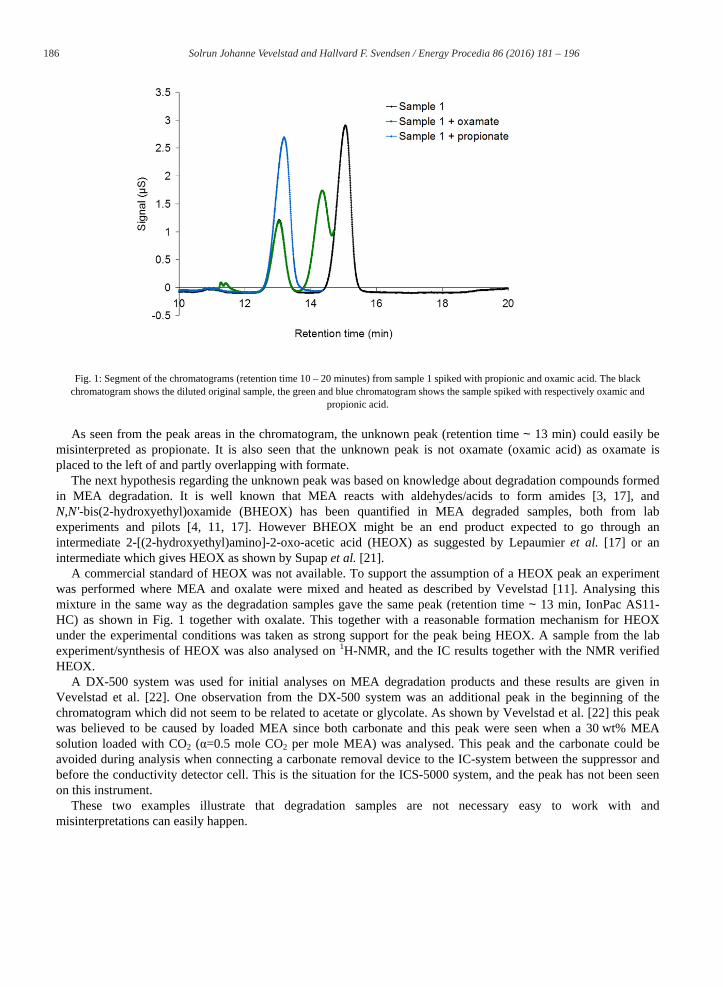
186 Solrun Johanne Vevelstad and Hallvard F. Svendsen / Energy Procedia 86 ( 2016 ) 181 – 196
Fig. 1: Segment of the chromatograms (retention time 10 – 20 minutes) from sample 1 spiked with propionic and oxamic acid. The black chromatogram shows the diluted original sample, the green and blue chromatogram shows the sample spiked with respectively oxamic and
propionic acid.
As seen from the peak areas in the chromatogram, the unknown peak (retention time ~ 13 min) could easily be misinterpreted as propionate. It is also seen that the unknown peak is not oxamate (oxamic acid) as oxamate is placed to the left of and partly overlapping with formate.
The next hypothesis regarding the unknown peak was based on knowledge about degradation compounds formed in MEA degradation. It is well known that MEA reacts with aldehydes/acids to form amides [3, 17], and N,N'-bis(2-hydroxyethyl)oxamide (BHEOX) has been quantified in MEA degraded samples, both from lab experiments and pilots [4, 11, 17]. However BHEOX might be an end product expected to go through an intermediate 2-[(2-hydroxyethyl)amino]-2-oxo-acetic acid (HEOX) as suggested by Lepaumier et al. [17] or an intermediate which gives HEOX as shown by Supap et al. [21].
A commercial standard of HEOX was not available. To support the assumption of a HEOX peak an experiment was performed where MEA and oxalate were mixed and heated as described by Vevelstad [11]. Analysing this mixture in the same way as the degradation samples gave the same peak (retention time ~ 13 min, IonPac AS11-HC) as shown in Fig. 1 together with oxalate. This together with a reasonable formation mechanism for HEOX under the experimental conditions was taken as strong support for the peak being HEOX. A sample from the lab experiment/synthesis of HEOX was also analysed on 1H-NMR, and the IC results together with the NMR verified HEOX.
A DX-500 system was used for initial analyses on MEA degradation products and these results are given in Vevelstad et al. [22]. One observation from the DX-500 system was an additional peak in the beginning of the chromatogram which did not seem to be related to acetate or glycolate. As shown by Vevelstad et al. [22] this peak was believed to be caused by loaded MEA since both carbonate and this peak were seen when a 30 wt% MEA solution loaded with CO2 ( =0.5 mole CO2 per mole MEA) was analysed. This peak and the carbonate could be avoided during analysis when connecting a carbonate removal device to the IC-system between the suppressor and before the conductivity detector cell. This is the situation for the ICS-5000 system, and the peak has not been seen on this instrument.
These two examples illustrate that degradation samples are not necessary easy to work with and misinterpretations can easily happen.

Solrun Johanne Vevelstad and Hallvard F. Svendsen / Energy Procedia 86 ( 2016 ) 181 – 196 187
3.3. Column choice
The two columns tested, IonPac AS15 and AS11-HC, offer different solutions to separating analytes. A gradient method was used for both columns and the methods were of nearly the same length (42-50 minutes). Both columns were found suitable for our analyses. However, the IonPac AS11-HC column could not separate acetate and glycolate [22]. Acetate and glycolate can be separated using IonPac AS15, but sulphate and oxalate show bad separation on this column. Thus, IonPac AS11-HC or a different column should be chosen if the degraded samples contain high amounts of sulphate. In general it seemed that IonPac AS11-HC gave slightly higher concentrations of the analytes than IonPac AS15 - with an exception of nitrate and oxalate. This can be seen in table 2, where anion concentrations as function of time are given for an MEA experiment in a closed batch setup (sample 2) [10].
Table 2: Quantification of different analytes (sample 2) using IonPac AS11-HC and AS15a
Time (days) Formate Formatea Nitrite Nitritea Nitrate Nitratea Oxalate Oxalatea
0 <50 <50 <50 <50 <50 <50 <50 <50 1 148 89 65 <50 <50 <50 <50 <50 2 273 123 109 65 <50 <50 <50 <50 4 402 219 109 34 <50 <50 <50 <50 7 716 462 232 118 <50 <50 <50 59 11 1030 721 317 209 <50 <50 <50 75 15 1485 1141 431 320 85 81 60 102 19 1973 1632 556 459 101 140 109 179 21 2273 1896 630 539 162 175 151 180
The quantification differences may be due to variations in baseline separation between the anions. For example
nitrate and oxalate did not show 100% baseline separation on the IonPac AS15 and improper baseline separation influences peak integration (see Fig. 2 for sample 2 together with standard 1: glycolate, acetate, formate, nitrate and oxalate and standard 2: nitrite). None of the columns gave baseline separation between formate and HEOX and it is difficult to give a general statement regarding which of the columns gives better separation.
Fig. 2: Chromatograms for sample 2 analysed on IonPac AS15 column (left).and on the IonPac AS11-HC column (right).
As can be seen from Figure 2, organic acids with low retention times were not baseline separated on any of the columns. IonPac AS11-HC showed good separation of nitrate and oxalate. Nitrite was an asymmetric peak, and seemed to have a tail on both of the columns, but most on IonPac AS15. Depending on dilution and column used, analytes could be under-predicted or over-predicted because of bad baseline separation and further tests have to be conducted to verify which of the two columns tested would be the best for the individual anions.

188 Solrun Johanne Vevelstad and Hallvard F. Svendsen / Energy Procedia 86 ( 2016 ) 181 – 196
3.4. Effect of shift in retention time and matrix
Retention time is influenced by both the eluent itself as shown by Vevelstad et al. [22] and the matrix of the sample. It is known that sodium hydroxide as eluent is not stable and therefore has to be prepared fresh every, or every second day depending on the analysis. This was improved using an eluent generator, as for the ICS-5000 system, minimizing the eluent effect on retention time. However, the degradation samples contain high concentrations of amine which are believed to influence the separation of analytes and which would be likely to shift the retention times towards lower values because of higher base concentrations. Shift in retention time was visible for the IonPac AS11-HC chromatogram shown in Fig. 2, where the retention times for formate and HEOX in the degraded sample were slightly shifted to the left. The retention times of the analytes in the IonPac AS15 column were close to the standards. An explanation for these observations can be found in differences in the column method. Both of the columns used a gradient method. However, the concentration of KOH for the IonPac AS11-HC column started at 1 mM while the IonPac AS15 started at 6 mM. The low concentration of KOH in the beginning of the method for the AS11-HC column implied that the pH of the sample would be more important and could influence the retention time. Nitrite, oxalate and nitrate were not influenced because they were eluted at higher KOH concentrations. This effect was not seen on the DX-500 system, Vevelstad et al. [22]. The contradicting observations for the two systems may be explained by the difference in size of the two columns – 4 mm diameter on the DX-500 system and 2 mm on the ICS-5000 system. It is possible that the higher sensitivity obtained when going from 4 mm to 2 mm was not necessarily an advantage because it also increased the matrix problems for the samples. Additionally the test performed on the DX-500 system was conducted with formate and nitrate in fresh amine solutions, while the test on the ICS-5000 system was conducted on degraded samples.
Several types of tests were conducted to study the effect of bulk amine on both the chromatogram and also on the quantification of the analytes. For the first test (experiment 1) three different concentrations of two standard solutions were added to 30 wt% loaded and unloaded amine solutions. One of the standard solutions contained eight anions (glycolate, acetate, formate, propionate, chloride, sulphate, oxalate and nitrate), while the other contained only nitrite. The resulting dilutions of the amine solutions were respectively 100, 500 and 1000 times. The results showed some variation. However, as expected it seemed like the uncertainty in the quantification of the analytes decreased with increasing analyte concentration, indicating that the matrix influenced the sensitivity and detection limits of the samples. Acetate and propionate seemed particularly difficult to quantify when present in low concentrations. However, it did not seem that analytes at higher concentrations were influenced by type of amine, loaded amine instead of unloaded amine or the dilution of amine matrix (100 or 1000 times) in the sample since only small differences were observed.
Another test (experiment 2) was conducted to verify that amine matrix did not significantly influence quantification of anions in degraded samples. This was done by preparing standards in water or in an amine matrix and using them to quantify analytes in degraded samples. Amine/amino acid concentrations in these tests were higher than normally used for degraded samples (the samples were spiked with 30 wt% amine giving an amine dilution of 10 for the samples). Chromatograms for standards of glycolate, formate and nitrate (100 ppm) in DMMEA, MMEA and water are given in Fig. 3.

Solrun Johanne Vevelstad and Hallvard F. Svendsen / Energy Procedia 86 ( 2016 ) 181 – 196 189
Fig. 3: Standard of glycolate, formate and nitrate in water (black), added DMMEA (1/10, green) or MMEA (1/10, blue).
The concentration of each anion in the calibration curve ranged from 5 – 400 ppm. Looking at the chromatograms for the standard in DMMEA, MMEA and water it was seen that not all of the analytes were separated and visible in the samples spiked with amine for the whole concentration series. For DMMEA, glycolate and nitrate were observed at concentrations higher than 50 ppm, but not formate. Formate and nitrate were detectable for concentrations higher than 25 ppm in MMEA. This was not the case for glycolate. Fig. 3 indicates that sensitivity (detection limit) and problems with amine matrix vary with amine and amine concentration. This in a way contradicts the first results (experiment 1) stating that it was difficult to conclude that different amines showed different behaviour. However, the amine contents in the samples in Fig. 3 were ten times higher than for the first test where amine was diluted 100, 500 and 1000 times. The alkalinity of the amines in the last test (Fig. 3) will therefore have much higher impact on the chromatogram.
The second test also showed that amino acids, KGly and KSAR produced more noise, especially for the early eluting peaks as shown in the chromatogram to the left in Fig. 4 for a diluted KGly sample and the chromatogram to the right shows an example of a degraded sample of KSAR compared to standards of 7 anions.
A standard of acetate, glycolate and formate spiked with KGly did not give separation of these three anions. Since KGly itself gave peaks overlapping with these anions (Fig. 4) it will be difficult to say anything certain for these anions. Qualitative and quantitative analyses of samples with KSAR and KGly matrix were complicated because of higher noise/signal level and matrix overlapping with peaks of interest.

190 Solrun Johanne Vevelstad and Hallvard F. Svendsen / Energy Procedia 86 ( 2016 ) 181 – 196
Fig. 4: The left chromatogram: KGly diluted 10 times. The rigth chromatogram: a degraded sample of KSAR (sample 4, diluted 100 times, blue) and a mix of anions (standard, black).
3.5. Sample pretreatment
As shown earlier, high amine concentration in the samples resulted in more difficult separation of anions in degraded samples and shifts in retention time were seen for peaks up to a retention time of 15 minutes, especially for the IonPac AS11-HC column. As mentioned earlier, low eluent concentration could explain the shift in retention time. However, it has always been uncertain if the amine/amino acids content in the samples could hide other peaks either from the increased background noise or overlapping with peaks (KGly).
Filtration and dilution may sometimes be helpful to limit interferences caused by the matrix but in many cases this will not be sufficient. Solid phase extraction (SPE) has been shown to be a useful technique to remove interferences caused by for example basicity or acidity of the sample [14].
A Dionex OnGuard II H cartridge was used to study possibilities of improving the analysis using sample pre-treatment. This cartridge neutralises alkaline samples and removes high levels of alkaline earth and transition metals from the sample matrix [20]. Tests were conducted to investigate the OnGuard cartridge.
An initial test was conducted where a standard solution of five anions (glycolate, acetate, formate, nitrate and oxalate) spiked with amine was diluted 100 times before the sample was filtered through an un-rinsed OnGuard cartridge. The resulting chromatogram showed sulphate, which was not one of the anions in the standard. In addition, the acetate peak was higher than expected. This suggests that sulphate and acetate might be ionic impurities remaining in the cartridge after the production process. Acetate and sulphate are anions that might be present in our samples and it was therefore important to verify this and to see if these peaks could be removed by proper rinsing of the cartridge before use.
A sample of deionized water (green curve) filtered through the cartridge and analysed together with three treated solutions of diluted sample 7 (1/100) (black curve) are shown in Fig. 6 for retention times 8-14 and 27-30 minutes (IonPac AS15). One part of the diluted sample 7 was filtered through an un-rinsed cartridge (yellow curve), one through a rinsed cartridge (blue curve) and one was left un-treated (black curve), see Fig. 5.
Fig. 5 shows that even after rinsing the cartridge, both acetate and sulphate were present in the chromatogram. However, none of these anions were seen in the un-treated sample. These chromatograms illustrate that sample pre-treatment operations need to be investigated and validated thoroughly and that the results need to go through a quality control. Based on the preliminary results it would be difficult to trust quantification of acetate and sulphate. Additionally these anions could influence quantification of other anions since acetate and formate were not baseline separated on IonPac AS15. Integration of the area under the peaks might therefore be lower or higher than in reality, increasing the uncertainty of the quantification.

Solrun Johanne Vevelstad and Hallvard F. Svendsen / Energy Procedia 86 ( 2016 ) 181 – 196 191
Fig. 5: Sections (A: 8-14 minutes to the left, B: 27-30 minutes to the right) of the chromatograms for un-treated sample 7 (black), deionized water (green), sample 7 from rinsed cartridge (blue) and sample 7 from un-rinsed cartridge (yellow).
Since acetate and sulphate were seen after rinsing the cartridge with water, another test was conducted to try to
minimise the quantification error. It was assumed that acetate and sulphate concentrations from the production process of the cartridge were small and therefore might not influence the chromatogram if samples were filtrated undiluted through the OnGuard II H cartridge. This test was also performed in the IonPac AS15 using several types of samples; sample 5 from a campaign at the Esbjerg pilot plant, samples 6-8 from different pilot tests, sample 9 from a lab experiment and sample 2 from an oxidative degradation experiment in a closed batch setup (more details on the samples are given in table 1). The samples were first filtered through the OnGuard II H cartridge and then diluted.
For sample 5, the peaks in the chromatogram were similar for the original and treated samples and there was no sign of any increase in acetate or sulphate in the sample filtered through the OnGuard II H cartridge. The retention time between the same peaks for the two chromatograms for the lower retention time range varied slightly, due to lower concentration of MEA in the treated samples. It did not seem like the MEA affected the size of the peaks. Variations might be difficult to see because of imperfect baseline separation of some of the peaks which could give higher error in the peak integration.
The chromatograms for sample 2, 7 and 8 showed an increase of acetate and sulphate in the treated samples (see Fig. 6 for sample 8), but the amounts were low compared to Fig.5.

192 Solrun Johanne Vevelstad and Hallvard F. Svendsen / Energy Procedia 86 ( 2016 ) 181 – 196
Fig. 6: Sample 8 before (black curve) and after treatment (blue curve), both diluted 100 times before analyses.
As observed earlier not all of the peaks were baseline separated. This is likely to give higher quantification uncertainty for formate, acetate, glycolate, sulphate and oxalate for a treated sample compared to an un-treated one because of impurities of acetate and sulphate in the cartridge. Glycolate in the treated pilot samples (samples 7-8) seemed to increase compared to untreated samples. The reason for this is not clear and it was also unclear if the glycolate peak was affected by the matrix of the pilot samples which were “unclean” compared to lab experiment samples (Fig. 2, sample 2) where no glycolate was observed. The “glycolate peak” did not increase significantly when a time series of samples were analysed. This might support the suggestion that this peak was an artefact of the pilot sample matrix. In some cases concentration variations for nitrite were seen between treated and untreated samples (sample 2 and 7-9, table 3) where nitrite was seen in lower amounts after sample pre-treatment. Low recovery of nitrite after sample treatment has earlier been reported, Henderson et al. [14]. Henderson’s explanation for the low recovery was formation and evolution of nitrous acid, oxidation to nitrate and adsorption in the resin.
Quantifications of the anions for the diluted samples (no pre-treatment) and for the samples going through the OnGuard treatment before dilution together with standard deviations are given in table 3.

Solrun Johanne Vevelstad and Hallvard F. Svendsen / Energy Procedia 86 ( 2016 ) 181 – 196 193
Table 3: Quantification of anions in samples with or without OnGuard treatment. Values are in ppm.
Sample 5 Sample 6 Sample 7 Sample 2 Sample 8 Sample 9 Glycolate OnGuard treatment 191 37 188 0 196 0
No treatment 194 37 134 0 150 0 1 0 27 0 23 0
Acetate OnGuard treatment 207 21 72 279 49 24 No treatment 156 6 34 86 0 0
25 7 19 96 24 12 Formate OnGuard treatment 1085 41 266 2060 156 69
No treatment 1104 36 233 1970 142 53 9 3 17 45 7 8
Nitrite OnGuard treatment 0 0 20 353 13 0 No treatment 0 0 26 449 14 8
0 0 3 48 0 4 Nitrate OnGuard treatment 392 40 136 167 97 0
No treatment 336 37 135 157 90 0 28 1 1 5 3 0
Sulphate OnGuard treatment 4319 28 62 57 66 43 No treatment 4176 20 76 38 43 25
71 4 7 9 11 9 Oxalate OnGuard treatment 682 7 47 230 19 0
No treatment 601 247 56 220 18 1 41 120 5 5 1 0
aAcetate and Glycolate have earlier been reported as degradation compounds [23], however their behaviour over time in pilot or lab experiment might suggest that these peaks are related to the matrix of the sample. None of them seem to change over time like the rest of the anions, and it has been concluded that more tests have to be performed to verify if this is Glycolate and Acetate.
The quantifications shown in Table 3 support the results seen in the chromatograms where the highest deviations were found for anions which were not baseline separated. Formate is not baseline separated from acetate and glycolate is not baseline separated from acetate. Sulphate and oxalate are also not baseline separated.
The alkalinity of some of the samples was analysed on both treated sample (OnGuard treated) and the original sample and the results showed that the cartridge was able to remove about 73-90 % of the amine (see table A.1 supporting information).
Based on the tests performed it does not seem to be anything to gain from filtration of the sample through the On-
Guard II H cartridge from a separation perspective. However, improved life time of system parts, such as the column, and less risk of contamination of the system may be advantages of a pre-treatment. The OnGuard II H column might be more useful at low concentrations of anions since elimination of the amine in the sample will make it possible to analyse a less diluted or undiluted sample. Sample 6 and sample 9 were diluted only 50 times because of low anion concentration. However, no improvement was seen in these cases and acetate and sulphate concentrations in the treated samples increased.
3.6. Uncertainty
There are several aspects to consider when evaluating uncertainty in degradation sample analysis such as reproducibility together with chemical stability of the anions analysed for.
Both aspects were considered by re-analysing the samples one year after the first analysis. The first analysis was performed on IonPac AS15 with one dilution of all the samples in a time series and the second analysis, one year after, was performed on both IonPac AS15 and AS11-HC. Three different dilutions of the samples were analysed on both of the columns in the second analysis. First chemical stability of anions in the samples was considered

194 Solrun Johanne Vevelstad and Hallvard F. Svendsen / Energy Procedia 86 ( 2016 ) 181 – 196
comparing the results from the two analyses on the IonPac AS15 column. The mean values for the three different dilutions from the second analysis were compared to the results from the first analysis. In supporting information (table A.2), the mean values and standard deviations for the analyses conducted on the IonPac AS15 column are shown. The results for the experimental time series showed higher standard deviations for the early samples. This is natural as degradation compound concentrations are low. The end sample from the experiment showed less than 5% deviation for formate and nitrite, while nitrate and oxalate which were present in small amounts had higher deviation. This suggests that the anions were stable over time in the degraded samples and that analytical uncertainties were higher for degradation compounds (oxalate and nitrate) found in small amounts. Improvement on the nitrate and oxalate analyses is challenging since the complexity of the samples, with high concentration of amine and other degradation compounds, makes it difficult to analyse the samples undiluted.
Second the reproducibility was investigated on IonPac AS15 as well as on IonPac AS11-HC. As expected, the standard deviations, especially for formate and nitrite, were lower re-analysing the samples on the same column than for analysing them on two different columns, IonPac AS15 and AS11-HC (table A.2 for mean values and standard deviation for IonPac AS-15 and table A.3 for IonPac AS-15 and AS-11HC). This could partly be explained by the columns separating the anions differently, resulting in baseline separation for some of the anions on one column, but not the other. Formate and HEOX were not baseline separated on either of the columns tested (Fig. 2). Thus either over-estimation or under-estimation of anions (for example formate when comparing formate and HEOX) will probably result depending on which component (formate or HEOX) the area is assigned to. Also the dilution of the sample influences the baseline separation. Baseline separation between formate and HEOX was observed at high dilution. Column choice and dilution was shown to influence reproducibility of the samples.
4. Conclusion
Analyses of degraded samples from laboratory CO2 capture experiments and pilot campaigns are complicated because of the diversity of the degradation compounds formed and the amine and CO2 concentrations in the samples. Little work has been conducted focusing on the analytical techniques and factors influencing qualitative and quantitative results. Uncertainties in the results have to be considered. Matrix effects can mask the degradation compounds and thereby influence quantification. Separation of the analytes can be a problem and any identification must be supported by reasonable formation mechanisms for the system. A large range of samples from lab experiments and pilots have been analysed using two different IC columns IonPac AS 15 and AS11-HC. Factors influencing qualitative and quantitative analyses have been investigated, for example matrix interactions, baseline separation, differences between columns and sample pre-treatment. Additionally uncertainties have been estimated quantitatively such as reproducibility, comparisons between the two columns and effect of dilution. The two columns tested give different separation of the anions. Acetate and glycolate are only separated on IonPac AS15, while IonPac AS11-HC showed better separation of sulphate and oxalate. Formate and HEOX were not baseline separated on any of the columns. The amine matrix influenced retention time for early eluting peaks and made baseline separation more difficult. Extra peaks caused by the matrix were seen for KGly and in general an amino acid matrix, such as KSAR and KGly, created signal noise, thereby impairing quantification. Sample pre-treatment with an OnGuard II H cartridge was tested and found to be of limited use. It should be used with care not to falsify the analyses. The uncertainty was influenced by missing baseline separation between some analytes, low concentrations of analytes and wide peaks due to low eluent concentration.
Acknowledgements
This work was performed within the SOLVit project under the strategic Research Council of Norway program CLIMIT. The authors gratefully acknowledge financial support from the partners in SOLVit: Aker Solutions, EnBW, Gassnova and the Research Council of Norway.

Solrun Johanne Vevelstad and Hallvard F. Svendsen / Energy Procedia 86 ( 2016 ) 181 – 196 195
Appendix A.
Table A.1: Amine concentration in the different samples and amine lost.
Amine (mol/kg)
Amine lost
OnGuard Original (mol/kg) %
Sample 9 0.66 5.13 4.47 87
Sample 8 1.44 5.23 3.79 73
Sample 2 0.40 3.18 2.78 87
Sample 5 0.46 4.40 3.94 90
Table A.2: Mean and standard deviation (ppm) for analyses done on the AS15 column.
Time (days) Formate Nitrite Nitrate Oxalate
0 <50 <50 <50 <50 1 89 <50 <50 <50 2 123 73 65 <50 <50 4 219 30 34 <50 <50 7 462 41 118 39 <50 59 11 721 13 209 18 39 75 15 1141 52 320 15 81 102 19 1632 81 459 3 140 6 179 21 1896 72 539 23 175 20 180 100
Table A.3: Mean and standard deviation (ppm) for analyses done on the AS15 and AS11-HC columns.
Time (days) Formate Nitrite Nitrate Oxalate
0 <50 <50 <50 <50 1 118 30 65 <50 <50 2 173 92 87 22 <50 <50 4 280 90 72 38 <50 <50 7 546 124 156 62 <50 59 11 824 146 245 53 <50 75 15 1255 168 357 54 83 2 81 21 19 1746 174 491 46 127 19 144 35 21 2022 187 570 46 171 17 171 82
References
[1] A. Chakma, A. Meisen, Corrosivity of Diethanolamine Solutions and their Degradation Products, Industrial & Engineering Chemistry Product Research and Development, 25 (1986) 627-630. [2] A.L. Kohl, R.B. Nielsen, Gas purification, in, 1997. [3] B.R. Strazisar, R.R. Anderson, C.M. White, Degradation Pathways for Monoethanolamine in a CO2 Capture Facility, Energy & Fuels, 17 (2003) 1034-1039. [4] E.F. da Silva, H. Lepaumier, A. Grimstvedt, S.J. Vevelstad, A. Einbu, K. Vernstad, H.F. Svendsen, K. Zahlsen, Understanding 2-Ethanolamine Degradation in Postcombustion CO2 Capture, Industrial & Engineering Chemistry Research, 51 (2012) 13329-13338. [5] R. Kadnar, Determination of amines used in the oil and gas industry (upstream section) by ion chromatography, Journal of Chromatography A, 850 (1999) 289-295. [6] R. Kadnar, J. Rieder, Determination of anions in amine solutions for sour gas treatment, Journal of Chromatography A, 706 (1995) 339-343.

196 Solrun Johanne Vevelstad and Hallvard F. Svendsen / Energy Procedia 86 ( 2016 ) 181 – 196
[7] H. Lepaumier, D. Picq, P.-L. Carrette, New Amines for CO2 Capture. II. Oxidative Degradation Mechanisms, Industrial & Engineering Chemistry Research, 48 (2009) 9068-9075. [8] A.J. Sexton, G.T. Rochelle, Reaction Products from the Oxidative Degradation of Monoethanolamine, Industrial & Engineering Chemistry Research, 50 (2011) 667-673. [9] T. Supap, R. Idem, P. Tontiwachwuthikul, C. Saiwan, Analysis of Monoethanolamine and Its Oxidative Degradation Products during CO2 Absorption from Flue Gases: A Comparative Study of GC-MS, HPLC-RID, and CE-DAD Analytical Techniques and Possible Optimum Combinations, Industrial & Engineering Chemistry Research, 45 (2006) 2437-2451. [10] S.J. Vevelstad, A. Grimstvedt, A. Einbu, H. Knuutila, E.F. da Silva, H.F. Svendsen, Oxidative degradation of amines using a closed batch system, International Journal of Greenhouse Gas Control, 18 (2013) 1-14. [11] S.J. Vevelstad, A. Grimstvedt, J. Elnan, E.F. da Silva, H.F. Svendsen, Oxidative degradation of 2-ethanolamine: The effect of oxygen concentration and temperature on product formation, International Journal of Greenhouse Gas Control, 18 (2013) 88-100. [12] O. Mrklas, A. Chu, S. Lunn, Determination of ethanolamine, ethylene glycol and triethylene glycol by ion chromatography for laboratory and field biodegradation studies, Journal of Environmental Monitoring, 5 (2003) 336-340. [13] P.R. Haddad, P. Doble, M. Macka, Developments in sample preparation and separation techniques for the determination of inorganic ions by ion chromatography and capillary electrophoresis, Journal of Chromatography A, 856 (1999) 145-177. [14] I.K. Henderson, R. Saari-Norhaus, J.M. Anderson Jr, Sample preparation for ion chromatography by solid-phase extraction, Journal of Chromatography A, 546 (1991) 61-71. [15] C.A. Lucy, What are the unanswered (and unasked) questions in ion analysis?, Journal of Chromatography A, 804 (1998) 3-15. [16] B. Lopez-Ruiz, Advances in the determination of inorganic anions by ion chromatography, Journal of Chromatography A, 881 (2000) 607-627. [17] H. Lepaumier, E.F. da Silva, A. Einbu, A. Grimstvedt, J.N. Knudsen, K. Zahlsen, H.F. Svendsen, Comparison of MEA degradation in pilot-scale with lab-scale experiments, Energy Procedia, 4 (2011) 1652-1659. [18] H. Knuutila, N. Asif, S.J. Vevelstad, H.F. Svendsen, Formation and Destruction of NDELA in 30wt% MEA (Monoethanolamine) and 50wt% DEA (Diethanolamine) Solutions, Oil Gas Sci. Technol. – Rev. IFP Energies nouvelles, 69 (2014) 805-820. [19] H. Knuutila, H.F. Svendsen, N. Asif, Decomposition of nitrosamines in aqueous monoethanolamine (MEA) and diethanolamine (DEA) solutions with UV-radiation, Int. J. Greenhouse Gas Control, 31 (2014) 182-191. [20] Dionex, Product Manual OnGuard II Sample pretreatment Cartridges in, Sunnyvale, 2004. [21] T. Supap, R. Idem, P. Tontiwachwuthikul, Mechanism of formation of heat stable salts (HSSs) and their roles in further degradation of monoethanolamine during CO2 capture from flue gas streams, Energy Procedia, 4 (2011) 591-598. [22] S.J. Vevelstad, A. Grimstvedt, H. Lepaumier, K. Zahlsen, M.S. Kjos, J.N. Knudsen, H.F. Svendsen, Identification and quantification of degradation products by ion chromatography, ACS Symp. Ser., 1097 (2012) 239-247.