chamber of mines presentation on the draft carbon …
TRANSCRIPT

PAGE
CHAMBER OF MINES PRESENTATION ON THE
DRAFT CARBON TAX BILL
Presentation On the draft Carbon Tax Bill
to the Standing Committee on Finance
Parliament, Cape Town
14th March 2018

PAGE
Presentation Outline
• Introduction to Chamber of Mines
• The Mining Industry at Glance
• Preliminary Observations
• Economic Impact of the draft Carbon Tax Bill
• Conclusions and Way Forward
2

PAGE
Introduction to Chamber of Mines
• Voluntary employer lobbying and advocacy organisation that supports and promotes the SA mining
industry – through providing strategic support and advisory input.
• Facilitate interaction among mining employers to examine policy issues and other matters of mutual
concern to crystallise and define desirable industry position.
• Members comprise:
-38 major mining companies
-32 junior mining companies
• 4 associations -Aggregates, Sands Producers Association of Southern Africa (ASPASA), South African
Diamond Producers Organisation (SADPO), Association of Shaft Sinkers and SA Mining Contractors, Clay
Brick Association of South Africa (CASA)
• Chamber member companies:
represent more than 90% of SA’s mineral production by value
contribute around R11.3 billion in taxes per annum
employ around 450,000 people directly
• Advocacy and lobbying -no executive authority over its member companies
• All Chamber members are required to sign and adhere to a Membership Compact
a mandatory code of ethical business conduct to which members of the Chamber subscribe
our members are obliged to conduct their business according to the agreed Chamber values
which dictate the minimum standards of conduct required of them
3
PAGE
Mining Sector at a Glance
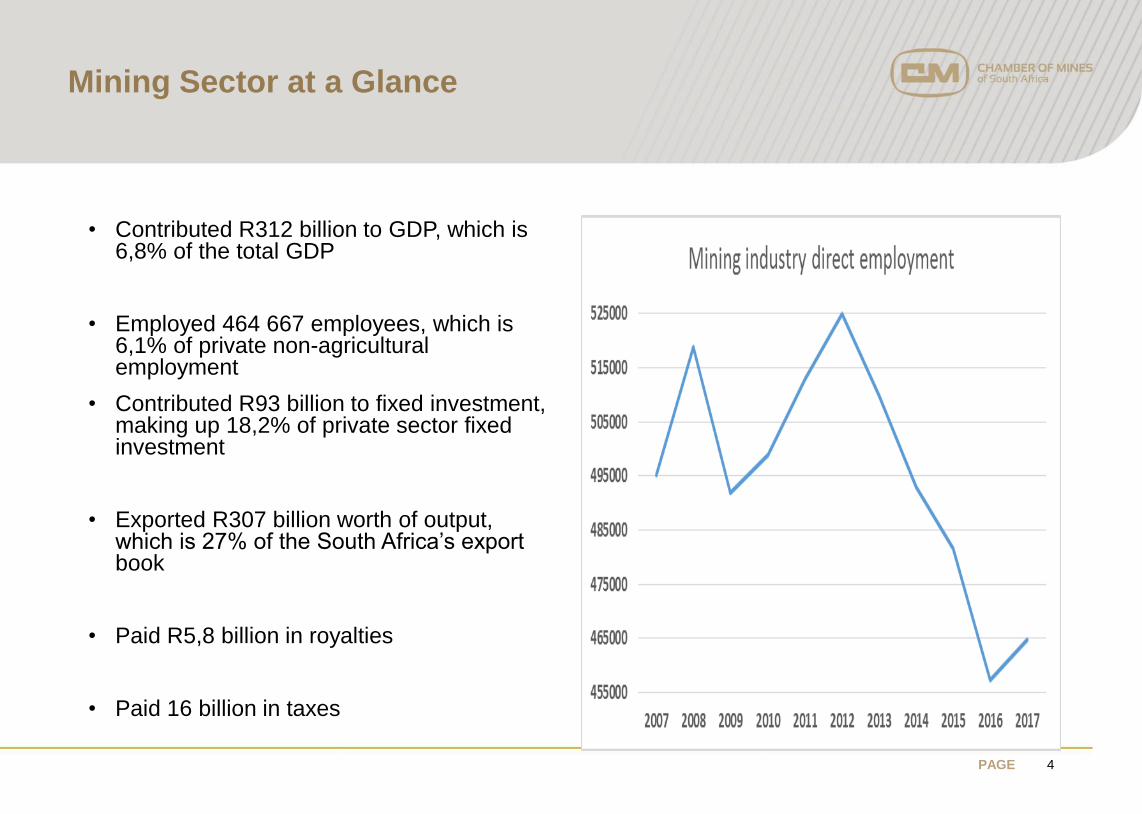
• Contributed R312 billion to GDP, which is 6,8% of the total GDP
• Employed 464 667 employees, which is 6,1% of private non-agricultural employment
• Contributed R93 billion to fixed investment, making up 18,2% of private sector fixed investment
• Exported R307 billion worth of output, which is 27% of the South Africa’s export book
• Paid R5,8 billion in royalties
• Paid 16 billion in taxes
4
PAGE
Preliminary Observation
▪ The Chamber of Mines (COM) is committed to support SA international commitment to
lowering its GHG emissions, and the Nationally Determined Contributions commitments.
▪ COM and its members remain committed to sustainable growth of the South African economy and to
responsible corporate ciizenship. As such, it is supportive of the government’s intent to facilitate a
transition to low carbon economy, with responsible investment and growth in various sectors including
the mining industry
▪ The COM has been part and parcel of drafting of BUSA submission and therefore supports the
views expressed by BUSA and its member companies including the views expressed by other
organisation such as ITTCC.
▪ Amongst other issues, the COM has identified the following concerns and risks with Caron Tax Bill,
These are clearly articulated in BUSA and ITTCC submission:
- National Emissions Trajectory- PPD (emissions already lower than the national benchmark
trajectory due to the low economic growth therefore, imposition of a carbon tax is unnecessary).
- Lack of Alignment with Carbon Budget and the mitigations system currently developed by the
Department of Environmental Affairs.
5

PAGE
Preliminary Observation, cont..
▪ Amongst other issues, the COM has identified the following concerns and risks with Caron Tax Bill,
These are clearly articulated in BUSA and ITTCC submission:
• Contradiction between the definition of the Tax Payer and the Mandatory GHG reporting
regulations
• Outstanding development and finalisation of the Regulations that will enable effective
implementation of the Tax i.e Offset Regulations, Z Factor, Trade Exposure etc
• Rebates for renewable energy premium and environmental levy need to be clearly set out in
legislation
• Administration of Carbon Tax through the Custom and Excise Act
• Challenges pertaining to developing benchmarks/Z factor in the mining industry
▪ Our Submission primarily focuses on the economic impacts of the introduction of Carbon Tax to the
Mining Industry
6

PAGE
Basic Arguments:
1. Mining in SA is marginal business – A slight increase input cost results in the closure of some operations
2. Price taker – unlike other productive sectors (e.g. retail, manufacturing, finance etc.) Mineral Commodity Prices are determined at the global market. We cannot transfer increase in costs to the final price of the product
7
Economic Analysis-Impact of Carbon Tax on the Mining Industry

PAGE 8
84
88
92
96
100
104
108
112
-1
0
1
2
3
4
5
6
1980 1985 1990 1995 2000 2005 2010 2015
Manufacturing capacity utilisation (%)
Mining capacity utilisation (%)
World GDP growth (%, rh-axis)
Capacity utilisation in the mining sector closely
patterns the perdormance of the world economiy
Correlations:
i) Mining c.u. vs World GDP growth = 41%
ii) Manufacturing c. u. vs World GDP growth = 18%
Mining, Manufacturing Capacity Utilization and Global Growth
1. Correlation of 41%
compared to 18% for
manufacturing. This brings to
the fore the heavy reliance of
the mining sector to
international developments.
More precisely, it is an
indication of the extent to
which mining is ‘more’ of a
price-taker than the
manufacturing sector;
2. Post the 2008 financial crisisthe mining sector’s output hasbeen more volatile highlightingtenuous global growth

PAGE 9
Mining industry shares: Company tax and GDP (%)
11
9
11
17
23 23
10
17 17
7
11
87 7 6
99 8 8 8 8 8 8 8
0
5
10
15
20
25
2004 2005 2006 2007 2008 2009 2010 2011 2012 2013 2014 2015
Company tax: Mining as a share of total company taxes
Mining's contribution as % of total GDP nominal terms
Mining's contribution as % of total GDP real terms

PAGE
Assumptions for the time-series econometric analysis:
10
Assumptions
The following assumptions were made in order to run the time-series econometric analysis:
1. Since there is currently no time-series data for the carbon tax, we used electricity tariffs as
a proxy. This is because about 80% of SA’s emissions are from the energy sector, mainly
power generation. While in Phase I of the CO2 tax will be electricity neutral in Phase II that
will change
2. We model Phase II which kicks off in 2022, five year from now, and assume that electricity prices
will soar by 5%
3. The price of diesel (or liquid fuels) will also directly include the carbon tax. However, this was not
considered in the current analysis because
• To improve the competitiveness of the primary sectors mining qualifies for a rebate under
the Diesel Fuel Refund System
• The National Treasury has begun a review process on the Diesel Fuel Refund System in
order to clamp down on ‘beneficiaries’ who abuse the facility. The Chamber has made
submission that the review should focus on the abusers instead of targeting the entire
sector
• As a result of this uncertainty in the direction the Refund System will take we decided
not to include it in the modelling
4. Having performed the baseline estimations we then assumed that the 5% increase in the
electricity price took effect in the year 2000. From there we calculated the impact that would have
had on output/production, investment, employment, and gross operating surplus.

PAGE
Time-series analysis
11
LONG-RUN COEFFICIENTS/ELASTICITIES FOR THE PRICE OF ELECTRICITY IN THE MINING SECTOR
Sector/industry The impact of a 10% increase in the electricity price on the mining sector
Output/production InvestmentGross operating
surplus/profitabilityEmployment
Total mining sector -0.01% -3.3% -0.03% -0.5%
Gold -4.2% -5.5% n/a -2.9%
Coal -0.6% -4% n/a -0.1%
NB: How to read elasticities - For example, a 10% increase in the price of electricity (specific to the
mining sector) results in a 0.01% decrease in total mining sector output; 3.3% decline in investment
(real gross fixed capital formation); 0.03% decline in gross operating surplus; and 0.5% reduction in
total employment.

PAGE
Impact of the CO2 tax on output and investment in the mining sector
12
Transmission mechanism: 5% increase in the price of electricity in Phase II
REDUCTION IN OUTPUT RESULTING FROM CO2 TAX (R bn)
Gold** Coal Other* Total Mining
2000 0,5 1,1 2,4 3,9
2001 0,5 1,1 2,3 3,9
2002 0,7 1,1 2,2 4,0
2003 0,6 1,1 2,4 4,1
2004 0,5 1,2 2,6 4,3
2005 0,5 1,2 2,7 4,3
2006 0,6 1,2 2,5 4,3
2007 0,7 1,2 2,4 4,3
2008 0,9 1,2 2,0 4,1
2009 0,9 1,2 1,7 3,8
2010 1,0 1,2 1,9 4,0
2011 1,2 1,2 1,6 4,0
2012 1,2 1,2 1,4 3,9
2013 1,2 1,2 1,6 4,1
2014 1,2 1,3 1,5 4,0
2015 1,2 1,2 1,7 4,2
2016 1,5 1,2 1,3 4,0
JOB LOSSES RESULTING FROM CO2 TAX
Gold Coal Other* Total mining
2000 2 374 238 2 165 4 777
2001 2 212 235 2 216 4 664
2002 2 143 220 2 357 4 719
2003 2 117 219 2 594 4 930
2004 2 019 233 2 947 5 199
2005 1 797 264 3 079 5 139
2006 1 787 267 3 226 5 280
2007 1 858 280 3 592 5 730
2008 1 862 303 3 838 6 002
2009 1 789 328 3 574 5 691
2010 1 756 343 3 674 5 773
2011 1 620 364 3 951 5 935
2012 1 591 385 4 098 6 073
2013 1 474 407 4 019 5 900
2014 1 331 399 3 974 5 704
2015 1 287 360 3 925 5 572
2016 1 303 359 3 630 5 292

PAGE
Impact of the CO2 tax on jobs
13
Transmission mechanism: 5% increase in the price of electricity in Phase II
Gold prod. vol R/$ Real price of electricity (c/kWh)
Gold prod. vol 1,00 -0,91 -0,69
R/$ -0,91 1,00 0,65
Real price of electricity (c/kWh) -0,69 0,65 1,00
Correlation: Gold vol. vs Selected cost variables
Negative correlation is a relationship between two variables in
which one variable increases as the other decreases, and vice
versa. In statistics, a perfect negative correlation is represented
by the value -1.00, while a 0.00 indicates no correlation and a
+1.00 indicates a perfect positive correlation.
JOB LOSSES RESULTING FROM CO2 TAX
Gold Coal Other* Total mining
2000 2 374 238 2 165 4 777
2001 2 212 235 2 216 4 664
2002 2 143 220 2 357 4 719
2003 2 117 219 2 594 4 930
2004 2 019 233 2 947 5 199
2005 1 797 264 3 079 5 139
2006 1 787 267 3 226 5 280
2007 1 858 280 3 592 5 730
2008 1 862 303 3 838 6 002
2009 1 789 328 3 574 5 691
2010 1 756 343 3 674 5 773
2011 1 620 364 3 951 5 935
2012 1 591 385 4 098 6 073
2013 1 474 407 4 019 5 900
2014 1 331 399 3 974 5 704
2015 1 287 360 3 925 5 572
2016 1 303 359 3 630 5 292

PAGE
Cost Curve Analysis
• Profitability, or the prospect of relatively healthy profits on a risk adjusted basis is an important variable in the decision matrix when companies are considering new or expansion investment.
• An environment conducive to healthy profits will attract capital, which will in turn result in further expansion of the mining sector and create additional jobs.
• The converse also holds, wherein, regulatory uncertainty and excessive costs erode the prospect of profitability, therefore decreasing the size of sector, jobs, export earnings and by extension contraction in those sectors which feed into the mining sector.
• While the Chamber embraces the notion of long term carbon pricing and various mechanisms to facilitate transition to a low carbon economy, we are of the view that the carbon tax has the potential to erode profitability through increasing costs and hence deliver the outcome of a shrinking sector
• The result of which would be further job losses therefore exacerbating South Africa’s structurally high unemployment rate.
14
PAGE
Cost Curve Analysis
• The central narrative of this analysis is to stress the fact that additional costs, adversely affect profitability (a key variable in the decision matrix when companies are considering new or expansion capital).
To this end, the points we would like to stress include;
• The price taking nature of the industry, and
• The need to contain costs (production costs and inflation)
15

PAGE
Production Costs
• Sustainability of the mining sector is a function of producing output at an input cost that is below commodity selling prices.
• Due to generally depressed commodity prices and structurally high input costs associated with South African mining, the sustainability of pockets of the sector are in dire straits
• To illustrate this fact we have selected two industries within the mining sector, namely; the gold and PGM industries.
• These 2 sectors, collectively;
• Employ 287 970 direct employees (62% of total mining sector)
• 79% of total mining exports
• 29% of total mining royalty payments
When production costs are compared to selling prices, it is regrettable to note that;
69% of gold mining operations and 65% of PGM mining operations are producing unsustainably.
Any increases to input costs through carbon tax adversely affect the sustainability of these sectors.
16

PAGE
Cost Curves (Gold and Platinum)
69% of Gold Mining is unsustainable, while 65% of the PGM industry is unsustainable
17

PAGE
Inflationary Adjustment to the Carbon Tax rate and Mining Sector input cost inflation
• Our base case remains that given the price taking nature and marginal state of the mining sector, the carbon tax is negative for the sector, for the fact that it increases input costs therefore reducing profitability.
• Additionally, we are of the firm view that the proposal for an inflationary adjustment to the carbon tax rate of CPI + 2 % (percentage points) on an annual basis until 2019 is inappropriate for a tax.
• Our recommendation is for a zero percent adjustment to the carbon tax rate. We believe that the adjustment to the carbon tax rate should only be considered when there is a significant shift in the underlying dynamics that have resulted in the current carbon tax rate of R120.
• Moreover, in the event of the need to adjust the tax rate, this should be done with motivation for the proposed new carbon tax rate. We do not believe that an automatic annual adjustment to the rate is warranted.
• Our recommendation is motivated by the fact that input costs inflation in the mining sector are currently increasing at a pace faster than that of commodity selling prices, resulting in margin compression and adversely affecting the sustainability of the sector.
18
PAGE
Mining Cost Inflation
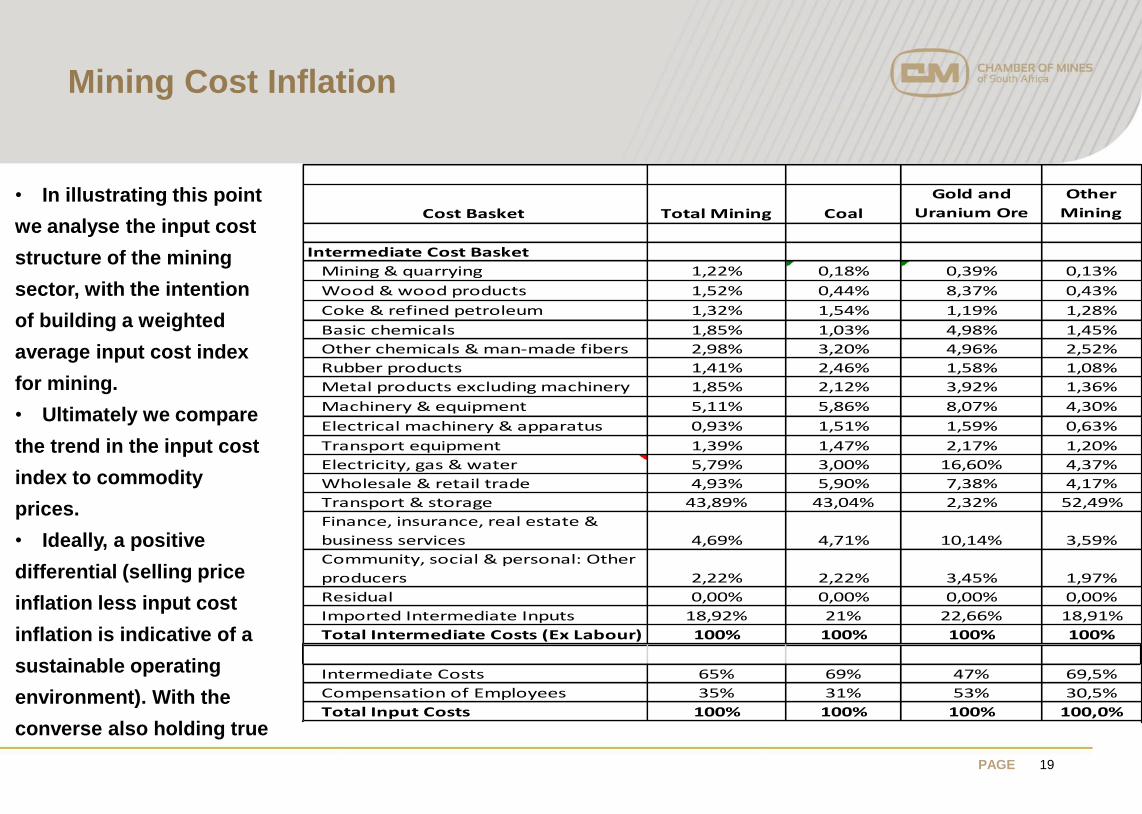
• In illustrating this point
we analyse the input cost
structure of the mining
sector, with the intention
of building a weighted
average input cost index
for mining.
• Ultimately we compare
the trend in the input cost
index to commodity
prices.
• Ideally, a positive
differential (selling price
inflation less input cost
inflation is indicative of a
sustainable operating
environment). With the
converse also holding true
19
Cost Basket Total Mining Coal
Gold and
Uranium Ore
Other
Mining
Intermediate Cost Basket
Mining & quarrying 1,22% 0,18% 0,39% 0,13%
Wood & wood products 1,52% 0,44% 8,37% 0,43%
Coke & refined petroleum 1,32% 1,54% 1,19% 1,28%
Basic chemicals 1,85% 1,03% 4,98% 1,45%
Other chemicals & man-made fibers 2,98% 3,20% 4,96% 2,52%
Rubber products 1,41% 2,46% 1,58% 1,08%
Metal products excluding machinery 1,85% 2,12% 3,92% 1,36%
Machinery & equipment 5,11% 5,86% 8,07% 4,30%
Electrical machinery & apparatus 0,93% 1,51% 1,59% 0,63%
Transport equipment 1,39% 1,47% 2,17% 1,20%
Electricity, gas & water 5,79% 3,00% 16,60% 4,37%
Wholesale & retail trade 4,93% 5,90% 7,38% 4,17%
Transport & storage 43,89% 43,04% 2,32% 52,49%
Finance, insurance, real estate &
business services 4,69% 4,71% 10,14% 3,59%
Community, social & personal: Other
producers 2,22% 2,22% 3,45% 1,97%
Residual 0,00% 0,00% 0,00% 0,00%
Imported Intermediate Inputs 18,92% 21% 22,66% 18,91%
Total Intermediate Costs (Ex Labour) 100% 100% 100% 100%
Intermediate Costs 65% 69% 47% 69,5%
Compensation of Employees 35% 31% 53% 30,5%
Total Input Costs 100% 100% 100% 100,0%
PAGE
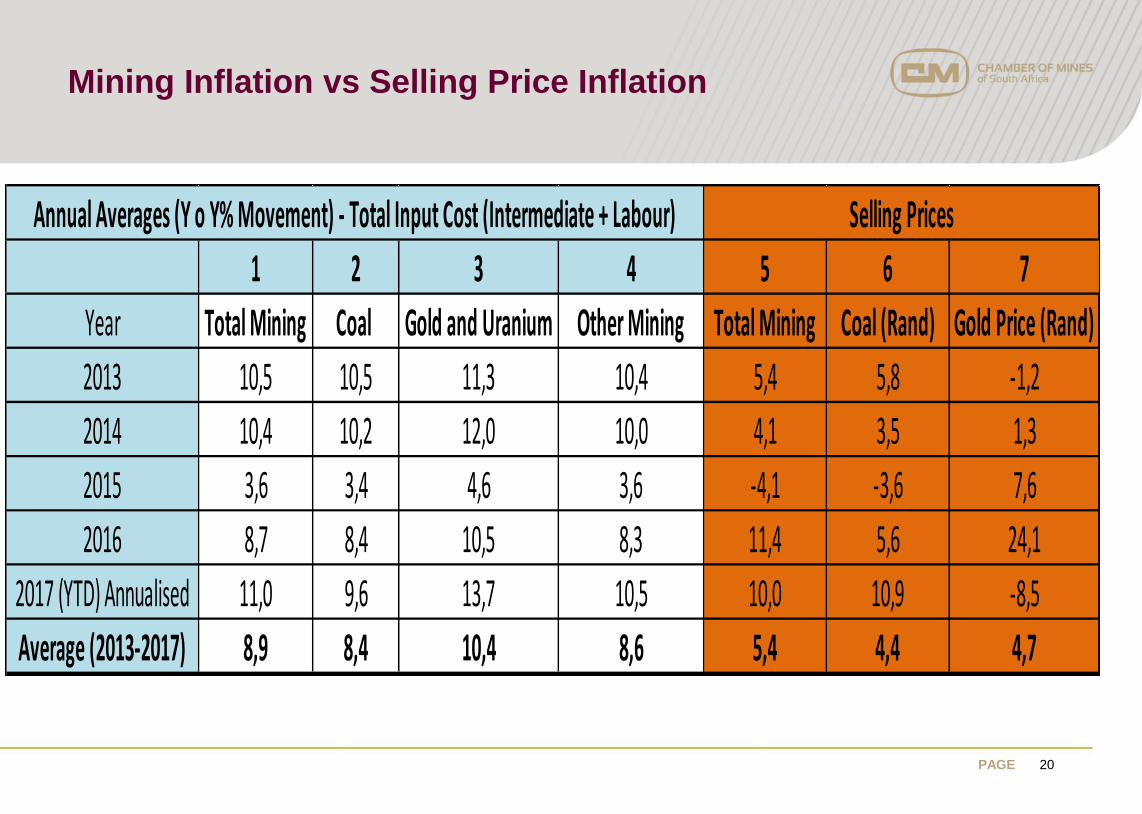
Mining Inflation vs Selling Price Inflation
20
1 2 3 4 5 6 7
Year Total Mining Coal Gold and Uranium Other Mining Total Mining Coal (Rand) Gold Price (Rand)
2013 10,5 10,5 11,3 10,4 5,4 5,8 -1,2
2014 10,4 10,2 12,0 10,0 4,1 3,5 1,3
2015 3,6 3,4 4,6 3,6 -4,1 -3,6 7,6
2016 8,7 8,4 10,5 8,3 11,4 5,6 24,1
2017 (YTD) Annualised 11,0 9,6 13,7 10,5 10,0 10,9 -8,5
Average (2013-2017) 8,9 8,4 10,4 8,6 5,4 4,4 4,7
Annual Averages (Y o Y% Movement) - Total Input Cost (Intermediate + Labour) Selling Prices
PAGE
Mining Sector Inflation
21
• The negative differential in the inflation profiles between costs and selling prices, presents a
situation of profit margin erosion and places in question the sustainability of the mining
sector. By extension it also adversely affects the attractiveness of the sector for new or
expansion capital.
• It is in the context of the above analysis that we contend with the inflationary adjustment
proposed for the carbon tax rate
• Importantly, this would not be out of the norm for the South African context and by extension
the mining sector. The Diesel Fuel Tax Refund System applicable to the mining sector, is not
set to automatically escalate on an annual basis. We are of the view that the same can be
applied to the carbon tax rate.

PAGE
Conclusions
22
• The COM acknowledges the fact that carbon tax could be one of many policy measures to address market distortions or to promote certain behavioural changes in order to achieve GHG emissions reduction. However, in light of the South Africa’s socio economic implications of the tax, also the design and the principle set out in the draft Carbon Tax Bill, the Chamber does not support the implementation of the Bill at this stage.
• Significant technical, policy alignment issues, finalisation of certain regulations, means of implementation will have to be achieved prior to the promulgation of the Bill.
• It is evident that Carbon Tax is not necessary to meet international commitments under the current national circumstances
• Over the last 5 years, the South African mining sector faced a flat to declining commodity price environment, with flat to declining production placing downward pressure on profitability and global competitiveness.
• The mining industry is a significant contributor to GDP and a major employer. Carbon Tax will render most of the mining operations marginal, add significant costs to mining operations, consequently undermining the capability of the sector to contribute to sustainable employment levels.

PAGE
Conclusions
23
• The mining operations are maintained on an extremely high base load capacity. Increases in input costs undermine the viability of marginal operations
• The Mining Industry is Trade Exposed, hence the introduction of Carbon Tax will impact on its competitiveness.
• The sector is a price taker and simply cannot pass the costs to the consumers of its products