chandrapur super thermal power station...a) boiler side / turbine side performance b) condenser...
TRANSCRIPT
Chandrapur Super Thermal Power Station Power Station
Efforts for Plant Performance ImprovementPerformance Improvement
C S T P S
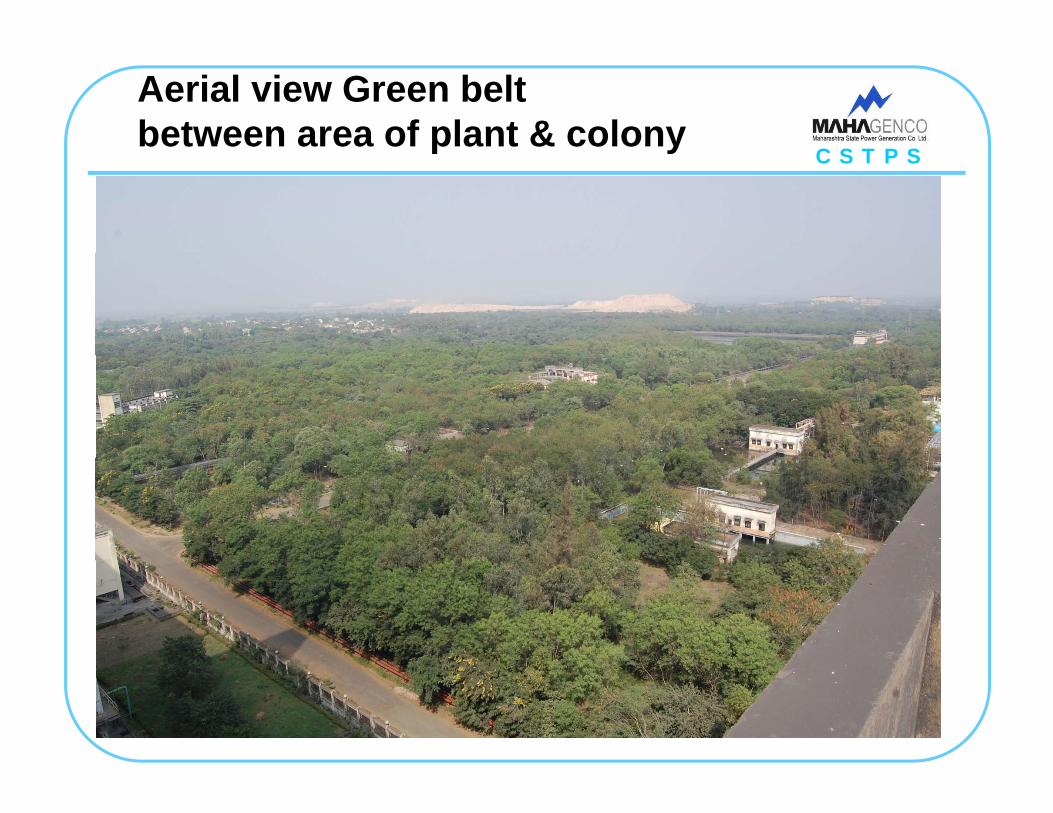
Aerial view Green belt between area of plant & colony
C S T P Sp y

C S T P SScope of Presentation
C S T P S
1 General Information1. General Information.
2. Plant Performance.
3. U-6 PACE-D assessment & Action plan
4. Sharing Best practices.
C S T P SPart-1
C S T P S
G l I f tiGeneral Information

C S T P SCSTPS is an ISO Certified Unit For :
C S T P S
Q lit M t S tQuality Management System.Since 21 Sep. 2000.
Environment Management System.Since 26 May 2004Since 26 May 2004
Occupational health & safety Management System. Si 1O t 2005Since 1Oct. 2005

C S T P SAGE & COD Details
C S T P S
Unit C it Date of Date ofC i l ANo. Capacity Commissioning CommercialOperation
Age
1 210 MW 15 A 83 01 N 84 291 210 MW 15-Aug-83 01-Nov-84 29
2 210 MW 11-Jul-84 16-Sept-85 28
3 210 MW 03-May-85 01-Apr-86 27
4 210 MW 08-Mar-86 04-Nov-86 26
5 500 MW 22-Mar-91 01-Dec-92 21
6 500 MW 11-Mar-92 01-Dec-93 20
7 500 MW 01-Oct-97 01-Mar-98 15
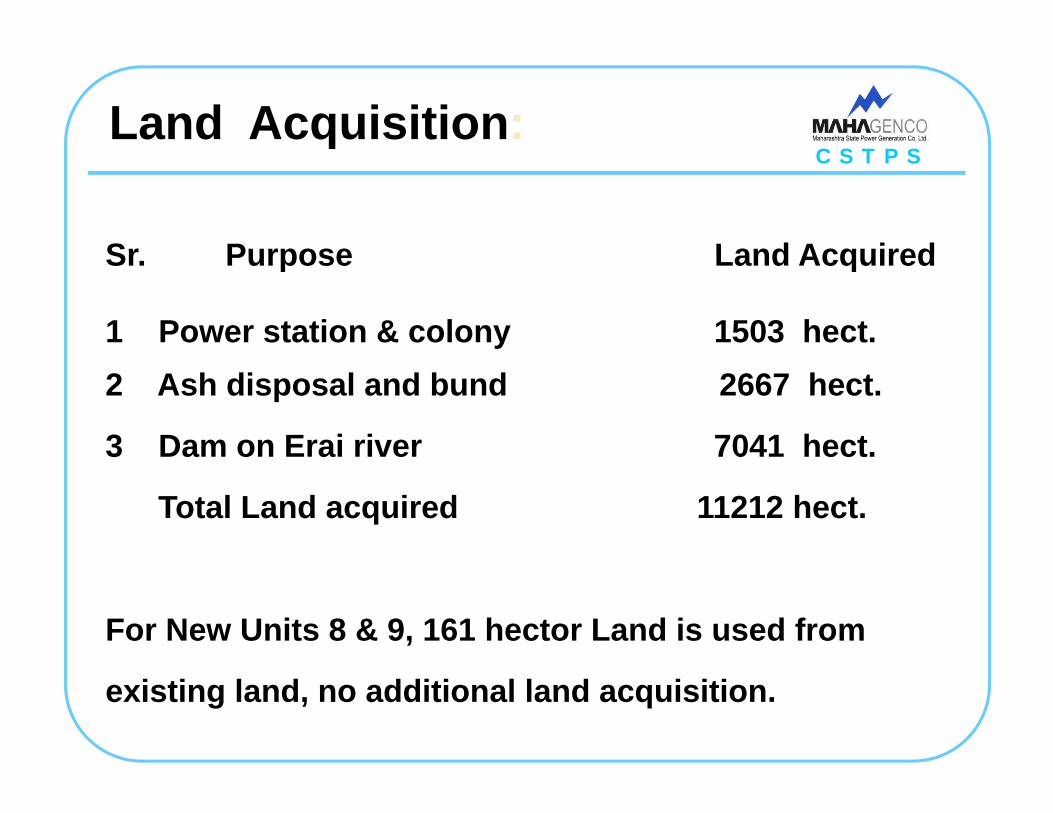
C S T P SLand Acquisition:
C S T P S
Sr Purpose Land AcquiredSr. Purpose Land Acquired
1 Power station & colony 1503 hect.2 Ash disposal and bund 2667 hect.
3 Dam on Erai river 7041 hect.
Total Land acquired 11212 hect.
For New Units 8 & 9, 161 hector Land is used from
existing land, no additional land acquisition.

C S T P SInput resources & output
C S T P S
• Water – Erai Dam capacity of 144 MM3(SRS survey - 2006-07). • Requirement/day – 0.25 MM3 / day.
p p
q y y
• Coal – Rail – WCL, SECL, MCLRopeway – Durgapur.p y g pUTS – Padmapur .Road – Bhatadi.
• Requirement/day – approx 40 000 MT / dayRequirement/day – approx. 40,000 MT / day.
• Secondary fuel oil – LDO & FO from OMCs (HPCL/IOCL/BPCL)
Output sent to • 220 KV lines from Unit-1.• 400 KV lines from Unit-2 to 7.400 KV lines from Unit 2 to 7.• 500 KV HVDC link (C’pur – Padghe) from Unit-5 to 7.
C S T P SAchievements of CSTPS
C S T P S
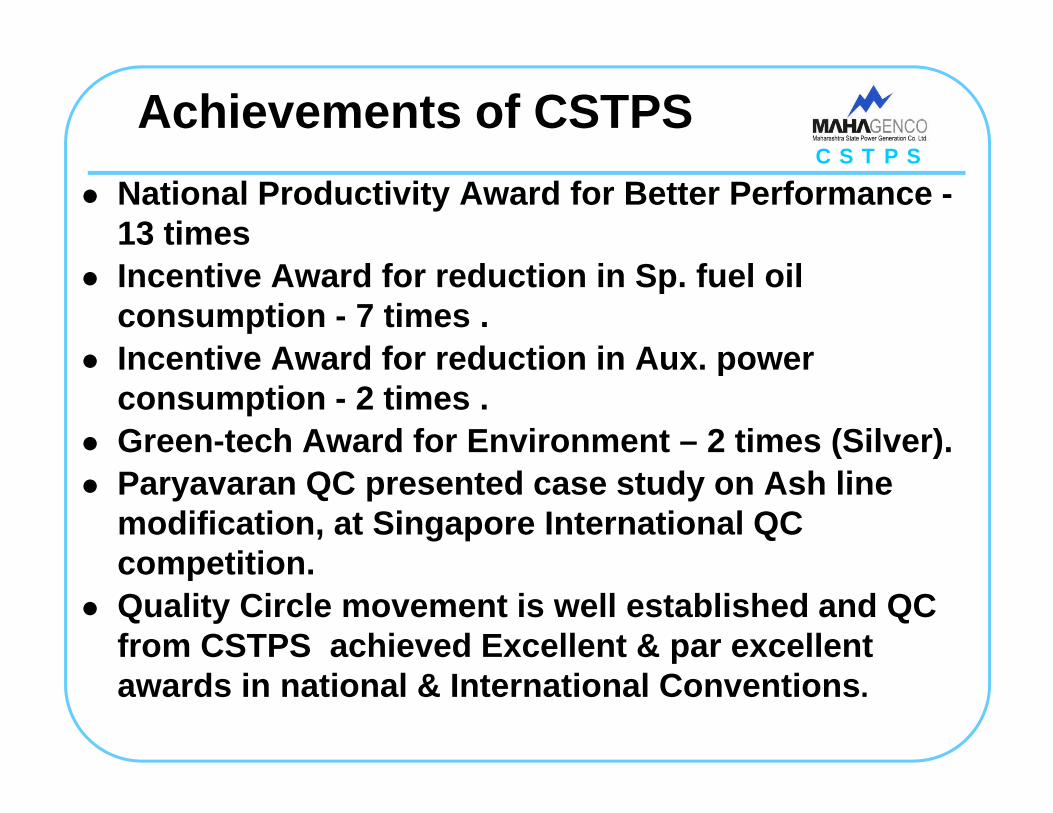
National Productivity Award for Better Performance -13 times Incentive Award for reduction in Sp. fuel oil consumption - 7 times . Incentive Award for reduction in Aux powerIncentive Award for reduction in Aux. power consumption - 2 times .Green-tech Award for Environment – 2 times (Silver).( )Paryavaran QC presented case study on Ash line modification, at Singapore International QC competitioncompetition.Quality Circle movement is well established and QC from CSTPS achieved Excellent & par excellent pawards in national & International Conventions.

C S T P SQC - Achievements 2012-13
C S T P S
NCQC Kanpur (Dec-12) – 8 Quality Circles Q p ( ) Q yfrom CSTPS have participated.Navchetna QC (I&C-II) got the ParNavchetna QC (I&C II) got the Par Excellent award and stand eligible to participate in International Levelparticipate in International Level Competition at China.Vikas QC (BM-I) & Karmaveer QC (CHP-A)Vikas QC (BM-I) & Karmaveer QC (CHP-A) got Excellent award.Remaining 05 QC got Distinguish awardRemaining 05 QC got Distinguish award.

C S T P SAwards 2012-13
C S T P S
Yantrikottam award :
Unit-5 – Second best amongst MSPGCL units.
Unit-3 – Third best amongst MSPGCL units.Unit 3 Third best amongst MSPGCL units.
Black Diamond award :
CHP – 210 & 500 MW : best amongst MSPGCL Stations having capacity > 1000 MW.g p y
Best quality circle award :
Navchetana QC – I&C-II – Best QC amongst MSPGCL Stations QCs.

C S T P SContinual Improvement Culture
C S T P S
Quality Circle movement is since 1994. Total 66 Quality Circles.
Stage wise Performance Optimization Group & POG activities.
Energy Conservation Cell.
• Condition Monitoring Cell• Condition Monitoring Cell.
Training Sub-centre – TSC CSTPS, Chandrapur.
Developed LAN based knowledge website.
C S T P SPart - 2
C S T P S
CSTPS Plant Performance
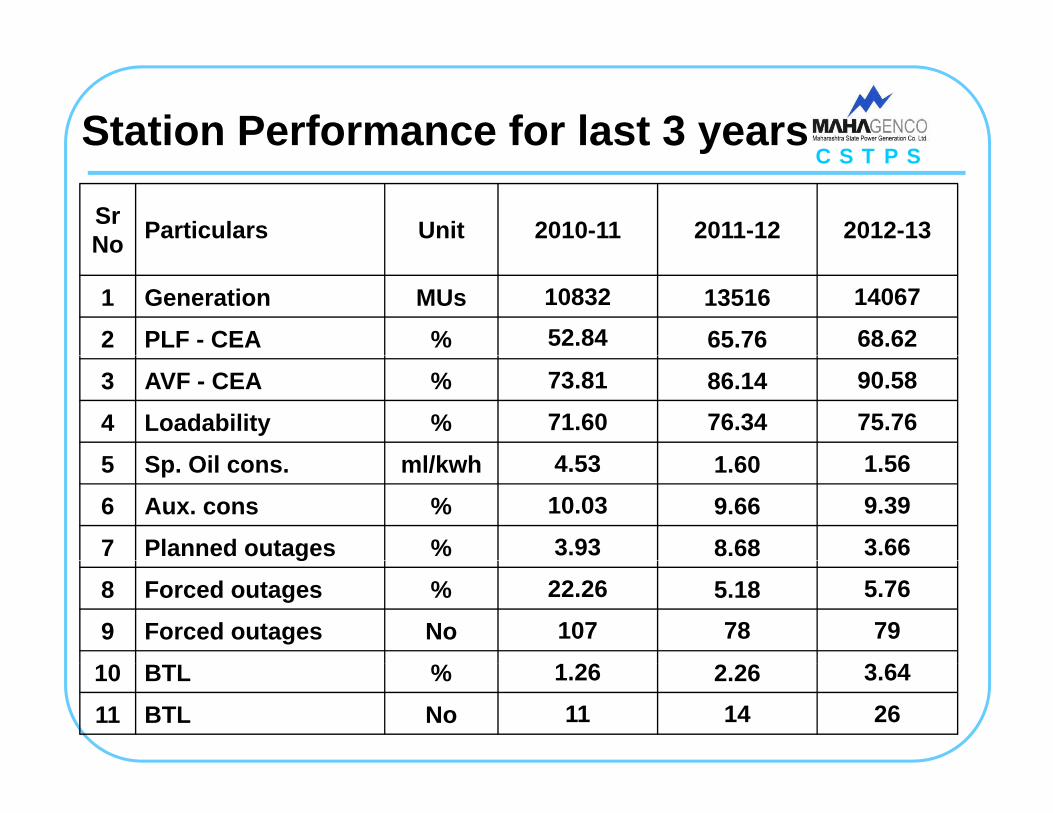
C S T P SStation Performance for last 3 years
C S T P Sy
SrNo Particulars Unit 2010-11 2011-12 2012-13
1 Generation MUs 10832 13516 14067
2 PLF - CEA % 52.84 65.76 68.62
3 AVF - CEA % 73.81 86.14 90.58
4 Loadability % 71.60 76.34 75.76
5 S Oil l/k h 4 53 1 60 1 565 Sp. Oil cons. ml/kwh 4.53 1.60 1.56
6 Aux. cons % 10.03 9.66 9.39
7 Planned outages % 3.93 8.68 3.66g
8 Forced outages % 22.26 5.18 5.76
9 Forced outages No 107 78 79
10 BTL % 1.26 2.26 3.64
11 BTL No 11 14 26

C S T P SMERC PARAMETERS
C S T P S
SrN Particulars Unit 2010-11 2011-12 2012-13No
1 PLF %Approved 66.67 80.00 80.00
A hi d 52 84 65 76 68 62Achieved 52.84 65.76 68.62
2 Heat Rate Kcal/kwh
Approved 2764 2659 2698
Achieved 2764 2643 2661
3 Sp. Oil cons. ml/ kwh
Approved 4.54 2.00 2.00
Achieved 4.54 1.60 1.56
4 Aux. cons %Approved 9.80 9.01 8.91
Achieved 10.03 9.66 9.39
A d 0 80 0 80 0 805 Transit Loss %
Approved 0.80 0.80 0.80
Achieved 0.03 0.15 0.31

C S T P SDesign Coal specifications
C S T P Sg p
Sr Parameters Unit U 1&2 U 3&4 U 5&6 U 7 StationNo Parameters Unit U-1&2 U-3&4 U-5&6 U-7 Station
1 F C % 36 37 34 00 28 00 26 00 30 151 F. C. % 36.37 34.00 28.00 26.00 30.15
2 V. M. % 24.48 22 24.00 22.00 23.36
3 Moisture % 8.65 8.65 8.00 10.00 8.66
4 Ash % 30.5 35.00 40.00 42.00 37.82
5 GCV Kcal/kg 4313 4445 3750 3500 3922
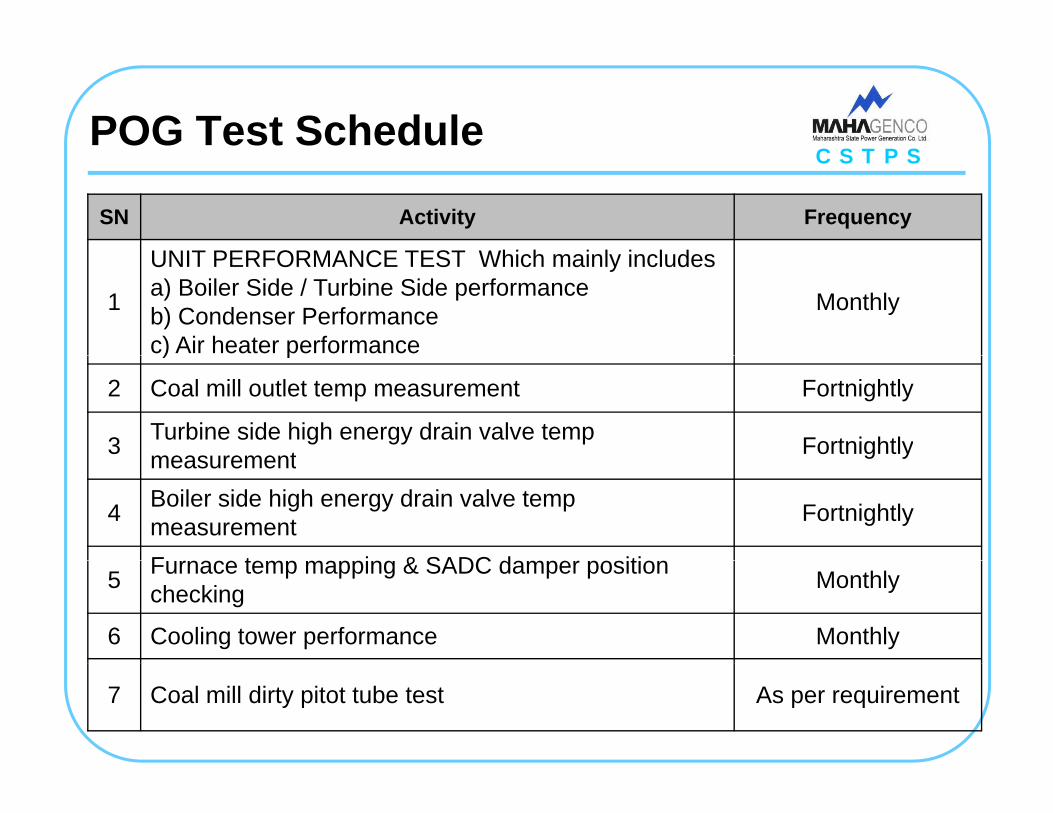
C S T P SPOG Test Schedule
C S T P S
SN Activity Frequency
UNIT PERFORMANCE TEST Whi h i l i l d
1
UNIT PERFORMANCE TEST Which mainly includes a) Boiler Side / Turbine Side performanceb) Condenser Performancec) Air heater performance
Monthly
) p
2 Coal mill outlet temp measurement Fortnightly
3 Turbine side high energy drain valve temp measurement Fortnightlymeasurement g y
4 Boiler side high energy drain valve temp measurement Fortnightly
F t i & SADC d iti5 Furnace temp mapping & SADC damper position checking Monthly
6 Cooling tower performance Monthly
7 Coal mill dirty pitot tube test As per requirement

C S T P SPOG Test Schedule
C S T P S
SN Activity Frequency
8 Coal mill clean air flow test As per requirement
9 Flue gas analysis Monthly
10 H2 leak detection test As per requirement
11 BFP performance test As per requirement
12 High volume sampler Quarterly12 High volume sampler Quarterly

C S T P S3. U-6 Boiler Performance
C S T P S
S N Particulars % ValueLosses due to unburned carbon in total dry1 Losses due to unburned carbon in total dry refuse 0.67
2 Losses due to heat in dry flue gas 8.47
3 Losses due to moisture in the “as-fired” fuel 3.2
4 Losses due to moisture from burning hydrogen 4 234 Losses due to moisture from burning hydrogen 4.23
5 Losses due to moisture in air 0.49
6 Losses due to air infiltration 0.45
7 Radiation, Unmeasured Losses & Manufacturers Margin 1.5Manufacturers MarginBoiler Efficiency 81.05

C S T P S3. U-6 GTCHR
C S T P SSl No. Description Heat Rate (Kcal / Kwh)
1 Test GTCHR (VWO) 2026
2 T C d GTCHR (C d f CW I/L 20332 Test Corrected GTCHR (Corrected for CW I/Ltemp of 28.7°C / D‐30°C)
2033
3 Design GTCHR (VWO) 1965
4 Total Deviation in GTCHR 684 Total Deviation in GTCHR 68
5 Condenser loss due to CW flow / Heat load 13
6 Condenser loss due to dirty tube / air ingress 27
7 HP Turbine Efficiency (83 1% / D 88 76%) 167 HP Turbine Efficiency (83.1% / D ‐ 88.76%) 16
8 IP Turbine Efficiency (91.37% / D – 91.41%) ‐
9 FW temp of Eco Inlet (252.87°C/ D ‐255.7°C) 3
10 MS T t (547 3°C/ D 537°C) 1010 MS Temperature (547.3°C/ D ‐537°C) ‐10
11 MS Pressure (165.2 Ksc / D ‐170 Ksc) 3
13 HRH Temperature (543.5°C/ D ‐537°C) ‐3
f ( / )14 RH Spray flow (42 t/hr) 10
15 Total accountable losses 59
16 Unaccountable losses 9

C S T P S3. U-6 Action Plan
C S T P S
Sr No Particulars Action Plan Optimize combustion At least 2 LRSB near goose neck
1Optimize combustion &R/H spray reduction
At least 2 LRSB near goose neck to be made operational within 6 months
T ti i APH Ai h t l tti i t2 To optimize APH performance
Air heater seals setting in next opportunity.To conduct steam path audit.
3 HPT efficiency To restore it by HPT module replacement.CT additional cell addition is in
4 Condenser vacuumprogress.Condenser cleaning in next O/H.Up-gradation of concrete splash bars to PVC splash bars
5 High energy drains Passing drains replaced.
C S T P S4. Sharing Best Practices
C S T P S
1 TDBFP Performance Assessment &1. TDBFP Performance Assessment & maintenance prioritization
2. VFD for coal conveyor belts
I i A h di l i li3. Improving Ash disposal pipeline Availability.
4. Online attending of hot spot of 400 KV GTR-5 B-phase Conductor.p

C S T P S4.1 TDBFP Performance Study
C S T P S
Parameters UnitTDBFP 5A TDBFP 5B TDBFP 6A TDBFP 6B TDBFP 7A TDBFP 7B
Value Value Value Value Value Value
Turbine
Turbine Speed RPM 4602 4986 5255 5096 4745 5424
FW FLOW T/Hr 532 515 733 708 740 887
INLET STEAM PRESSURE Kg/Cm2 4.03 3.76 7.25 6.13 6.71 7.4
INLET STEAM TEMPERATURE Deg C 304 312 294 315 357 327
INLET STEAM FLOW T/Hr 25.16 35.54 43.6 60 24.49 39
Exhaust STEAM PRESSURE Kg/Cm2 ‐0.82 ‐0.85 ‐0.71 ‐0.97 ‐0.9 ‐0.9
OUTLET STEAM TEMPERATURE Deg C 56.60 59.10 67.90 54.40 56.00 56.00
Booster Pump
Suction Pressure Kg/Cm2 8.38 7.10 9.22 8.78 8.67 9.09
Discharge Pressure Kg/Cm2 19.95 23.56 25.00 22.71 21.48 25.11
Main Pump
Discharge Pressure Kg/Cm2 163.63 166.00 192.60 186.00 162.60 203.47
Turbine Cylinder Efficiency % 76.55 75.65 68.74 56.22 71.83 65.26
C S T P S4.1 TDBFP Performance Study
C S T P S
Based on the results of BFP study priority for maintenance of BFP formulated and carried outmaintenance of BFP formulated and carried out as below;
• Unit-6 : TDBFP-6B Turbine Overhaul. • Unit-5 : TDBFP-5B Cartridge replacement.Unit 5 : TDBFP 5B Cartridge replacement.• Unit-7 : TDBFP-7B Cartridge replacement.
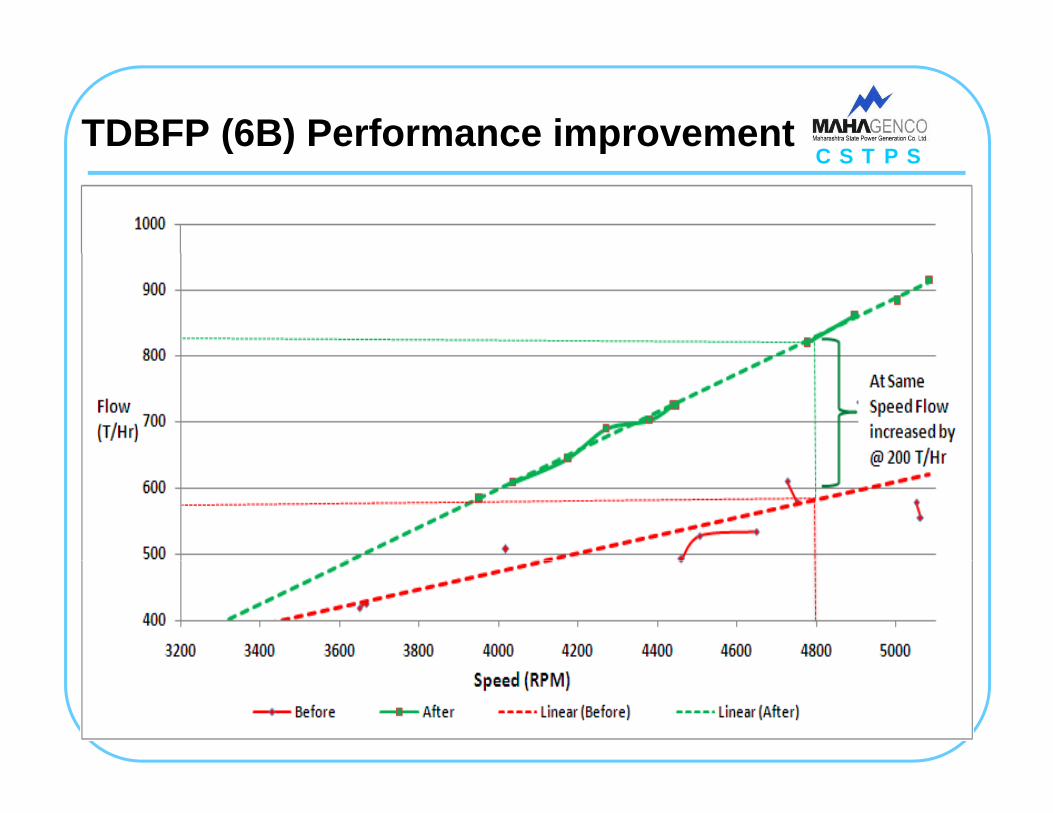
C S T P STDBFP (6B) Performance improvement
C S T P S( ) p

C S T P S
Trend lines PLF V/s % Aux consumption (Unit-6) C S T P S(Unit 6)
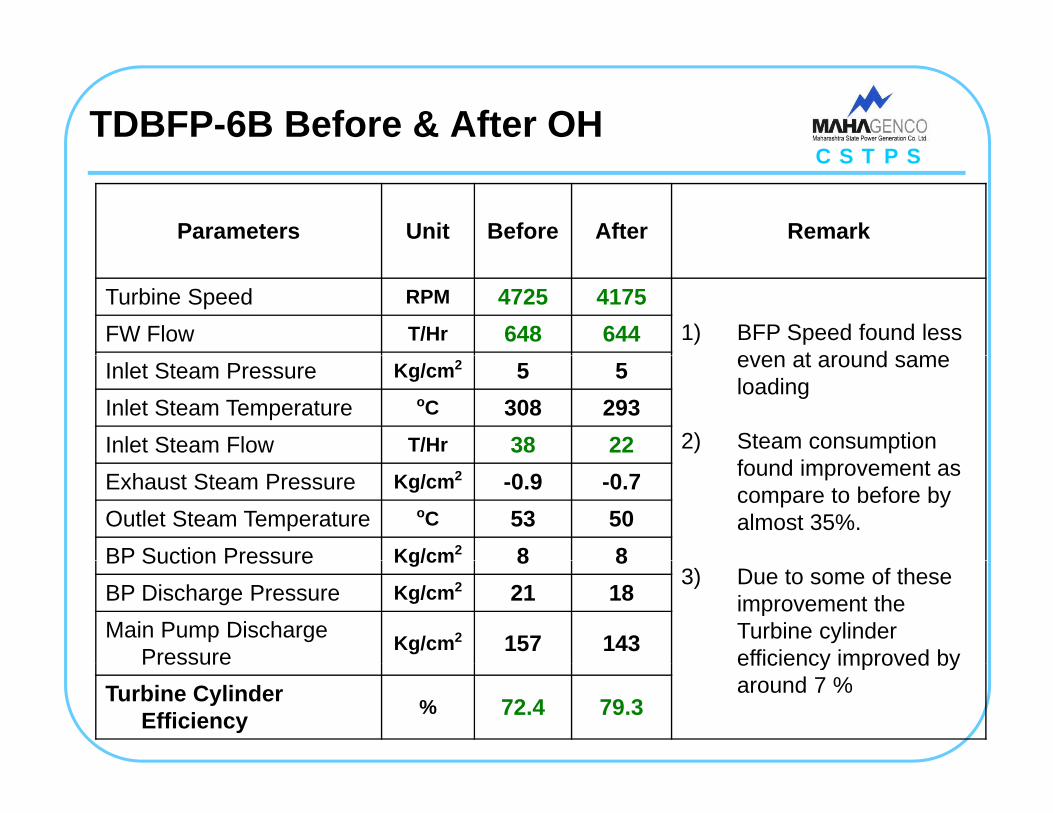
C S T P STDBFP-6B Before & After OH
C S T P S
Parameters Unit Before After Remark
Turbine Speed RPM 4725 41751) BFP Speed found less
even at around sameFW Flow T/Hr 648 644
even at around same loading
2) Steam consumption
Inlet Steam Pressure Kg/cm2 5 5Inlet Steam Temperature oC 308 293Inlet Steam Flow T/Hr 38 22
found improvement as compare to before by almost 35%.
Exhaust Steam Pressure Kg/cm2 -0.9 -0.7Outlet Steam Temperature oC 53 50BP Suction Pressure Kg/cm2 8 8
3) Due to some of these improvement the Turbine cylinder efficiency improved by
BP Suction Pressure Kg/cm 8 8BP Discharge Pressure Kg/cm2 21 18Main Pump Discharge
Pressure Kg/cm2 157 143 efficiency improved by around 7 %
PressureTurbine Cylinder
Efficiency % 72.4 79.3

C S T P S4.2 VFD FOR CONVEYOR DRIVE
C S T P S
VFD Installed For Conveyor Drive: BC 101 A/B, BC 110 A/B & BC 111 A/B.
Achievements:Frequent overloading of Conveyor is eliminated thereby reduction in Down titime.Reduction in major electrical problems lik fl h M t f illike flash over, Motor failures.Energy Conservation (By @ 30 %).E Of P bl Di tiEase Of Problem Diagnostic.

C S T P S4.3 Identification 4.3 Identification of Problems of Problems
C S T P S
COUPLING LEAKAGE(68 %)
PIPE LEAKAGES(30 %)
OTHER LEAKAGE(2 %)(68 %) (30 %) (2 %)
Value denotes percentage of leakages incidences for the year Data based on 1998 incidencesthe year. Data based on 1998 incidences.

C S T P SC S T P S
In the perfect align position pipes P2 & P1 arewelded with their mother ends.

C S T P SGASKET LEAKAGES
C S T P S
Sr. No YEAR ST-I ST-II ST-III YEARLY
TOTALNo. TOTAL1 1998 155 559 1327 20412 1999 270 432 1084 17863 2000 231 289 914 14344 2001 118 153 718 9895 2002 59 39 433 5316 2003 19 37 341 3977 2004 27 8 360 3957 2004 27 8 360 3958 2005 9 13 91 1139 2006 5 6 40 51
10 2007 0 0 17 1711 2008 0 0 6 6
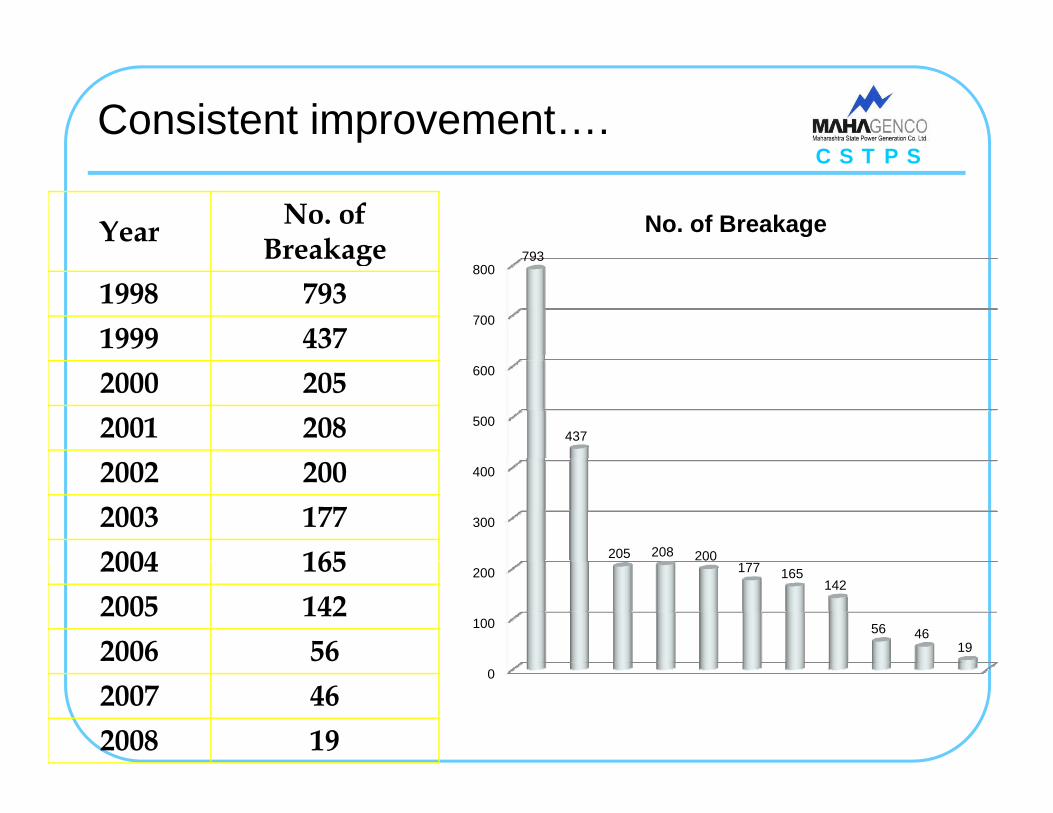
C S T P SConsistent improvement….
C S T P S
Year No. of Breakage 793
No. of Breakage Breakage
1998 7931999 437
700
800793
2000 2052001 208 500
600
437
2002 2002003 1772004 165
300
400
205 208 2002004 1652005 1422006 56
100
20000
177 165142
56 4619
2007 462008 19
0
C S T P S4.4 Hot spot
C S T P S
Unit-5 hot spot of 400 KV GTR-5 B-phase Conductor detected during preventive infrared thermography.
Unit-5 hot spot of 400 KV GTR-5 B-phase Conductor attended online.
It was possible to run the plant up to the next forced outage opportunity.