changes in cultural consumption: ethnographic collections ...kjb/pdfs/changes in cultural...
TRANSCRIPT

Full Terms & Conditions of access and use can be found athttp://www.tandfonline.com/action/journalInformation?journalCode=ccut20
Download by: [University of Southern Denmark] Date: 08 December 2016, At: 07:10
Cultural Trends
ISSN: 0954-8963 (Print) 1469-3690 (Online) Journal homepage: http://www.tandfonline.com/loi/ccut20
Changes in cultural consumption: ethnographiccollections in Wikipedia
Trilce Navarrete & Karol J. Borowiecki
To cite this article: Trilce Navarrete & Karol J. Borowiecki (2016) Changes in culturalconsumption: ethnographic collections in Wikipedia, Cultural Trends, 25:4, 233-248, DOI:10.1080/09548963.2016.1241342
To link to this article: http://dx.doi.org/10.1080/09548963.2016.1241342
View supplementary material
Published online: 17 Oct 2016.
Submit your article to this journal
Article views: 61
View related articles
View Crossmark data

Changes in cultural consumption: ethnographic collections inWikipediaTrilce Navarrete and Karol J. Borowiecki
Department of Business and Economics, University of Southern Denmark, Odense, Denmark
ABSTRACTVisits to museums have been studied as hedonic and utilitarianforms of cultural consumption, though limited attention has beengiven to the access of museum collections online. We perform aunique historic analysis of the visibility of collections in a museumof ethnographic collections and compare 100 years of onsite visitsto 5 years online visits. We find two main results: first, access tocollections increased substantially online. From a selection ofobjects available both onsite and online, access grew from anaverage of 156,000 onsite visits per year to over 1.5 million viewsonline per year. Onsite, the museum received 15.5 million visits ina span of a century while online, collections were viewed 7.9million times in only the last 5 years. Second, we find a differencein consumer preference for type of object, favouring 3D onsiteand 2D online (photographs of objects, particularly when showingthem being used). Results support understanding of onlineheritage consumption and emerging dynamics, particularlyoutside of an institutional environment, such as Wikipedia.
KEYWORDSHeritage consumption;museums; digital heritage;access; exhibition history;Wikipedia
Introduction
Visiting museums has become an important leisure activity and touristic attraction (Frey &Meier, 2006), predominantly to institutions with a higher ease of physical accessibility(Brook, 2016) and particularly for visitors with higher levels of education, income (Falk &Katz-Gerro, 2015), and an intellectual motivation (Brida, Dalle Nogare, & Scuderi, 2015).Understanding consumer preference for cultural goods has further identified a patternwhere few products are extremely popular, while the majority of content remainsobscure (Clement, Proppe, & Rott, 2007; Ginsburgh & van Ours, 2003). This so-calledlong tail associated with the superstar museums and artworks (Frey & Meier, 2006) hasalso been found online, though longer and thicker and resulting in a different set of super-stars (Navarrete & Borowiecki, 2016).
The availability of collections online has led to the reuse of objects in contexts outsideof the museum website. This should not come as surprise. Technological innovation hasbeen identified to change cultural consumption and consumer preference (Potts, 2014).An example can be found in performing arts institutions that adopted digital technologies,
© 2016 Informa UK Limited, trading as Taylor & Francis Group
CONTACT Trilce Navarrete [email protected] data can be accessed at http://dx.doi.org/10.1080/09548963.2016.1241342
CULTURAL TRENDS, 2016VOL. 25, NO. 4, 233–248http://dx.doi.org/10.1080/09548963.2016.1241342

which have experienced a broadening and deepening of their consumer base (Bakhshi &Throsby, 2012). Museums seeking to broaden and deepen their visitors have positionedcollections where the consumers are: online. Positioning objects in a social media sitewill reach far more online users than when publishing collections in the museumwebsite, particularly websites of lesser-known museums. A number of heritage insti-tutions, including 25 from the Netherlands, have published collections at the WikimediaCommons, the online repository that feeds Wikipedia articles. Figure 1 shows a photo-graph of an object displayed in a museum and a photograph from the museum’s collec-tion with the object being used, both serving to illustrate a Wikipedia article that receivesan average of 14 views per day.1
Dutch heritage institutions have published over half a million objects in the Commons,representing close to 2.4% of all Wikimedia content (Brinkerink, 2015). Launched in 2001,Wikipedia has been ranked among the 10 most popular websites on the Internet.2 Withmore than 35 million articles written, Wikipedia receives about 17 million views permonth, in all languages and including mobile access.3 Wikipedia’s considerable trafficsignals its position as highly preferred site for online information consumption.
Figure 1. Two museum objects used to illustrate a Wikipedia article. Source: https://en.wikipedia.org/wiki/Kris_of_Knaud. Accessed on 9 October 2016.
234 T. NAVARRETE AND K. J. BOROWIECKI

Cultural heritage consumption onsite and online has received much attention in thecontext of the music, film and book markets (e.g. Vallbé, Bodó, Handke, & Quintais,2015). Analysis has generally compared consumer choice of channel (e.g. legal or illegal,payment subscription) and carrier (e.g. CD, download and streaming). Analysis comparingchange in type of content preference when a digital variant is available has not receivedmuch attention. Only one study included the variable of type of content, identifying adigital preference for film titles not available onsite (Bodo & Lakatos, 2012). This paperintends to fill this void by comparing the consumer preference onsite and online pertype of content.
In this paper, we focus on two specific questions: first, we explore the changes in con-sumption by comparing physical exhibition and online publication in an open dataenvironment. We analyse object mobility and visibility. Second, we try to explain the differ-ences in preference of consumption by analysing patterns of object selection. We find anexponential increase in consumption whenmoving into the digital realm, where the onsiteenvironment is limited to a number of exhibits a year, the online environment awardsunrestricted access 24/7 from across the (digital) globe representing an important comp-lement to collection accessibility. We also find new preference patterns in the onlineenvironment: readers favour English pages that include rich and diverse content(quality indicator), while editors favour alternative languages with little content,suggesting a trend to enrich the information market. This is particularly relevant for ethno-graphic museums giving digital access to their holdings, in fact facilitating cross-culturalencounters for further knowledge making (Witcomb, 2007).
Results contribute to the empirical research on consumer behaviour and heritage con-sumption preference, particularly of hedonic products (content) available free of charge inthe online market. We illuminate the relationship between cultural consumption patternsonline and onsite, by availing partly of new tools that enable analyses of consumer behav-iour around the content provided by galleries, libraries, archives and museums (the so-called GLAMs). We further contribute to the understanding of non-profit organisations,with focus on museums and on the Wikipedia environment. This paper is the first, tothe best of our knowledge, to compare change in consumption preference of heritagecontent from an onsite to an online environment in an empirical framework using historicvisitor data.
The remaining of the paper is organised as follows: in the first section, we define con-sumption (and use) of heritage and review the literature on the consumer preference ofhedonic products. In the second section, we review the literature on consumption of Wiki-pedia content across topics and languages. In the third section, we present the data,describe our method and present the quantitative analysis followed by a discussion inthe fourth section. We end with conclusions in the final section.
Cultural consumption
Cultural consumption refers to cultural goods and services that are used for direct satisfac-tion of individual needs, or collective needs of members of a community (EC, 2008).4 Con-sumption of museum services generally measure the number of people visiting theexhibits, a measure we pursue in the underlying study, or the price of access (e.g. Boro-wiecki & Navarrete, 2015, who study how museum prices are influenced by VAT rates
CULTURAL TRENDS 235
for admission to cultural services). Much less attention has been given to complementaryforms of consumption, such as (catalogue) sales, image licensing or online view of thecollections.
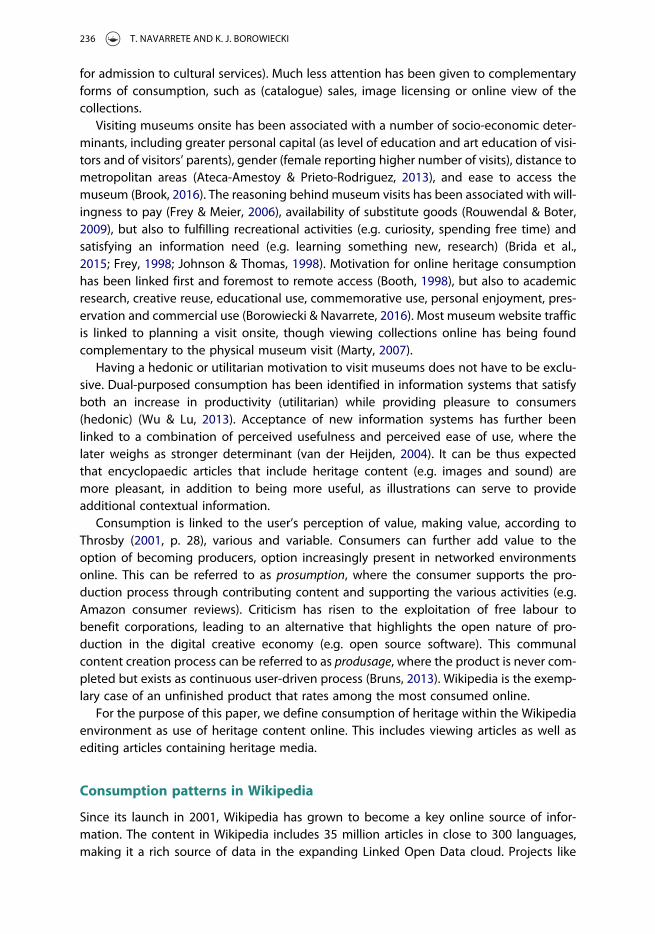
Visiting museums onsite has been associated with a number of socio-economic deter-minants, including greater personal capital (as level of education and art education of visi-tors and of visitors’ parents), gender (female reporting higher number of visits), distance tometropolitan areas (Ateca-Amestoy & Prieto-Rodriguez, 2013), and ease to access themuseum (Brook, 2016). The reasoning behind museum visits has been associated with will-ingness to pay (Frey & Meier, 2006), availability of substitute goods (Rouwendal & Boter,2009), but also to fulfilling recreational activities (e.g. curiosity, spending free time) andsatisfying an information need (e.g. learning something new, research) (Brida et al.,2015; Frey, 1998; Johnson & Thomas, 1998). Motivation for online heritage consumptionhas been linked first and foremost to remote access (Booth, 1998), but also to academicresearch, creative reuse, educational use, commemorative use, personal enjoyment, pres-ervation and commercial use (Borowiecki & Navarrete, 2016). Most museum website trafficis linked to planning a visit onsite, though viewing collections online has being foundcomplementary to the physical museum visit (Marty, 2007).
Having a hedonic or utilitarian motivation to visit museums does not have to be exclu-sive. Dual-purposed consumption has been identified in information systems that satisfyboth an increase in productivity (utilitarian) while providing pleasure to consumers(hedonic) (Wu & Lu, 2013). Acceptance of new information systems has further beenlinked to a combination of perceived usefulness and perceived ease of use, where thelater weighs as stronger determinant (van der Heijden, 2004). It can be thus expectedthat encyclopaedic articles that include heritage content (e.g. images and sound) aremore pleasant, in addition to being more useful, as illustrations can serve to provideadditional contextual information.
Consumption is linked to the user’s perception of value, making value, according toThrosby (2001, p. 28), various and variable. Consumers can further add value to theoption of becoming producers, option increasingly present in networked environmentsonline. This can be referred to as prosumption, where the consumer supports the pro-duction process through contributing content and supporting the various activities (e.g.Amazon consumer reviews). Criticism has risen to the exploitation of free labour tobenefit corporations, leading to an alternative that highlights the open nature of pro-duction in the digital creative economy (e.g. open source software). This communalcontent creation process can be referred to as produsage, where the product is never com-pleted but exists as continuous user-driven process (Bruns, 2013). Wikipedia is the exemp-lary case of an unfinished product that rates among the most consumed online.
For the purpose of this paper, we define consumption of heritage within the Wikipediaenvironment as use of heritage content online. This includes viewing articles as well asediting articles containing heritage media.
Consumption patterns in Wikipedia
Since its launch in 2001, Wikipedia has grown to become a key online source of infor-mation. The content in Wikipedia includes 35 million articles in close to 300 languages,making it a rich source of data in the expanding Linked Open Data cloud. Projects like
236 T. NAVARRETE AND K. J. BOROWIECKI

DBpedia or WikiData extract, structure and make the content available in a machine-read-able format that facilitates reuse, such as Google’s Knowledge Graph (Lehmann et al.,2015). The Wikimedia Foundation projects receive millions of visits daily, 49.5% ofwhich visit Wikipedia articles and 47% of which visit images and other multimediaresources, adding up to 96% of all server traffic (Reinoso, Muñoz-Mansilla, Herraiz, &Ortega, 2012). Images, and multimedia, are an important part of the content deliveredby Wikipedia.
Wikipedia receives more than 400 million unique visitors per month,5 of which nearly halfaccounts for visits to the English edition (Reinoso, Muñoz-Mansilla, et al., 2012). Article viewspresent cycles, with lower traffic during the weekend and holiday periods and higher trafficduring school exam periods (Ratkiewicz, Menczer, Fortunato, Flammini, & Vespignani,2010).6 Bursts on article views can be linked to “appropriately chosen queries on GoogleTrends, suggesting that these bursts are often driven by external events” (Ratkiewiczet al., 2010, p. 295). One such example is the beer poisoning taking place during a funeralin Mozambique in 2015.7 Finding the appropriate query terms may be possible for articlesrelated to critical events but can prove challenging when exploring the use of articles con-taining heritage collections content. Alternatively, increased views can result from an atten-tion burst to articles and objects being featured on the Wikipedia home page (Gyllstrom &Moens, 2012). Number of page views and edits in Wikipedia articles has also been linked topopular films (Mestyan, Yasseri, & Kertesz, 2013).
In addition to time patterns for consumption, consumer preference can be analysed bytopic. Lehmann, Müller-Birn, Laniado, Lalmas, and Kaltenbrunner (2014) quantified thepreference of consumers specific to biographical articles (a popular topic) in the EnglishWikipedia (the largest edition) and found that biographies of historical figures, generalhistory, places and culture were rated among the 500 most popular articles. Geography,history and politics have been identified as highly popular topics, which Spoerri (2007a)defined as prototypical encyclopaedia topics.8 Spoerri (2007b) further found the topicentertainment (including music, films, comics, performers, TV series, video games andbooks) to be the most popular topic within the top 100 most viewed English Wikipediapages, followed by politics and history, geography and the arts. Images from heritageorganisations can be expected to illustrate such encyclopaedic topics, as collectionsserve to document history, places and culture.
Consumption patterns may vary between readers and editors of Wikipedia. A study byReinoso et al., (2012) found a discrepancy in the topic preference of readers and editors:articles about geography were most viewed among the German and French editions whilemost edits were found among German, French and Spanish editions; articles about artsand humanities were most viewed in the Spanish and French edition while most editswere found in the French edition; arts and entertainment articles were most viewed inthe German, English and French editions while most edits were found in the Spanishedition.
Research on the use of Wikipedia to distribute museum collections reported that thelong-tail often found in cultural consumption was also present online, though longerand thicker (Navarrete & Borowiecki, 2016). Results support the view that Wikipedia,and Wikimedia Commons, are important intermediaries for cultural consumption online.We hope to contribute to this discussion by presenting our results on the use of Dutchethnographic collections in the top seven Wikipedia languages.
CULTURAL TRENDS 237

Data and analysis
Object accessibility
In order to compare a change in object accessibility onsite and online, we chose an insti-tution with a sound historic record of onsite exhibitions that had a large enough portion ofits collection published online. We found the ethnographic museum in Amsterdam(NMVM),9 with a collection of 600,000 objects, holds a digital record of exhibitions perobject for the past 100 years in its digital database, The Museum System (TMS). A queryon the exhibited objects in its current location (opened in 1927) showed that 10% ofthe collection has been exhibited since. We reviewed the museum’s archive to identifythe number of people visiting the exhibits and used the annual reports to determinethe number of onsite views of the collection from 1911 to 2010 (see Figure 2). We alsofound two major visitor surveys that outlined the socioeconomic make-up of the visitorpopulation in the 1950s.
From the graph, important events can be quickly identified in the museum’s last 100-year history. First, the museum moved from Haarlem to open at its current location inAmsterdam in 1927 with a visible change in number of visits towards a general uprightslope. A peak can be found during the German occupation in 1944, to be followed by adrop after liberation in 1945, presumably as citizens were busy reconstructing the post-war country.10 Gradually, visits grew to peak in 1971 with the Orchids exhibit. A significantdrop is visible during 1976 when the museumwas closed for renovation. The most popularyear up to date was 1986, when the NMVW received 300,000 visits for the exhibitionsIndigo and The Human Story. A decline in number of visits reached its lowest in 2000after which an upward slope can be observed. Accumulative, the NMVW has received8.4 million visits onsite during the last century.
In order to measure the online visits, we lacked analytics for the museum’s website atobject level for which we chose an alternative online environment. We selected Wikime-dia, where the museum has published nearly 50,000 objects of which 12% are being usedin Wikipedia articles. We used the BaGLAMa2 tool to identify the visits online, represented
Figure 2. NMVW visitor numbers (1911–2010). Source: own, Tropenmuseum annual reports.
238 T. NAVARRETE AND K. J. BOROWIECKI

by number of views of Wikipedia articles containing the museum’s collection.11 Figure 3shows the number of views of all Wikipedia articles containing at least one image fromthe NMVW, from May 2010 and until June 2015 (52 months). Accumulative, the NMVWhas received 448.3 million visits online in the past 5 years.12 In comparison, the Tropenmu-seum collection website provides access to their entire collection of over 600,000 objectsand receives an average 50,000 page views per month.
A general growing slope can be found with peak on December 2013, with 17.7 millionviews, followed by a downward slope. The reasoning behind the decline may be related tothe increase in mobile views, not captured by the BaGLAMa2 tool, which can be observedin the general use of Wikipedia.13 A similar declining trend can be seen in the English,German, Dutch, French and Spanish Wikipedia page views, as in most languages,though with an earlier peak on February 2013 to be followed by a downward slope.The downward slope observed in all languages, and in spite of the increase in mobileuse, may also reflect Google’s use of the Knowledge Graph, available on December2012 in English, German, French and Spanish.14 Since then, Google displays key infor-mation from Wikipedia into a box on the top right of the browser, presumably satisfyingthe user’s questions who decreasingly clicks further into the Wikipedia article. The Indone-sian Wikipedia does not present this trend, where Google’s knowledge graph is not avail-able and page views continue to increase instead.15
Figure 4 shows the number of pages made in the seven most popular languages(English, Indonesian, German, Dutch, French, Spanish and Japanese) while Figure 5shows the number of views per Wikipedia language in the same period. Noticeable isthe visible preference towards the English Wikipedia articles, followed by Indonesianand all other languages. This may be explained by the size of the general English Wikipe-dia, being the largest edition (representing 51% views and 14% articles of the total Wiki-pedia), and by the prominent use of English in many countries across the globe. Data showa striking difference between the preference of readers, being significantly higher inEnglish, and of editors, predominantly working at the Indonesian and English versions.
Figure 3. Wikipedia article views from category Images from the NMVW (March 2010–June 2015).Source: BaGLAMa2.
CULTURAL TRENDS 239

This is explained by the nature of the collections, being ethnographic collections with asignificant share originating in Indonesia. Table 1 shows the use of Wikipedia in the topseven languages containing the NMVW collection. English remains by far the preferredversion for global consumers.
Figure 4. Number of Wikipedia pages containing NMVW collection (top seven languages). Source:BaGLAMa2.
Figure 5. Wikipedia articles views containing NMVW collection (top seven languages). Source:BaGLAMa2.
240 T. NAVARRETE AND K. J. BOROWIECKI
Correlates of object views
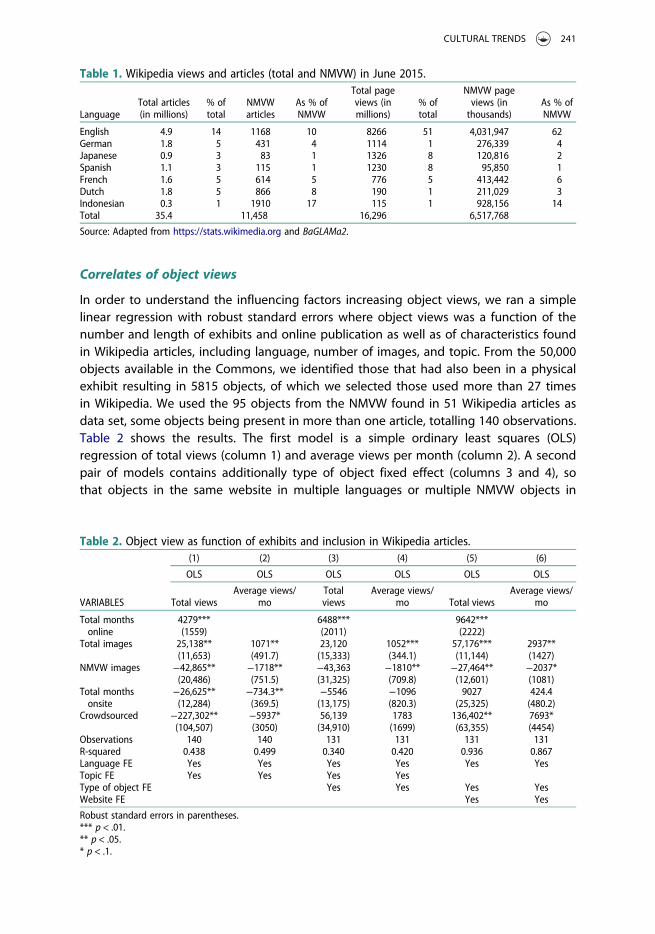
In order to understand the influencing factors increasing object views, we ran a simplelinear regression with robust standard errors where object views was a function of thenumber and length of exhibits and online publication as well as of characteristics foundin Wikipedia articles, including language, number of images, and topic. From the 50,000objects available in the Commons, we identified those that had also been in a physicalexhibit resulting in 5815 objects, of which we selected those used more than 27 timesin Wikipedia. We used the 95 objects from the NMVW found in 51 Wikipedia articles asdata set, some objects being present in more than one article, totalling 140 observations.Table 2 shows the results. The first model is a simple ordinary least squares (OLS)regression of total views (column 1) and average views per month (column 2). A secondpair of models contains additionally type of object fixed effect (columns 3 and 4), sothat objects in the same website in multiple languages or multiple NMVW objects in
Table 1. Wikipedia views and articles (total and NMVW) in June 2015.
LanguageTotal articles(in millions)
% oftotal
NMVWarticles
As % ofNMVW
Total pageviews (inmillions)
% oftotal
NMVW pageviews (inthousands)
As % ofNMVW
English 4.9 14 1168 10 8266 51 4,031,947 62German 1.8 5 431 4 1114 1 276,339 4Japanese 0.9 3 83 1 1326 8 120,816 2Spanish 1.1 3 115 1 1230 8 95,850 1French 1.6 5 614 5 776 5 413,442 6Dutch 1.8 5 866 8 190 1 211,029 3Indonesian 0.3 1 1910 17 115 1 928,156 14Total 35.4 11,458 16,296 6,517,768
Source: Adapted from https://stats.wikimedia.org and BaGLAMa2.
Table 2. Object view as function of exhibits and inclusion in Wikipedia articles.
VARIABLES
(1) (2) (3) (4) (5) (6)
OLS OLS OLS OLS OLS OLS
Total viewsAverage views/
moTotalviews
Average views/mo Total views
Average views/mo
Total monthsonline
4279*** 6488*** 9642***(1559) (2011) (2222)
Total images 25,138** 1071** 23,120 1052*** 57,176*** 2937**(11,653) (491.7) (15,333) (344.1) (11,144) (1427)
NMVW images −42,865** −1718** −43,363 −1810** −27,464** −2037*(20,486) (751.5) (31,325) (709.8) (12,601) (1081)
Total monthsonsite
−26,625** −734.3** −5546 −1096 9027 424.4(12,284) (369.5) (13,175) (820.3) (25,325) (480.2)
Crowdsourced −227,302** −5937* 56,139 1783 136,402** 7693*(104,507) (3050) (34,910) (1699) (63,355) (4454)
Observations 140 140 131 131 131 131R-squared 0.438 0.499 0.340 0.420 0.936 0.867Language FE Yes Yes Yes Yes Yes YesTopic FE Yes Yes Yes YesType of object FE Yes Yes Yes YesWebsite FE Yes Yes
Robust standard errors in parentheses.*** p < .01.** p < .05.* p < .1.
CULTURAL TRENDS 241
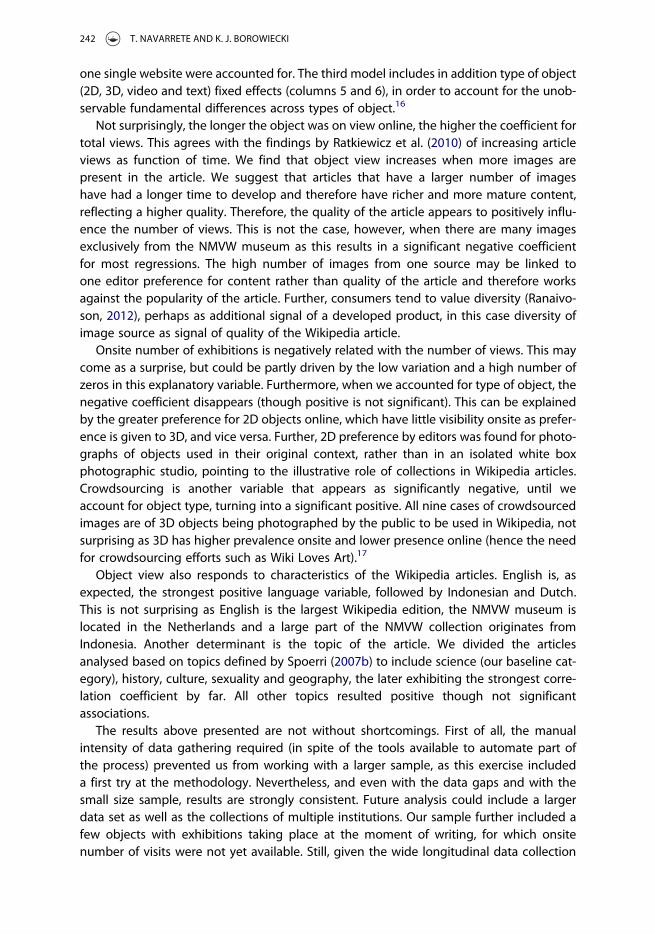
one single website were accounted for. The third model includes in addition type of object(2D, 3D, video and text) fixed effects (columns 5 and 6), in order to account for the unob-servable fundamental differences across types of object.16
Not surprisingly, the longer the object was on view online, the higher the coefficient fortotal views. This agrees with the findings by Ratkiewicz et al. (2010) of increasing articleviews as function of time. We find that object view increases when more images arepresent in the article. We suggest that articles that have a larger number of imageshave had a longer time to develop and therefore have richer and more mature content,reflecting a higher quality. Therefore, the quality of the article appears to positively influ-ence the number of views. This is not the case, however, when there are many imagesexclusively from the NMVW museum as this results in a significant negative coefficientfor most regressions. The high number of images from one source may be linked toone editor preference for content rather than quality of the article and therefore worksagainst the popularity of the article. Further, consumers tend to value diversity (Ranaivo-son, 2012), perhaps as additional signal of a developed product, in this case diversity ofimage source as signal of quality of the Wikipedia article.
Onsite number of exhibitions is negatively related with the number of views. This maycome as a surprise, but could be partly driven by the low variation and a high number ofzeros in this explanatory variable. Furthermore, when we accounted for type of object, thenegative coefficient disappears (though positive is not significant). This can be explainedby the greater preference for 2D objects online, which have little visibility onsite as prefer-ence is given to 3D, and vice versa. Further, 2D preference by editors was found for photo-graphs of objects used in their original context, rather than in an isolated white boxphotographic studio, pointing to the illustrative role of collections in Wikipedia articles.Crowdsourcing is another variable that appears as significantly negative, until weaccount for object type, turning into a significant positive. All nine cases of crowdsourcedimages are of 3D objects being photographed by the public to be used in Wikipedia, notsurprising as 3D has higher prevalence onsite and lower presence online (hence the needfor crowdsourcing efforts such as Wiki Loves Art).17
Object view also responds to characteristics of the Wikipedia articles. English is, asexpected, the strongest positive language variable, followed by Indonesian and Dutch.This is not surprising as English is the largest Wikipedia edition, the NMVW museum islocated in the Netherlands and a large part of the NMVW collection originates fromIndonesia. Another determinant is the topic of the article. We divided the articlesanalysed based on topics defined by Spoerri (2007b) to include science (our baseline cat-egory), history, culture, sexuality and geography, the later exhibiting the strongest corre-lation coefficient by far. All other topics resulted positive though not significantassociations.
The results above presented are not without shortcomings. First of all, the manualintensity of data gathering required (in spite of the tools available to automate part ofthe process) prevented us from working with a larger sample, as this exercise includeda first try at the methodology. Nevertheless, and even with the data gaps and with thesmall size sample, results are strongly consistent. Future analysis could include a largerdata set as well as the collections of multiple institutions. Our sample further included afew objects with exhibitions taking place at the moment of writing, for which onsitenumber of visits were not yet available. Still, given the wide longitudinal data collection
242 T. NAVARRETE AND K. J. BOROWIECKI

period for visits onsite, results are an indication of visibility for what have been the mostpopular objects in the last century.
The number of views online per object does not account for the positioning of theimage within the article. From our sample, three objects are located at the top subjectbox, one object is located at the bottom category box (negligible), and other objectsare located throughout the articles. We did not account for position (e.g. strong, mid oflow visibility) because we lacked the comparable evaluation data for the onsite exhibition,which present similar dynamics depending on object positioning in the physical space.Nonetheless, the onsite comparison to the online environment gives a number of clueson the consumer preference for heritage online.
Discussion
Consumption of the museum collection online is significant. In the last century, 8.4 millionpeople have physically visited the museum NMVW while 448.4 million people have visitedWikipedia pages containing images from the NMVW collection. That is an average of94,500 visits onsite per year increasing to 1.7 million visits online per year. In comparison,the collection receives 600,000 annual views at the museum website.18 From the selectedobjects, both present onsite and online, the increase presented a different rate from 2223visits per year onsite to 8439 views per year online. This evidences the change in culturalconsumption brought by changes in technology, affecting quantity, diversity and consu-mer preferences, as suggested by Potts (2014).
Wikipedia, as online distribution channel, has proven key to position the content intoniche markets. The museum not only benefits from the infrastructure in place, which isbeing developed to grow mobile, but also from the community of users who keep thecontent updated, what Benghozi and Benhamou (2010) refer to as information curation,and who increase the chance of reuse (Zhang & Kamps, 2010). Clearly, all are benefitsfor the museum at a marginal cost. For heritage institutions it is to be expected thatusing existing social online networks to disseminate content is less costly than developingtheir own online environments, this in terms of the resources needed to develop andmaintain the technical platform as well as the community of users, costs identified by Ben-ghozi and Benhamou (2010) and by Ongena, Huizer, and van de Wijngaert (2012). Further,the Wikipedia environment offers multilingual layers of access to content where the sameobject may be used in similar articles in different languages as well as to illustrate a varietyof different topics. In turn, Wikipedia benefits from having a larger repository of images toillustrate articles and hence enrich their quality by increasing diversity, an importantcharacteristic valued by consumers (Ranaivoson, 2012). Ideally, collaboration wouldinvolve more than image dumping bymuseums into the Commons but also include enrich-ment of articles by staff at heritage institutions, participation in the Wiki Loves Art events,or other forms of contribution to the community of users. In this way, the museum wouldfavour a produsage environment over a prosumption relation (Bruns, 2013).
The significant increase in object views of collections made available with a CC-BY-SAlicense (Creative Commons license Attribution Share alike) in the Commons repository,support an open data strategy to increase social welfare. Increasing consumption of col-lections by improving physical accessibility (Brook, 2016) could easily be translated intopublication of collections online that support an accessible legal framework.
CULTURAL TRENDS 243

In terms of the information signals to support selection of quality products, a strikingdifference is found between the onsite and the online environments. While experts (cura-tors) select objects for physical exhibitions, it is the consumers (community of Wikipediausers) that select objects to be included in the Wikipedia articles. In the museum, cura-tors, conservators or marketing staff select objects to advance knowledge in the field,responding to questions originating from the collections in a research-based approach,or select objects responding to public interest, driven by the market and currentevents (e.g. death of a popular artist) (Lord & Piacente, 2014). The process leads to a fin-ished exhibition that has an opening and a closing. In Wikipedia, the crowd of editors isresponsible for selecting objects, susceptive to individual interest and digital know-how,in a non-institutionalised process, with no particular start or finish. Images can be addedor replaced as the article expands and as new images become available in a continuouseditorial process. Information signals available for online editors include descriptivemetadata (e.g. name of the person being depicted), quality of the image (e.g. resolution)as well as source of the object (e.g. heritage institutions). It is worth noting that thisanalysis revolves around museum objects, all of which have, by definition, beencurated by experts before being made available at the Commons, with a marginalshare photographed and uploaded by the crowd (through the Wiki Loves Artprogramme).
Consumer selection for attending exhibitions and for reading Wikipedia articles followsimilar information signals to determine quality though with different variants. Visitors ofphysical exhibitions may follow the must see list provided by tourist guides or other formsof ranking mechanisms, which, in combination to a series of socio-economic factors, deter-mine consumer choice for one museum or another (Frey & Meier, 2006; Ginsburgh & vanOurs, 2003). Online, the high traffic to the Wikipedia site, in all languages across the globe,signal a general consumer preference for the site as information source (a must read infor-mation source). Inside Wikipedia, consumer selection follows quality signals of length ofthe article and number of images from multiple sources in addition to a series of internalranking mechanisms, such as the featured article or picture in the home page.
Consumer preference cannot be measured in terms of sales (price and quantity sold ascustomary in empirical economic analysis), because heritage content in Wikipedia is avail-able free of charge. For this, we have analysed the number of views to articles containingthe NMVW collection. The expected school-related cycles are observed, with lowernumber of views during the summer and winter school recess, confirming results by Rat-kiewicz et al. (2010). We also find a discrepancy in the popularity of articles viewed, with astrong preference for the English version, and the articles edited, with a higher number ofarticles found in the Indonesian version. The disclosed difference in consumer activity(edits and views) is in line with the characterisation of the overall Wikipedia traffic pre-viously found by Reinoso, Muñoz-Mansilla, et al. (2012).
Conclusions
The adoption of digital technology in all segments of life has, inevitably, also broughtchanges to cultural consumption. We find evidence that the quantity of goods consumedhas greatly increased in an online environment, leading to observable changes in consu-mer preference, favouring high quality and diversity of content.
244 T. NAVARRETE AND K. J. BOROWIECKI

We investigated the change in accessibility of museum collections after digitisation bycomparing onsite and online object accessibility. We used data from the ethnographicmuseum in Amsterdam (NMVW) and compared exhibitions in the last century (onsiteaccess) to Wikipedia articles from the last five years (online access). We found thatobject accessibility grew exponentially from 94,500 visits onsite per year to 1.7 millionvisits online per year.
We also analysed the changes in consumption preference and found two distinct var-iants reflecting consumption form (physical and online). We found that objects availablefor view at the museum exhibition halls were selected by experts (museum curators), pre-senting a strong preference for 3D objects. In contrast, object selection for Wikipediaarticles was conducted by the Wikipedia community, presenting a strong preference for2D objects. The online preference for 2D images, and specifically depicting the objectbeing used and in context, has implications for further digitisation projects. Multipleviews of an object may give a richer representation and hence satisfy multiple userneeds, to include the object as art piece, in context, or being used and in movement.
Consumption of Wikipedia articles further presented a preference for quality articles,including multiple images from different sources, on topics related to geography in theEnglish version. English remains by far the preferred version for global consumers.
We can conclude that institutions interested in increasing accessibility to collectionsbenefit from publishing collections online in platforms such as Wikimedia. Museumscan further benefit from active networked communities that keep content updated,advance technological development, and further support the greater access to collections,such as the one found in the Wikipedia community. In turn, Wikipedia benefits from agreater selection of images to enrich articles and hence gain greater popularity as aquality information source online.
Research in understanding digital cultural consumer preference from museums, librariesand archives is extremely limited. Future lines of research using the Wikipedia environmentinclude a comparison between museum types (e.g. science, art and history), between heri-tage organisations (e.g. archives, libraries and museums), between objet types (e.g. text,image and video), and between countries of origin (from collections and from viewers).Another line of research involves the analysis of costs related to participating in an openonline environment, to identify the impact of the Wikipedian in Residence, for instance.
Notes
1. Page views reported by Pageviews Analysis tool, available at https://tools.wmflabs.org/pageviews.
2. Ranking made by Alexa (http://www.alexa.com/topsites).3. Views per month vary, the highest has been recorded at over 22 million on September 2014
(http://stats.wikimedia.org/EN/TablesPageViewsMonthlyCombined.htm). For more on Wikipe-dia see https://en.wikipedia.org/wiki/Wikipedia. Wikipedia is one of the projects of the Wiki-media Foundation, which include the Commons, Wikidata, Wikibooks, Wiktionary, Wikinews,Wikiquote, Wikisource, Wikiversity, Mediawiki, and Wikivoyage (https://wikimediafoundation.org/wiki/Home). All Wikimedia projects, in all platforms, received 17.9 billion views on July2015 (see report card at http://reportcard.wmflabs.org/).
4. The definition by the SNA 2008 refers to consumption in general. It states that consumptiontakes place without further transformation in production, which is no longer applicable in the
CULTURAL TRENDS 245

consumption of digital heritage through the participatory web. The case of Wikipedia is agood example, which allows consumers to act as producers when serving as editors.
5. Number of visits in May 2015, as reported in the Wikimedia Report Card (https://outreach.wikimedia.org/wiki/GLAM/Resources/Tools). See also the http://reportcard.wmflabs.org/.
6. In comparison, museums in the US generally receive lower number of visits the first two tothree weeks in September and in December, due to communities going back to school andpreparing for the winter holidays (Lord & Piacente, 2014).
7. https://en.wikipedia.org/wiki/Mozambique_funeral_beer_poisoning.8. Categories of Wikipedia pages generally include Entertainment, Politics, History, Geography,
Sexuality, Science, Computers, Arts, Religion, Holidays, Current events, and Drugs as keytopics (in order of popularity as found by Spoerri, 2007b).
9. The Tropenmuseum is now part of the Nationaal Museum van Wereldculturen (Dutch NationalMuseum of World Cultures, or NMVW).
10. Data from the Statistics Netherland show that overall Dutch museum visits almost doubledafter the Second World War, and after the Dutch Independence in 1952 museum visitnumbers more or less stabilized. The Tropenmuseum, together with the Rijksmuseum andthe Stedelijkmuseum were the three most visited museums in Amsterdam, accounting for85% of all visits in 1950.
11. The BaGLAMa 2 tool was developed by Magnus Manske to track page views from specifiedcategories, defined as all articles containing images from a specific Wikimedia Commons cat-egory. We selected the category Images from the Tropenmuseum https://tools.wmflabs.org/glamtools/baglama2/.
12. The graph shows gaps in data collection from May 2010 until July 2012, due to a technicalerror, after which data is collected monthly.
13. Since early 2016, and after data collection and analysis, Wikimedia reported that “Wikistats arederived via webstatscollector from incoming squid logs” instead of the comScore data reportpreviously used (http://reportcard.wmflabs.org/#). The new data report card accounts formobile views and shows and increasing page view slope. These are pageviews, not numberof visits, as the Wikimedia Foundation protects the privacy of their IP visitors.
14. See more on Google’s Knowledge Graph on https://en.wikipedia.org/wiki/Knowledge_Graph.15. For information on Wikipedia page views per language see http://stats.wikimedia.org/EN/
ReportCardTopWikis.htm#lang_fr.16. By 2D we understand photographs; by 3D we understand photographs of 3D objects in the
collection. Though adoption of 3D imaging is limited by heritage organization’s digitalknow-how, some efforts to make available heritage objects using 3D technology are increas-ingly popular, as the case of https://sketchfab.com/museums.
17. Wiki Loves Art is a photo contest organized yearly, since 2009, in collaboration with museumsand heritage institutions to photograph collections displayed for use in Wikipedia by thegeneral public.
18. The NMVM has two websites, one to provide general information about the museum (with theusual content of a museum website) while the second website functions specifically to giveaccess to the collections and serves as collections catalogue.
Acknowledgments
We are grateful to Richard van Alphen from the NMVW for facilitating data gathering and for sup-porting interpretation of the data. We thank Beat Estermann, Davide Infante, Juliane Stiller, ErikZachte, participants at the 7th European Workshop on Applied Cultural Economics in Vienna andthe Digital Humanities Conference Benelux in Antwerp for invaluable comments.
Funding
This study is part of the FP7 EU-funded project Renewal, Innovation and Change: Heritage and Euro-pean Society (RICHES) taking place from 2013 until 2016 [grant number 612789].
246 T. NAVARRETE AND K. J. BOROWIECKI
ORCiD
Trilce Navarrete http://orcid.org/0000-0001-5297-5190
References
Ateca-Amestoy, V., & Prieto-Rodriguez, J. (2013). Forecasting accuracy of behavioural models for par-ticipation in the arts. European Journal of Operational Research, 229(1), 124–131.
Bakhshi, H., & Throsby, D. (2012). New Technologies in cultural institutions: Theory, evidence andpolicy implications. International Journal of Cultural Policy, 18(2), 205–222.
Benghozi, P. J., & Benhamou, B. (2010). The long tail: Myth or reality? International Journal of ArtsManagement, 12(3), 43–53.
Bodo, B., & Lakatos, Z. (2012). Theatrical distribution and P2P movie piracy: A survey of P2P networksin Hungary using transactional data. International Journal of Communication, 6(2012), 413–445.
Booth, B. (1998). Understanding the information needs of visitors to museums.MuseumManagementand Curatorship, 17(2), 139–157.
Borowiecki, K. J., & Navarrete, T. (2015). Fiscal and economic aspects of book consumption in theEuropean Union (ACEI Working Paper AWP-2-2015).
Borowiecki, K. J., & Navarrete, T. (2016). Digitization of heritage collections as indicator of innovation.Economics of Innovation and New Technology. Advance online publication. doi:10.1080/10438599.2016.1164488
Brida, J. G., Dalle Nogare, C., & Scuderi, R. (2015). Frequency of museum attendance: Motivationmatters. Journal of Cultural Economics, 40(3), 261–283.
Brinkerink, M. (2015). Dutch cultural heritage reaches millions every month. Research & DevelopmentBlog. 17 June 2015. Retrieved September 20, 2016, from http://www.beeldengeluid.nl/en/blogs/research-amp-development-en/201506/dutch-cultural-heritage-reaches-millions-every-month.
Brook, O. (2016). Spatial equity and cultural participation: How access influences attendance atmuseums and galleries in London. Cultural Trends, 25(1), 21–34.
Bruns, A. (2013). From prosumption to produsage. In R. Towse & C. Handke (Eds.), Handbook on thedigital creative economy (pp. 67–78). Cheltenham: Edward Elgar.
Clement, M., Proppe, D., & Rott, A. (2007). Do critics make bestsellers? Opinion leaders and thesuccess of books. Journal of Media Economics, 20(2), 77–105.
EC (European Commission). (2008). System of National Accounts 2008. New York. Retrieved fromhttp://ec.europa.eu/eurostat/ramon/statmanuals/files/SNA2008.pdf
Falk, M., & Katz-Gerro, T. (2015). Cultural participation in Europe: Can we identify common determi-nants? Journal of Cultural Economics, 40(2), 127–162. doi:10.1007/s10824-015-9242-9
Frey, B. (1998). Superstar museums: An economic analysis. Journal of Cultural Economics, 22(2), 113–125.
Frey, B., & Meier, S. (2006). The economics of museum. In V. Ginsburgh & D. Throsby (Eds.), Handbookof the economics of art and culture (pp. 1017–1047). Amsterdam: Elsevier.
van der Heijden, H. (2004). User acceptance of hedonic information systems. MIS Quarterly, 28(4),695–704.
Ginsburgh, V., & van Ours, J. (2003). Expert opinion and compensation: Evidence from a musical com-petition. American Economic Review, 93(1), 289–296.
Gyllstrom, K., & Moens, M. F. (2012). Surfin’ Wikipedia: An analysis of the Wikipedia (non-random)surfing aggregate access data. In Proceeding IIIX ’12 Proceedings of the 4th InformationInteraction in Context Symposium(pp. 155–163). New York: ACM.
Johnson, P., & Thomas, B. (1998). The economics of museums: A research perspective. Journal ofCultural Economics, 22(2), 75–85.
Lehmann, J., Isele, R., Jakob, M., Jentzsch, A., Kontokostas, D., Mendes, P. N.,… Bizer, C. (2015).DBpedia – a large-scale, multilingual knowledge base extracted from Wikipedia. Semantic Web,6(2), 167–195.
CULTURAL TRENDS 247

Lehmann, J., Müller-Birn, C., Laniado, D., Lalmas, M., & Kaltenbrunner, A. (2014). Reader preferencesand behavior on Wikipedia. In HT’14: Proceedings of the 25th ACM Conference on Hypertext andSocial Media (pp. 88–97). New York: ACM.
Lord, B., & Piacente, M. (Eds.). (2014). Manual of museum exhibitions. Lanham, MD: Rowman andLittlefield.
Marty, P. (2007). Museum websites and museum visitors: Before and after the museum visit. MuseumManagement and Curatorship, 22(4), 337–360.
Mestyan, M., Yasseri, T. & Kertesz, J. (2013). Early prediction of movie box office success based onWikipedia activity big data. PLoS ONE, 8(8), e71226.
Navarrete, T., & Borowiecki, K. J. (2016, May 9–11). The long-tail of museum collections: Ethnographiccollections onsite and online. Symposium proceedings International Symposium on theMeasurement of Digital Cultural Products, HEC Montreal, Montréal, Canada.
Ongena, G., Huizer, E., & van de Wijngaert, L. (2012). Threats and opportunities for new audiovisualcultural heritage archive services: The Dutch case. Telematics and Informatics, 29(2), 156–165.
Potts, J. (2014). New technologies and cultural consumption. In V. Ginsburgh & D. Throsby (Eds.),Handbook of the economics of art and culture (pp. 215–232). Amsterdam: Elsevier.
Ranaivoson, H. (2012). Does the consumer value diversity? How the economists’ standard hypothesisis being challenged. In M. Vecco (Ed.), The consumption of culture, the culture of consumption: Acollection of contributions on cultural consumption and cultural markets (pp. 70–95).Saarbrücken: Lambert Academic Publishing.
Ratkiewicz, J., Menczer, F., Fortunato, S., Flammini, A., & Vespignani, A. (2010). Traffic in social media II:Modeling bursty popularity. IEEE International Conference on Social Computing, 393–400.
Reinoso, A. J., Muñoz-Mansilla, R., Herraiz, I., & Ortega, F. (2012). Characterization of the Wikipediatraffic. ICIW 2012: Seventh International Conference on Internet and Web Applications and Services(pp. 156–162). IARIA.
Reinoso, A. J. Ortega-Valiente, J., & Leon, C. (2012). Most popular contents requested by users indifferent Wikipedia editions. In KEOD 2012: International Conference on Knowledge Engineeringand Ontology Development (pp. 415–418).
Rouwendal, J., & Boter, J. (2009). Assessing the value of museums with a combined discrete choice/count data model. Applied Economics, 41(11), 1417–1436.
Spoerri, A. (2007a). Visualizing the overlap between the 100 most visited pages on Wikipedia forSeptember 2006 to January 2007. First Monday, 12(4), 1–6.
Spoerri, A. (2007b). What is popular on Wikipedia and why? First Monday, 12(4), 1–15.Throsby, D. (2001). Economics and culture. Cambridge: Cambridge University Press.Vallbé, J.-J., Bodó, B., Handke, C., & Quintais, J. P. (2015). Knocking on heaven’s door – user preferences
on digital cultural distribution (Working paper). Retrieved from SSRN: http://ssrn.com/abstract=2630519 or doi:10.2139/ssrn.2630519.
Witcomb, A. (2007). The materiality of virtual technologies: A new approach to thinking about theimpact of multimedia in museums. In F. Cameron & S. Kenderdine (Eds.), Theorizing digital culturalheritage (pp. 35–48). Cambridge, MA: MIT Press.
Wu, J., & Lu, X. (2013). Effects of extrinsic and intrinsic motivators on using utilitarian, hedonic, anddual-purposed information systems: A meta-analysis’. Journal of the Association of InformationSystems, 14(3), 153–191.
Zhang, J., & Kamps, J. (2010). Search log analysis of user stereotypes, information seeking behaviour,and contextual evaluation. In IIiX’10: Proceedings of the Third Symposium on Information Interactionin Context (245–254). New York: ACM.
248 T. NAVARRETE AND K. J. BOROWIECKI