food consumption changes in ethiopia
TRANSCRIPT
ETHIOPIAN DEVELOPMENT RESEARCH INSTITUTE
Food consumption changes in Ethiopia
Mekdim Dereje IFPRI ESSP
Ethiopian Economics Association 13th International Conference on the Ethiopian EconomyJuly 23-25, 2015Addis Ababa
1
2
Introduction• Rapid changes in Ethiopia’s economy (Ethiopia one
of the fastest growing economies in the world)• Important increases in agricultural production in last
decade • Despite improvements in economy and in
agricultural production, still important nutritional problems in the country
• Purpose of the analysis: Explore patterns and changes in Ethiopia’s food economy, based on nationally representative data
Data
• Rely on the Ethiopian Household Consumption and Expenditure Survey (HICES) collected by CSA:
- Year 1995/96: 11,678 households- Year 1999/00: 17,320 households- Year 2004/05: 21,560 households- Year 2010/11: 27,831 households
• Use CSA’s retail price dataset for deflation of expenditures
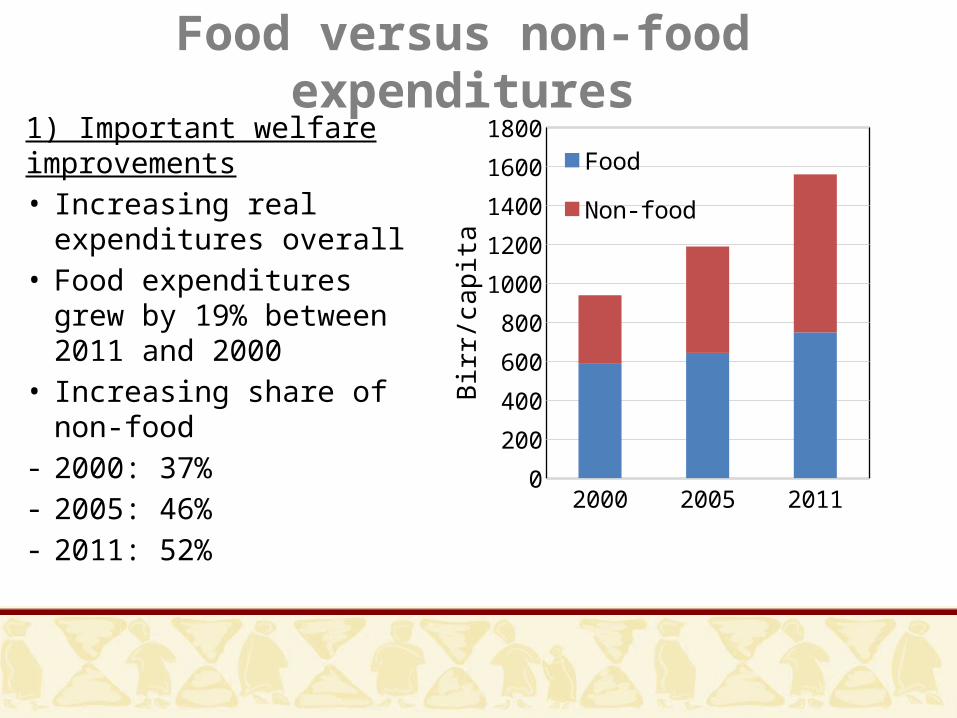
Food versus non-food expenditures1) Important welfare improvements• Increasing real expenditures
overall• Food expenditures grew by
19% between 2011 and 2000
• Increasing share of non-food- 2000: 37%- 2005: 46%- 2011: 52%
2000 2005 20110
200
400
600
800
1000
1200
1400
1600
1800Food
Non-food
Birr
/cap
ita
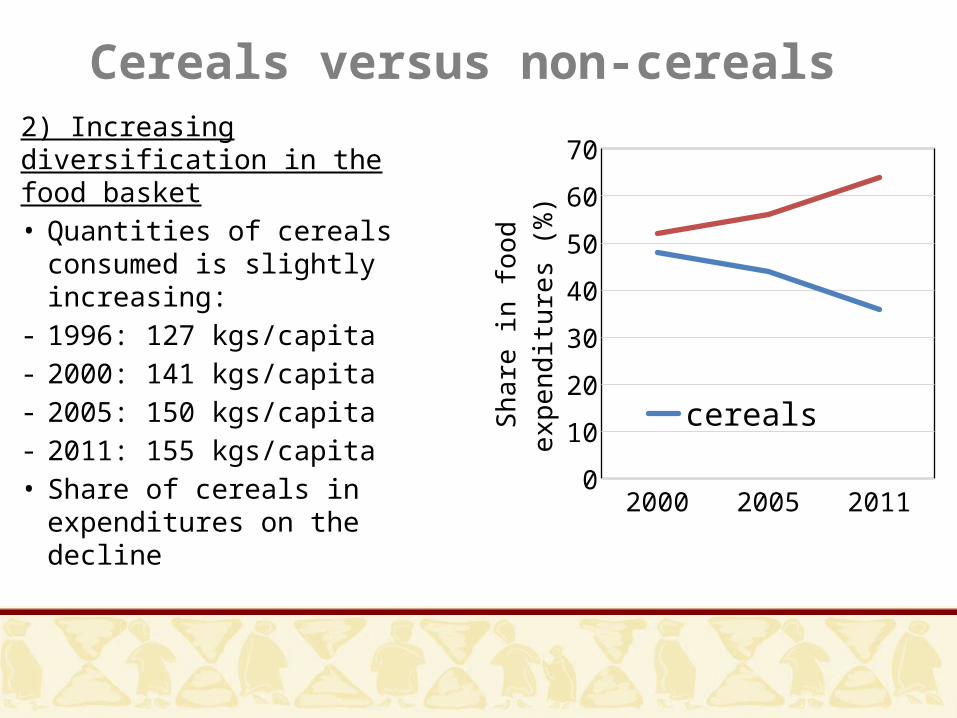
Cereals versus non-cereals2) Increasing diversification in the food basket• Quantities of cereals
consumed is slightly increasing:
- 1996: 127 kgs/capita- 2000: 141 kgs/capita- 2005: 150 kgs/capita- 2011: 155 kgs/capita• Share of cereals in
expenditures on the decline
2000 2005 20110
10
20
30
40
50
60
70
cereals non-cereals
Shar
e in
food
exp
endi
ture
s (%
)
Non-cereal foods
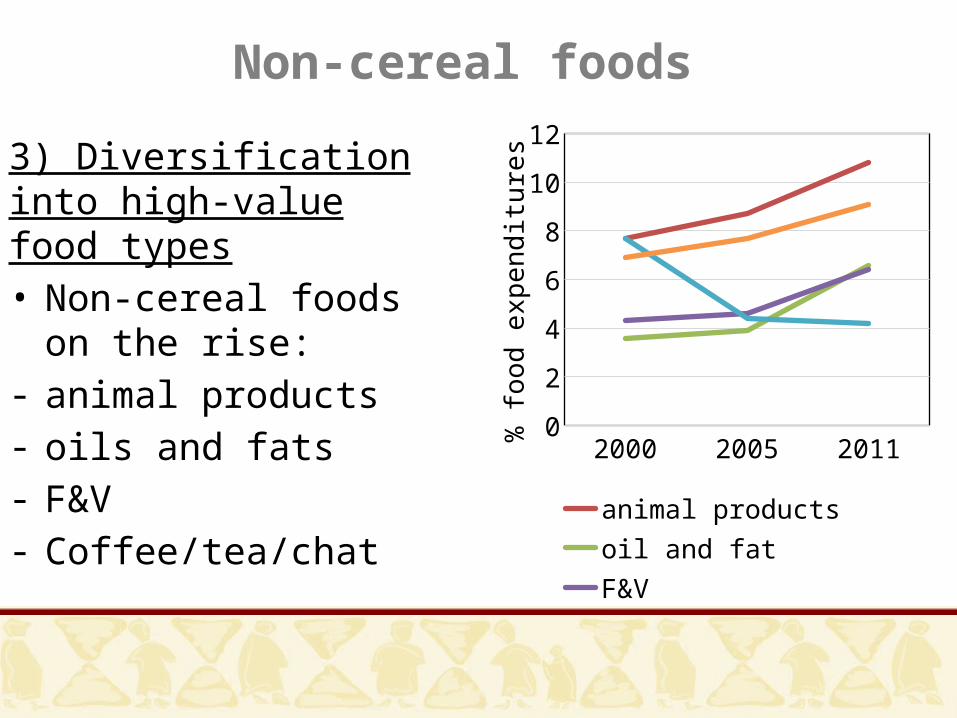
3) Diversification into high-value food types• Non-cereal foods on the
rise: - animal products- oils and fats - F&V - Coffee/tea/chat
2000 2005 20110
2
4
6
8
10
12
animal products oil and fatF&V enset/kochocoffee/tea/chat
% fo
od e
xpen
ditu
res
Cereals
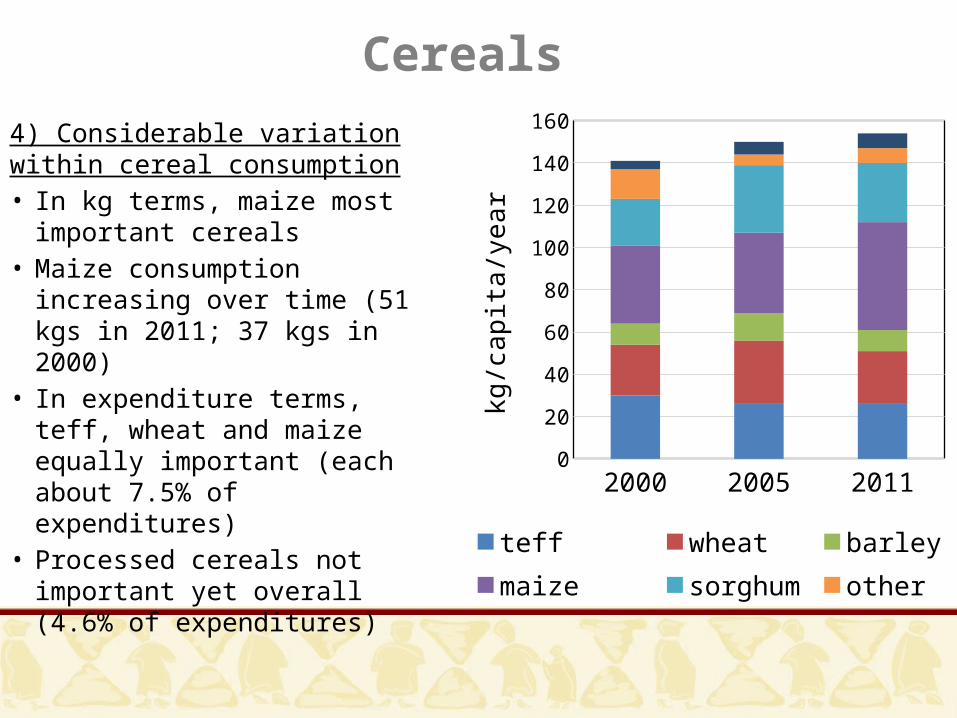
4) Considerable variation within cereal consumption• In kg terms, maize most
important cereals • Maize consumption increasing
over time (51 kgs in 2011; 37 kgs in 2000)
• In expenditure terms, teff, wheat and maize equally important (each about 7.5% of expenditures)
• Processed cereals not important yet overall (4.6% of expenditures)
2000 2005 20110
20
40
60
80
100
120
140
160
teff wheat barley maizesorghum other processed
kg/c
apita
/yea
r
Urban versus rural
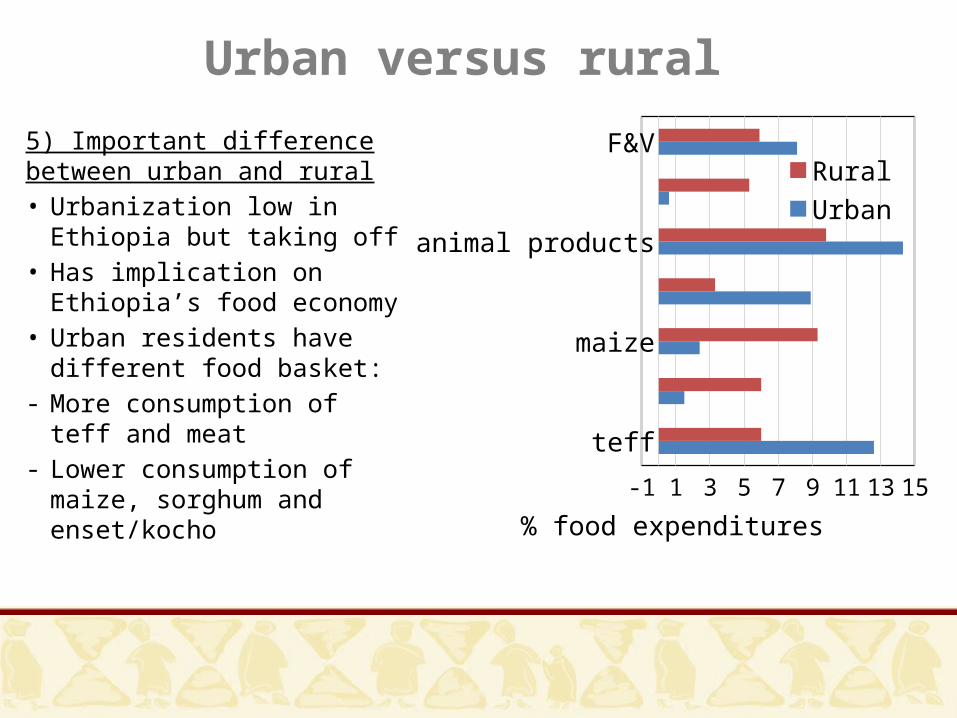
5) Important difference between urban and rural• Urbanization low in Ethiopia
but taking off• Has implication on Ethiopia’s
food economy• Urban residents have
different food basket:- More consumption of teff
and meat- Lower consumption of maize,
sorghum and enset/kocho
teff
sorghum
maize
processed cereals
animal products
enset/kocho
F&V
-1 1 3 5 7 9 11 13 15
RuralUrban
% food expenditures
Sources of food expenditures
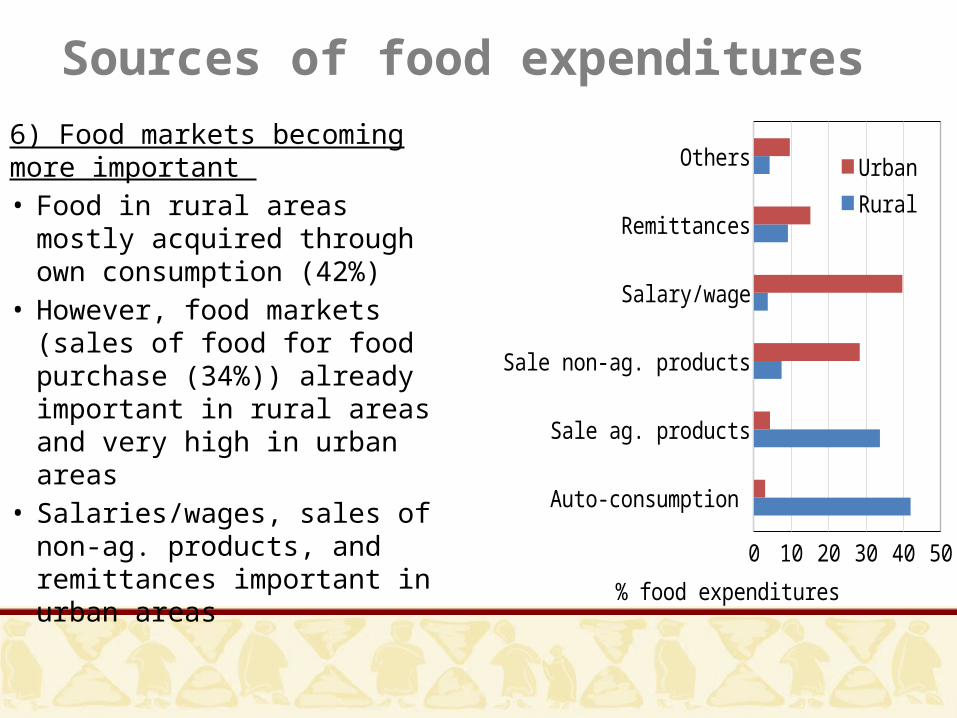
6) Food markets becoming more important • Food in rural areas mostly
acquired through own consumption (42%)
• However, food markets (sales of food for food purchase (34%)) already important in rural areas and very high in urban areas
• Salaries/wages, sales of non-ag. products, and remittances important in urban areas
Auto-consumption
Sale ag. products
Sale non-ag. products
Salary/wage
Remittances
Others
0 5 1015202530354045
UrbanRural
% food expenditures
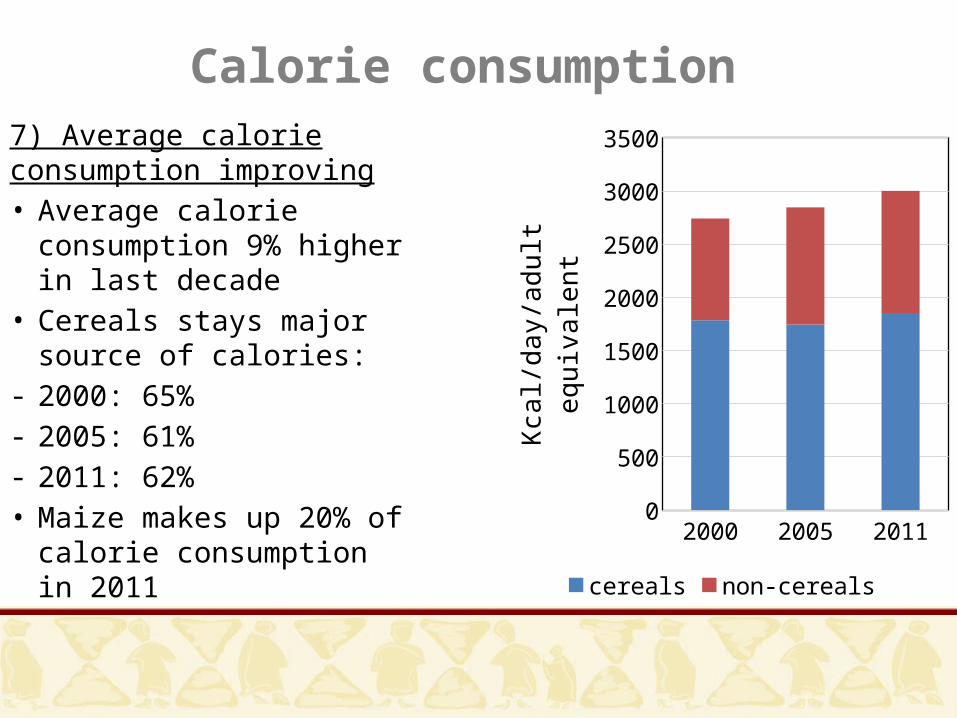
Calorie consumption7) Average calorie consumption improving• Average calorie
consumption 9% higher in last decade
• Cereals stays major source of calories:
- 2000: 65%- 2005: 61%- 2011: 62%• Maize makes up 20% of
calorie consumption in 2011
2000 2005 20110
500
1000
1500
2000
2500
3000
3500
cereals non-cereals
Kcal
/day
/adu
lt eq
uiva
lent
Calorie consumption
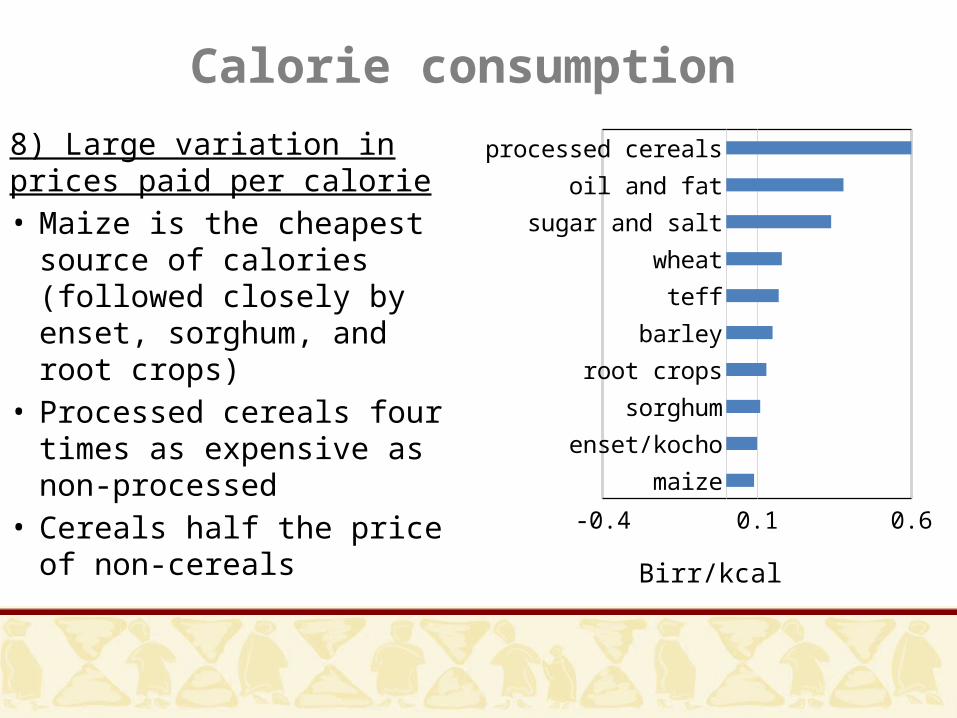
8) Large variation in prices paid per calorie • Maize is the cheapest
source of calories (followed closely by enset, sorghum, and root crops)
• Processed cereals four times as expensive as non-processed
• Cereals half the price of non-cereals
maize
enset/kocho
sorghum
root crops
barley
teff
wheat
sugar and salt
oil and fat
processed cereals
-0.4 0.1 0.6
Birr/kcal
Income and the share of food/cereals
Poorest q2 q3 q4 Richest0
10
20
30
40
50
60
70
80
2011 2005Shar
e of
food
in to
tal e
xp. (
%)
Poorest q2 q3 q4 richest0
10
20
30
40
50
60
70
80
2011 2005
Shar
e of
cer
eals
in fo
od e
xp. (
%)
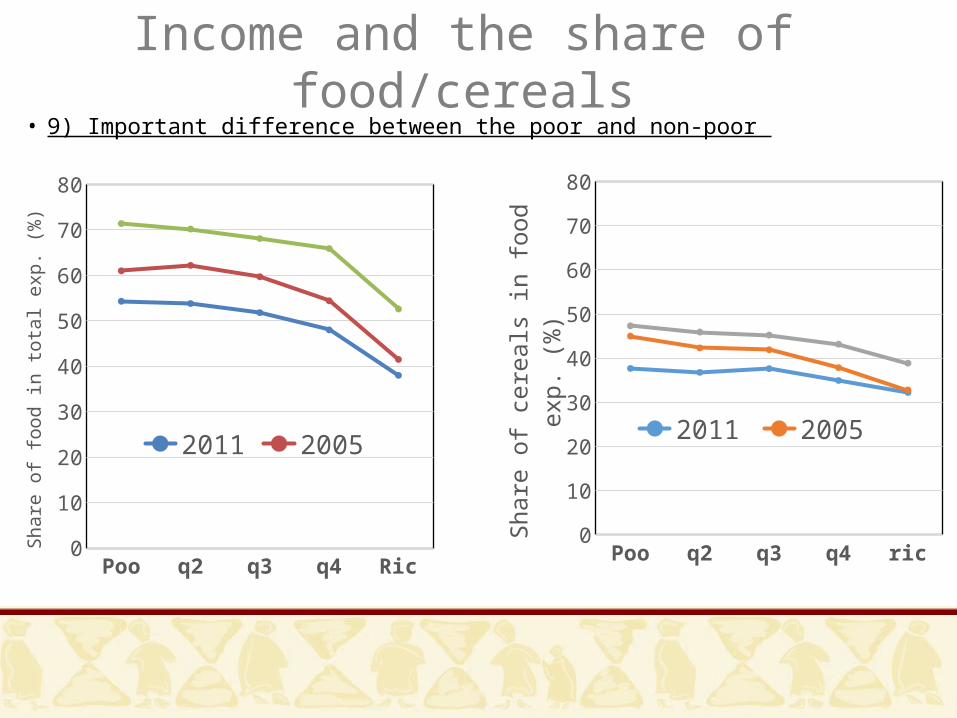
• 9) Important difference between the poor and non-poor
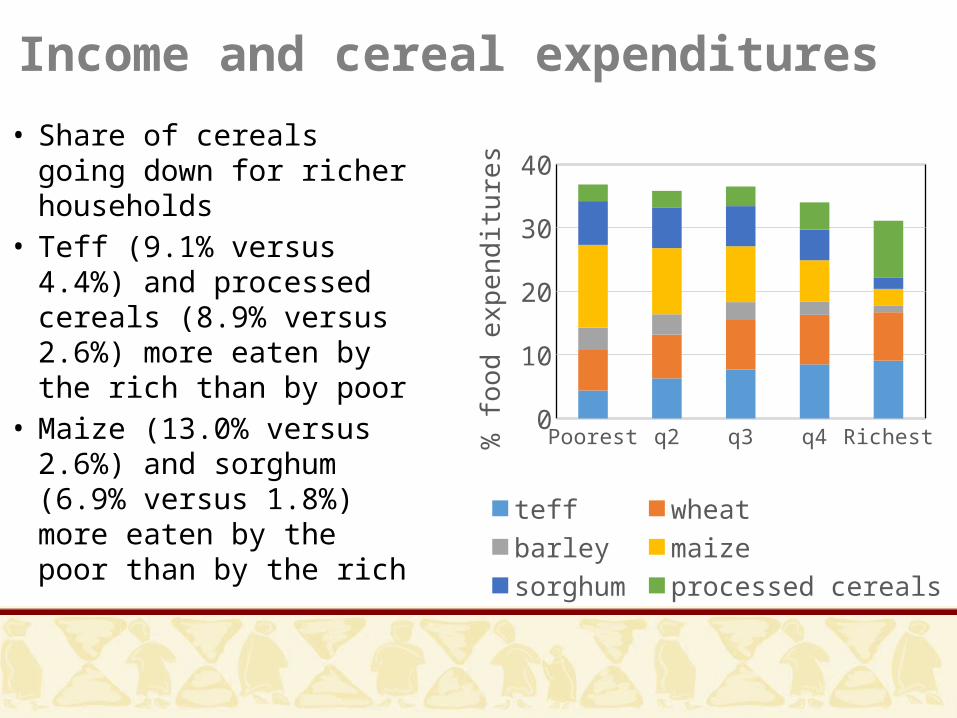
Income and cereal expenditures
• Share of cereals going down for richer households
• Teff (9.1% versus 4.4%) and processed cereals (8.9% versus 2.6%) more eaten by the rich than by poor
• Maize (13.0% versus 2.6%) and sorghum (6.9% versus 1.8%) more eaten by the poor than by the rich
Poorest q2 q3 q4 Richest05
10152025303540
teff wheat barley
maize sorghum processed cereals
% fo
od e
xpen
ditu
res
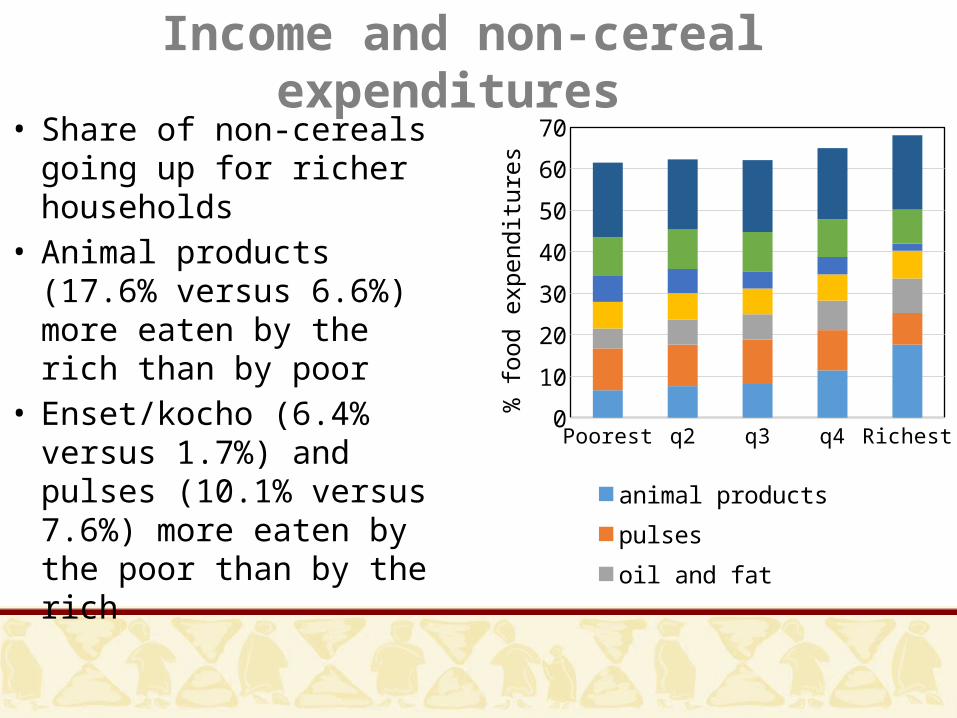
Income and non-cereal expenditures • Share of non-cereals
going up for richer households
• Animal products (17.6% versus 6.6%) more eaten by the rich than by poor
• Enset/kocho (6.4% versus 1.7%) and pulses (10.1% versus 7.6%) more eaten by the poor than by the rich
Poorest q2 q3 q4 Richest0
10
20
30
40
50
60
70
animal products pulsesoil and fat F&Venset/kocho coffee/tea/chatother
% fo
od e
xpen
ditu
res
Conclusions
• Important food diet transformation in the last decade:1/ Average quantity (+23%) and calorie (+9%) consumption has improved significantly 2/ Share of cereals in expenditures on the decline (43% in 2000; 35% in 2011)3/ Consumption of more expensive foods on the rise (animal foods; processed foods; coffee/tea/chat) • Large differences in food consumption by income levels
and between urban and rural populations
Conclusions• Implications:1/ Agricultural policy successful in promoting cereal productivity in the past; however, more demand for diversified foods; more emphasis required in the future on diversification in production2/ Agricultural markets play more important role in food economy; further stimulate these markets and better understand constraints in their functioning3/ While average improvements, part of the population no adequate diets; further continuation and strengthening of nutrition-sensitive safety nets required