changing consumer buying habits in developing...
TRANSCRIPT
Changing Consumer Buying Habits in Developing Countries:
A Disaggregate Demand Analysis for Fruits and Vegetables in Vietnam
Marcus Mergenthaler a,*, Matin Qaim a, Katinka Weinberger b
a Department of Agricultural Economics and Social Sciences (490b),
University of Hohenheim, 70593 Stuttgart, Germany.
b World Vegetable Center (AVRDC), Shanhua, Taiwan.
May 30, 2007
Selected Paper prepared for presentation at the American Agricultural Economics Asso-
ciation Annual Meeting, Portland, OR, July 29-August 1, 2007
Copyright 2007 by Marcus Mergenthaler, Matin Qaim and Katinka Weinberger. All rights
reserved. Readers may make verbatim copies of this document for non-commercial purposes
by any means, provided that this copyright notice appears on all such copies.
The authors would like to thank Olivier Ecker for constructive comments on earlier versions of this paper, and
Le Van To, Vu Manh Hai, Hoang Bang An, and Nguyen Thi Tan Loc for cooperation and assistance during
survey activities. The financial support of the German Ministry for Economic Cooperation and Development
(BMZ) and the German Agency for Technical Cooperation (GTZ) under Project No: 04.7860.2 – 001.00 is
gratefully acknowledged.
* Corresponding author: Phone: +49 711 459 22602; Fax: +49 711 459 23762,
E-mail: [email protected]
2
Changing Consumer Buying Habits in Developing Countries:
A Disaggregate Demand Analysis for Fruits and Vegetables in Vietnam
Abstract
Food systems in developing countries are currently undergoing a rapid transformation, with
important implications for local farmers, wholesalers, and retailers. While supply side as-
pects of this transformation have been analyzed previously, issues of consumer demand have
received much less attention. This paper analyzes changing consumption habits for fresh
fruits and vegetables in Vietnam, using household survey data and a demand systems ap-
proach. Demand for products from modern supply chains – particularly modern retailers and
non-traditional imports – is highly income elastic. Also, supermarket expansion impacts on
consumer demand. This implies a continued restructuring of the food sector in the further
process of economic development.
Keywords: transformation of food systems, supermarkets, food safety, non-traditional im-
ports, South-East Asia, Vietnam
JEL classification: D12, O12, Q13
Economic growth, international market integration, urbanization, and changing lifestyles are
associated with transformations in the food systems of developing countries. The increasing
role of modern retail outlets, food safety and quality standards, vertical market integration, and
international trade in high-value products characterize these changes (Pingali 2006). Different
authors have looked into the rise of supermarkets in developing countries (e.g. Reardon et al.
2003). The growing role of private food safety and quality standards was examined by Henson
and Reardon (2005) and Unnevehr (2000) highlighted the induced difficulties for devel-
3
oping countries in accessing export markets. Also, the analysis of contract agriculture in devel-
oping countries has received increasing attention, especially with a view to the small farm sec-
tor (e.g. Hernandez, Reardon, and Berdegue 2007; Swinnen 2007). However, in spite of the hy-
pothesized importance of both supply and demand side factors in the food system transforma-
tion, most of the available studies concentrate primarily on aspects of supply. Relatively little
empirical work so far has been dedicated to related issues of consumer demand.
Dietary changes have been observed on a global scale (Popkin 1999). Pingali (2007) describes
changing demand patterns towards a “westernization of diets” in developing countries as an
important driving force of the agrifood system transformation. Yet, these analyses remain at an
aggregate level and do not include determinants of household demand. At the household level,
changing buying patterns for broad food aggregates were explored by Huang and Bouis (2001)
for example. Consumer choices between different retail outlets in Argentina have been ana-
lyzed by Rodríguez et al. (2002). We are not aware of recent demand analyses in developing
countries that look specifically into household demand for food products from modern, high-
value supply chains with special quality and safety attributes. This is considered a research gap,
because knowledge about economic demand parameters is instructive for projections of future
trends. For instance, knowing the income elasticity of demand for products purchased in su-
permarkets, or for foods with formal safety declarations, could help supply chain actors to bet-
ter adjust to changing consumer preferences and buying habits in the process of economic de-
velopment.
Here, we address this gap through empirical analyses for Vietnam. In order to estimate disag-
gregated demand parameters for fresh fruits and vegetables with special supply chain related
attributes, we adapt an almost ideal demand system (AIDS). Traditional demand analyses gen-
4
erally produce demand parameters for highly aggregated food categories. Even when carried
out for individual food items, supply chain related attributes – such as place of purchase – are
usually not considered. Nor are standard databases suitable for such kind of disaggregation.
Living standard measurement surveys, which are available for many countries nowadays, pro-
vide representative data on expenditures and other household characteristics, but the analyst has
to live with predetermined product categories, which usually ignore existing product differen-
tiation (cf. Senauer 2006). Disaggregate product or process attributes of fruits and vegetables
considered in our context are (i) place of purchase, particularly considering modern retailers,
(ii) food safety indications, with an emphasis on formal labels, and (iii) region of production,
with a focus on non-traditional imports.
The analysis builds on a survey of 499 households that we conducted in Vietnam’s major met-
ropolitan areas in 2005. Given its rapid economic development and recent policy reforms, Viet-
nam is an interesting developing country to study details of the food system transformation.
Changing demand patterns and fast developments in the retail sector are observed in the context
of ongoing economic liberalization (Maruyama and Trung 2007). Against the background of
the recent accession to the World Trade Organization (WTO), Vietnam is considered to be
among the top-three most attractive destination countries for foreign direct investment in the
retail sector (ATKearney 2006). Retail sales in Vietnam grew at an average annual rate of 15%
between 1995 and 2005. The growth rates in the last few years reached almost 20% (GSO
2007).
The paper proceeds as follows: in section 2, the methodology and survey data used are briefly
described. Then, characteristics of emerging supply chains in Vietnam are illustrated in section
3, before the estimation results are presented and discussed in section 4. In section 5, demand
5
elasticities are derived, which are then used for projections of likely future market develop-
ments in section 6. The last section concludes and provides policy implications.
Methodology and Data
Demand model
For the estimation of demand parameters, we employ a two-stage budgeting framework. We
assume that consumers first allocate expenditures among non-food, away-from-home food, and
home food commodities. For the first budgeting stage, we employ an extended Working-Leser
Model to derive expenditure elasticities in the absence of price information. At the second
stage, the home food budget is allocated to different fresh and processed food items using an
AIDS. Our aggregate AIDS model consists of six food categories, viz. fresh fruits and vegeta-
bles, preserved fruits and vegetable products, rice, animal products, beverages and stimulants,
and other foods. In three different kinds of disaggregated models, the fresh fruits and vegeta-
bles group is replaced respectively by four sub-categories representing different supply chain
related attributes. Hence, each of the three disaggregated AIDS models consists of nine food
categories to be estimated at the second budgeting stage (see table 1).
(Table 1 here)
The AIDS was developed by Deaton and Muellbauer (1980) to estimate a complete set of de-
mand parameters. Pollak and Wales (1992) extended the AIDS demand functions by demo-
graphic translation to include socio-demographic variables. We apply the method proposed by
Cox and Wohlgenant (1986) to eliminate demand related price variation in the data, since only
supply related variation should be used for estimation. Furthermore, we use a two-stage
6
Heckman procedure to account for censoring and a potential sample selection bias.1 In the first
step, we model the decision to buy food of a certain category employing probit models. The
results are then used to calculate the inverse Mills’ ratio, which is included as an additional ex-
planatory variable in the second-step AIDS estimation.
Data
Between August and October 2005, we conducted an interview-based survey in Vietnam’s two
major cities, Hanoi and Ho Chi Minh City (HCMC). These two cities represent more than one-
third of all retail sales in Vietnam, which is three times higher than the corresponding popula-
tion shares. Also in other countries, urban centers are the places where the food system trans-
formation has been most rapid and visible in the recent past. The survey covered 499 house-
holds in almost all administrative districts of both cities, including urban and peri-urban areas.
The sample is a random sub-sample of the nationally representative Vietnam Living Standard
Survey 2002 (VLSS2002) for Hanoi and HCMC. Therefore, the sample does also cover house-
holds located in the suburbs and villages surrounding the inner city districts. These peri-urban
districts are characterized as more rural and thereby the sample represents a broad picture of
different types of consumers. Per capita expenditure levels for households in peri-urban dis-
tricts are around 40% lower, and the mean distance to the next supermarket is more than six
times higher than for households in urban districts.
The interviews were carried out with the primary food purchasers in the household. A standard-
ized questionnaire was used that covered all consumption expenditures and other household
characteristics. For fruits and vegetables consumed, detailed information about quantity, price,
safety declarations, place of purchase, and region of production was collected. The focus on
fresh fruits and vegetables was chosen, as they constitute high-value products for which food
7
safety and quality aspects receive increasing consumer attention (Figuié 2003). Furthermore,
they are characterized by limited economies of scale in production, so that they can potentially
play an important role in rural poverty reduction strategies (Weinberger and Lumpkin 2005). At
the wholesale and retail level, they are considered a strategic marketing instrument for modern
retailers. Competition between the traditional and the modern retail sector is fierce, as the mar-
ket share for fresh fruits and vegetables of modern retailers is often still lower than for other
product categories (Reardon et al. 2003).
Selected household characteristics, which are included in the regression models later on, are
shown in table 2. A comparison of some variables of our sample with the full sample of the
VLSS2002 for Hanoi and HCMC reveals that households in our sub-sample are slightly richer
and better educated; but otherwise, the values are very similar, which confirms the representa-
tiveness of our sample for the regions surveyed. Average annual per capita household expendi-
tures, which we use as a reliable measure of permanent incomes, amount to around 9.8 million
Vietnamese Dong (VND). This corresponds to 615 US Dollars, based on official exchange
rates and 2,960 US Dollars based on purchasing power parity in 2005. Education in years of
schooling of the respondent is included to take account of knowledge and awareness. Structural
differences between the two cities are indicated by the Hanoi dummy. Supermarket penetration
is captured by considering households’ distance to the nearest supermarket. Inclusion of an ur-
ban dummy in estimation can help to analyze the influence of urbanization trends on household
demand patterns. While there is correlation between the urban and distance-to-supermarket
variables, this does not cause a serious collinearity problem. Having both variables in the mod-
els is instructive to disentangle the urbanization and supermarket penetration effects, which are
related but not identical.
8
In addition to these socio-economic variables used in the AIDS estimation, additional
variables are included in the probit models. They are hypothesized to impact on the purchase
decisions but not on conditional demand. Hence, they function as exclusion restrictions. Female
labor force participation, often referred to as an important demand side driver of the food sys-
tem transformation, is included as a dummy. It takes the value of one if the respondent is fe-
male and if she is employed. Finally, car ownership could have an impact on consumers’ buy-
ing decisions for products from modern supply chains. This variable gives an indication of
transportation costs associated with purchases from different supply chains.
(Table 2 here)
Emerging Supply Chains in Vietnam
In metropolitan areas of Vietnam, annual per capita consumption of fresh fruits and vegetables
amounts to 149.7 kg on average. Consumed quantities are 23% lower in the poorest and 31%
higher in the richest expenditure quartile. Table 3 shows consumption and buying patterns and
the role of different supply chains. As outlined above, we use three examples of supply chain
related attributes to analyze changing buying habits in the food system transformation. These
are (i) place of purchase, particularly considering modern retailers, (ii) food safety indications,
with an emphasis on formal labels, and (iii) region of production, with a focus on imports.
(Table 3 here)
Modern retailers
Similar as in other developing countries, in Vietnam modern retailers, particularly supermar-
kets, are in a process of developing more specialized, more integrated, and shorter supply
9
chains for efficiency gains as well as improved food safety assurance (cf. Balsevich et al. 2003;
Cadilhon et al. 2006). This development is embedded in the government strategy to modernize
the country’s food system. Consequently, the number of supermarkets has been growing rap-
idly in metropolitan areas, and modern retailers are starting to extend their scope to smaller cit-
ies and towns. From the first supermarket that opened in 1993, the number grew to 104 in 2005
(ACNielsen 2007). This growth further continues: city administrations have already approved
licensing applications for further supermarket establishments of different formats (Moustier et
al. 2006a). In the development of the national retail market, local investors are increasingly
joined by multinational chains. Until 2007, foreign investors had to establish a joint venture
with a Vietnamese company if they wanted to be active in the country. As a result of the recent
accession to the WTO, capital limitations will be loosened in 2008, and market access will be
completely opened up in 2009. Despite the investments in modern retail formats, fresh horticul-
tural produce is still mainly bought in traditional retail outlets (Maruyama and Trung 2007).
According to our sample, modern retail outlets, including supermarkets and specialized vegeta-
ble shops particularly catering for upscale consumers, have currently a market share of 5.6%
for fresh fruits and vegetables.
Food safety
Due to the complexity and diversity of traditional supply chains, food safety monitoring has
become a challenging task in Vietnam. Problem awareness is high in the public. More than
90% of all households are conscious of reports on spoiled or contaminated fruits and vegetables
in the media, particularly television. A high percentage of more than 93% of consumers are
concerned about the safety of fresh fruits and vegetables. To minimize risk of exposure, con-
sumers mostly employ informal safety assurance measures for their supply of fresh fruits and
10
vegetables. This includes a thorough visual and olfactory inspection of the product at the place
of purchase or consumers’ trust to sellers. Nonetheless, there are also consumers that do not
utilize any indications of safety for a considerable amount of their fresh fruits and vegetable
purchases (18.3% of total quantities).
Slowly, formal safety assurance mechanisms have gained in importance. Already in 1995, the
Vietnamese government launched a ‘safe vegetables’ program (‘rau sach’ or ‘rau an toan’) to
counteract food safety problems in horticultural produce. In this context, the Ministry of Agri-
culture and Rural Development issued a temporary regulation on the production of ‘safe vege-
tables’, which adopted maximum residue levels from Codex Alimentarius as benchmark in
1998. Since then, the government has fostered the development of vegetable production with
improved food safety through the agricultural and rural development service. In cooperation
with local authorities, the ‘safe vegetable’ label is promoted in annual fairs for farmers and in
advertising programs for retailers and consumers.
Within the program, training and technical support is given to farmers to improve management
of irrigation water, fertilization, and application of pesticides. Produce is marketed through
specialized supply chains in a limited number of ‘safe vegetable’ shops and supermarkets. The
municipal health care service is meant to work closely with responsible agencies to regularly
control the quality and hygienic conditions in vegetable production and marketing. However,
quality controls are mostly organized internally in the cooperatives. Furthermore, awarding the
‘safe vegetable’ label is not authenticated by a standardized certification process, and no for-
malized sanction mechanisms exist in case of non-compliance (Moustier et al. 2006b). Labora-
tory analyses are hardly conducted or can detect only few types of pesticides (Tam 2005). A
lack of standard enforcement mechanisms enhances asymmetric information and distrust be-
11
tween producers and consumers (Hoan, Mergenthaler, and Breisinger 2005). Only 33% of the
respondents in our survey confirmed that they would trust the claims made by the ‘safe vegeta-
ble’ label. For privately labeled products, producers often cultivate under contract schemes and
follow tight technical specifications, or they receive other incentives to secure food safety. So
far, fruits and vegetables with formal food safety assurance are still a niche market in Vietnam.
Their current market share is 3.8% in metropolitan areas. Growth seems to be mainly hampered
by lax control, lack of sanction mechanisms, and a still limited supply at few retail outlets
(Hoang and Nakayasu 2006).
Imports
Imports occur for products which cannot be sourced at competitive prices, in required qualities,
or due to limited availability. Horticultural imports from China occur mainly in the off-season.
These imports are generally perceived as low quality by consumers in metropolitan Vietnam.
Imports from non-neighboring countries have started more recently through new, high-value
supply chains. These mostly involve temperate fruits not grown in Vietnam such as apples or
grapes, originating partly in industrialized countries like the US and New Zealand. The market
share of such non-traditional imports amounts to 1%. As table 3 indicates, the bulk of fresh
fruits and vegetables originate from domestic growing areas.
Estimation Results
For the estimation of demand parameters, a two-step procedure is employed, as described
above: in the first step, probit models on the decision to purchase are estimated, before the
AIDS models are run in the second step. As we are mainly interested in demand for fruits and

12
vegetables with different supply chain related attributes, only these results are reported here.2
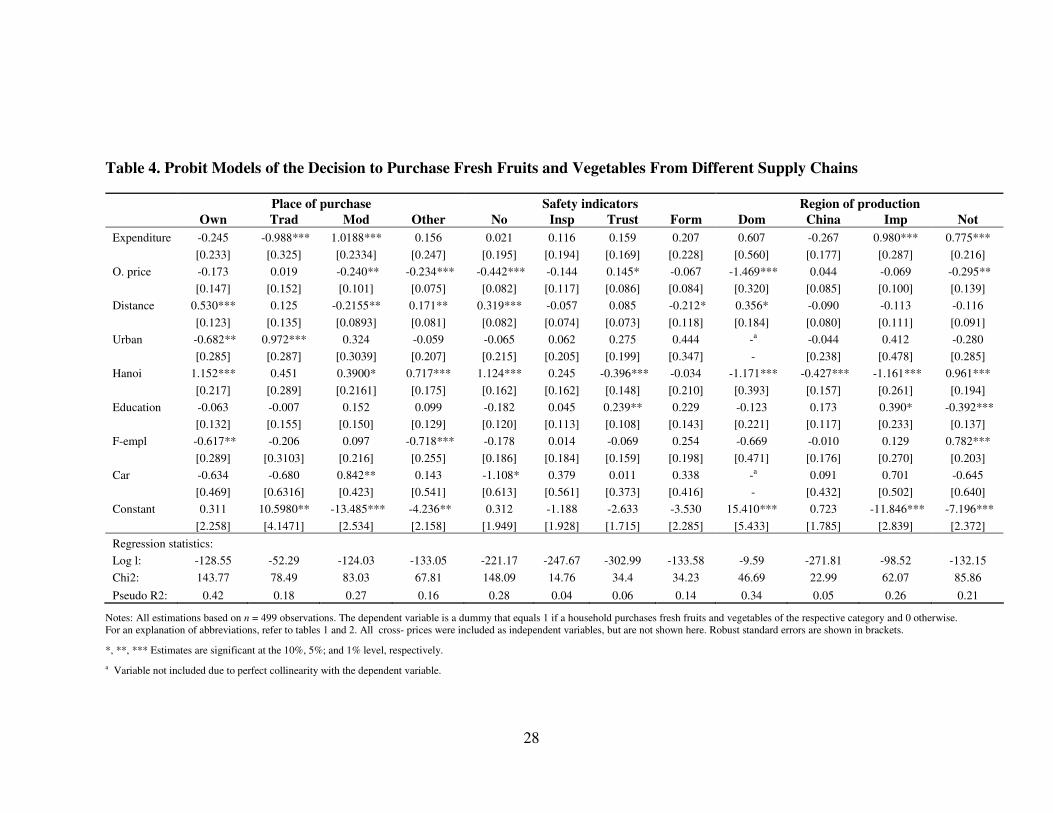
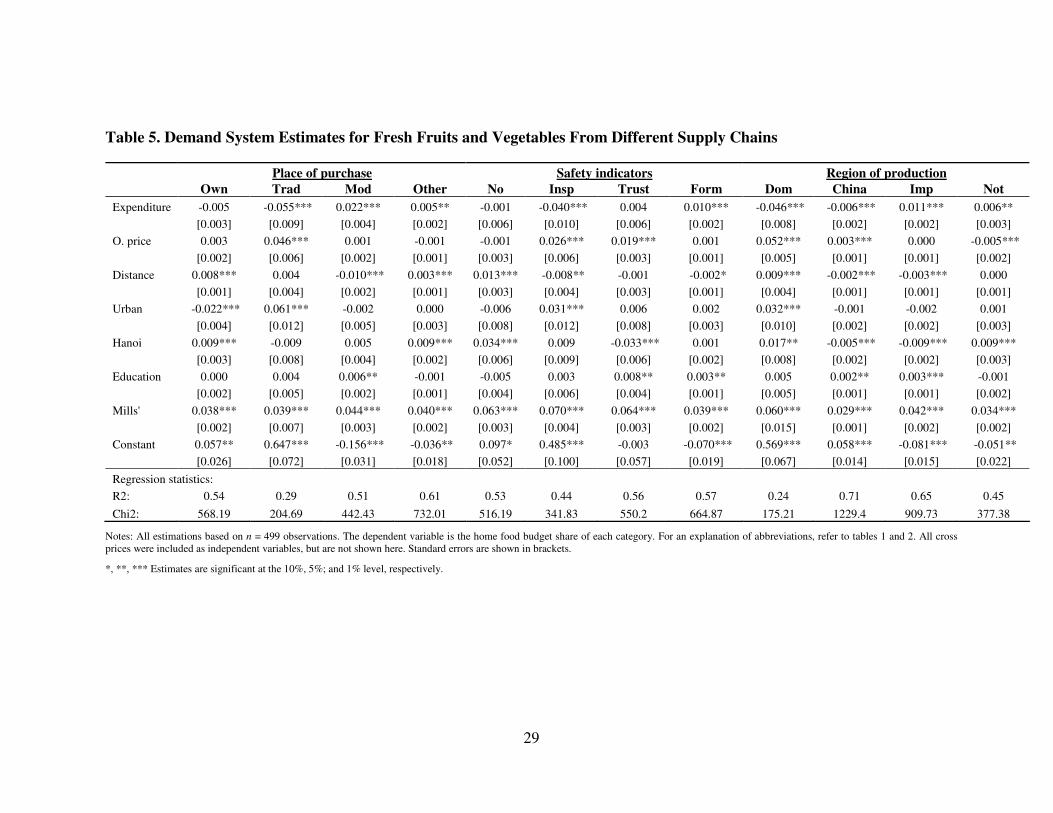
The probit models are significant in most cases according to the Chi-square test (table 4), and
the conditional demand equations according to an F-test for the system estimation (table 5).
The goodness-of-fit measures are fairly high in most cases, especially for the equations involv-
ing modern supply chains, indicating that the models have relatively good explanatory power.
The inverse Mills’ ratio is significant in all AIDS equations, confirming that a sample selection
bias would have been an issue without the Heckman procedure.
Expenditure and distance to the nearest supermarket are mostly significant in the probit and
AIDS models for modern supply chains. Own-prices are significant to a lesser degree. Urbani-
zation influences the shift from own production to purchases in traditional markets, but has no
significant impact on the decision to buy from modern supply chains. Therefore, consumer
buying habits towards products from modern supply chains are – ceteris paribus – rather trig-
gered by a higher supermarket penetration associated with the food system transformation than
by urbanization trends per se.
Differences between the two cities regarding modern supply chains are significant for imports
from non-neighboring countries. HCMC’s better international market access, partly through its
seaport, is probably an important factor in this connection. Education positively influences de-
mand for products from modern supply chains, reflecting higher safety concerns among better-
educated people. For non-traditional imports, education’s positive impact on demand also re-
sults from a greater familiarity with ‘exotic’ products. Female labor force participation does not
affect the decision to buy from modern supply chains, whereas car ownership increases the
probability to shop in modern retail outlets.
(Tables 4 and 5 here)

13
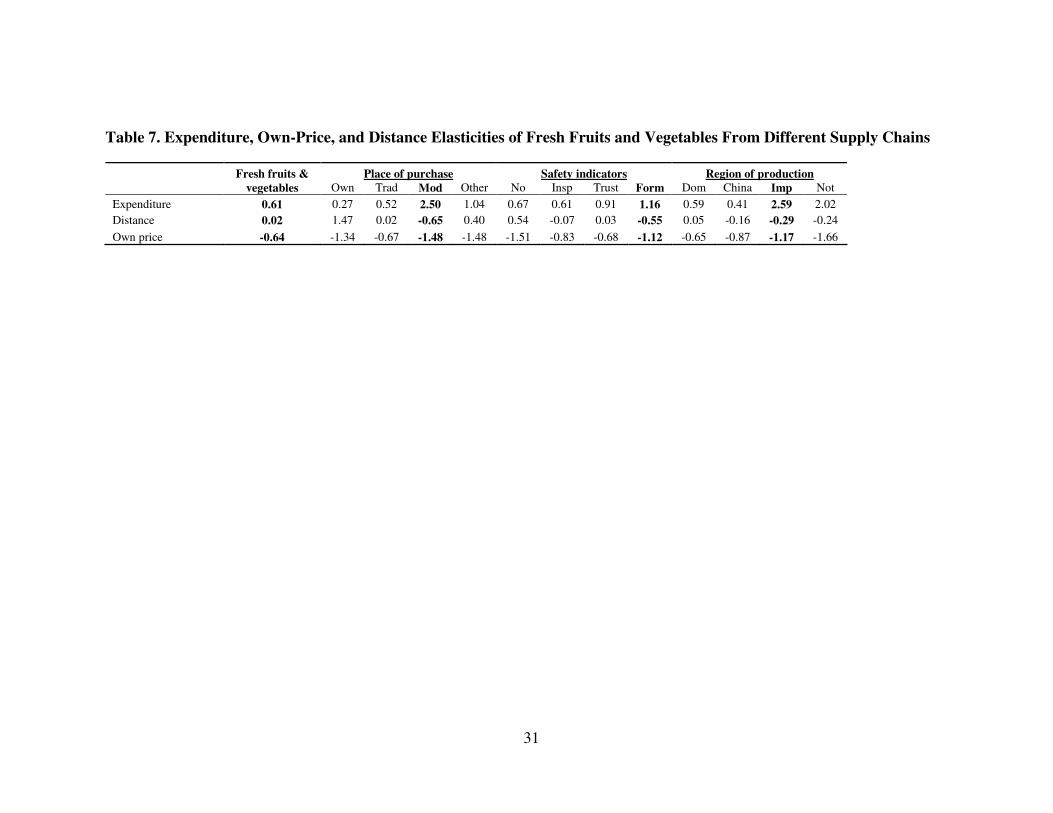
Demand Elasticities
To get a better understanding of the magnitude of different factors, demand elasticities are cal-
culated for total household expenditures, supermarket distance, and own-prices. In table 6, the
expenditure elasticities of the aggregated food categories are compared with previous estimates
for Vietnam and other countries in South-East Asia. Our elasticities reasonably fit into the
overall picture. It should be stressed that the other estimates refer to national populations as a
whole, while ours are confined to metropolitan areas, where households are somewhat richer
than in remote rural areas on average. Accordingly, our expenditure elasticity for rice (the basic
staple food) is lower, and those for higher-value products are somewhat higher.
(Table 6 here)
Expenditure elasticities
In growing economies, substantial future demand growth can be expected for food products
with high income or expenditure elasticities. Goods with high expenditure elasticities create
incentives for farmers and other supply chain actors to harness opportunities in these emerging
markets. However, expenditure elasticities for aggregated food groups can mask important het-
erogeneity that exists among individual food items or goods with different product and process
attributes. For instance, the aggregated expenditure elasticity for fresh fruits and vegetables in
metropolitan areas of Vietnam indicates a rise in consumption with increasing incomes, which
however will be under-proportional. Thus, the relative importance of the sector in the overall
economy is expected to shrink over time. While this might be true for the fruits and vegetable
sector as a whole, it is not true for high-value supply chains, as table 7 indicates. Disaggregated
14
expenditure elasticities for fresh fruits and vegetables from emerging supply chains are signifi-
cantly higher than the aggregate elasticity. This applies in particular for modern retailers and
non-traditional imports. Likewise, these elasticities are higher than the disaggregated elastic-
ities for products from traditional supply chains. Expenditure elasticities of greater than one
indicate that these are luxury goods, so demand is expected to rise substantially in the further
process of economic development.
(Table 7 here)
Distance and price elasticities
Actors in supply chains can stimulate demand by making their products available on a broader
basis. Modern retailers partially achieve this by increasing the penetration rate of their retail
outlets, that is, locating supermarkets in closer consumer proximity. In this way, supermarket
penetration induces local competition among retailers. As a consequence, not only supermar-
kets offer products from modern supply chains such as products with formal safety assurance.
Specialized vegetable shops have emerged that sell horticultural produce with the ‘safe vegeta-
ble’ label. Even in market stalls in the inner city districts, some retailers can be found that offer
fresh fruits and vegetables with formal labels. The same holds for non-traditional imports. The
fact that the modern supply chain categories in our context are neither identical nor mutually
exclusive is further highlighted by supermarkets’ procurement strategies due to their still lim-
ited supplier base: At times, they get their supply through similar supply chains as traditional
retailers (cf. Hoang and Nakayasu 2006).
The low distance elasticity for the aggregate fresh fruits and vegetables category shows that
supermarket penetration has hardly any impact on aggregate demand for fruits and vegetables
15
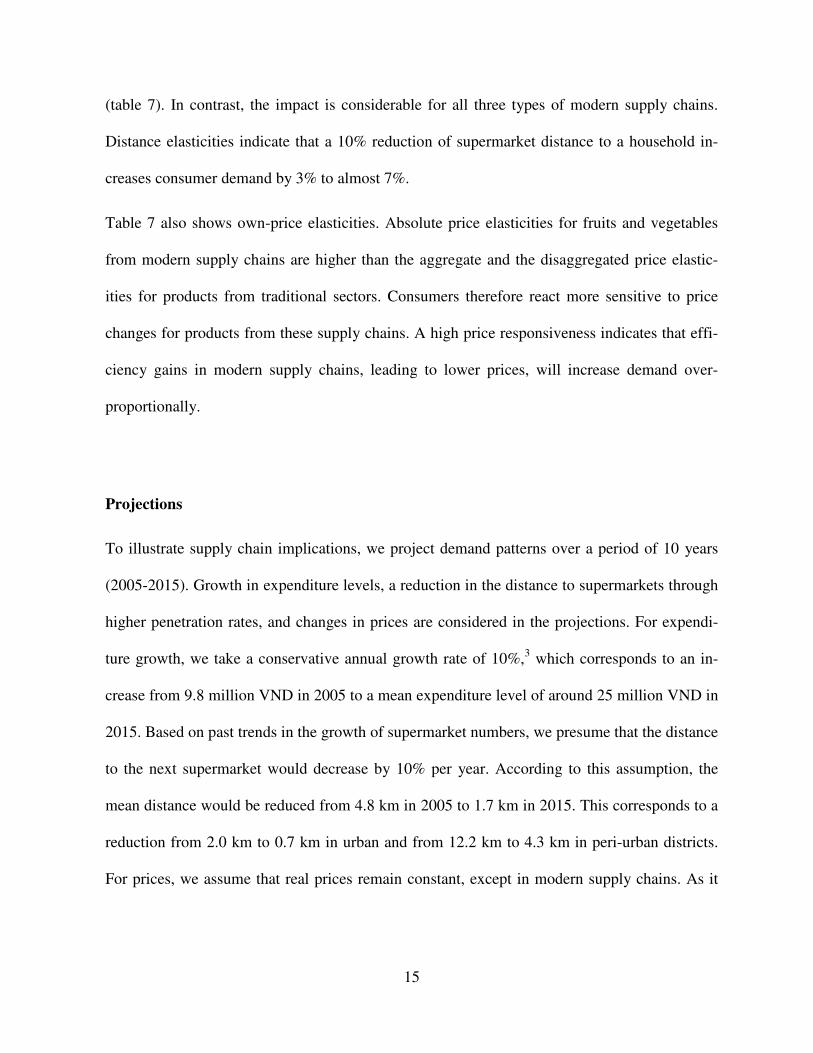
(table 7). In contrast, the impact is considerable for all three types of modern supply chains.
Distance elasticities indicate that a 10% reduction of supermarket distance to a household in-
creases consumer demand by 3% to almost 7%.
Table 7 also shows own-price elasticities. Absolute price elasticities for fruits and vegetables
from modern supply chains are higher than the aggregate and the disaggregated price elastic-
ities for products from traditional sectors. Consumers therefore react more sensitive to price
changes for products from these supply chains. A high price responsiveness indicates that effi-
ciency gains in modern supply chains, leading to lower prices, will increase demand over-
proportionally.
Projections
To illustrate supply chain implications, we project demand patterns over a period of 10 years
(2005-2015). Growth in expenditure levels, a reduction in the distance to supermarkets through
higher penetration rates, and changes in prices are considered in the projections. For expendi-
ture growth, we take a conservative annual growth rate of 10%,3 which corresponds to an in-
crease from 9.8 million VND in 2005 to a mean expenditure level of around 25 million VND in
2015. Based on past trends in the growth of supermarket numbers, we presume that the distance
to the next supermarket would decrease by 10% per year. According to this assumption, the
mean distance would be reduced from 4.8 km in 2005 to 1.7 km in 2015. This corresponds to a
reduction from 2.0 km to 0.7 km in urban and from 12.2 km to 4.3 km in peri-urban districts.
For prices, we assume that real prices remain constant, except in modern supply chains. As it
16
has been observed in other countries, it is expected that, due to efficiency gains, prices will be
reduced; we assume a 3% reduction per annum.
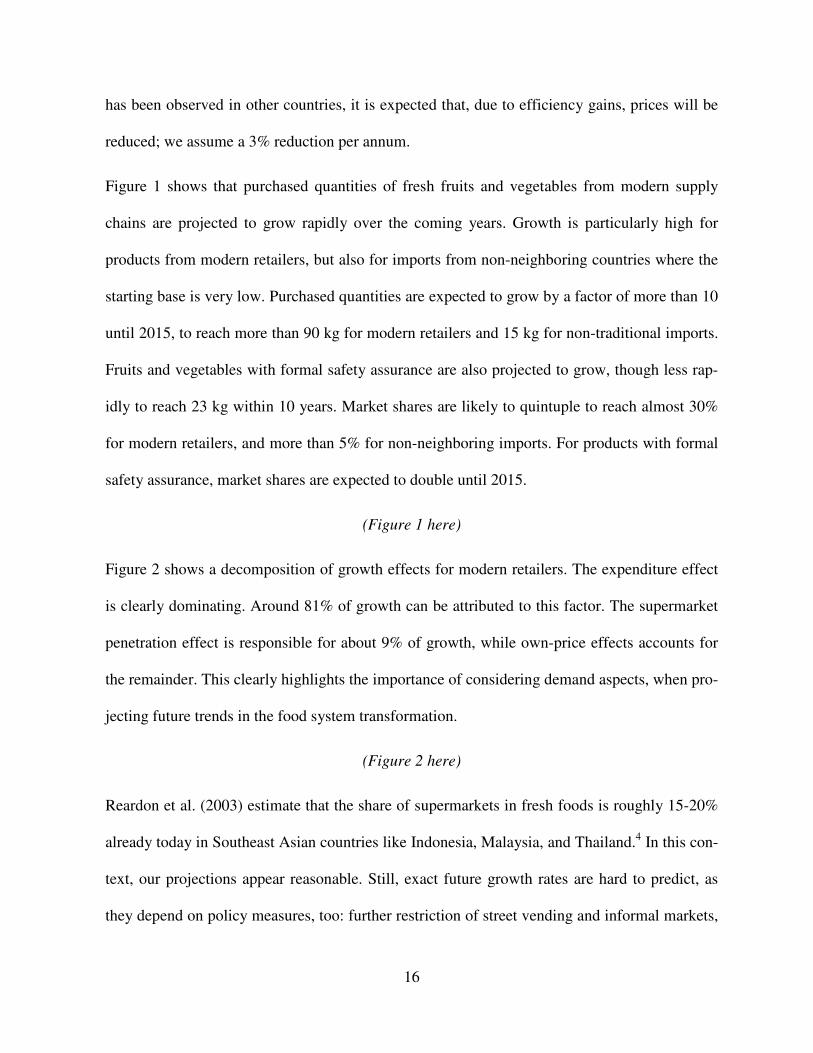
Figure 1 shows that purchased quantities of fresh fruits and vegetables from modern supply
chains are projected to grow rapidly over the coming years. Growth is particularly high for
products from modern retailers, but also for imports from non-neighboring countries where the
starting base is very low. Purchased quantities are expected to grow by a factor of more than 10
until 2015, to reach more than 90 kg for modern retailers and 15 kg for non-traditional imports.
Fruits and vegetables with formal safety assurance are also projected to grow, though less rap-
idly to reach 23 kg within 10 years. Market shares are likely to quintuple to reach almost 30%
for modern retailers, and more than 5% for non-neighboring imports. For products with formal
safety assurance, market shares are expected to double until 2015.
(Figure 1 here)
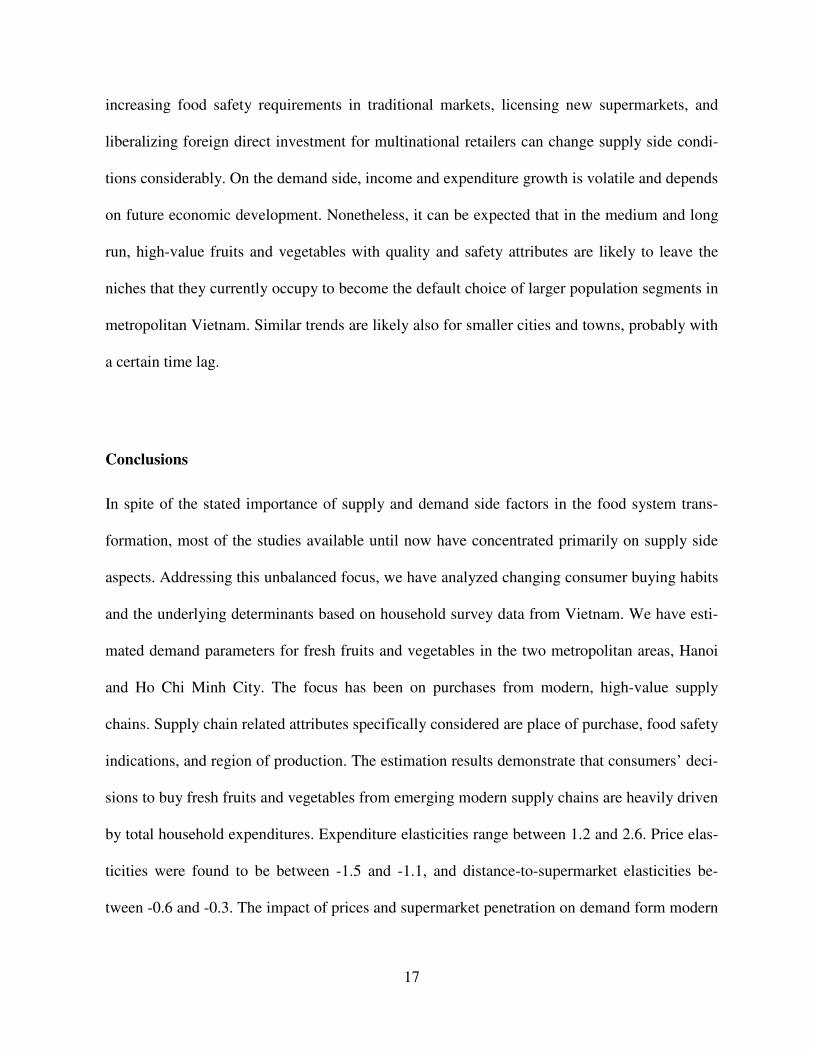
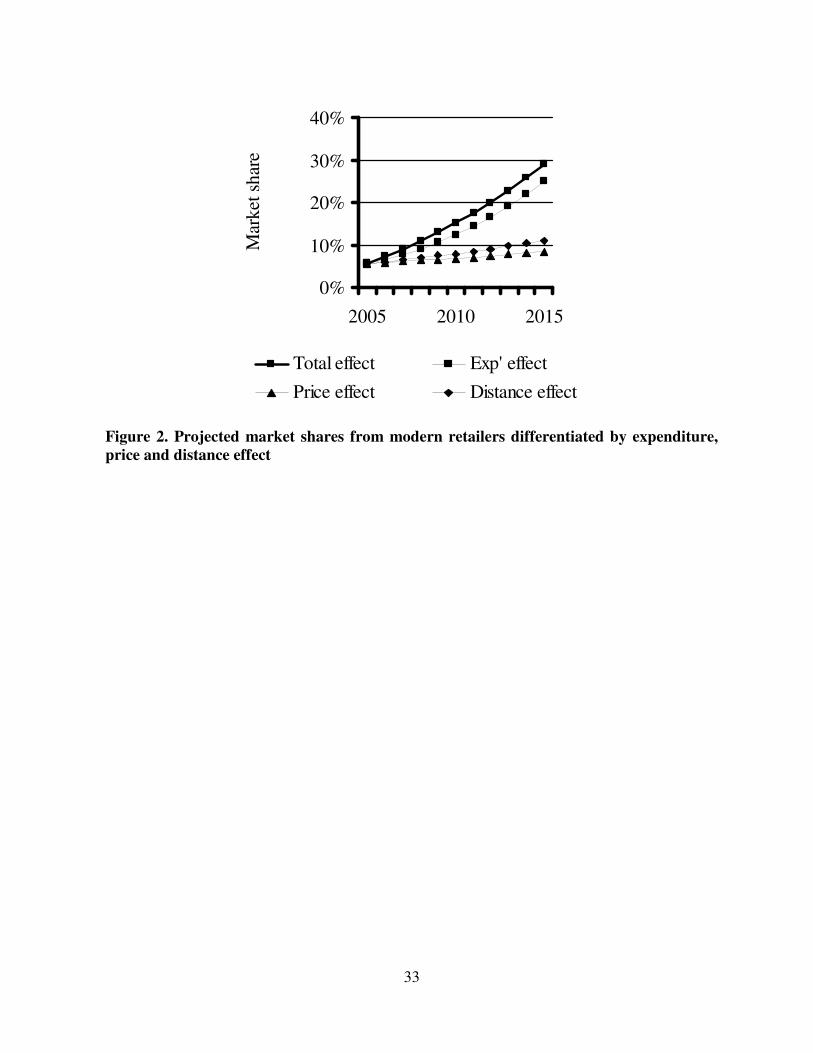
Figure 2 shows a decomposition of growth effects for modern retailers. The expenditure effect
is clearly dominating. Around 81% of growth can be attributed to this factor. The supermarket
penetration effect is responsible for about 9% of growth, while own-price effects accounts for
the remainder. This clearly highlights the importance of considering demand aspects, when pro-
jecting future trends in the food system transformation.
(Figure 2 here)
Reardon et al. (2003) estimate that the share of supermarkets in fresh foods is roughly 15-20%
already today in Southeast Asian countries like Indonesia, Malaysia, and Thailand.4 In this con-
text, our projections appear reasonable. Still, exact future growth rates are hard to predict, as
they depend on policy measures, too: further restriction of street vending and informal markets,
17
increasing food safety requirements in traditional markets, licensing new supermarkets, and
liberalizing foreign direct investment for multinational retailers can change supply side condi-
tions considerably. On the demand side, income and expenditure growth is volatile and depends
on future economic development. Nonetheless, it can be expected that in the medium and long
run, high-value fruits and vegetables with quality and safety attributes are likely to leave the
niches that they currently occupy to become the default choice of larger population segments in
metropolitan Vietnam. Similar trends are likely also for smaller cities and towns, probably with
a certain time lag.
Conclusions
In spite of the stated importance of supply and demand side factors in the food system trans-
formation, most of the studies available until now have concentrated primarily on supply side
aspects. Addressing this unbalanced focus, we have analyzed changing consumer buying habits
and the underlying determinants based on household survey data from Vietnam. We have esti-
mated demand parameters for fresh fruits and vegetables in the two metropolitan areas, Hanoi
and Ho Chi Minh City. The focus has been on purchases from modern, high-value supply
chains. Supply chain related attributes specifically considered are place of purchase, food safety
indications, and region of production. The estimation results demonstrate that consumers’ deci-
sions to buy fresh fruits and vegetables from emerging modern supply chains are heavily driven
by total household expenditures. Expenditure elasticities range between 1.2 and 2.6. Price elas-
ticities were found to be between -1.5 and -1.1, and distance-to-supermarket elasticities be-
tween -0.6 and -0.3. The impact of prices and supermarket penetration on demand form modern
18
retailers is lower than the expenditure effect. This clearly highlights the importance of consider-
ing demand aspects, when projecting future trends in the food system transformation.
Given that Vietnam is currently undergoing a rapid economic development – with incomes
growing fast and supermarkets reaching higher penetration rates – high-value supply chains
will rapidly gain market shares at the expense of more traditional sub-sectors. Though tradi-
tional horticultural and agricultural sectors are also projected to expand, growth rates will be
lower than for modern supply chains. The food and retail industry needs to adapt accordingly.
Traditional retailers could benefit by offering additional services to consumers. Safety labeled
fruits and vegetables could be an option. This will critically depend on improved command and
control systems to counteract consumers’ low levels of trust in these labels. As an alternative,
retailers could develop contract arrangements with preferred farmers, or farmers may possibly
establish special high-quality farmer markets. In both cases quality and safety standards can be
communicated face to face to consumers. Within such more direct links between producers and
final buyers, consumers’ trust to their preferred retailer can be substantiated. Traditional retail-
ers also could try to diversify their supply to include new products, like non-traditional imports.
Modern retailers, on the other hand, will further build on their high-quality reputation. In order
to meet high consumer expectations, they have to extend their dedicated supplier basis and cre-
ate integrated supply chains on a wider scale. If this continues to prove difficult in the domestic
market, horticultural produce will be increasingly sourced from abroad, which would further
fuel domestic competition with possible hardships for local agricultural producers.
Rising competition is a challenge, especially for the millions of small-scale farmers in Vietnam.
Although traditionally produced and marketed fruits and vegetables are also projected to grow
in absolute terms and will therefore continue to constitute a substantial market share, their rela-
19
tive importance will nevertheless shrink in the coming years. Farmers should actively try to get
involved in modern supply chains to profit from emerging market opportunities. This will
likely require new institutional mechanisms such as farmer groups or cooperatives to reduce
transaction costs and facilitate access to necessary knowledge and production technology.
Horizontal cooperation could also help farmers emerge as stronger and more attractive partners
in public or private sector out-grower schemes.
More research on changing demand patterns and buying habits in developing countries is nec-
essary to supplement the growing body of literature on analysis of supply side issues in the
rapid transformation of food systems. Only when both supply and demand side aspects are well
understood, can policies be designed to manage the transformation efficiently and equitably.
Our study is only an initial step in this direction.
20
1 Though this approach was put into question by Shonkwiler and Yen (1999), Tauchmann
(2005) has more recently shown that Heckman procedures are a good choice for practical ap-
plications.
2 The other estimation results can be made available upon request.
3 Based on the two rounds of the Vietnam Living Standard Survey in 2002 and 2004, average
annual income growth rates reached almost 14% in the two cities.
4 The current share of supermarkets in fresh products is 25-35% in South America, and around
10% in Central America (Berdegue et al. 2005), while it is still quite low in Sub-Saharan Af-
rica. In general, the share of supermarkets in developing countries is lower in fresh than in
processed foods (Reardon et al. 2003).
References
ACNielsen. 2007. "Asia-Pacific Retail and Shopper Trends 2006: the Latest on FMCG and
Shopper Retailing Trends Across Asia Pacific." ACNielsen, Hong Kong.
ATKearney. 2006. "Emerging Market Priorities for Global Retailers." The 2006 Global Retail
Development Index, A.T. Kearney, Inc., Chicago.
Balsevich, F., J. Berdegue, L. Flores, D. Mainville, and T. Reardon. 2003. "Supermarkets and
Produce Quality and Safety Standards in Latin America." American Journal of Agricul-
tural Economics 85(5):1147-1154.
Berdegue, J., F. Balsevich, L. Flores, and T. Reardon. 2005. "Central American Supermarkets'
Private Standards of Quality and Safety in Procurement of Fresh Fruits and Vegeta-
bles." Food Policy 30(3):254-269.
Cadilhon, J.J., P. Moustier, N.D. Poole, P.T.G. Tam, and A.P. Fearne. 2006. "Traditional Vs.
Modern Food Systems? Insights From Vegetable Supply Chains to Ho Chi Minh City
(Vietnam)." Development Policy Review 24(1):31-49.
Cox, T. and M.K. Wohlgenant. 1986. "Prices and Quality Effects in Cross-Sectional Demand
Analysis." American Journal of Agricultural Economics 68(4):908-921.
Deaton, A. and J. Muellbauer. 1980. "An Almost Ideal Demand System." American Economic
Review 70(3):312-327.
Figuié, M. 2003. "Vegetable Consumption Behaviour in Vietnam." Research report, Sustain-
able Development of Peri-Urban Agriculture in South East Asia (SUSPER), Hanoi.
22
GSO. 2007. "Retail Sales of Goods and Services at Current Prices by Province." General Statis-
tic Office, Hanoi.
Henson, S. and T. Reardon. 2005. "Private Agri-Food Standards: Implications for Food Policy
and the Agri-Food System." Food Policy 30(3):241-253.
Hernandez, R., T. Reardon, and J. Berdegue. 2007. "Supermarkets, Wholesalers, and Tomato
Growers in Guatemala." Agricultural Economics 36(3):281-290.
Hoan, N.T., Mergenthaler, M., and Breisinger, C. 2005. "Food Safety and Development: How
Effective Are Regulations?" Poster presented at Deutscher Tropentag, 11 - 13 October,
Hohenheim.
Hoang, H. and A. Nakayasu. 2006. "Study on the Factors Influencing the Consumption of Safe
Vegetables in Hochiminh City, Vietnam." Journal of Applied Sciences 6(9):1986-1992.
Huang, J. and H. Bouis. 2001. "Structural Changes in the Demand for Food in Asia: Empirical
Evidence From Taiwan." Agricultural Economics 26(1):57-69.
Maruyama, M. and L.V. Trung. 2007. "Supermarkets in Vietnam: Opportunities and Obsta-
cles." Asian Economic Journal 21(1):19-46.
Moustier, P., Anh, D.T., An, H.B., Binh, V.T., Figuié, M., Loc, N.T.T., and Tam, P.T.G.
2006a. "Supermarkets and the Poor in Viet Nam." Centre de coopération internationale
en recherche agronomique pour le développement (CIRAD) and Asian Development
Bank (ADB), Hanoi.
Moustier, P., M. Figuié, N.T.T. Loc, and H.T. Son. 2006b. "The Role of Coordination in the
Safe and Organic Vegetable Chains Supplying Hanoi." Acta Horticulturae 699:297-
306.
23
Pingali, P. 2006. "Agricultural Growth and Economic Development: a View Through the Glob-
alization Lens." Presidential Address, 26th Conference of the International Association
of Agricultural Economists, 12-18 August, Queensland.
---. 2007. "Westernization of Asian Diets and the Transformation of Food Systems: Implica-
tions for Research and Policy." Food Policy 32(3):281-298.
Pollak, R.A. and T.J. Wales. 1992. Demand System Specification and Estimation. Oxford: Uni-
versity Press.
Popkin, B.M. 1999. "Urbanization, Lifestyle Changes and the Nutrition Transition." World De-
velopment 27(11):1905-1916.
Reardon, T., C.P. Timmer, C.B. Barrett, and J. Berdegue. 2003. "The Rise of Supermarkets in
Africa, Asia, and Latin America." American Journal of Agricultural Economics
85(5):1140-1146.
Rodriguez, E., M. Berges, K. Casellas, R.D. Paola, B. Lupin, L. Garrido, and N. Gentile. 2002.
"Consumer Behaviour and Supermarkets in Argentina." Development Policy Review
20(4):429-439.
Seale, J., Regmi, A., and Bernstein, J. 2003. "International Evidence on Food Consumption
Patterns." Technical Bulletin Number 1904CY, United States Department of Agricul-
ture (USDA) and Economic Research Service (ERS), Washington DC.
Senauer, B. 2006. "The Growing Market for High-Value Food Products in Developing and
Transition Countries." Journal of Food Distribution Research 37(1):22-27.
Shonkwiler, J.S. and S.T. Yen. 1999. "Two-Step Estimation of a Censored System of Equa-
tions." American Journal of Agricultural Economics 81(4):973-983.
24
Swinnen, J.F.M. 2007. Global Supply Chains, Standards and the Poor: How the Globalization
of Food Systems and Standards Affects Rural Development and Poverty. Wallingford:
CABI Publishing.
Tam, P.T.G. 2005. "Food Quality and Safety Issues in the Fresh Produce Production and Mar-
keting Chain: the Case of Cabbage in Viet Nam." Paper presented at a workshop, 7-10
November, Association of Food Marketing Agencies in Asia and the Pacific (AFMA)
and Food and Agricultural Organization of the United Nations (FAO), Bangkok.
Tauchmann, H. 2005. "Efficiency of Two-Step Estimators for Censored Systems of Equations:
Shonkwiler and Yen Reconsidered." Applied Economics 37(4):367-374.
Unnevehr, L.J. 2000. "Food Safety Issues and Fresh Food Product Exports From LDCs." Agri-
cultural Economics 23(3):231-240.
Weinberger, K. and Lumpkin, T.A. 2005. "Horticulture for Poverty Alleviation: the Unfunded
Revolution." Working Paper No. 15, The World Vegetable Center (AVRDC), Shanua.

25
Tables and Figures
Table 1. Expenditure Categories With Their Respective Budget Shares
Basic categories Budget
share
Supply chain related attributes in the disag-
gregated models replacing the aggregate:
Abbreviation Budget
share
First budgeting stage Own production (Own) 0.7%
Non-food 41.5% Traditional retailing (Trad) 8.4%
Away-from-home food 12.9% Modern retail outlets (Mod) 0.5%
Home food 45.7%
Place of
purchase
Other sources (Other) 0.4%
Second budgeting stage 10.1%
Other food 5.0% or
Beverages and stimulants 3.3% No concerns or no measures (No) 1.9%
Animal products 21.3% Inspection at purchase (Insp) 6.0%
Rice 5.5% Trust to seller (Trust) 1.9%
Preserved fruits and vegetables 0.5%
Safety
assurance
Formal safety assurance (Form) 0.3%
Fresh fruits and vegetables 10.1% 10.1%
45.7% or
Domestic production (Dom) 8.9%
Imports from China (China) 0.6%
Non-traditional imports (Imp) 0.3%
Region of
production
Not specified (Not) 0.4%
10.1%
26
Table 2. Variable Definitions and Sample Statistics Compared to VLSS2002 Data
Variable Description Own survey VLSS2002
Expenditure Annual per capita expenditure (million VND) 9.76 [6.43] 9.20 [6.08]
Distance Distance to the next supermarket (km) 4.77 [7.21] -
Education Years of schooling 8.67 [4.48] -
Household head with 12 years of schooling or more 38.5% 35.3%
F-empl Food purchaser is female and employed 21.1% -
Car Car owning households 2.7% 1.0%
Urban Households in urban areas 73.0% 73.8%
Hanoi Households in Hanoi 36.7% 36.2%
Notes: The table shows mean values and standard deviations in brackets. Expenditure data from the VLSS2002 was adjusted by the
official consumer price index.
27
Table 3. Average Per Capita Consumption (kg/year) of Fresh Fruits and Vegetables by Supply Chain
Product attributes of fresh fruits and vegetables All Poorest
quartile
Richest
quartile
Own production 12.9 25.8 4.6
Traditional retailing 124.2 85.0 165.6
Modern retail outlets 8.4 0.4 22.1
Place of
purchase
Other sources 4.2 3.6 4.2
No concerns or no measures 27.5 39.7 21.9
Inspection at purchase 85.4 57.1 108.4
Trust to seller 31.2 16.3 52.8
Safety
assurance
Formal safety assurance 5.7 1.7 13.3
Domestic production 139.4 109.2 178.4
Imports from China 4.7 3.0 7.1
Imports from non-neighboring countries 1.4 0.0 4.6
Region of
production
Not specified 4.2 2.6 6.4
All 149.7 114.8 196.5
28
Table 4. Probit Models of the Decision to Purchase Fresh Fruits and Vegetables From Different Supply Chains
Place of purchase Safety indicators Region of production
Own Trad Mod Other No Insp Trust Form Dom China Imp Not
Expenditure -0.245 -0.988*** 1.0188*** 0.156 0.021 0.116 0.159 0.207 0.607 -0.267 0.980*** 0.775***
[0.233] [0.325] [0.2334] [0.247] [0.195] [0.194] [0.169] [0.228] [0.560] [0.177] [0.287] [0.216]
O. price -0.173 0.019 -0.240** -0.234*** -0.442*** -0.144 0.145* -0.067 -1.469*** 0.044 -0.069 -0.295**
[0.147] [0.152] [0.101] [0.075] [0.082] [0.117] [0.086] [0.084] [0.320] [0.085] [0.100] [0.139]
Distance 0.530*** 0.125 -0.2155** 0.171** 0.319*** -0.057 0.085 -0.212* 0.356* -0.090 -0.113 -0.116
[0.123] [0.135] [0.0893] [0.081] [0.082] [0.074] [0.073] [0.118] [0.184] [0.080] [0.111] [0.091]
Urban -0.682** 0.972*** 0.324 -0.059 -0.065 0.062 0.275 0.444 -a -0.044 0.412 -0.280
[0.285] [0.287] [0.3039] [0.207] [0.215] [0.205] [0.199] [0.347] - [0.238] [0.478] [0.285]
Hanoi 1.152*** 0.451 0.3900* 0.717*** 1.124*** 0.245 -0.396*** -0.034 -1.171*** -0.427*** -1.161*** 0.961***
[0.217] [0.289] [0.2161] [0.175] [0.162] [0.162] [0.148] [0.210] [0.393] [0.157] [0.261] [0.194]
Education -0.063 -0.007 0.152 0.099 -0.182 0.045 0.239** 0.229 -0.123 0.173 0.390* -0.392***
[0.132] [0.155] [0.150] [0.129] [0.120] [0.113] [0.108] [0.143] [0.221] [0.117] [0.233] [0.137]
F-empl -0.617** -0.206 0.097 -0.718*** -0.178 0.014 -0.069 0.254 -0.669 -0.010 0.129 0.782***
[0.289] [0.3103] [0.216] [0.255] [0.186] [0.184] [0.159] [0.198] [0.471] [0.176] [0.270] [0.203]
Car -0.634 -0.680 0.842** 0.143 -1.108* 0.379 0.011 0.338 -a 0.091 0.701 -0.645
[0.469] [0.6316] [0.423] [0.541] [0.613] [0.561] [0.373] [0.416] - [0.432] [0.502] [0.640]
Constant 0.311 10.5980** -13.485*** -4.236** 0.312 -1.188 -2.633 -3.530 15.410*** 0.723 -11.846*** -7.196***
[2.258] [4.1471] [2.534] [2.158] [1.949] [1.928] [1.715] [2.285] [5.433] [1.785] [2.839] [2.372]
Regression statistics:
Log l: -128.55 -52.29 -124.03 -133.05 -221.17 -247.67 -302.99 -133.58 -9.59 -271.81 -98.52 -132.15
Chi2: 143.77 78.49 83.03 67.81 148.09 14.76 34.4 34.23 46.69 22.99 62.07 85.86
Pseudo R2: 0.42 0.18 0.27 0.16 0.28 0.04 0.06 0.14 0.34 0.05 0.26 0.21
Notes: All estimations based on n = 499 observations. The dependent variable is a dummy that equals 1 if a household purchases fresh fruits and vegetables of the respective category and 0 otherwise.
For an explanation of abbreviations, refer to tables 1 and 2. All cross- prices were included as independent variables, but are not shown here. Robust standard errors are shown in brackets.
*, **, *** Estimates are significant at the 10%, 5%; and 1% level, respectively.
a Variable not included due to perfect collinearity with the dependent variable.
29
Table 5. Demand System Estimates for Fresh Fruits and Vegetables From Different Supply Chains
Place of purchase Safety indicators Region of production
Own Trad Mod Other No Insp Trust Form Dom China Imp Not
Expenditure -0.005 -0.055*** 0.022*** 0.005** -0.001 -0.040*** 0.004 0.010*** -0.046*** -0.006*** 0.011*** 0.006**
[0.003] [0.009] [0.004] [0.002] [0.006] [0.010] [0.006] [0.002] [0.008] [0.002] [0.002] [0.003]
O. price 0.003 0.046*** 0.001 -0.001 -0.001 0.026*** 0.019*** 0.001 0.052*** 0.003*** 0.000 -0.005***
[0.002] [0.006] [0.002] [0.001] [0.003] [0.006] [0.003] [0.001] [0.005] [0.001] [0.001] [0.002]
Distance 0.008*** 0.004 -0.010*** 0.003*** 0.013*** -0.008** -0.001 -0.002* 0.009*** -0.002*** -0.003*** 0.000
[0.001] [0.004] [0.002] [0.001] [0.003] [0.004] [0.003] [0.001] [0.004] [0.001] [0.001] [0.001]
Urban -0.022*** 0.061*** -0.002 0.000 -0.006 0.031*** 0.006 0.002 0.032*** -0.001 -0.002 0.001
[0.004] [0.012] [0.005] [0.003] [0.008] [0.012] [0.008] [0.003] [0.010] [0.002] [0.002] [0.003]
Hanoi 0.009*** -0.009 0.005 0.009*** 0.034*** 0.009 -0.033*** 0.001 0.017** -0.005*** -0.009*** 0.009***
[0.003] [0.008] [0.004] [0.002] [0.006] [0.009] [0.006] [0.002] [0.008] [0.002] [0.002] [0.003]
Education 0.000 0.004 0.006** -0.001 -0.005 0.003 0.008** 0.003** 0.005 0.002** 0.003*** -0.001
[0.002] [0.005] [0.002] [0.001] [0.004] [0.006] [0.004] [0.001] [0.005] [0.001] [0.001] [0.002]
Mills' 0.038*** 0.039*** 0.044*** 0.040*** 0.063*** 0.070*** 0.064*** 0.039*** 0.060*** 0.029*** 0.042*** 0.034***
[0.002] [0.007] [0.003] [0.002] [0.003] [0.004] [0.003] [0.002] [0.015] [0.001] [0.002] [0.002]
Constant 0.057** 0.647*** -0.156*** -0.036** 0.097* 0.485*** -0.003 -0.070*** 0.569*** 0.058*** -0.081*** -0.051**
[0.026] [0.072] [0.031] [0.018] [0.052] [0.100] [0.057] [0.019] [0.067] [0.014] [0.015] [0.022]
Regression statistics:
R2: 0.54 0.29 0.51 0.61 0.53 0.44 0.56 0.57 0.24 0.71 0.65 0.45
Chi2: 568.19 204.69 442.43 732.01 516.19 341.83 550.2 664.87 175.21 1229.4 909.73 377.38
Notes: All estimations based on n = 499 observations. The dependent variable is the home food budget share of each category. For an explanation of abbreviations, refer to tables 1 and 2. All cross
prices were included as independent variables, but are not shown here. Standard errors are shown in brackets.
*, **, *** Estimates are significant at the 10%, 5%; and 1% level, respectively.

30
Table 6. Comparison of Income (Expenditure) Elasticities for Major Food Groups
Indonesia Philippines Thailand Vietnam Hanoi & HCMC
Beverages & tobacco 0.91 0.89 0.92 1.10 1.15 Beverages & stimulants
Breads & cereals 0.38 0.39 0.43 0.51 0.28 Rice
Fish 0.81 0.78 0.79 0.90 0.93 Animal products
Meat 0.73 0.70 0.70 0.78
Dairy 0.78 0.75 0.75 0.86
Fats& oils 0.42 0.42 0.45 0.53
Fruits& vegetables 0.58 0.56 0.56 0.64 0.61 Fresh fruits & vegetables
1.27 Preserved fruits & vegetables
Other foods 0.73 0.70 0.69 0.78 0.67 Other foods
Source: Figures for Indonesia, the Philippines, Thailand and Vietnam are taken from Seale, Regmi and Bernstein (2003). Figures
for Hanoi & HCMC are from own calculations.
31
Table 7. Expenditure, Own-Price, and Distance Elasticities of Fresh Fruits and Vegetables From Different Supply Chains
Fresh fruits & Place of purchase Safety indicators Region of production
vegetables Own Trad Mod Other No Insp Trust Form Dom China Imp Not
Expenditure 0.61 0.27 0.52 2.50 1.04 0.67 0.61 0.91 1.16 0.59 0.41 2.59 2.02
Distance 0.02 1.47 0.02 -0.65 0.40 0.54 -0.07 0.03 -0.55 0.05 -0.16 -0.29 -0.24
Own price -0.64 -1.34 -0.67 -1.48 -1.48 -1.51 -0.83 -0.68 -1.12 -0.65 -0.87 -1.17 -1.66
32
0
25
50
75
100
Purc
has
ed q
uan
titi
es
(kg/c
apit
a/yea
r)
0%
10%
20%
30%
40%
2005 2010 2015
Mar
ket
sh
are
Modern retailers
Formal safety assurance
Non-neighboring imports
Figure 1. Projected purchase quantities and market shares of modern supply chains for
fresh fruits and vegetables
33
0%
10%
20%
30%
40%
2005 2010 2015
Mar
ket
sh
are
Total effect Exp' effect
Price effect Distance effect
Figure 2. Projected market shares from modern retailers differentiated by expenditure,
price and distance effect