changing financial structures in the arab world: some ... · if financing availability to oil and...
TRANSCRIPT

Changing Financial Structures in the Arab World: Some Implications for Oil and Gas
Randa Alami
Oxford Institute for Energy Studies
F 10
April 2005

ii
The contents of this paper are the author’s sole responsibility. They do not necessarily represent the views of the Oxford Institute for Energy Studies or any of
its Members.
Copyright © 2005
Oxford Institute for Energy Studies (Registered Charity, No. 286084)
All rights reserved. No part of this publication may be reproduced, stored in a retrieval system, or transmitted in any form or by any means, electronic, mechanical, photocopying, recording, or otherwise, without prior permission of the Oxford Institute for Energy Studies. This publication is sold subject to the condition that it shall not, by way of trade or otherwise, be lent, resold, hired out, or otherwise circulated without the publisher’s consent in any form or binding or cover other than that in which it is published and without similar condition inc luding this condition being imposed on the subsequent purchaser.
ISBN 1 901 795 38 1
iii
CONTENTS
Abstract 1
1. Introduction 2
2. Current trends in global finance for developing countries 5
3. Recent trends in oil and gas financing 10
4. Changes in the external financing of Arab countries 17
4.1 Current external debt structures 17
4.2 Transformations in financial inflows to the region 22
5. An overview of Arab financial markets 25
6. Recent trends in the financing of Arab oil and gas 30
7. Qatar: Main developments in oil and gas financing 42
8. Qatar: Macroeconomic impacts 46
9. Limitations of the special case 50
10. Outlook: From financing gap to financial bounty? 53
11. Conclusions 56
Appendices 60 References and Bibliography 63 Glossary and Definitions 69

iv
TABLES 1. Classification of economies by sources of finance 19
2. The composition of aggregate net resource flows 24
3. APICORP’s decomposition of sources of financing in Arab O&G, 1998-2003 36
4. Companies in Arab O&G by ownership type and sector 40
5. Companies in Arab O&G by company type 41
6. Qatar: selected macroeconomic data, 1997-2001 47
A1. Coverage of Arab countries in data sources 60
A2. Arab economies by level of income and indebtedness 2002 60
A3. Foreign Direct Investment Inflows, 1998-2003 61
FIGURES 1. Total Arab public and external debts 17
2. External and domestic debts in Arab countries in percent of GDP, 2001 20
3. Aggregate resource flows 23
4. Aggregate resource flows by type 23
5. APICORP’s expectations about distribution of O&G, 2004-2008 34
6. Composition of Qatari government debt 48
7. Qatari external debt by borrowing sector 49
A1. Syndicated loans by number of Arab borrowers 1993-2003 62
A2. Syndicated loans by Qatari & Egyptian borrowers 1993-2003 62
Box 1 Global Capital Structure of RasGas LNG Project 44 Box 2 Global Capital Structure of QatarGas II 46

v
ABBREVIATIONS AMF Arab Monetary Fund APICORP Arab Petroleum Investment Corporation DRS Debt Reporting System (World Bank) ECA Export Credit Agency ECGD Export Credit Guarantee Department (UK government export guarantee agency) EXIM Export-Import Bank (US government export guarantee agency) FDI Foreign Direct Investment JV Joint Venture GDP Gross Domestic Product GNL Gas liquids IFI International financial institution IMF International Monetary Fund IOC international oil company LNG Liquefied natural gas NOC national oil company O&G oil and gas ODA Official Development Assistance OECD Organisation for Economic Co-operation and Development OPEC Organisation of Petroleum Exporting Countries OSEC Official and officially supported Export Credit PSA Production Sharing Agreement QGPC Qatar General Petroleum Company UNCTAD United Nations Conference on Trade and Development

1
ABSTRACT
This paper relates changes in Arab financial structures to financing patterns in oil and gas. Until the
mid-1990s, inherited financial structures displayed a reliance on external official finance. Since
then, governments, who are the main borrowers, have shifted to domestic and private sources of
finance, reflecting two broad changes. The first, is a global context where bilateral loans have
largely dried up and private finance is more important, though not more reliable. In the medium
term, capital flows to developing countries are expected to remain low and volatile, indicating
difficulties in credit supplies. Secondly, the region has witnessed a resizing of the role of Arab
states, and programmes to deepen and reform financial sectors.
Arab oil and gas sectors have changed in a similar direction. In-house finance and export credits
remain important for their investment needs, linking the sector to government balances and external
debt. Recently, improved and expanded financial structures have facilitated the use of more diverse
financing strategies. Domestically, the sector can now tap local savings through voluntary debt
instruments and stock markets. This underpinning, though quantitatively small, may be a stabilising
force: local investors react less severely to rising uncertainties.
Externally, the implicit guarantee offered by hydrocarbon receivables, which had been a key to
accessing foreign finance, is now helping the sectors to mobilise new instruments. On the other
hand, the use of private sources of fresh finance has re-introduced sensitivity to political and
country risk, and added weight to the importance of regulatory and institutional frameworks.
Arab oil and gas are therefore more dependent than ever on ‘balanced’ development, i.e. on
improvements in all sectors. If financing availability to oil and gas improved in response to
financial deepening, it is likely to respond positively to overall development. The current upsurge in
oil revenues is an ideal opportunity to finance this development, and to upgrade all resources,
including human capital.
2
1. Introduction
This paper examines the interactions between recent changes in domestic and external finance in
Arab countries and developments in their hydrocarbon (oil and gas) sectors. In the last two decades,
countries have witnessed three major transformations in their financial and energy sectors, and in
the role and size of the state. First, in line with global trends to deregulate and reform financial
sectors, the regiona l financial scene has seen a double switch: from official to private sources of
finance, and from external to domestic funding. In the last few years, this has taken place against a
background of heightened political turmoil, which in turn has affected the mix and availability of
finance. Second, to varying extents, their oil and gas sectors are being transformed by reform and
restructuring, including through corporatisation or privatisation. This is in line with the third
transformation, whereby pressures of economic adjustment and globalisation have redefined and
resized the role of the state in the region. The involvement of Arab governments in running their
economies was historically prominent, including in energy. Therefore, sectoral re-organisation falls
within this broader transformation of the Arab state, but represents a more fundamental departure
from the previously dominant pattern of state intervention.
Each of these transformations has been the subject of extensive discussions. However, there have
been fewer attempts to relate them to each other, or to examine overlapping problems. Yet, these
inter- linkages have both affected past developments, and are significant in shaping future strategies.
In the case of hydrocarbon sectors, which are the focus of this study, these inter- linkages are
reflected in several ways:
In the past, financial flows to the region have focused substantially, albeit not exclusively, on
hydrocarbon sectors. Hydrocarbons are a key avenue through which global finance affects the
region.
Oil and gas (O&G) related projects and institutions are now competing with other projects and
economic agents for funds and for presence in capital markets, both domestically and
internationally. The financing mix in some projects has reflected the aforementioned switch to
private funding.

3
The withdrawal of the state from the economy has been driven, to varying extents, by fiscal
pressures and the need to balance budgets, to which hydrocarbon outlays 1 and revenues are critical.
A noticeable pre-occupation of policy makers and analysts since the late 1990s has been the
suitability of finance for sectoral and regional growth needs. These worries are accentuated by two
major developments. First is the negative outlook and difficult financial markets in which
developing countries have to operate in the short to medium term. In many sectors and regions, this
global situation has offset conscious efforts to attract or revive investments. Second, there is a
sustained high level of political turmoil and uncertainties across the region. Hence, until the
sustained rise in crude oil prices, a key challenge to Arab oil and gas (O&G) was perceived and
declared to be whether domestic and international resources are currently adequate enough for the
magnitude of capital required by the sector.
This study is largely a preliminary and qualitative exploration of this challenge; analysis is pegged
at the macro- level. The focus is primarily on identifying, broadly speaking, inter- linkages between
the debt and external financing profiles of Arab O&G producers, and oil and gas activities.
Information on the former, whilst detailed in terms of commitments or the type of finance, is
typically devoid of sectoral content. In fact, up to the mid-1990s, data on and analyses of external
debt and international finance provided by international financial institutions (IFIs) were focused
almost exclusively around balance of payments, i.e. on aggregate numbers relating to a country’s
external balances. A uniform diagnosis tended to be applied across countries and time periods. It
was not until 2000, for example, that the IMF took into account the ratio of debt service to
government revenues when assessing debt burdens, and only in 2002 did it highlight the features of
Latin American debt (World Economic Outlook, April 2002).
Similarly, oil revenues may be included in an economy’s external financial position, but it is hard to
distinguish imports or debts incurred in the production process from the financing needs originating
in other sectors. Although financial aspects of O&G activities such as the features of a specific deal
may be available, the micro information is too sporadic to enable one to deduce a precise aggregate
about the financing activities of the sector as a whole. Such information does not usually refer to the
impact on the economy or on the external debt position. Additionally, data available on financial
1 Outlay means expenditures or commitments, and the word is often used to refer to capital expenditures. Definitions and a glossary of terms used are available at the end of this paper.

4
markets, financing instruments, or debt flows are not matched by a similar disaggregation of the
financial activities of government and national companies in oil and gas.
Mapping micro-macro financial interactions may be possible for other sectors such as agriculture or
the cement industry, where relevant data or time series about investment spending or capital inflows
are more readily identifiable and available. Not only is there a problem with the availability of data,
but these concepts do not have precise parallels in O&G. The industry’s structure differs in several
fundamental aspects, including its downstream and upstream segments, and the triangular
relationship between governments, international, and national oil companies (IOCs and NOCs).
Disentangling or decomposing aggregate financing flows according to their corporate origin is
particularly difficult when it comes to governments and NOCs in the Arab world. The political,
fiscal, and financial relationships vary greatly across the region, and across time within each
country. NOCs have changed in nature, status and structure, but the documentation of these changes
is sporadic in coverage and depth. Further, NOCs are often still required to act as the guardian of
the national wealth of hydrocarbon resources. Therefore it is not possible either to interpret or to
trace their financial structures or financial histories over time to the same extent that it can be done
for IOCs, or for NOCs with clearer corporate identities such as PEMEX. Likewise, a mere
consideration of government budgetary allocations will reveal little as to whether the earmarked
amounts have undermined or helped the financial health of an NOC. IOCs, who come into the scene
from the position of a global investor, add yet another dynamic to the equation.
Whilst aware of underlying complexities, therefore, this paper’s primary task is to detect changes at
the macro level in issues such as the nature of participants (foreign vs. local, and government vs.
private) and in the financial mixes in recent O&G projects, and to put them in the context of broader
changes. This may give some indication of where Arab O&G sectors are heading, and how they are
responding to current problems and opportunities. In turn, the directions they are taking can provide
some clues about the perceived adequacy of financial resources available to the sector as well as the
anticipated shortage problem. The study is focused on major Arab oil producers (the Gulf countries
and Algeria). Other Arab countries are included in so far as regional financial trends or economic
policies refer to them, and in so far as it is useful to contrast policies across income groups.
The investigation begins by setting out the financial context, outlining the main trends in the
developing world’s financial markets in Section 2, and reviewing the behaviour of oil and gas
financing in Section 3. The next three sections relate the Arab financial scene to financing secured
5
by hydrocarbon sectors. Sections 4 and 5 look at current financial structures, both external and
domestic, highlighting the shift away from traditional mixes and official funding. Section 6 reviews
the main trends in the financing of Arab O&G sectors, which now incorporates new players and
new instruments. It finds that domestic flows and local investors have acquired a qualitative
significance, and that this change was large ly permitted by measures of financial reform and
deepening.2 This is somewhat surprising, as the positive effect would not be obvious from a
quantitative measurement of these changes. The next two sections consist of a country case study,
which was felt to be the most appropriate method in light of the data problem and the focus on
detecting policy changes. Section 7 considers the case of Qatar in the 1990s, highlighting the
distinguishing features of the financing of its massive gas investments. Their macroeconomic
consequences are addressed in Section 8. Qatar was chosen because of its pioneering use of
sophisticated financing instruments (as far as the Arab world is concerned), its prominent reliance
on capital markets, and the simultaneous rise in domestic credit use. The Qatari gas case allows the
delineation of the risks and opportunities offered to Arab O&G by the current financial context,
which are the subject of Section 9. Section 10 assesses the current outlook for the sector,
questioning in particular whether financing availability is likely to be a constraint on sectoral
growth. The upsurge in oil revenues since mid-2004 should go a long way in relieving any funding
constraints. Section 11 draws the conclusions. A glossary and list of definitions of technical terms
are grouped in an appendix.
2. Current trends in global finance in developing countries
Until the last two years or so, enthusiasm and optimism about private capital flows to developing
countries – whether Foreign Direct Investment (FDI), equity, bond issuance, or bank lending - took
a severe blow, and thereby halted the sharp upswing displayed in the 1990s. The East Asian
financial crisis of 1997- 8 was followed by a number of other shocks (Russia, Brazil, Argentina and
Turkey). Together with transformations in the advanced countries’ capital markets, this has led to a
new, more difficult, international financial context within which developing countries must operate.
As of 2004, the economic outlook and financing available to developing countries improved, but
risks remain.
2 Financial deepening is used here in its broader sense, namely the overall expansion in financial transactions as a result of the broadening of the products and terms offered by financial institutions, and of the diversification of the financial

6
Hence, international financial institutions (Bank of International Settlements, IMF, World Bank)
have focused their attention in the last few years on the weakness and volatility of the levels of
private financial flows. Net lending to developing countries had been shrinking for a number of
years, with repayments to private creditors exceeding the loans they disbursed. Fresh lending from
official sources has remained largely positive, but could not offset the overall fall in debt finance
provided. Preliminary data for 2003 indicate that net debt financing is picking up. However, the $44
billion of loans extended in 2003 – of which $31 billion went to Central and Eastern Europe - were
below the $105 billion registered in 1997.
Similarly, the World Bank 2004 Global Development Finance indicates that net private inflows to
developing countries edged up to $200 billion in 2003, above the $178 billion in 2001 but below the
peak of $285 billion in 1997. Global issuance of debt securities, bonds, and equities followed a
similar trend: at $33 billion in 2003 they still had not recovered from the falls of 1998- 9. Net bank
lending, the other component of net private flows, remained negative at $- 6.6 billion in 2003. The
current consensus is that subdued private flows are the new reality in the medium term. This
outlook includes five trends of relevance to this analysis.
First, many investors burned their fingers in emerging markets and there has been a tangible shift
since then away from high-risk ventures, even where yields appear promising. The market is said to
be increasingly concerned about, and sensitive to, credit risk. This has been translated into a
differentiated attitude to investments and purchases, with investors concentrating on highly rated
developing countries (such as China or South Africa). Within that, the market is further
distinguishing between different types of borrowers according to their financial health, and is
demonstrating strong preferences for investment grade ventures. An important factor underpinning
this change is a shift in the composition of the investor base. The participation of non-specialised
hedge funds has diminished by about one-third in the last few years, implying less speculative
investment. While a concentration on better asset classes may stabilise flows, it also means that
borrowers below investment grade or those suffering a setback in credit ratings, will probably face
higher costs of raising capital in an increasingly constrained credit market. At the same time, risk
averse investors were showing an interest in developing countries since 2003 partly in response to
increased rigour and stablility in their macro-economic frameworks.
_____________________________ infrastructure. For simpler economies, this may just mean the opening of non-bank rural credit co-operatives or cash points. For more advanced economies, it may mean the setting up and evolution of capital and securities markets.

7
The second trend is the visible retrenchment of banks and bank lending away from developing
markets, and away from loan syndication. While analysts point out that bank lending has never
recovered since the East Asian Crisis – with both European and Japanese banks withdrawing - the
decline in the market valuation of the large Western banks has reinforced this trend. It is also widely
believed that new regulations concerning banking risks and capital adequacy under the Basel II
Accord will lead to new calculations of credit risks and hence to higher bank charges. Specifically,
according to the IMF Global Financial Stability Report (September 2003), ‘lead banks’ will
continue to concentrate their activities on underwriting syndicated loans and receiving up-front fees,
rather than participating in the syndication per se.
The third trend concerns equity flows and international debt securities, which are currently
characterised by their small size, and their concentration on a minority of recipients. Despite gains
in 2003-2004, portfolio equity flows never recovered after falling from their peak in 1993,
registering a mere $14 billion in 2003. Similarly, the net issuance of international debt securities by
developing countries stood at $35 billion compared to $946.3 billion for developed countries (Bank
for International Settlements, September 2003). In 2002 East Asia still accounted for 60% of issues,
with fourteen developing economies accounting for three-quarters of international placements
(World Bank, Global Development Finance 2003). Modest levels of new issues distinguish the
current trend. Investors’ demand may force many potential borrowers out of this route of financing,
but can also be revived, as with $13 billion of bonds issued in Latin America (Global Development
Finance 2004).
Trends continue to vary across borrowing sectors and regions, depending on the prevailing
composition of private flows used. According to the IMF (Global Financial Stability Report, May
2003), domestic bond issues in Latin America - which peaked at $147 billion in 1997 - were the
largest source of corporate funding. That region suffered the most during the weakening of issuance
levels. By contrast, in Asia, domestic bank lending accounted for 65% of corporate financing.
Financial structures in Arab countries are closer to this model of bank-dominated financial systems.
Fourth, two types of bond appear to be evading the declining trend. The first is international project
bonds, which interna tional organisations expect will grow and become a key instrument for
financing infrastructure. The second group is local currency bonds. These have received increasing

8
market attention recently, reflecting both a reduced appetite for international currency issues as well
as an increased interest in mobilising domestic funds. While local bond markets have always been
an important source of funding for public sectors, the Global Financial Stability Report (September
2003) expects that these markets may prove to be an alternative source of funding for the corporate
sector, and a way of managing currency risks. Local bond markets can be attractive to domestic
investors and useful for capturing domestic savings. More generally, broadening and diversifying
the investors’ base and reducing the importance of speculative investments are seen to be of
strategic importance in stabilising and strengthening capital markets.
Fifth, the volatility of private financial flows and emerging capital markets has reinforced
perceptions of the merits of the relatively more stable direct investment or foreign direct investment
(FDI). This has two components: greenfield investment and FDI equity investment. The first
category is easier to classify because it is simply the acquisition by foreign residents of tangible
assets, such as a factory. The second is a type of portfolio investment, the key difference being that
FDI implies a long-term interest in, and/or significant management influence over, a foreign
affiliate. International organisations use a statistical benchmark to distinguish between the two, and
that is a threshold of 10% of share ownership. However, the distinction between FDI and portfolio
investment is often blurred.3 Yet, according to UNCTAD, FDI levels fell between 2000 and 2003,
as if to prove the volatility of international capital flows. It seems that no sooner is a capital flow
praised for its reliability, it confounds observers by reversing its course and falling.
Nevertheless, FDI is still the largest component of worldwide aggregate resource flows. It is beyond
the scope of this paper to consider the mushrooming literature on its merits, or to summarise
findings on the barriers to, incentives for, and experiences with FDI expansion in developing
countries. Such investments continue to be a key issue, with the sustained rise in bilateral
agreements signed reflecting the centrality of investment to current policies. Here, we merely touch
on the status of its two components, while the next section considers sectoral investment more
closely.
As confirmed in Global Development Finance 2004 Report, FDI is still concentrated
geographically: ten countries accounted for 68 percent of FDI in 2003, down from a peak
concentration of 78% in 2000. As is well known, China led the global revival in capital spending,

9
receiving the largest amount of FDI in 2003. Net FDI flows in 2003 were about $135 billion
compared to $171.7 billion in 2001 (Global Development Finance 2004). According to UNCTAD,
FDI inflows inched up to $172 billion in 2003, but were still below the $209 billion (World
Investment Report 2004). An important reason for weakening FDI flows had been falling mergers
and acquisitions (M&A), which were particularly significant for Latin America. Portfolio
investment levels are still tangibly lower than in the 1990s, when their rise was driven by the
privatisation of public enterprises. The diminishing range of assets on offer and the increasingly
widespread concerns about privatisation mean that this type of investment is unlikely to rise
significantly in the medium term. This has been also recently emphasised by the World Bank
(Buresch 2003, Razavi 2003; Global Economic Prospects 2003).
On the other hand, greenfield FDI has been more resilient, thanks to some inherent properties as
well as to the drive by developing countries to promote investments. Aspects such as sunk costs and
irreversibility have long been discussed in the literature, and it has been observed that the
inalienability of some factors of production often make this type of FDI a preferred mode of entry
to developing countries, particularly where financing constraints prevail. In this sense, Albuquerque
(2002) notes that the share of FDI inflows in gross private capital flows is higher for poorer than for
richer countries, and is correlated with their country risk ratings. In his words, FDI is often the only
form of investment that the poorer and financially constrained countries can get: other forms
demand more sophisticated capital markets and economies. Similar remarks have also been made
by the IEA (2003).
It should be stressed that the distribution of investment flows is likely to change in the near future in
light of recent changes in measurement practices. Since 2002, many IFIs have engaged in a major
statistical correction exercise to take into account the use of retained earnings for investment
purposes, namely reinvestment and depreciation spending. UNCTAD, the World Bank, and the
IMF, are now arguing that total investment and net FDI levels in many developing countries may be
seriously underestimated because of the failure to include in-house finance and retained earnings
used by international companies for their worldwide investments. Consequently, many investment
levels need to be increased to allow for re- investment activities. While India has been highlighted as
a current example, future revisions may well concern the way joint ventures and production-sharing
agreements in O&G are accounted for.
_____________________________ 3 For example, investors may use their shares as collateral for borrowing, and portfolios can have options to be converted to shares.

10
The overall implications of the current international financial context are relevant to O&G actors
currently accessing international capital markets, or attempting to attract non debt creating flows.
IOCs are more regular and substantive users of mature OECD capital markets. Governments and
NOCs have tended to use bank lending, with equity and portfolio flows only relevant to entities
with the appropriate corporate structure. Similarly, using local currency bonds presumes the
presence of the required exchange rate and clearing mechanisms, i.e. the presence of fairly
developed financial systems. Only a few Arab governments and even fewer Arab private
corporations have been able to engage in this type of financing. The main message seems to be that
accessing fresh finance from international markets in the medium term is more conditional and
costly than previously, particularly for entities below investment grades, as is the case with most
Arab borrowers. Accessing fresh official finance is another issue, to be discussed in Section 4.
3. Recent trends in oil and gas financing
Analyses of Foreign Direct Investment have tended to focus almost exclusively on types of flows,
volumes, or issues relating to regulatory requirements or similar factors believed to affect
investment decisions - so much so that many aspects of investment, including its sectoral emphasis,
have taken the backstage. Yet, historically, FDI has been attracted to countries with significant
endowments of capital or natural resources, and/or with large domestic markets.4 Furthermore, rises
in FDI have at times been due to specific sectoral activities, such as in the telecom boom in
1999- 2001, or the current interest in services. An even more striking feature of investment data in
most sources is the fact that investment in oil and mineral resources has been resilient across
regions, income groups, and time periods.
Starting with UNCTAD’s review of FDI in Africa (1999), Gross Fixed Capital Formation as a
percent of GDP in the period 1991-7 in oil-exporting African count ries was higher than the average
for Africa, at 6.9% and 5.6% of GDP respectively. UNCTAD’s World Investment Report 2000
notes that two of the three largest recipients of investment flows in Africa in 2000 were Angola and
Nigeria. Neither received much investment outside their hydrocarbon sectors. Subsequent World
Investment Reports also show that top investment recipients in Africa are dominated by oil

11
exporters (Angola, Algeria, Chad, Nigeria); and greenfield investment in oil explained why some
countries avoided the current fall in FDI. Two sources also note that in Latin America, the
contribution of FDI to Gross Fixed Capital Formation is higher among oil exporters than in other
Latin economies (US Office of Energy Markets and Energy Use 1996; ECLAC 2000). The IMF’s
Working Group on Capital Markets (2003) also observes that investment in Andean countries is
concentrated on extractive sectors.
More generally, the UNCTAD World Investment Report 2003 states that FDI in oil and mining
outperformed manufacturing and services, and escaped the current downturn. Similarly, the World
Bank Global Development Finance 2003 notes sustained interest in extractive industries, and that
the share of oil exporters in FDI flows to developing countries had been around a steady 20%
through most of the 1990s. Finally and significantly, Smith (2003) claims that exploration and
development spending by international oil companies has been mostly steady in nominal terms,
averaging $25- 6 billion over the last decade. In other words, large O&G investors and/or operators,
OECD based oil majors in particular, have little problem in using international capital markets to
finance their operations.
Despite this apparent stability in levels of capital mobilised, some analysts have argued that O&G
sectors have been affected by the current crisis in investor confidence, the sharp correction of risk-
taking attitude, and the consequent tightening of credit availability. Since the supply of funds to the
sector did not collapse in the current atmosphere, the puzzling questions are why levels have been
so stable, what other credit market conditions have changed, and what transformations – if any - lie
underneath these stable levels?
Four arguments can be advanced regarding the stability of O&G investments. Firstly, the sector has
always required ‘patient capital’ because of several inherent characteristics, such as its high capital
requirements, and long gestation and pay-back periods. Secondly, O&G projects are directly and
indirectly linked to export revenues and the entailed cash flows. This link acts as a guarantee,
thereby minimising risks of default or repayment problems. This guarantee is more secure than in
the case of other commodities because of the critical importance of fossil fuels as an economic input
and a source of revenue. Hydrocarbon exports have acted, however implicitly, as inherent collateral
in sectoral financing.
_____________________________ 4 See for example Aziz (2001).

12
In fact, the World Bank (Kether and Retha, 2001) argued that with the setting up of special purpose
vehicles, more developing countries would be able to benefit from the ‘securitisation of future flow
receivables’. They also argued that there is huge potential for expansion for O&G exporters, as the
current over-collateralisation ratio is 5:1, and as issues backed by O&G receivables have
particularly high ratings.5 At that time, the issuance of such instruments had been limited to a few
participants with relatively advanced corporate structures or a long history in capital market
participation (such as PEMEX).
Third, in contrast with other types of investment, multi-year agreements prevail, commonly in the
form of joint ventures (JVs) or production sharing agreements (PSAs), especially in the upstream.
These frameworks act to stabilise investment levels in several ways:
A. By allowing lenders to monitor, observe and enforce, these contracts overcome the
three major disadvantages that characterise sovereign lending and distinguish it from
domestic lending.
B. Investors are provided with clarity of vision, at least in the medium term.
Empirically, this was found to be more important than other promotional measures.6
C. Agreements allow companies to determine their tax liabilities over time, and may
even protect them from a sudden adverse change in tax regimes or tax collection purposes.
D. The contracts help to stabilise the business outlook in the medium term, which in
turn makes longer maturities less risky.
As will be shown later, new instruments such as project bonds have been successful to the extent
that the bond covenants have been able to reduce sovereign lending risks in a similar vein.
Fourth, contractors and exporters of O&G equipment have always been able to mitigate commercial
and other risks by relying on the support of export credit agencies (ECAs). Historically, ECAs have
been an important source of debt finance for developing countries, including Arab economies.
Effectively, ECA guarantees shift risks of non-repayments and the costs of debt recovery away
from the exporter, thereby artificially increasing the viability of their ventures and filling a vacuum
created by the absence of private insurance. By lowering risk, these guarantees can improve terms
of finance by for example lengthening maturities, a crucial consideration for oil and gas.
5 The over-collateralisation ratio is the ratio of fuel and mineral exports to debt issues backed by corresponding receivables. It makes an implicit and simplistic assumption that the bulk of export revenues are idle, or not used in other commitments. 6 See Chapter 3 of Global Economic Prospects 2003 for general findings, and Antill and Arnott (2003) on oil investments.

13
On the other hand, this guarantee may be a source of risk for borrowers. A burgeoning literature
shows that from avoiding the problems of mis-pricing and adverse selection associated with private
debt, official and officially supported export credits (OSECs) extended by ECAs suffer from
distortions that undermine the optimality of borrowing. These distortions may emanate from the
donors’ strategic trade interests, including promoting arms exports, as well as political aims.7
OSECs have often been granted when commercial entities would not have done so, and without
consideration to the recipient’s overall debt position. 8
OSECs are provided to all sectors. However, energy, including O&G, has been arguably the single
most important user of this form of finance. Energy sectors are often of vital and strategic interest,
and associated finance typically relates to large projects worth billions of dollars, and that may be
tied to other strategic interests. Recent publications and increased pressures for disclosure9
document the importance of fossil fuel projects in ECA portfolios. Thus, $5 billion of the $28
billion of loans and guarantees extended by the US EXIM bank in 1991- 2001 were for energy
projects, including fossil fuels (US GAO, 2002). Likewise, in 2001, the O&G sector accounted for
38% of facilities provided by Japan’s ECA, with energy projects in 2002 accounting for 48% of
financing by OECD ECAs.10 Examples of such projects are:
- In 2001, the EXIM bank guaranteed $535 million worth of equipment and services exports
by thirty Texan oil companies for production enhancement activities in Mexico and Algeria. In
2003, Sonatrach reached a preliminary agreement with the EXIM bank for a $1 billion line of
credit, Algeria having been their customer for some thirty years (EXIM Press releases, 5/10/2001,
27/10/2003).
- In 2002, the UK’s ECGD supported a $215 million loan for an LNG expansion project in
Bonny Island, classifying it under ‘good projects in difficult markets’. In 2003, UK rapprochement
with Iran led the ECGD to announce its support for exporters interested in Iranian oil projects, and
lifted the requirement for the Iranian National Oil Company to enter into structured agreements for
deals below $20 million (ECGD: Annual Reports; Press release 28/02/2003).
7 Alami (2003) compiles these arguments on the basis of OECD, IMF, and UNCTAD data, and from country specific material such as the Scott Enquiry in the UK. 8 See: Raynaud (1992); UNCTAD, Trade & Development Report 1996 ; Kuhn et al (1999); Williamson (2000). 9 This has partly resulted from growing pressures over environmental concerns, and the lobbying by related NGOs, ECA Watch in particular. 10 International financial institutions such as the World Bank are also involved in guaranteeing O&G projects. These guarantees are usually offered partially, e.g. for the transit of production or a state payment obligation. However, little data are publicly available.

14
However, the relative stability of financing available to O&G masks significant changes in the
industrial structure and investment strategies of the main actors, namely IOCs and producers. These
changes are reflected in the geographical redistribution of flows and in diverging types and means
of financing rather than volatility in overall levels. A limited synopsis of these changes is presented
here.11
Among oil majors, the most distinguishing concern is with access to and control of resources and
reserves. Many analysts 12 point out that the re-organisation of oil majors has essentially increased
the importance of corporate targets and of shareholders’ interests in deciding investment strategies
(Antill and Arnott 2003). Prominent among these are a ‘bottom-line obsession’ (Williams, 2001),
which underlined the restructuring and redeployment of IOCs.
By the mid-1990s, the restructuring of oil majors took the form of asset acquisition, as opposed to
‘organic’ growth through reserve acquisition or discovery. Asset acquisition became the dominant
strategy for achieving corporate financial targets, this resulting in a wave of Merger and Acquisition
activities. The significant increase in cross-border investments included acquiring assets offered in
developing countries, a salient deal being Spain’s Repsol acquiring Argentina’s YPF (Yacimientos
Petroliferos Fiscales) at $15- $16 billion in 1999. This wave appears to have ended, particularly
following economic downturns in Latin America.
With respect to redeployment, the oil majors have tended to diversify geographical and political risk
and to achieve a particular competitive position vis-à-vis other players. In other words, IOCs have
increasingly been managing their presence in producer countries as a portfolio of investments, and
looking to consolidate operations in a particular area (Zanoyan 2003). This consolidation would
seek to secure access to reserves and to areas where high returns can be secured. The target of
achieving high returns has therefore led to an expansion in new areas, which is sometimes referred
to as a drive to ‘difficult oil’ and ‘new country’ access (see Skinner 2003, Smith 2003). This
resulted in a pattern of new investments with a bias towards regions like the Caspian Sea and
deepwater offshore production, as typified in West African and Brazilian ventures.13 The latter has
also been mediated by technological advances that significantly improved the cost structures of
11 For the sake of brevity and simplicity, we deliberately abstract from many major defining factors, such as the role of OPEC vs. non-OPEC policies, or the increased volatility in crude prices. 12 See US Office of Energy Markets & Energy Use (1996), Lynch (2000), Williams (2001), IEA (2003).

15
such ventures (al-Moneef, 2000). According to Skinner (2003) large companies seek oil reserves in
technically and/or politically difficult places, because they need discoveries large enough to offset
depletion and maintain growth.
On the whole, a global portfolio approach to considering IOCs’ investment decisions, and an
appreciation of their corporate size and culture offer plausible explanations to what may otherwise
appear to be perverse behaviour. In other words, it is easier to understand why IOCs invested in
Angola and were not deterred by apparently difficult production agreements (Bindemann, 1999), or
why they invested in Sudan despite political risks (Rodgers, 2003). The companies do not lack risk
aversion, but they are driven and are securing high returns in high risk ventures.
While it is quite easy to categorise IOCs and trace their role in the industry, the same cannot be said
about either governments or NOCs. Each of these consists of a much more diverse group of agents
at any one time. The first point of departure is due to the fact that for producers and their NOCs,
control over oil reserves and natural resources has been a priority and an important determinant of
the type of financing they sought. Generally speaking, up to the mid-1980s, national ownership of
reserves meant that the upstream and downstream were primarily the responsibility of governments
and NOCs, with IOCs entering as a partner. Thus, O&G finance by producers, including any
borrowing, would be defined primarily by fiscal and budgetary positions and practices. The
financing may involve domestic avenues, affecting domestic credit systems, and may also require
accessing international markets as sovereign. The terms of access are dictated by global financial
trends (such as the current bank lending retrenchment). But as previously argued, O&G flows offer
borrowers possibilities of structuring finance in ways not necessarily available to other sectors. To
the extent that governments and NOCs access capital separately, the terms they secure may differ as
well as their exposure and borrowing requirements.
Macro-economic pressures and tightening credit availability since the mid-1980s brought changes
in government involvement and financing of the sectors. They created incentives for governments
to distance themselves or reduce their provisions of resources to oil and gas. While fiscal constraints
meant that retrenchment and/or divestiture affected all sectors, their application to O&G would be a
more significant departure from the prevailing presumption that the state alone is capable of
developing those sectors.
_____________________________ 13 See also a discussion of ‘Lord Brown’s paradox’ in Mabro (2003).

16
By the mid-1990s, sensitivity about controlling reserves had certainly been eroded. Poorer
producers and newcomers in particular needed the capital as well as the financial muscle of IOCs to
rescue and/or develop their sectors. A variety of policies were adopted. Bolivia privatised all its oil
enterprises, while Morocco acquired its state-owned petroleum companies through FDI. Yemen’s
oil industry took off at a time when the economy had turned its back on state control, with the
government’s meagre resources contributing to its opening up oil and gas to IOC leadership.
However, a more general pattern has been that of partial divestiture. The upstream sector remained
in essence off limits to IOCs. Large producers in particular tend instead to engage foreign capital
and expertise through service contracts or production sharing agreements (PSAs), i.e. agreements
allowing them to retain ownership of ‘national assets’.
The presence of external debt, currency, or other financial crises, was a limiting factor for these
types of manoeuvres. In such crises, alliances with capital rich IOCs were vital, since financially
vulnerable governments and/or state entities would have been limited in their access to international
capital markets. On the other hand, by the late-1990s, the range of IOCs had expanded beyond the
super-majors, especially in countries where majors were either not interested in working or were not
allowed to. The operations of Russian, Chinese, Malaysian, and Canadian companies expanded the
range of arrangements and terms suitable for producers.
To sum up, it seems that oil and gas financing has almost always involved producing country
government, IOC, and NOC, with changing contractual and financial relationships. Considering the
differing positions of these main players generates diverging assessments as to what constitutes a
financing problem for the sector. Given its history, it is rather implausible that the dominant
financing problem would be about a shortage of funds. Anxieties by investors and recipients
primarily reflect anxieties about their positions in an increasingly competitive industrial structure,
not to mention the influence of oil price volatility on their investment strategies.
As such, it is questionable whether access to reserves has been a deterrent to foreign investment in
producing countries, or whether it constitutes a policy failure on the part of recipients. Arguably, the
issue is being highlighted because of the super-majors’ current corporate financial targets and
strategies, and because of competition among producers to attract investments. The determinants of
foreign investments into O&G are not limited to this factor, and their importance can only vary
across situations.
17
4. Changes in external financing in Arab countries
4.1 Current external debt positions and structures
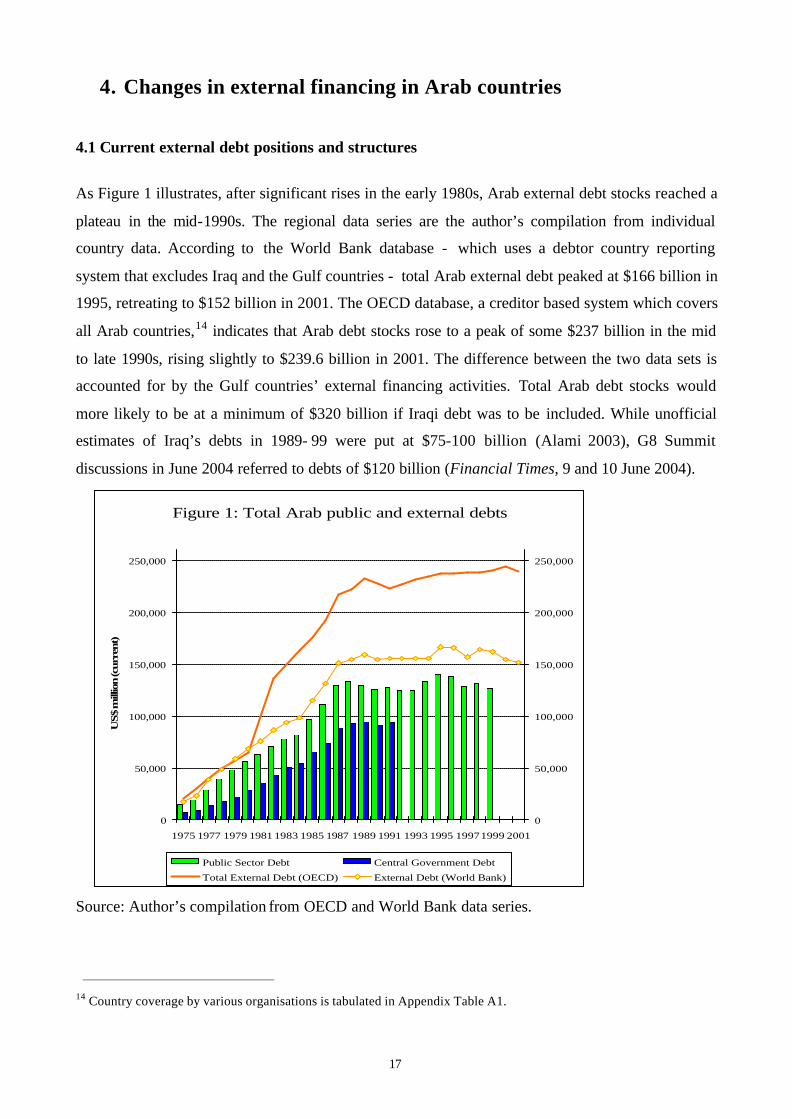
As Figure 1 illustrates, after significant rises in the early 1980s, Arab external debt stocks reached a
plateau in the mid-1990s. The regional data series are the author’s compilation from individual
country data. According to the World Bank database - which uses a debtor country reporting
system that excludes Iraq and the Gulf countries - total Arab external debt peaked at $166 billion in
1995, retreating to $152 billion in 2001. The OECD database, a creditor based system which covers
all Arab countries,14 indicates that Arab debt stocks rose to a peak of some $237 billion in the mid
to late 1990s, rising slightly to $239.6 billion in 2001. The difference between the two data sets is
accounted for by the Gulf countries’ external financing activities. Total Arab debt stocks would
more likely to be at a minimum of $320 billion if Iraqi debt was to be included. While unofficial
estimates of Iraq’s debts in 1989- 99 were put at $75-100 billion (Alami 2003), G8 Summit
discussions in June 2004 referred to debts of $120 billion (Financial Times, 9 and 10 June 2004).
Source: Author’s compilation from OECD and World Bank data series.
14 Country coverage by various organisations is tabulated in Appendix Table A1.
Figure 1: Total Arab public and external debts
0
50,000
100,000
150,000
200,000
250,000
1975 1977 1979 1981 1983 1985 1987 1989 1991 1993 1995 19971999 2001
US$
mill
ion
(cur
rent
)
0
50,000
100,000
150,000
200,000
250,000
Public Sector Debt Central Government Debt
Total External Debt (OECD) External Debt (World Bank)

18
Being dominated by government-to-government loans, Arab external debts reflected the
relationship states have had with their economy and polity on the one hand, and their regional and
global alliances on the other. The resulting debt structures have two distinguishing features. Firstly,
they reflect a balance between the concessional and official debts of the poorer indebted economies,
and the more commercial and short-term debts of richer borrowers. Secondly, they are dominated
by an official and long-term component.
Reflecting previous reliance on ex-USSR, Arab, and OECD government loans, the share of bilateral
debt in total Arab debt continues to be higher than the corresponding share in other developing
regions, reaching 58% in World Bank data for the late 1990s, with OECD data indicating that
official debt is between 63% and 65% of the total debts. This share is likely to diminish in the
absence of fresh loans, although bilateral finance may remain important for poorer economies. The
specificity of this regional debt pattern is better appreciated when contrasted with other regions. For
example, in 1998, debt to private creditors by Arab countries was at under half of the share of
private finance for developing countries. In 2001, 35% of debt outstanding was private compared to
67% in Latin America.
Three small changes were noted in sources of official finance. Firstly, debts outstanding to Arab
and East European countries continue to diminish in importance in the absence of new loans. They
now account for less than 20% of total identified debt, vs. a third of total stocks in the 1980s.
Secondly, multilateral debt increased its share marginally: for poorer countries, they are the only
source of fresh funding. Thirdly, while fresh official loans weakened, OECD debt in the form of
official and officially supported export credits (OSECs), retained their centrality. OSECs rose from
nearly $49 billion to $58.7 billion between 1995 and 2001, and accounted for over half of official
Arab debt. OSECs are the only type of official debt finance used by richer borrowers. Their
importance for exporting countries can be at least partly explained by referring to the
aforementioned sectoral composition, namely the prominence of oil and gas in the economy. For
example, Algeria’s current external exposure will undoubtedly reflect Sonatrach’s line of credit
from the EXIM Bank.
As to the borrowing sector, World Bank data confirm that Arab public sectors – including central
governments - accounted for the lion’s share of outstanding amounts, reaching 81% of stocks in
1998, compared to 54% in the developing world. No comparable borrowing sector data for Arab
Gulf economies are available. However, as OECD data indicate that most loans had been trade
19
related and short-term in nature, it can be argued that until recently the external debts of rich oil
economies were mostly to finance private commercial activities. The issuance of government and
state-owned enterprise debts by Gulf economies since the late 1990s suggests that their exposures
partly rose as a result of public sector activities.
Currently, only seven Arab economies are severely indebted,15 compared to nine in the late 1980s.
Most major oil exporters are either less indebted or net creditors to the world, with important
exceptions. Algeria was severely indebted until 2000 and Libya has had payments difficulties for a
good decade. Qatar is not covered by the World Bank’s classification, but its reported debt/GDP
ratio of over 90% in the 1990s indicated a severe, albeit temporary, debt burden. More details of
indebtedness levels are found in Table A1 in the appendix.
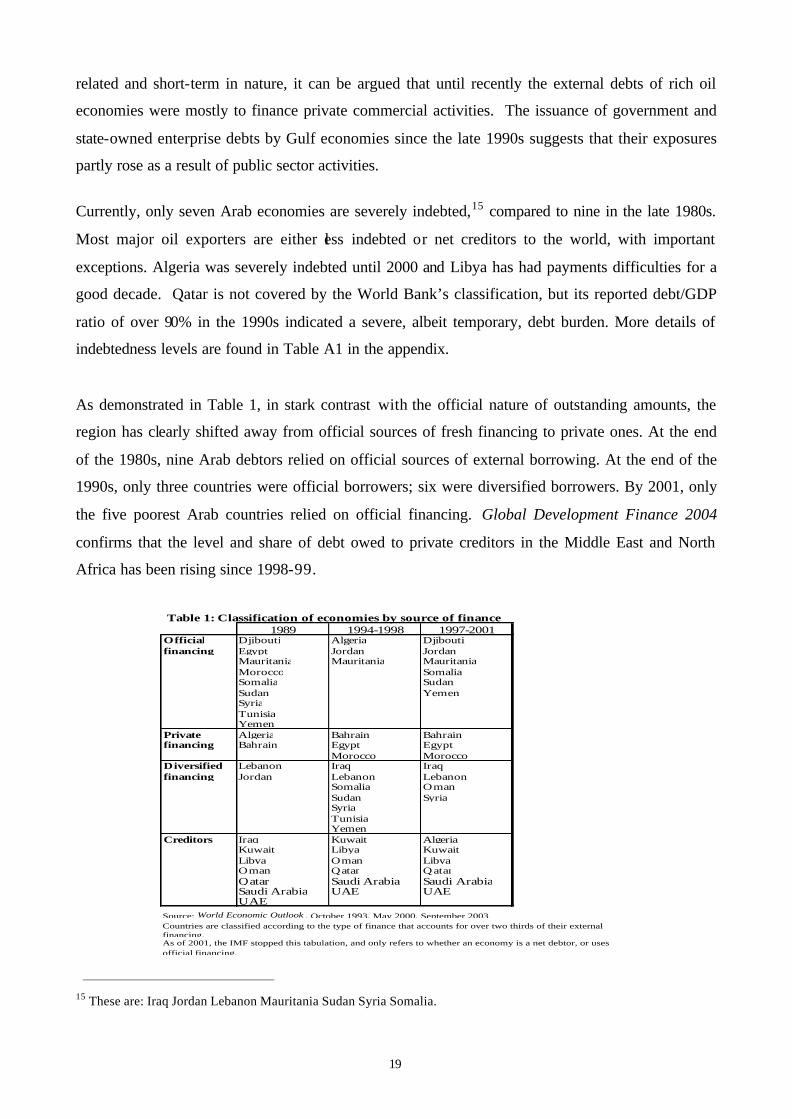
As demonstrated in Table 1, in stark contrast with the official nature of outstanding amounts, the
region has clearly shifted away from official sources of fresh financing to private ones. At the end
of the 1980s, nine Arab debtors relied on official sources of external borrowing. At the end of the
1990s, only three countries were official borrowers; six were diversified borrowers. By 2001, only
the five poorest Arab countries relied on official financing. Global Development Finance 2004
confirms that the level and share of debt owed to private creditors in the Middle East and North
Africa has been rising since 1998-99.
15 These are: Iraq Jordan Lebanon Mauritania Sudan Syria Somalia.
Table 1: Classification of economies by source of finance1989 1994-1998 1997-2001
Official Djibouti Algeria Djiboutifinancing Egypt Jordan Jordan
Mauritania Mauritania MauritaniaMorocco SomaliaSomalia SudanSudan YemenSyriaTunisiaYemen
Private Algeria Bahrain Bahrainfinancing Bahrain Egypt Egypt
Morocco MoroccoDiversified Lebanon Iraq Iraqfinancing Jordan Lebanon Lebanon
Somalia OmanSudan SyriaSyriaTunisiaYemen
Creditors Iraq Kuwait AlgeriaKuwait Libya KuwaitLibya Oman LibyaOman Qatar QatarQatar Saudi Arabia Saudi ArabiaSaudi Arabia UAE UAEUAE
Source: World Economic Outlook , October 1993, May 2000, September 2003Countries are classified according to the type of finance that accounts for over two thirds of their external financing.As of 2001, the IMF stopped this tabulation, and only refers to whether an economy is a net debtor, or uses official financing.
20
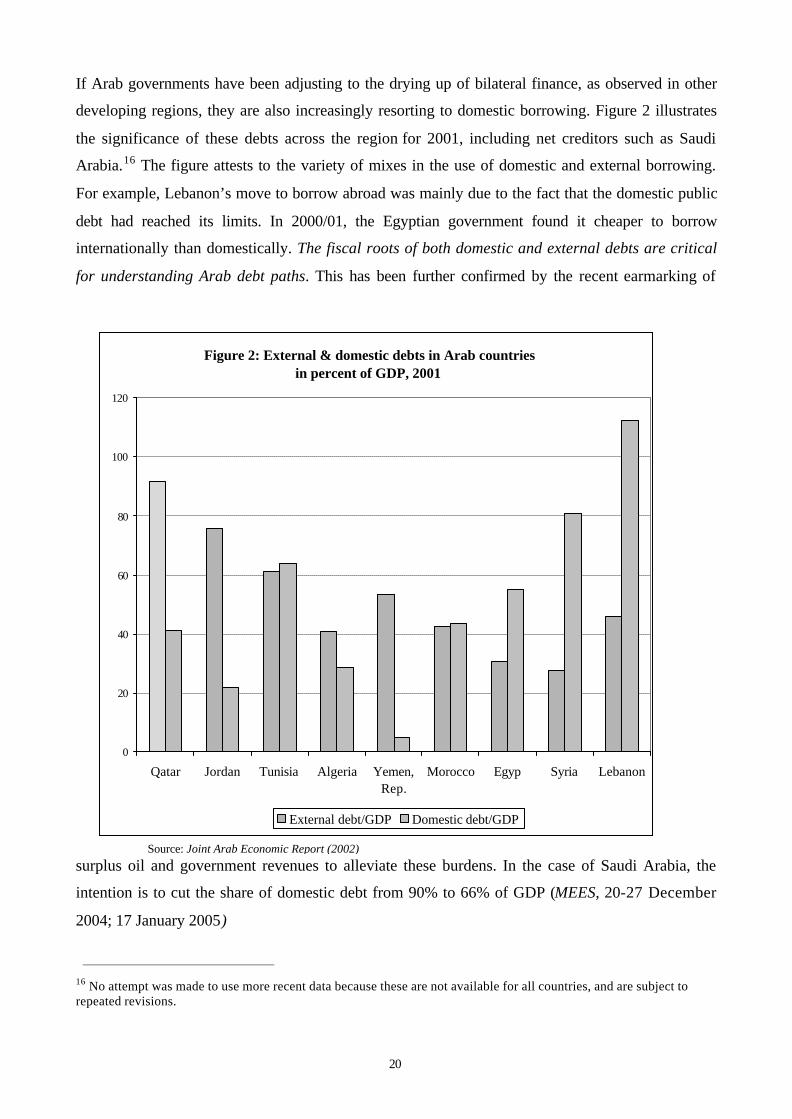
If Arab governments have been adjusting to the drying up of bilateral finance, as observed in other
developing regions, they are also increasingly resorting to domestic borrowing. Figure 2 illustrates
the significance of these debts across the region for 2001, including net creditors such as Saudi
Arabia.16 The figure attests to the variety of mixes in the use of domestic and external borrowing.
For example, Lebanon’s move to borrow abroad was mainly due to the fact that the domestic public
debt had reached its limits. In 2000/01, the Egyptian government found it cheaper to borrow
internationally than domestically. The fiscal roots of both domestic and external debts are critical
for understanding Arab debt paths. This has been further confirmed by the recent earmarking of
surplus oil and government revenues to alleviate these burdens. In the case of Saudi Arabia, the
intention is to cut the share of domestic debt from 90% to 66% of GDP (MEES, 20-27 December
2004; 17 January 2005)
16 No attempt was made to use more recent data because these are not available for all countries, and are subject to repeated revisions.
Source: Joint Arab Economic Report (2002)
Figure 2: External & domestic debts in Arab countries in percent of GDP, 2001
0
20
40
60
80
100
120
Qatar Jordan Tunisia Algeria Yemen,Rep.
Morocco Egyp Syria Lebanon
External debt/GDP Domestic debt/GDP

21
According to the Joint Arab Economic Report (2001, 2002) - jointly produced by the Arab
Monetary Report, Arab Fund for Social and Economic Development, and OAPEC - a good half of
Arab countries have been increasing the use of government paper and of open market operations
when borrowing domestically. Arab domestic debts are being held on a more voluntary basis than
previously. This is corroborated by the growth and evolution of a government bonds market, with
maturities recently ranging between two to ten years. These shifts in the sources of financing have
important behavioural implications. Domestically, the use of voluntary instruments means that
governments have to persuade rather than force the private sector to hold its debt. Similarly, leaving
bilateral official financing behind means that Arab borrowers (both governments and NOCs), are
more subject to the scrut iny of credit risk agencies and market sentiment. Consequently, Arab
governments are now faced with more costly or more conditional external borrowing. Oil revenues
are no longer a sufficient guarantee of access to capital, although they are a source of credit
enhancement. Other economic, regulatory, and political determinants and risk elements have come
into play.
With respect to economic elements, of foremost consideration for creditworthiness and access to
capital are indicators and market perceptions of debt sustainability. Arab borrowers’ credit positions
and overall debt burdens are more visible, particularly in light of international agreements on
financial disclosures and debt monitoring. Markets now also look at both domestic and external
public debts when assessing the sustainability of debt paths, particularly in the aftermath of the
experiences of Highly Indebted Poor Countries, Argentina and Brazil. Thus, with the scrutiny of
financial markets, domestic debts matter for external creditworthiness. Arab budgetary decisions
and fiscal balances have become significant signals for foreign lenders, with strong inter- linkages
between domestic and foreign exposures.17
As to institutional and regulatory risks, these refer to the quality, reliability, and trustworthiness of
the borrowing country’s legal system, dispute enforcement mechanism, and so on. Researchers on
the region - such as the recent World Economic Forum, Arab World Competitiveness Report
2002- 2003 - regularly call for more to be done on these issues to attract more financial inflows.
Another factor affecting capital provision is of course political risk, which is known to make private
investors more nervous than official lenders, undermining credit provision. Recently, Haddad and
Hakim (2003) find that sovereign risk for the region rose by 135 basis points (bpts) in the wake of

22
11 September 2001, making borrowers vulnerable to downgrading by rating agencies. The war on
Iraq would have caused similar nervousness in capital markets. However, the surprise of the last
two years has not been nervous responses to war. Rather, it is that the loss of confidence in the
region has not been as accentuated or as widespread as in previous shocks. In Standard & Poor’s
view (2004), credit agencies are acknowledging years of reforms and more sophisticated
management. It is not just that current oil revenues may boost growth in the region, but that regional
economies appear to handle fiscal volatility more competently.
4.2 Transformations in financial flows to the region
Financial inflows to the Arab region since the late 1990s can be summarised by three broad trends.
Firstly, transfers and resource flows have shifted in focus from official to private. Secondly, levels
have subsided considerably. Thirdly, Arab countries have witnessed a switch away from debt
financing towards other types of finance, namely portfolio investment and FDI. The last two trends
bring the region in line with other developing regions. As shown in Section 2, developing countries
on the whole suffered a slow-down in private flows, with repayments to private creditors typically
exceeding new debt financing. Data sources documenting these changes are not consistent in their
coverage. UNCTAD and pan-Arab organisations cover all Arab countries but not all types of
inflows. The World Bank gives extensive decompositions of aggregate financial flows, but does not
cover Iraq or the Gulf countries (see Table A1). This section focuses on different types of financial
flows, and therefore uses World Bank data. These data are supplemented by other sources and
country-specific information in Section 5, which considers Arab financial markets.
The first trend is illustrated in Figure 3. This shows that, while overall levels of aggregate net
resource flows to most of the region followed a downward trend, by the late 1990s private net
resource flows accounted for a larger share of aggregate resources than official flows. Net private
flows to the Middle East and North Africa also exceeded net official flows in 2001-2002 (Global
Development Finance 2004). However, when repayments are taken into account, net private flows
look less impressive. Private inflows of capital have yet to match the volume and stability of official
finance in its hey day, at least for the countries concerned.
_____________________________ 17 For example, Lebanon’s public debt pushed the country into the severely indebted category, while concern over Saudi domestic public debt has undermined the country’s credit rating for a number of years.

23
Figure 4, which confirms the decline in the volume of total finance received, illustrates the other
two trends, namely:
• A switch away from debt finance
• A significant shift in external capital structures away from official finance towards financial
markets.
Source: Global Development Finance (2003)
Figure 3: Aggregate net resource flows
-
2,000
4,000
6,000
8,000
10,000
12,000
14,000
16,000
1994 1995 1996 1997 1998 1999 2000 2001
US$
mill
ion
(cur
rent
)
Official net resource flows Private net resource flows
Source: Global Development Finance (2003)
Figure 4 : Aggregate resource flows by type
-1,000
1,000
3,000
5,000
7,000
9,000
11,000
13,000
1980 1990 1995 1997 2000
US$
mill
ion
(cur
rent
)
Portfolio equity flows
FDI inflows, net
Grants
Net flows on long term debt

24
The switch away from debt finance is the result of the drying up of fresh loans relative to
repayments. The negative net flows on long-term debt in Figure 4 indicate that repayments
exceeded disbursements. Individual country situations may vary, but this is broadly relevant for
many Arab and other developing economies. The rise in the importance of private financial inflows
meant that the later 1990s saw more active loan syndication, but also better capital market access
and longer-term credit. Mixes used across countries reflect a host of factors, including experience.
Figure A1 in the appendix shows that the period 1997- 2001 was an active period for loan
syndications by Arab borrowers, compared to a trickle previously. Figure A2 shows that both Egypt
and Qatar had access to syndicated loans, the difference in income levels notwithstanding.
The most significant change in the aggregate resource flow to the region is not the weakening of
official lending, although payments to official creditors of the Middle East and North Africa have
been negative for some time (Global Development Finance 2004). Rather, it is the appearance of
non-debt creating inflows. In other words, since the late 1990s, portfolio and direct investment
finance have become a visible component of financial flows to the region. For the thirteen Arab
countries considered, private equity flows for borrowers exceeded debt payments in importance in
1997, with percentage changes shown in Table 2. In that year, FDI accounted for about half of
aggregate flows, thereby exceeding grants for the first time in the region’s recent financial history.
1997 FDI into Arab countries according to the World Bank estimate totalled $3 billion, out of $170
billion of FDI in the developing world. Other sources provide further support to changes featured
here (Joint Arab Economic Report 2002; ERF Economic Trends 2002; World Bank, Global
Development Finance 2003).
Table 2: The composition of aggregate net resource flows
1990 1997 2000
Net flows on long term debt 12% 4% -6%
FDI inflows, net 11% 50% 46%
Portfolio equity flows 0% 13% 3%
Grants 77% 39% 26%
Source: World Bank, Global Development Finance (2003) Note: Bahrain, Iraq, Kuwait, Libya, Qatar, Saudi Arabia, UAE are not covered by the data.
Compositions and mixes are of course very varied, because flow data are sensitive to individual
financing deals or investment activities being completed. The important point here is the qualitative
change. Similarly, whatever the current regional FDI inflows, clearly the region only secures a

25
marginal share of investment flows in the developing world. Further, sub-regional differences in
private flows attracted must be emphasised. As argued in Section 2, private capital has a well-
documented tendency to avoid countries plagued by poverty or high political risks. Hence, as with
other regions, private investment flows are concentrated on a few Arab recipients: Saudi Arabia,
Egypt, Morocco, and Tunisia. Poorer Arab countries and countries with under-developed financial
structures remain dependent on official funding and grants. An important exception is Yemen,
which embraced FDI as soon as it started liberalising its economy in the mid-1990s, with greenfield
FDI being the only source of finance for its burgeoning oil sector. Sudan has also allowed IOCs to
establish oil production, but without an overall drive to open the economy.
Finally, private and official bilateral capital is not entirely independent in practice. Official
sanctioning may precede private capital entry in some countries. Economic history abounds with
examples of public- led rallies and politically motivated economic rescue programmes. For example,
Egypt’s situation after 11 September 2001 was reminiscent of the aftermath of the 1990 Gulf War
when the USA cancelled its civilian and military debts. At a special summit in February 2002,
Egypt’s donors pledged $10.3 billion over three years (Megalli and Noeman 2002). Until recently,
pariah states (Libya, Iraq before 2002) received no Western private flows to speak of, with US and
other Western entities forbidden to operate in the oil sectors.
5. An overview of Arab financial markets
Since the late 1980s Arab financial sectors have witnessed significant transformations, which have
been the subject of numerous studies, the latest including Wilson (2003), Fgrais and Zkantur
(2003), Creane et al (2003). In a nutshell, most Arab economies have implemented a first wave of
reforms, including some liberalisation of credit and interest rate regulations, and the setting up or
strengthening of non-banking financing institutions. Significantly, these reforms have reduced the
capacity of monetary authorities to direct credit or to impose involuntary holding of government
debt, though they are yet to reduce the prevailing domination of state banks. Further, financial
intermediation remains weak, and liquidity will remain high, pending a more effective mobilisation
of savings. Even in Gulf economies, whose modern banking sectors are relatively independent from
monetary authorities, non-banking institutions remain relatively underdeveloped. Hence, the region

26
still has a long agenda before achieving significant financial modernisation and deepening, the
details of which vary among countries.18
The reform programmes, as well as regulatory and institutional changes have contributed to the
increase in the volume and diversification of the types of private financial inflows to the region. As
indicated in Section 4, the increase in private flows has meant that in most Arab countries fresh
private finance makes a greater contribution to total flows than official finance. Private flows have
grown substantially from low initial levels, although they remain small in comparison to other
developing regions or to local economies. Most significantly, external private flows are no longer
limited to bank loans. Non-debt financing in the region has expanded to include greenfield
investment, bonds, equities, and capital market participation, which this section considers in turn.
Note that data sources are not consistent in coverage. The World Bank’s coverage is more
comprehensive in terms of the types of flows monitored, but excludes Bahrain, Iraq, Kuwait, Libya,
Qatar, Saudi Arabia, and the UAE. UNCTAD monitors investments flows and stocks for all
countries, but little else. Arab organisations, which monitor all Arab countries, tend to reproduce
data from international organisations, and occasionally use national and in-house estimates.
Beginning with FDI, the World Bank puts total FDI in Arab countries in 1998- 9 at $3 billion. The
more comprehensive UNCTAD data (which include Gulf countries) refer to an average of $3.98
billion of FDI inflows in 1992-97 rising to $7.17 billion in 2000- 2003. Eid and Paua (2002), who
use UNCTAD data, indicate an average of $4.9 billion in the last five years, and state that the share
of the region in FDI inflows to developing countries fell from 4% in 1998 to 1.9% in 2000.
Interestingly, in line with rising South-South investment, inter-Arab investment has been expanding
since 2000, reaching $2.9 billion in 2002 (Inter Arab Investment Guarantee Corporation, 2002).19
Table A3 shows UNCTAD data on FDI inflows to the region.
In terms of the domestic economy, according to the World Bank, FDI flows reached a peak of 2%
of GDP in 1992, retreating to 1% in 1997- 8, and weakened slightly thereafter. In Saudi Arabia, the
largest recipient in the region, FDI stocks in percent of GDP in 2000 were at the developing country
18 Creane et al (2003) rank Arab economies in terms of financial development. Eight economies achieve a high score (Gulf Cooperation Council, Jordan, Lebanon), five a medium score (Algeria, Djibouti, Mauritania, Egypt, Morocco), the rest are poorly developed.

27
average of 16%, but below the 96% scored by Singapore (Eid and Paua 2002). While a good
proportion of FDI flows to developing countries was mobilised through privatisation, this has not
been the case in the Arab world, except perhaps in Morocco. Only 10% of FDI inflows received in
1996- 2000 were through privatisation. In the period 1990- 96, privatisation in Arab countries
amounted to some $5.7 billion compared to $69.8 billion worldwide. Foreign investors accounted
for under $600 million of regional proceeds (AMF, Joint Arab Economic Report 2001). By the
same token, flows due to mergers and acquisitions, which had risen on the back of privatisation in
Latin America, have been negligible in the region.
It must be stressed that FDI figures do not include funds secured through JVs or PSAs in
hydrocarbon sectors. For example, Qatar’s FDI inflows ranged between $113 and $418 million in
1997- 9, when its external exposure increased by over $1 billion due to its gas projects. In 2001,
Qatari FDI inflows and Gross Domestic Investment stood at $296 and $2,847 million respectively.
Thus, FDI flows are a poor measure of total investment activities in oil and gas. This lack of data is
a major obstacle to an accurate assessment of the capital requirements of Arab hydrocarbons
sectors.
As to other types of private inflows, portfolio equity flows20 are still small relative to domestic
economies despite having grown from $163 million in 1992 to a peak of $2,259 million in 1997.
Their performance has remained lacklustre in the years 2001-2003, at least when compared with
FDI flows (Global Development Finance 2004). Sustained growth in levels has not improved their
marginal importance. Arab domestic bond markets also lack depth and volume, and are furthermore
dominated by the issuance of government paper. According to Azzam (2000), the total value of
corporate bonds stood at $5 billion compared to $87 billion of government bonds. In other words,
local corporate bond markets are yet to function as a significant new source of long-term financing
for corporate borrowers. The world of large corporations with a wide shareholder basis in Arab
countries is still small. Average sized companies continue to rely largely on bank borrowing. Only
larger entities, including Arab NOCs, tend to use international or local capital markets. This is
another link between financial structures or exposures, and Arab O&G activities. Qatar broke new
grounds in 1996 with the $1.2 billion Eurobond issue to finance gas projects, and in which the
Qatari General Petroleum Company was involved. The Qatari issues indicated a new mix of finance
_____________________________ 19 These investments exclude O&G, and are concentrated in services, industry, and agriculture. A recent survey by three Arab investment boards indicate a huge potential for this flow, as the current rise is occurring despite a typical lack of awareness of opportunities in neighbouring Arab countries. 20 Portfolio equity flows are the sum of country funds, depository receipts, and purchases of shares by foreign investors.

28
in O&G, where capital markets supplement commercial loans and export credits. As such, they
have been mentioned in several recent publications by international financial institutions.
More generally, it was only in the 1990s that Arab financial systems expanded to include local
capital and stock markets. However, these capital markets remain small, thin, and lacking in depth,
despite sustained government support, and despite the fact that thirteen Arab stock and securities
exchanges are now established. Typical indicators such as turnover ratios or days traded are way
below international and emerging market averages. The immaturity of Arab markets is indicated for
example, by the absence of secondary bond markets. This in turn means that published yield curves
are missing, except perhaps for government paper. Without published yield curves and without the
clearing mechanisms and facilities available in more mature markets, Arab capital markets cannot
be integrated into global indexes or global investment funds.21
As to listed companies, the total number had increased by about 50% by the late 1990s, reaching
1,723 companies in December 2003 (Arab Monetary Fund website), which compares poorly with
5,863 listed in India and 725 in South Korea in 2000. Egyptian companies account for a large
proportion of this number. Another distinguishing feature of Arab capital markets is that the y
contain an over-representation of government companies and financial institutions. Hence, such
companies account for 40% of the Saudi market, and 50- 60% of listed companies relate to Arab
financial sectors, although the latest data indicate widening participation by other sectors. That is
not surprising given that state-owned enterprises and banks are often the largest corporations, and
have structures allowing them to be listed, if only for the fact that they are not family-owned.
Financial institutions also have the relevant experience to engage in this avenue of financing. The
narrow range of capital market participants underlines the paucity of regional institutional investors,
mutual funds or insurance companies, which are major actors elsewhere.
The nascent Arab capital markets are therefore only beginning to acquire significance in terms of
the local economies and financial systems. Total market capitalisation in 2001 was at $152.2
billion, a modest 21% of GDP. The capitalisation of the Saudi market of 40% of GDP pales in
comparison with the market capitalisation of Switzerland of 261% of GDP (Allen 2000). In 2002,
market capitalisations in Latin America and Arab countries reached $419 and $208.9 billion
21 Previously, the small market capitalisation was seen as the main obstacle. According to Abdelrazzak (1999), Arab capital markets capitalisation equalled a mere 0.1% in Morgan Stanley’s emerging markets index.

29
respectively. 22 The rallies witnessed by Arab capital markets since 2002 are closing the gap, but
there is still a long way to go. Total market capitalisation almost tripled to $363.8 billion in 2003,
jumping to $622 billion in 2004 (AMF Quarterly Bulletin December 2004). The capitalisation of
markets in Qatar, Bahrain, Jordan and Kuwaiti exceeded 100% of GDP, with the Saudi market at
74.6% and Morocco at 29.5% (Joint Arab Economic Report 2004). Capital markets are also
secondary in importance in terms of the sources of credit available to local economies. Average
market capitalisation of 27% of GDP in 1998 for the region was below the share of banking credit
in GDP of 59% (AMF, Joint Arab Economic Report 2001). In 2003, the average market
capitalisation had risen to 50%, but was still below a largely unchanged share of banking credit in
GDP (Joint Arab Economic Report 2004). On their own, Arab capital markets will not revive the
dull performance of Arab domestic savings and investments. Their presence has opened a route of
venture capital, but the tradition of setting up enterprises through this route is largely embryonic.
Lastly, the small size of Arab stock exchanges has been a double-edged sword. On the one hand,
these markets are relatively insulated from international financial crises. On the other hand, they are
more vulnerable to political instability or economic downturns: indicators quickly and significantly
affected by single events. Regional capital markets suffered a severe blow from political tensions in
the aftermath of 11 September 2001 and the war on Iraq. Market capitalisations and trading
volumes fell by over 10% in 2001 in most Arab stock markets (ERF Economic Trends 2002).
However, the stellar rise of Arab capital market values since 2002 has surprised observers. Despite
highly volatile trends of daily indicators, and continued political shocks, over the last two years
Arab stock markets have continued to deepen, and markets have largely retained the remarkable
growth in value. Apart from speculative interest, these markets have seen many successful public
offerings of shares. Thus, stronger inter-Arab trade, the good gains on a year-to-year basis in
virtually all Arab capital markets, the continued over-subscription on most public offerings, and the
good take-up of government bonds, all emphasise that domestic investment will be an important
source of economic and financial stability for the region.
22 These figures are taken from the World Bank’s Development Indicators and the Arab Monetary Fund’s database published on their respective websites.

30
6. Trends in the financing of Arab oil and gas
In Section 2 it was shown that international private finance for developing countries remains low in
volume, and is focused on particular countries and on investment-grade opportunities. Section 3
argued that natural resources and oil and gas in particular have always been important recipients of
this finance, even at times of recessions, thanks to their strategic importance, contractual
arrangements that eased uncertainties, and the possibility of securing repayments using output
revenues. Oil and gas finance has always involved tri-partite contributions from IOCs, NOCs, and
host governments. The first group had the most substantive and steady access to international
capital flows, if only because of their size, experience, and positions in the world. Financing by the
other two groups is influenced by the type of partnership they were willing to see in the downstream
and upstream sectors, other budgetary commitments, and their ability to tap the type of international
finance on offer. Section 4 considered Arab external financial structures, which are rarely related to
the main economic sectors. While substantial oil revenues have helped many Arab countries
maintain a status of net creditors, the use of export credits to finance O&G activities – i.e. the need
to spend on oil and gas - has been overlooked. Section 5 noted a shift towards private flows in the
composition of the fresh external financing sought by the region, which was underpinned by the
expansion of financial markets beyond their traditional focus on banking. The range of savings and
types of resources mobilised domestically and internationally is wider, although the quantitative
change is not overwhelming. This section argues that at the regional level, the financial history of
Arab O&G sectors falls within these described patterns. A summary of this history is constructed
using these patterns, and the historical outline of O&G financing found in the Arab Petroleum
Investments Corporation (APICORP) 23 publications (1999, 2002, 2003, 2004). APICORP has been
directly involved in that history, and the individual project and country data are uniquely available
to them.
In a nutshell, the 1ate 1970s/early 1980s were dominated by state spending on production and
export activities, the state being the main economic actor throughout the region. This dominance is
reflected in the official nature of external funding, specifically in the concentration of export credits
on oil and gas. Export credits have therefore always been central to O&G activities, Arab financial

31
structures, and international capital flows to the region. On the other hand, it is not possible to detail
the distribution of O&G spending between ministries and NOCs, or within their budgets, mainly
because of a lack of consistent and readily available disaggregated data.
Nevertheless, by the mid-1980s, a resort to regional and international bank lending to supplement
in-house resources emerged against a backdrop of falling oil revenues. This constituted a further
link between O&G financing and regional debt profiles in that period, and contributed to the
noticeable external borrowing of Arab oil exporters depicted in Figure 1. The 1980s also witnessed
a shift in government policy to indirect support for O&G, through fiscal measures or spending on
infrastructure. Government involvement in that way would have created additional macro-economic
linkages between O&G and the rest of the economy, in so far as it involved domestic credit use or
engaged the private sector to build the infrastructure.
By the 1990s, the sector followed a worldwide trend of relying chiefly on corporate finance. The
financial institutions, which came to provide between 60 and 70% of the funds required, were also
more heavily involved in the projects. Therefore, the state of domestic and international financial
markets and the way they favoured a particular instrument or financial package had more impact on
Arab oil and gas. However, the long-term nature of the financing required and scale of activities of
the sectors presumably excluded the influence of fads or bubbles associated with short-term capital.
APICORP considers that the region’s O&G benefited from the international banks’ appetite for
major strategic projects in the 1990s. By that time, Arab hydrocarbon sectors had evolved
enormously, not only in terms of their output and activities but also in terms of the development of
their downstream sectors. Interested investors now had a wider range of activities to consider,
which governments were no longer willing to or capable of controlling. This reflected persistent
budget deficits and government commitments in other economic activities, as well as the
increasingly tangible erosion of étatism throughout the region. While this may have been less the
case in say, Algeria, it would be more so for Saudi Arabia or the UAE, where downstream efforts
aimed at the industrialisation and diversification of their economies. Such efforts involved state
nurturing of the nascent industries, but not necessarily a permanent control by the state.
_____________________________ 23 APICORP is an inter-Arab joint stock company set up in 1975 by the Organization of Arab Petroleum Exporting Countries. It is mandated to provide equity investment, finance and specialised advisory services to the hydrocarbon and energy industries in Arab countries; initiate and participate in related projects; provide financial guarantees for medium and long-term loans; co-finance short-term trade of Arab petroleum, gas and petrochemicals; and to be an active shareholder or underwriter of Arab companies in the industry.

32
Following the East Asian and other financial crises, APICORP finds that financiers in the late
1990s shifted their attention away from factors concerned with the success of projects, to contracts
granting them priority in repayment and more control over financial arrangements. Arab moves to
external financing of O&G reflected this shift, with the financing phase of the late 1990s until the
present described as the limited recourse finance phase. APICORP emphasises that the segments of
Arab O&G which have been and are likely to continue to be financed in this way are natural gas,
refining, and petrochemicals.
In this phase, lenders’ participation in sovereign finance has become increasingly dependent on
their ability to control for credit risk and to enforce repayments. In agreement with arguments in
Section 3, among other policies, lenders sought to reduce credit risk through insurance covers from
export credit agencies. As ECAs have always been active in world trade, presumably what
APICORP means is that financiers were more likely to use this sort of guarantee to protect
themselves. The advantage from the borrowers’ point of view is that such guarantees can lower the
costs of borrowing (through narrower spreads or an extended loan period). At the limit, some
borrowers would not be able to secure funds without official guarantees.
Other policies to reduce risk aversion and improve lenders’ appetite have been the use of credit
enhancements, and specific clauses concerning repayment arrangements (for example, escrow
accounts or off- take agreements). As argued in Section 3, oil and gas sectors are ideally placed to
meet these contractual requirements. The IMF considers that O&G have under-used the
‘secur itisation of future flows of receivables’ for funding investments. The example it mentions is
PEMEX, with few other deals exploiting this potential since 2000 (Kether and Retha 2001). Three
explanations can be advanced to explain this apparent under-utilisation:
• Oil revenues may have increased enough to avoid the need to pledge future
receivables.
• Such securitisation is only usable by NOCs with advanced corporate structures.
Escrow accounts are a simpler arrangement that is amenable to economies and
entities with less advanced financial systems.
• Oil and gas revenues are the main source of funding for most government activities.
Therefore revenues would be used up by current spending. What is left for capital
investment is less than the IMF assumes.

33
APICORP notes an increasing stringency in deals secured: contracts have become more complex
and more demanding in terms of disclosure, in an increasingly standards-driven environment. Fuller
disclosure is demanded as a result of practices required by international financial and statistical
organisations of which Arab countries are members. The current period has also witnessed a
widening of the range of financial options used, including project bonds. In other words, the sector
now uses a great variety of financial instruments, reflecting the increasing sophistication of world
financial markets. Arab O&G would be able to use instruments to the extent that their own financial
markets and regulations are mature enough to permit it. As Section 5 showed, this is only just
beginning to happen in the Arab world.
APICORP has been the main source of estimates of investment needs in Arab O&G, reflecting its
first-hand experience. These estimates are compiled using its extensive database of projects
realised, underway, or planned. They decompose amounts required by sector and funding sources.
The former covers oil, gas, refining, and petrochemicals, while the latter is divided between
domestic equity or self- finance, foreign participation, and commercial sources (bank lending).
APICORP’s figures for the oil sector are based on a 1999 study of investment needs for the period
1998- 2003. A precursor study was published in 1995, and three subsequent versions in 2002, 2003,
and 2004.
Additional investments needed are estimated in 2004 at $120 billion for the next five years (i.e. at
$24 billion a year). The funds needed by Arab O&G are expected to be higher than previously due
to the rolling over of project proposals and the inclusion of modest projections of $18 billion for the
rehabilitation of the Iraqi oil and gas industry. The estimated capital required is distributed
approximately as follows:
- $40 billion for natural gas
- $56 billion for oil (recovery, production, and refining)
- $24 billion for petrochemicals and fertilisers
APICORP’s estimate of distribution among industry segments is depicted in Figure 5. The estimate
for both oil and gas now stand at $96 billion, which is higher than the $84 billion estimated at the
end of the 1990s.

34
The estimates do not appear unreasonable. Running all Arab O&G sectors at their current output
levels must involve much larger current expenditure, especially if allowance is made for depletion,
depreciation, upgrading and expansion. Therefore, APICORP projections probably refer to new
capital expenditure needs, rather than the total expenditure of all Arab oil and gas.24 In effect, they
are top of the range estimates of the financing gap that would emerge if all projects (including those
still on the drawing board) were to be completed, with revenues remaining unchanged. In fact,
project details for refineries and natural gas show that current and approved projects account for
nine in 21 and eleven in 23 listed projects respectively. The rest are still on the drawing board.
Thus, APICORP figures are an indication - rather than a measure – of foreign financial inflows that
Arab O&G could need if current plans were implemented. It must be stressed that:
- There is an explicit assumption of modest world prices and hence an implicit assumption
that O&G revenues will no t increase;
- As with other industries, projects for expansion in particular depend on demand expectations
and the call within that on Arab O&G, not just on finance availability
The first assumption has already been overtaken by the price rises of 2004- 2005. These have
generated surpluses of $200-300 billion, i.e. levels not seen since the 1980s.
24 The original texts are ambiguous. The Arabic 2002 paper uses the term ‘investment needs’, while the English 2003 text mentions an ‘external financing gap’ that could arise from projected needs.
Figure 5: APICORP's expectations about distribution of O&G investments, 2004-2008
21%
26%33%
20% Maintenance,exploration, & recoveryExpansion & refining
Natural Gas
Petrochemicals
35
With regard to oil sectors, the estimates are not clear about the distribution of investments between
maintenance, recovery of depleted reserves, and current expenditure (on lifting, transport, and so
on). The expansion rate is not stated, but presumably varies across country. Previously, extra funds
needed to maintain cur rent oil production capacity were estimated at $27 billion in 1999.
Projections were based on a cost-per-barrel analysis done in the late 1990s by a London-based
consultancy. The sensitivity of projections to alternative cost estimates has not been tested, and it is
not clear if more recent costs per barrel are now being used. Currently, APICORP puts
maintenance, exploration and recovery spending at $5 billion a year, or $25 billion between 2004
and 2008.
The explicit itemisation of maintenance outlays, as opposed to a previous focus on new
expansionary projects is welcome. It highlights the fact that depletion and depreciation require
substantive commitments that need to be itemised in financing frameworks. The importance of this
item of capital expenditure is also substantiated by the fact that 22 in 44 current and approved
projects in refining and gas are for upgrading existing facilities. 25 Note that there are no easily
accessible historical data on the issue, and understanding it is largely restricted to media alerts and
public announcements. For example, Kuwait only acknowledged under-spending on maintenance
following accidents in 2002.
We also have little information on budgetary allocations to non-physical capital, namely human
capital, and technology development or acquisition. The capital- intensive nature of the industry, and
the continued progress in technologies and instrumentations used in drilling, recovery, and so on,
require major players to invest heavily in these aspects. These investments not only have a direct or
immediate bearing on the costs of production per barrel, but also affect the long-term efficiency of
operations, and the competence with which the companies involved manage the resources. The
budgetary plans revealed in the wake of the rise in oil revenues since 2004 confirm the importance
of upgrading and improving existing facilities, and of educational development throughout the
region. Thus, the sector should benefit from a revival of public capital spending, although
educational allocations are not sector specific.
25 APICORP does not provide similar decompositions for oil.

36
APICORP project information and analysis highlights differences in the financial mixes used and
available to oil and gas. The current debt/equity ratio it anticipates for O&G as a whole is 40% to
60%. Unsurprisingly, equity, which refers to self- finance and sponsors participation, remains
largely an in-house affair for the upstream sector. Historically, bank lending has provided between
10% and over 50% of O&G projects, so that the debt ratio assumed is reasonable. Bank lending can
be in the form of loans as well as other instruments. As previously discussed, the positive effect of
ECA support and of export revenues on sovereign risk are useful in explaining the sustained bank
presence in Arab O&G projects at a time of banking retrenchment elsewhere.
While APICORP anticipated that spending required to sustain current levels of production (i.e.
enough to replace depleted reserves) would be $5 billion a year, its estimate for ‘oil expansion and
refining’ stands at over $6 billion a year, and $31 billion till 2008. This compares to $40 billion that
the gas sectors need. Therefore, as in previous sectoral plans, natural gas continues to be allocated
over half of the commitments for production and expansion. It seems that natural gas is the segment
most likely to grow rapidly, driven by downstream and export schemes. At least this was the view
prevailing before the current rises in crude prices.
APICORP notes three further features of Arab O&G financing. Firstly, bank lending will remain
focused on export-oriented projects. This mostly refers to oil products, petrochemicals, and LNG.
Commercial loans would be easily available for such projects, particularly in the downstream and in
gas, because of the direct linkage to export revenues. Secondly, while project finance is expected to
account for some 36.4% of investment funds, its projected share in gas is higher at 55%, and much
lower in oil production.
Arab gas production, which was developed later, seems to have been relegated to the financial and
technological charge of IOCs. As early as 1997 Mohamedi showed that IOCs were invited to build
the UAE’s gas facilities in the 1970s, and were similarly in charge in Oman and Yemen between
1997 and 1999. But the gas industry also lends itself to a kind of economics that is more
Table 3: APICORP's decomposition of sources of financing in Arab O&G, 1998-2003Oil production Refining Natural gas TOTAL
Sponsor & self finance 65.0% 38.1% 29.1% 48.1%Foreign Capital 25.0% 7.4% 14.6% 18.3%Banks 10.0% 54.8% 56.4% 33.8%Total investments (US$ billion) 25.0 9.7 17.3 52.0Source: Arab Oil & Gas Directory (2001); Al-Marraj (2002)

37
comparable to other industries. The issue of guardianship and ownership of reserves has little effect
on industrial structure. The main constraint here is the very long-term physical and financial capital
required for the chain of investments needed to produce the gas and bring it to market. In turn this
has involved long-term partnerships between IOCs, NOCs, and customers, with financing
dominated by long-term bank lending. Recently, equity tended to be used to spread risks,
particularly in LNG and new ventures. Hence in the case of gas there has been a greater resort to
and ability to use project finance.
With private finance already engaged in meeting the capital needs of a good proportion of Arab oil
and gas projects, trends affecting international and domestic financial markets have a direct bearing
on their financing prospects. For the remaining proportion, particularly in the upstream, it seems
that the financial health of host government and NOCs will determine their borrowing strategy, or
whether they turn to the IOCs. Currently, as argued at length, international capital flows are weaker
than previously, while domestic financial markets have expanded in maturity, depth, and size.
Therefore it is vital to nurture the regional financial basis, especially given that information adduced
so far does not suggest that Arab O&G have suffered shortages of private capital; rather, it shows
that the sectors have begun to engage domestic banks and local investors. The importance of local
investors cannot be over-emphasised given their resilience in the face of regional risks relative to
more nervous and volatile international capital flows.
APICORP project information indicates that the patterns of Arab O&G financing have underpinned
the following developments in financial markets:
• A retreat of international banks;
• Increased participation by regional and international financial institutions; and
• Rising interest from local investors and capital: local financial participation levels
(presumably private finance) are between 40 to 50% of investments.
APICORP data on the distribution of financing between international and Arab banks since the late
1990s indicate a trend of reduced final take by major international banks. However, APICORP
warns against concluding that international banks have definitely turned their back on Arab oil and
gas per se. This trend is mostly due to their global policies of concentrating on the syndication

38
while reducing underwriting exposure. As argued in Section 3, were it not for the nature of the
industry, the reduction in participation would have been more severe.26
In contrast, the final take by Arab banks in total lending to O&G rose from a range of 15 to 20% in
1996-7, to 50 to 60% in 2001, and 25 to 45% in 2002. Similarly, according to al-Farrag (1999),
participation and subscription of Arab capital in twelve loans over the period 1995- 9 reached 40%
of total finance, amounting to $9.8 billion. Financial deepening and development also allowed Arab
banks to hold a wider and more sophisticated range of financial instruments, whose maturity has
lengthened noticeably since the 1980s. In turn, this enabled Arab oil and gas to widen the range of
borrowing instruments available to it directly, or as part of government support.
Arab private finance houses could consolidate their support to O&G if they continue to mature and
expand their capital bases. Moreover, they are expected to prove innovative enough to create
instruments that would tap Islamic funds, noting the generally long-term perspective of Islamic
instruments being particularly suited for O&G projects. Islamic bonds or sukuks, whose regional
market size is estimated at $2.5 billion, are already in use in real estate, power projects and
telecommunications. They were a theoretical possibility in the case of oil and gas until 2005. For
now, Arab financing institutions are still held back by their relative ly small size, their inability to
engage in very long- term lending, and other sectoral problems (APICORP 2003 and 2004; Wilson
2003). Hence, Arab bank lending to the region’s hydrocarbons sector is likely to become more
important, without gaining prominence in the short term.
As to the increased interest and exposure by international and regional financial institutions, the
involvement of the former is not different from their activities in other regions. Rather, Arab O&G
projects are now more likely to tap on this source. An important example here is the role of the
European Investment Bank (EIB) in financing international tranches of projects to export gas to
Europe (specifically from Egypt and Algeria). Previously, EIB financing in the region had
concentrated on power sector projects.
26 BIS data on syndicated loans reveal that the period 1997- 2001 was very active across all Arab countries. By contrast, during 20012003, only richer economies (Qatar or Saudi Arabia) were really accessing banking finance.

39
Among regional institutions, a key player is APICORP, whose participation is representative of that
class of lenders. Its final stake in O&G projects rose linearly from $28 million out of $1.8 billion in
1994, to $436 million out of $4.3 billion in 2002 (from 1.5% to 10% respectively), reflecting a
growing capital base and experience.
In the absence of direct measures, the widening participation by Arab investors (other than local
banks) has to be gauged indirectly. One broad development has been an increase in inter-Arab
investments in O&G, for example Sonatrach’s exploration activities in Yemen and joint ventures in
Lebanon and Egypt. Other Arab companies have become important players in servicing and
construction aspects of O&G projects, for example the involvement of Abu-Dhabi’s National
Petroleum Corporation in the construction of the platform topsides in QatarGas (International
Petroleum Encyclopaedia 1995).27 These developments could not have been contemplated under
old company structures or investment regimes.
Another broad development is that local private companies are now a visible and fairly substantive
group of agents. As documented, for example, in the Joint Arab Economic Report 2002, some O&G
companies were sold as part of Arab privatisation efforts, a trend well established across the region
(except in Syria and Libya). Other companies emerged as a result of the corporate restructuring of
NOCs. New companies were also established by public offerings, an option made possible by
capital market developments. As an example, SABIC, the Saudi petrochemical giant, initially set up
by the government, moved from creating affiliates through joint ventures to using market flotation,
as with the 1995 establishment of Ibn Rushd (its polyester affiliate) as a joint stock company with
52% private ownership (al-Farrag, 1999).28
A positive offshoot of financial reforms is that Arab private sector oil and gas activities have also
trickled into Arab stock markets, which have therefore widened the platforms available to O&G to
mobilise investments. This participation represents a notable qualitative change over previous
periods, although the numbers involved are not significant on a worldwide scale. However, as
previously argued, Arab stock markets are still small and are dominated by financial institutions and
large government companies. NOCs are not among them. In fact, there are current ly only 23 O&G
companies listed in Arab stock exchanges - which is well below the 205 private O&G companies
27 In 2003, OAPEC issued a directory of all Arab O&G companies that are allowed to do business abroad, in an effort to overcome information barriers to increased intra-Arab co-operation and investment. 28 See also SABIC’s web-site on www.sabic.com.

40
operating across the region. 29 With immature capital markets and current company types, the bulk
of the support that can be provided to Arab O&G still lies in banking institutions and multilateral
funds.
The ownership distribution of oil and gas companies, summarised in Table 4, attests to the growing
involvement of the private sector. The table is based on the regional company database of Zawya
(an internet information service). The number of companies tabulated should not be taken to imply
a fragmented industrial structure: the industry is dominated by vertically integrated companies.
These consist of ten NOCs and six oil majors operating in Arab O&G, as well as a number of
smaller Russian, Chinese and Canadian IOCs. Therefore, the lion’s share of companies counted by
the database consists of subsidiaries and segments of IOCs and NOCs.
Significantly, listed Arab companies are concentrated in two segments: distribution & marketing,
and refining & petrochemicals. In contrast, among the 54 privately owned foreign companies, 33
are in production, and 15 are in field services. However, foreign participation in the sector goes
beyond that. A closer look at the list of 205 private local companies reveals that many consist of
joint ventures or affiliates of foreign companies with a local ownership majority. Foreign expertise
and capital underpin a good part, if not most, of the entities active in Arab O&G, reflecting the
international nature of the industry.
29 See ‘Company lookup’ on www.zawya.com.
Table 4: Companies in Arab O&G by ownership type and sector
Local/Joint Venture Foreign Oil and Gas Production 43 14 33 90 Distribution and Marketing 26 59 4 89
of which Listed 10 Oil and Gas Field Services 18 81 15 114
of which Listed 1 Petroleum Products 6 15 0 21
of which Listed 1 Pipelines and Shipping 21 6 2 29
of which Listed 1 Refining and petrochemicals 65 30 0 95
of which Listed 10 TOTAL 179 205 54 438
Source: http://www.zawya.com/cm/companylookup.cfm - 17 September 2004Note: Company total excludes the Iranian National Oil Company and 2 representative offices
PrivateGovernment TOTAL

41
The range of arrangements and company structures operating in the region is not just wide, but most
entities do not fall into clear business categories. This is clearly shown in Table 5. Roughly
speaking, it can be advanced that:
- When governments engage private foreign agents, they typically form closed joint stock
companies.
- Most private local companies have a ‘traditional’ business type (limited liability).
- Some Arab private O&G companies, essentially in the downstream, were launched or
transferred from public hands through capital markets.
Private local management and capital, therefore, has only recently assumed responsibility and in
only a segment of the industry. The more ‘traditional’ way in which Arab companies have been
active in oil and gas has been as providers of ancillary services, and as sub-contractors to NOCs,
supplying material and technical support.
To sum up, the overall pattern that characterises the industrial structure of Arab O&G is a world
centred around NOCs, whereby government divestiture from the hydrocarbons sector is gradual,
selective, and starts at the downstream. Private ownership, participation, or management of
downstream activities and related industries are allowed and relied upon. There are no Arab
integrated private oil companies. While local human and financial capital is more widespread than it
was a decade ago, production and the control of reserves remain firmly in state hands. Production
remains a field that local firms have not been able to snatch from foreign competitors: the main
battle here is still between IOCs and NOCs.
Table 5: Companies in Arab O&G by type Joint Stock Limited Liability Others
Foreign 3 1 49Private local 38 86 54Listed 3 0 20Government 34 18 127Total 78 105 250Source: http://www.zawya.com/cm/companylookup.cfm - 17 September 2004

42
7. QATAR: Main developments in oil and gas financing
Like many of its neighbours, the Qatari hydrocarbons sector is now thirty years old and has
undergone significant changes in its organisation, outlook and overall financial structure. The latter
change has been central to the transformation of Qatar into a leading gas exporter.
In terms of organisation, the development of Qatar’s oil sector is similar to that of other OPEC or
Arab producers, centring on setting up a NOC (the Qatar General Petroleum Company or QGPC, in
1974), initially assuming full control over resources, then evolving gradually towards more defined
(or less fuzzy) division of tasks between the ministries and the NOC. In the mid-1980s, cash flow
problems and the 1986 oil price crisis provided impetus for further change, particularly in terms of
opening up to foreign investors.
Thus, during the 1990s, unlike larger producers Qatar decided to try to expand its oil production and
reserves by entering into partnerships with IOCs. QGPC signed seven PSAs in that period (MEES,
15/12/1997), most of which concerned offshore blocks. This outward re-orientation of the Qatari
hydrocarbons sector coincided with overall efforts by Arab and developing economies to open up
their economies. On the domestic front, QGPC was streamlined and restructured. It was given
responsibility for procurement, and moved to unify the management of its operations. In 1998, it
was given the freedom to negotiate contracts. The ministries involved were also re-organised.30
However, it is the confirmation of the size of the huge gas reserves by the early 1990s that really
changed the sector and the country’s outlook and world positions. Qatar’s North Field is probably
the largest non-associated gas field in the world, and Qatari gas reserves stand at 509 trillion cubic
feet (EIA Country Analysis Brief 2004). While gas production was initially led and financed by Elf
and Sumitomo, the next phase of LNG production and export necessitated wider partnerships and
more advanced project development arrangements. The scale of the field, the need to build an
infrastructure, and the resulting overall costs of the first part of the projects at over $6.5 billion,
necessitated major overhauls and rapid change. To develop this massive resource, the small state
with its narrow domestic economy and limited financial and technical capacities expanded its
foreign partnerships. In financial terms, Qatar essentially opted for rapid development through
30 Further details can be found on QGPC’s website and in various issues of the Arab Oil & Gas Directory.

43
extensive borrowing from commercial and traditional sources. This policy has been known as a
rolling debt policy, or a mortgaging of future income, because entailed investments were to be
financed mainly by future oil revenue flows. Government revenues, it was hoped, would also come
from sales of associated gas liquids (condensates and NGLs).
The first phase of the project centred on QatarGas, a downstream consortium or special purpose
vehicle especially set up by QGPC, Mobil, Mitsui and Marubeni. It focused on setting up
production facilities, namely three 2 million tonnes a year (Mmt/y) or 97 billion cubic feet (bcf)
trains. The financing of this phase was ‘traditional’, i.e. a mix of syndicated bank loans, export
credits, and in-house resources. Hence, QGPC set aside a volume of crude for the purpose, i.e. part
of the oil revenues were earmarked for these investments. The finance included two $400 million
Euroloans, syndications led by Japanese banks, with participation by APICORP. Japan’s Export
Import agency provided a line of credit of $1.6 billion. As with most gas projects, long-term off-
take agreements were secured, mainly with Japanese utilities.
The second phase, 1996- 2002, aimed to bring on stream QatarGas and to set up another LNG plant
(Ras Laffan LNG Company or RasGas). RasGas involved the construction of two 3.3 Mmt/y or 163
bcf trains. The major shareholders here are QGPC and ExxonMobil. Mobil is also a production
partner in the North Field. For the first time in Arab countries, the financing involved the use of
international project bonds. RasGas bonds are still hailed as a prominent example of innovative
financial instruments for developing countries and for the O&G industry, which tapped into
additional sources of funds, and lengthened the maturity of the overall financial package.
The second phase of gas development was a clear departure from traditional financing mixes in two
fundamental ways. Firstly, the downstream sections were highly leveraged, i.e. financed mainly by
external debt: RasGas involved 75% in debt. This is higher than the average of 60% of debt used in
OECD mixes. According to Bartsch (1998), external funds accounted for 70- 75% of cost in most
parts of the project, except for the upstream leg of QatarGas plant (55%). Secondly and unusually,
Mobil had a direct stake in the output and reserves. The government was effectively a minor partner
in the finance provided, and in the production share of LNGs. Instead, it was to rely on the income
from NGL sales. The successful use of project bonds was crucial for achieving such participation
and securing the amounts required. Box 1 summarises the overall capital structure of the project at
the time of the launch.

44
Box 1: Global Capital Structure of RasGas LNG project:
Goldman Sachs issued bonds $1.2 billion, with 7 and 15 year tranches
Bank facility/syndicated loan $450 million (9 year maturity)
Export credits $900 (8.5 years)
Shareholder equity $850 million
Gas price guarantee by MOBIL $200 million
Spread over US Treasury rates 187.5 bpts and 135 bpts
A major feature of the global capital structure of Qatari projects, RasGas in particular, is the
involvement of key large industrial and financial players and the quality of the guarantees. Hence,
at their launch, the related bonds were over-subscribed and secured an A3 rating. The key
attractions highlighted in the project bonds’ literature at the time were:
• The strategic importance of the projects for Qatar and for the buyers
• The economic and financ ial strength of buyers (Korgas)
• The security of long-term agreements
• Minimal uncertainty regarding repayments due to offshore payments arrangements
• Clarity of legal framework
Unfortunately, the link to Korgas became a liability between 1998 and 1999, with the economic and
financial crisis in Korea and East Asia leading Moody to downgrade the ratings to Baa2.
Dailami and Hauswald (November 2003) attribute the success of project bonds to the ability of
bond covenants to take into account the interests of all partners, a crucial one being the security and
seniority of bondholders’ claims. In their analysis of RasGas bonds, ‘the largest and most liquid
global project bonds ever issued’, the authors found that the most important risk spread there related
to Korgas. Some spillover effects from emerging market events were also detected. By contrast, the
credit quality of offtakers and output-price contingent debt service by MOBIL, effectively reduced
the risk. The most important overall lesson to be drawn, the authors argue, is that market reception
of project bonds depends on their contractual structure, i.e. on how well the structure addresses
investors’ risk concerns. These bonds not only achieve lower costs and longer maturity for
borrowers, but they provide security to lenders by ‘deliberately matching debt service cash flow
profiles with payment ability’.

45
Again, we find the argument that hydrocarbon revenues act as secure collateral, especially if
contracts specify an offshore payment route. The second element that is clear from this financing
instrument is a contractual structure that is perceived by investors to take into account their interests
and risk positions. The fact that ExxonMobil was prepared to risk its financial reputation and put its
resources to alleviate risk aversion left little room for hesitation about the credit quality of the
package. In the current context of political turbulence and volatile capital markets in the Middle
East, such risk-reducing measures may be essential ingredients for accessing fresh commercial
funds. For the Qatari state and NOC, it was crucial to securing long maturities and excellent ratings
in an increasingly demanding credit market.
Therefore, Arab O&G agents hoping to be similarly successful in capturing international capital
flows need to be flagging the kind of credit enhancements and payment guarantees offered by
RasGas bonds. This is not to forget elements highlighted in the bond document such as:
• the clarity of legal framework
• the security of long-term agreements
• the strength of each partner in the project
As far as the host country is concerned, a key element behind its strength is the size of reserves
available to it. Country ownership of reserves can be flagged to strengthen a negotiating position in
the same way that super majors use reserves to advance their world position.
Unfortunately, while fresh financing in the region attempted to emulate rigorous contractual
structures, there were no other bond issues in Arab O&G in that period or indeed recently. Bond
financing of Arab O&G did not take off in the aftermath of Rasgas bonds. While part of the
explanation lies in the lack of international appetite for bonds, it is also the case that upstream
segments of the industry do not lend themselves to bond financing.
A third wave of expansion is under way. Apart from de-bottlenecking Qatargas, Qatargas II has just
completed financial closure, with a RasGas II venture to construct two additional LNG trains by
2008/9.31 In September 2003, Moody downgraded the Qatari ventures because of concern about
insufficient insurance provision for possible terrorist attacks, which other investors find adequate
31 This expansion would add 15.6 million tonnes/year in liquefaction capacity.
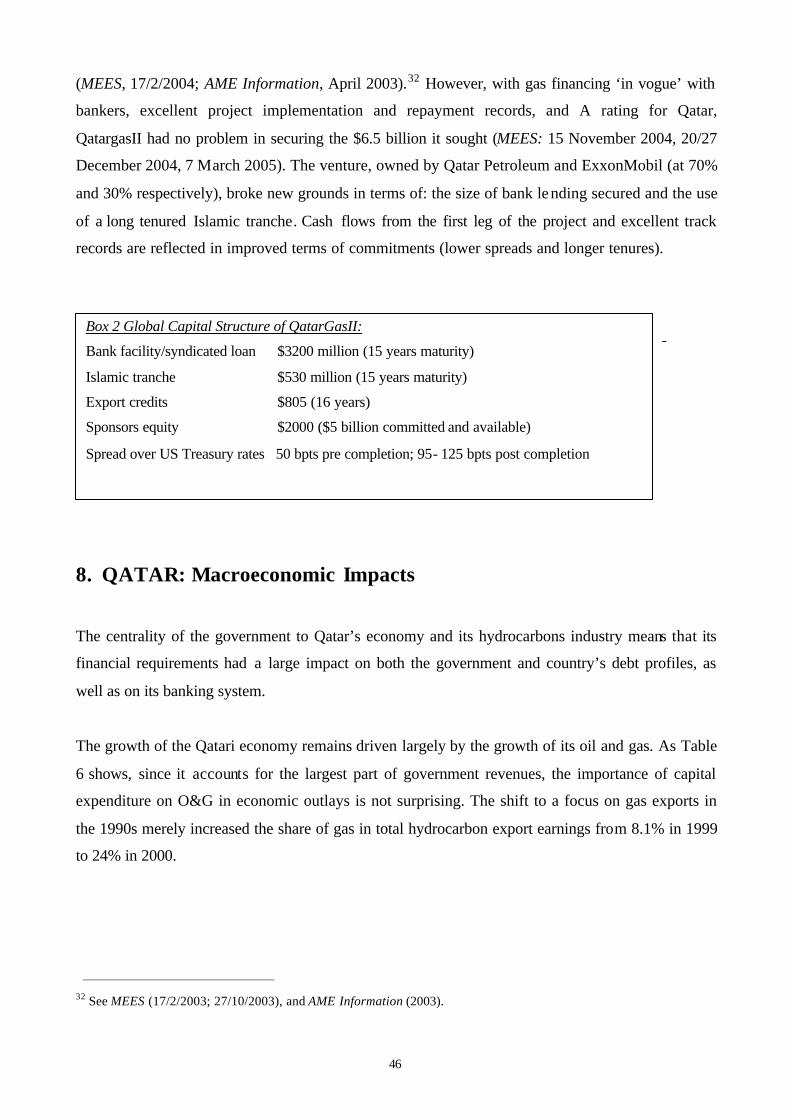
46
(MEES, 17/2/2004; AME Information, April 2003).32 However, with gas financing ‘in vogue’ with
bankers, excellent project implementation and repayment records, and A rating for Qatar,
QatargasII had no problem in securing the $6.5 billion it sought (MEES: 15 November 2004, 20/27
December 2004, 7 March 2005). The venture, owned by Qatar Petroleum and ExxonMobil (at 70%
and 30% respectively), broke new grounds in terms of: the size of bank lending secured and the use
of a long tenured Islamic tranche. Cash flows from the first leg of the project and excellent track
records are reflected in improved terms of commitments (lower spreads and longer tenures).
8. QATAR: Macroeconomic Impacts
The centrality of the government to Qatar’s economy and its hydrocarbons industry means that its
financial requirements had a large impact on both the government and country’s debt profiles, as
well as on its banking system.
The growth of the Qatari economy remains driven largely by the growth of its oil and gas. As Table
6 shows, since it accounts for the largest part of government revenues, the importance of capital
expenditure on O&G in economic outlays is not surprising. The shift to a focus on gas exports in
the 1990s merely increased the share of gas in total hydrocarbon export earnings from 8.1% in 1999
to 24% in 2000.
32 See MEES (17/2/2003; 27/10/2003), and AME Information (2003).
Box 2 Global Capital Structure of QatarGasII:
Bank facility/syndicated loan $3200 million (15 years maturity)
Islamic tranche $530 million (15 years maturity)
Export credits $805 (16 years)
Sponsors equity $2000 ($5 billion committed and available)
Spread over US Treasury rates 50 bpts pre completion; 95- 125 bpts post completion

47
However, given government liabilities and participation in all sub-sectors (such as refining), and in
the island’s industrial ventures (notably steel and iron), with a small and developing financial
system which did not have the commensurate capital base, Qatar’s gas ambitions inevitably resulted
in increasing total and government financial burdens throughout the 1990s.
According to government data, total ‘direct’ government debt rose from 46% of GDP in 1995 to
nearly 66% in 2000, having more than doubled from over $3.4 billion to under $7.5 billion during
the period. Although financial reforms were being activated to establish the Qatari Central Bank (in
1993), to allow banks to set deposit rates (in 1995), and to establish a securities market (in 1997),
government borrowing essentially relied on the liquidity of commercial banks. Inevitably, a good
proportion of this domestic debt consisted of costly short-term loans. Throughout the 1990s,
government debt accounted for 42- 49% of total credit, and caused a substantial squeeze on the
Preliminary Estimated
1997 1998 1999 2000 2001
Real GDP 25.4 6.2 5.3 11.6 7.2Oil GDP 2/ 23.4 9.7 -3.7 5.9 -1.2Liquefied natural gas and related GDP 2/ 3/ ... 56.8 62.9 59 25.8Non-hydrocarbon GDP 14.6 2.2 0.4 2 3.5
Financial variables 1997 1998 1999 2000 2001Total revenue 34.9 32.7 31.4 38.5 32.2Oil revenue 21.8 19.3 23.4 30.5 21.7Total expenditure 43.9 43.1 35.7 30.1 32.1Fiscal balance (deficit -) -9 -10.4 -4.3 8.4 0.1Excluding oil revenue -30.6 -30.2 -28.1 -22.1 -21.6
Macro variables 1997 1998 1999 2000 2001Nominal GDP 11,298 10,255 12,197 16,763 16,553Exports, f.o.b. 2/ 4,355 4,808 7,697 11,094 10,858LNG and related exports 2/ 499 615 2,513 3,363 3,882Total external debt 2/ 4/ 9,323 10,118 11,689 14,493 15,171In percent of GDP 82.5 98.7 95.8 86.5 91.7
Table 6: Qatar: Selected Macro-economic Data, 1997-2001 1/
4/ Government, government-guaranteed, & non-guaranteed external debt; excludes external liabilities of the banking system.
(Annual percentage change)
(In percent of GDP, unless otherwise stated)
(In millions of U.S. dollars, unless otherwise stated)
Source: IMF Public Information Notice (PIN) No. 02/99, 10 Septembre 2002.1/ Based on official data available as of May 2002.2/ IMF staff estimates.3/ Staff estimates from 2000 onwards.
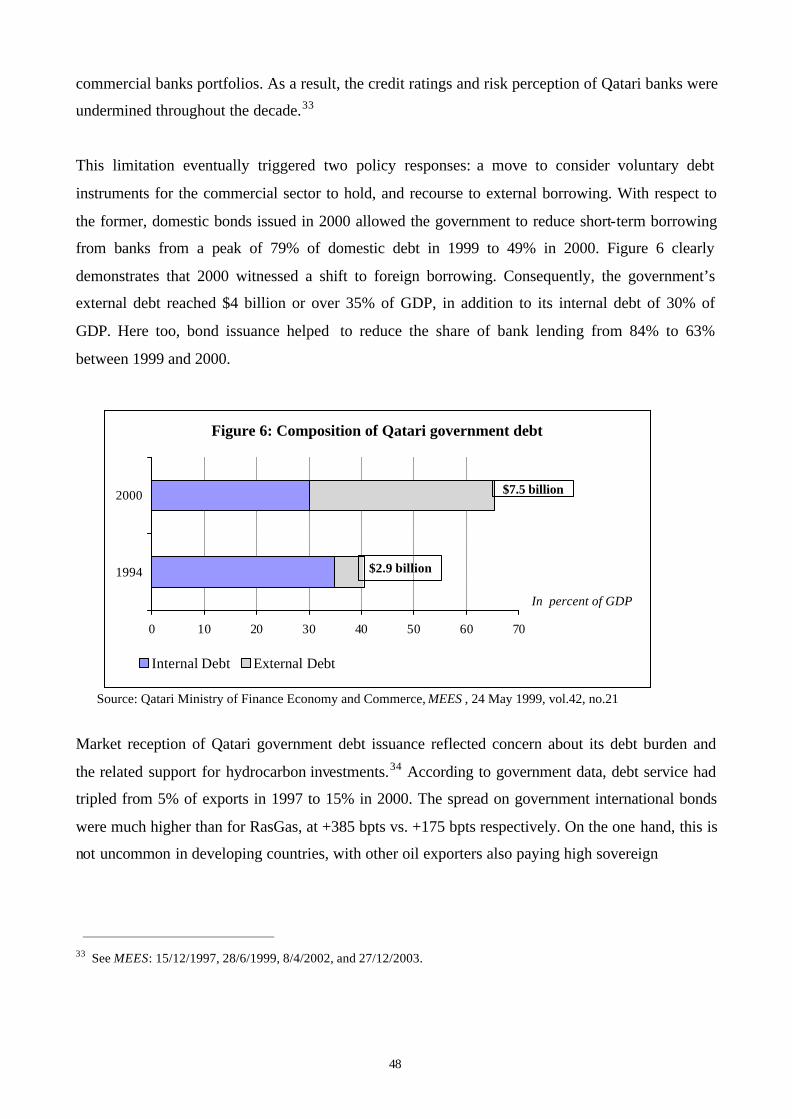
48
commercial banks portfolios. As a result, the credit ratings and risk perception of Qatari banks were
undermined throughout the decade.33
This limitation eventually triggered two policy responses: a move to consider voluntary debt
instruments for the commercial sector to hold, and recourse to external borrowing. With respect to
the former, domestic bonds issued in 2000 allowed the government to reduce short-term borrowing
from banks from a peak of 79% of domestic debt in 1999 to 49% in 2000. Figure 6 clearly
demonstrates that 2000 witnessed a shift to foreign borrowing. Consequently, the government’s
external debt reached $4 billion or over 35% of GDP, in addition to its internal debt of 30% of
GDP. Here too, bond issuance helped to reduce the share of bank lending from 84% to 63%
between 1999 and 2000.
Market reception of Qatari government debt issuance reflected concern about its debt burden and
the related support for hydrocarbon investments.34 According to government data, debt service had
tripled from 5% of exports in 1997 to 15% in 2000. The spread on government international bonds
were much higher than for RasGas, at +385 bpts vs. +175 bpts respectively. On the one hand, this is
not uncommon in developing countries, with other oil exporters also paying high sovereign
33 See MEES: 15/12/1997, 28/6/1999, 8/4/2002, and 27/12/2003.
Source: Qatari Ministry of Finance Economy and Commerce, MEES , 24 May 1999, vol.42, no.21
Figure 6: Composition of Qatari government debt
0 10 20 30 40 50 60 70
1994
2000
In percent of GDP
Internal Debt External Debt
$2.9 billion
$7.5 billion

49
premiums on external debt.35 On the other hand, the premium paid by the Qatari government partly
because of its O&G commitments contrasts with the situation of PEMEX, whose access to capital
was described as suffering from its relations to government.36 Still, the use of new financial
instruments highlights the importance of financial deepening for managing a debt burden which
otherwise could have sunk the banking sector.
Qatari total external debt exposure also rose on the back of the borrowing activities of the QGPC,
whose external borrowing had taken off at under $3 billion in 1996, and reached nearly $4.9 billion
in 1999, as shown in Figure 7. By 1999, total external debt for Qatar as a whole became a serious
concern, nearing $11 billion compared to a GDP of around $12 billion. IMF data suggest the debt
burden receded slightly from 98.7% of GDP in 1998 to 91.7% in 2001. Were it not for large export
revenues, this would have led to Qatar being classified as a severely indebted country.
_____________________________ 34 During that period, the government also incurred a debt of $931.33 million under three loan agreements. This amount was lent on to the Qatar Electricity & Water Company for electricity projects. In March 2000, $659 million in repayments were outstanding (MEES, 24 May 1999). 35 In Barnett and Ossowski (2002), spreads paid by Ecuador, Nigeria, Russia, and Venezuela in 2000- 2001 ranged between +800 and +1300 bpts.
Figure 7: Qatari external debt by borrowing sector
2,166
10,956
Source: Qatari Ministry of Finance, Economy and Commerce, MEES , 24 May 1999, vol.42, no.21
Total External Debt
1994
0%
39%
27%
34%
DirectGovernmentDebtGovernmentGuaranteed Debt
QGPC andQGPCSubsidiariesDebt of otheragents
1999
34%
15%
45%
6%

50
In 2001, government revenues reached 32.2% of GDP as associated gas exports finally started to
kick in.37 Debt stocks were higher at $15 billion according to the IMF (September 2002), and at
$13.3 billion or 75% of GDP according to a Qatari source (MEES, 8/4/2002). More recently,
surplus revenues are reported to be used for debt repayment, but total external exposure is unclear.
Qatari external debt has been put at $14-$17 billion, i.e. 85-90% of GDP (HSBC 2004; CIA
Factbook 2004). Government interest payments on its total borrowing are also more manageable,
having declined to under 8% of its expenditure (Qatar Central Bank, 2003). The LNG expansion
and other planned industrial ventures are likely to keep up the demand for foreign financing.
Hopefully the ‘good economics’ and continued strength of hydrocarbons revenues will make this
debt path sustainable. On the domestic scene, increased government activity has not led to a credit
squeeze, and government bonds are now in their fifth issuance. However, the Qatari Central Bank
admits much remains to be done before benefiting from a sophisticated, securitised bonds and
currency markets (Qatar Central Bank, 2003).
9. Limitations of the special case
Qatar’s successful financing of its gas projects was eased by the availability of substantive revenue
flows afforded by the associated liquids to the QGPC and to the government . This is one of the
factors that may limit the possibilities of it being replicated in other Arab countries. Among these
factors is the size of Qatar’s natural gas reserves, which are the third largest in the world after Iran
and Russia. This is an inherent advantage that smaller producers, including regional competitors,
can hardly replicate. Conversely, larger producers may be advised to retain control of their reserves:
large reserves are valuable assets that strengthen negotiating positions.
The success of Qatari gas financing was further underpinned by a number of elements, namely:
• The ability to secure an impressive array of partnerships
• A debt service guarantee offered by MOBIL, reducing credit risk further
• The ability to negotiate better terms with contractors and financiers.
Of course, good negotiating skills and a debt service guarantee are policies that other producers can
incorporate, but their replication is neither spontaneous nor obvious, especially for newcomers with
_____________________________ 36 See ratings for PEMEX by Standard & Poor (May 2002) and Moody (January 2003). 37 LNG export revenues $837 million in 1998 to $1.353 billion in 1999 (MEES, 14 August 2000), with total gas exports reaching $3,882 million in 2001 (IMF Public Information Notice, September 2002).

51
no established hydrocarbons industry. For example, the weaker negotiating position of the Yemeni
government, with smaller reserves, less experience, and a less developed regulatory environment,
may have led it to accept lower equity participation in its LNG project. In the same vein, Rodgers
(2003) argues that Sudan is ill placed to increase government takes beyond those currently on offer
by oil majors.
Another specificity of Qatar’s case is the project’s judicious timing: it happened when financial
flows to developing countries were still rising, and the region was relatively stable politically.
Market response in subsequent cases was clearly overwhelmed by political developments. In the fall
of 2001, Oman LNG failed twice to refinance its $1.3 billion loan because of market nervousness
after 11 September 2001, despite solid ratings, credit enhancements, substantial guarantees from BP
and other project partners, and the virtual absence of defaults in regional deals. Oman LNG
eventually secured a top rating and refinanced the loan successfully in 2002, using traditional bank
lending. Bond issuance was abandoned.
Thus, apart from the impacts of financial turbulences on global financial flows, country risk has
become a critical determinant of the type and cost of finance offered to Arab oil and gas, including
to NOCs. Yet indications are that since 2001, $10 billion worth of project finance has been secured
(Euromoney 2003). Private capital investors may be more nervous than before, but are not fleeing.
This difficult context and the delay in re-financing the Oman LNG deal illustrates the point that
although Arab O&G might learn from Qatar and replicate structures attractive to investors, investor
sentiment and global financial trends can offset efforts in that direction. As argued in Section 2,
financial trends also involve the favouring and disfavouring of certain types of financial instruments
in response to particular shocks and/or regulatory changes, i.e. not because of the specifics of a
particular country.
This is currently the situation characterising commercial lending. To reiterate, APICORP and other
financiers have all stated that international bank lending is unlikely to reverse its retrenchment from
developing countries. Oil and gas finance can therefore expect continued - though not necessarily
increased - support from bank loans. Such support may also improve with participation by
international O&G agents or IOCs. More generally, it is unusual for developing country projects to
be able to mobilise over half of the funding from external borrowing. Hence, more resource-
constrained Egypt followed a path that is more typical of poorer economies, relying on multilateral
funding (namely EIB support) to complete the financing required for its LNG plants.

52
Egypt also had to rely more on domestic financing. The share of domestic investments in its
petroleum sector rose from 49% to 54% between 2000/01 and 2001/02, with foreign investment
accounting for the rest (American Chamber of Commerce in Egypt 2003). No further details are
available to allow us to work out precisely the distribution of national and international capital
between oil and gas, or between the upstream and downstream.
A further considerable limitation to replicating the Qatari success is that the stress on the country’s
exposure may be too risky for more vulnerable countries, or during times of tighter credit markets.
The severe, albeit temporary, increase in the Qatari external debt burden is a gamble that other
developing countries could not have taken, and would not have been allowed to take, in light of the
sovereign debt problems of developing countries. This episode of high government domestic and
external financial exposure in Qatar is often overlooked when Rasgas bonds financing is mentioned,
precisely because the project structure isolates it from macro-economic impacts. The debts incurred
by the government, the pressure on the banking system, the fact that the government had to pay
twice the spread over the Rasgas deal when it went to market in 1999, are all hidden costs and
hidden risks of Qatar’s gas expansion. Other governments or NOCs wishing to engage in
expansions on a similar scale need to either have an excellent credit history, a favourable creditor
prepared to twist the arms of hesitant bankers, or relatively light debt burdens.
According to current financial fashion, the prospects of increased reliance by Arab O&G projects
on project bonds are more promising. The IMF, World Bank and others anticipate project bonds to
be an important future funding source for many sectors, noting that this is an under-used avenue of
financing in developing countries. According to Dailami and Hauswald (2003), who examined 105
infrastructure project bonds38 issued by developing countries between 1993 and 2002, issuance
volume was only at $8 billion vs. $25 billion worldwide in 2000- 01, indicating a huge potential for
expansion. The Qatari bonds were the only two Middle Eastern bonds, vs. thirteen Mexican and five
Venezuelan oil project bonds. The authors further argue that the success of the bonds is
demonstrated by the near investment grade secured, especially in power and energy.
On the other hand, to date this promise remains unfulfilled. There has been no other Arab issuance
of a similar size, and no other Arab oil and gas project secured over one-third of total funding
38 Energy and power accounted for 77 of these bonds.

53
through bonds. There is little firm evidence to indicate that investors will remain interested in
project bonds. The current favouring by IFIs will not in itself guarantee sufficient market demand.
Hence, despite its championing by most analysts, FDI confounded expectations and has been falling
for the last three years. Lastly, an increase of issuance by all developing countries may undermine
the terms they can secure.
10. Outlook: from financing gap to financial bounty?
This section argues that even before the current rise in oil revenues accruing to the Arab region, the
alarm over a potential shortage of investment funds was not entirely justified. Clearly, the structure
of Arab hydrocarbons sectors has moved visibly and irreversibly towards accommodating a wider
range of agents and using more diverse financing strategies, i.e. including a greater call on
international capital markets and private financing instruments. It is also clear that a shift to market
financing is not a sufficient guarantee of capital adequacy, neither on the sectoral nor economy
level. Risk exposures have become more complex to manage, involving the reactions of credit
rating agencies and investor sentiment. This has many behavioural implications, including that
NOCs and governments now have to pay more attention to financial performance indicators. Arab
O&G actors are more linked to capital market conditions than ever before, however little they may
borrow from them.
Thus, compared to the 1990s, the resort to private and to market financing has altered the context
within which Arab O&G operated. Arab governments and NOCs can no longer exclusively rely on
the intimacy of long-standing relations with IOCs or banks to secure funding. Government
budgetary plans are no longer sufficient for coping with sectoral needs. This is particularly true
where fiscal prudence and other pressures on government spending created a discrepancy between
fiscal resources available for O&G, and identified capital needs in the sector. This is a notable
departure from the presumption that government resources are either available or sufficient. Even if
O&G revenues strengthen, government commitments to non-oil needs will retain their importance
in budgetary plans.
As such, both the IEA (2003) and APICORP (2003), who assumed a stagnation or even a fall in oil
revenues, were concerned about a possible financing gap between current investment needs and
available finance, at both country and regional level. Assuming stagnant oil revenue levels, current

54
investment plans entail additional capital inflows in the order of $10- $12 billion a year. They add
that Arab O&G sectors raised annually $5- 6 billion from external sources for that purpose in recent
years. Hence, APICORP and other analysts are alarmed that an annual external financing gap of at
least $4- 6 billion may arise. Likewise, local investors are said to believe that government provision
of capital expenditure for energy and infrastructure is unsustainable (MEIDC, 2003).
Yet, evidence gathered so far questions this concern. To begin with, the worry has often been
justified by reference to the poor level of FDI received by Arab countries. This comparison is
incorrect, as FDI data for the region may be under-estimated precisely because they do not
encompass O&G investments, nor do they use retained earnings of IOCs for capital formation. To
re-iterate, Qatari gas investments involved billions of dollars at a time when FDI was said to be
between $100 and $500 million. Many obstacles to increased FDI to Arab countries are due to
global pressures and to sectoral issues outside O&G, i.e. they have little to do with failings in O&G
policies. Second, understanding where pressing needs lie is hampered by the lack of retrospective
studies that identify gaps between projected and actual spending, and by the lack of data series
detailing investments at the sub-sectoral levels.39
It is also clear that in the past, not all projects were needed or realised, so that financing gaps
experienced by the region would have been less severe than expected. Further, the sector’s financial
history shows that it did secure funds under difficult political conditions and under étatisme,
because of its strategic importance for producers and consumers. In the same grain, sovereign risk
literature continues to show that in practice, developing countries are rarely completely cut off from
capital markets. Instead, credit supply tightness typically implies costlier and more conditional
access.40 Again, Arab O&G sectors are today well placed to overcome such obstacles. In fact, they
often enhance a country’s creditworthiness, and the revenues they generate can be used increasingly
easily to secure repayment to lenders. Further, given the strategic importance of Arab O&G, and
given the billions of revenues generated now, the possibility that the region may face a borrowing
gap of $5- 6 billion a year is not seriously alarming.
It is true that pressure is accentuated because Arab O&G sectors are shifting to private finance at a
time when market confidence is suffering from heightened uncertainty, and when many pre-
39 Oman is rather exceptional in that it publishes data on government capital spending on O&G. Otherwise, we have no consistent knowledge of practices across the region, with published data usually aggregated. 40 See Claessens et al (May 2002), and Gelos et al (2003),

55
requisites for such an engagement – such as adequate regulatory frameworks - are still being
developed. It is also true that a long-standing feature of private capital is its tendency to avoid areas
of high volatility. Gelos et al (2003) are among more recent authors showing that the most
important determinants of market access by developing countries since 1983 are the vulnerability of
recipients to shocks, and the perceived quality of their institutions and policies. However, this does
not mean that Arab O&G will not secure the funds needed. Rather, the challenge for these leading
sectors and producer countries is one of adapting to uncertainty, and of responding to the qualitative
requirements of private financiers.
In other words, like other countries, Arab economies are operating in a difficult lenders’ market,
and will be importing its uncertainties. Since the medium-term expectations are that capital flows to
developing countries will remain low and volatile for a number of systemic reasons, attracting
financial inflows will clearly be as dependent on conditions in global financial markets as it is on
sectoral issues.
Sectoral policies are still important, but credit risk and regulatory requirements are now linking
them to economy wide improvements. This is hardly surprising to many regional analysts, who had
been highlighting the importance of reform and of ‘over-ground issues’ for sectoral development
for sometime.41 The recourse to private finance and involvement of credit rating agencies merely
pushed in the same direction. It has also re- introduced linkages between NOC, government, and
economy, despite an increased corporatisation.
A government’s fiscal stance and creditworthiness are now among the matrix of factors entering
risk analysis, as are a country’s regulatory frameworks, or level of macro economic distress. And as
the Qatari case showed, the ability of the government to use domestic bonds and voluntary
instruments, which resulted from financial sector reforms, was as important to the success of LNG
projects as was the policy of opening the door to IOCs. Similarly, NOC borrowing activity can and
does have macro-economic impacts, and it has also changed in response to financial sector policies.
These inter- linkages arguably constitute another reason for the state not to dissociate from the
sector, even if it may be necessary for it to engage in re-defining its relationships with the main
players. The maturing of economic and financial policies through most of the region since the 1990s
41 See Joffe and Soligo (2000) and Zanoyan (2002).

56
is beginning to be rewarded by less severe corrections of financial ratings (Standard and Poor,
December 2004).
Hence, current pressures may be characteristic of a fluid and dynamic situation whereby the
industry is maturing. Financial availability will probably evolve to accommodate its emerging
structure.42 Arab O&G need to continue evolving, and to remain flexible enough to continuously
adapt to changing financing mixes on offer. Several policies are available to support them,
including international partnerships. Partnerships can provide ways of spreading risks, acquiring
technology, or sharing costs. The latter reason is the least important for improving efficiency or for
building a more vibrant industry.
The current rise in revenues in the wake of strong crude prices will be an excellent opportunity for
the sector to deal with any rising recurrent costs, and to plan for expansion. Host governments and
NOCs can use these revenues to grow the financial muscles needed, and explore more advanced
financing structures. Measures could include strengthening the capital base of institutions that
supported capital investments in the sectors (such as APICORP), and devising new and special oil
sector development bonds or funds. Lastly, there is a need to look beyond adding physical
installations: resources should be allocated into research and development of various aspects of the
industry and its labour force.
11. Conclusions
In conclusion, this paper related changes in Arab financial structures to financing patterns in their
O&G sectors, highlighting inter- linkages between financial flows, capital markets, and investments.
The picture of debt structures and financial flows in the Arab region is a useful summary of its
recent economic history and of the conjunctures within which it has to operate. Up to the early
1990s, Arab economies relied mostly on external inflows and specifically on official finance. More
recently, governments, who are the main borrowers, have switched from external to domestic
sources and from official to private financing, including non-bank lending. While outstanding debt
42 An illustration of this argument in another context is O&G financing in the USA in 2002. That year, US lenders focused on non-investment grade borrowers because of financial market conditions. Lending to such companies exceeded lending to super-majors for the first time in decades. At the same time, large O&G borrowers reacted to market conditions by changing their portfolios and extinguishing bank loans (Oil & Gas Investor, 2003).

57
stocks may have stagnated at the regional level, government liabilities, including domestic debts,
rose significantly, but with an increasing reliance on voluntary debt instruments made possible by
financial reforms. Similarly, external flows from private sources have expanded to include FDI,
bonds, and portfolio flows, although volumes have been insufficient to stem falling aggregate levels
of financial transfers.
These changes reflect two main trends. Firstly, a changing global financial scene, whereby bilateral
loans have largely dried up, and private finance increased in importance, though not in reliability or
availability. Secondly, regional reforms have centred on two axes: a resizing of and divestiture by
Arab governments and de-regulation and deepening of financial sectors, however modest these may
seem.
As far as Arab O&G finance is concerned, in-house resources are still central for all players,
especially in the upstream. Likewise, export credits remain a key component of secured finance,
their sustained use becoming an added guarantee when investors are nervous, or where there are
liquidity problems. These flows had constituted the more known interlinkages between sectoral
financing, government balances, and external debt structures. The main change now is that
additional inter- linkages have emerged, as O&G are now tapping on new types of flows.
These new inflows both reflect and are reflected in sectoral changes. O&G sectors have expanded
and matured considerably, with NOCs and affiliates being consolidated through privatisation or
restructuring, with some ventures being formed through public offerings. This is particularly true in
the downstream, petrochemical, and gas sectors, which have relied more substantially on private
and non-bank finance. Developing a solid shareholder and equity culture takes time, but private
capital engaged in this avenue is likely to grow.
Financial deepening has been critical for O&G’s ability to access new domestic avenues and local
private investors. It was critical to the Qatari government support for its successful gas investment
programme, and eased the consequences of rising domestic debt. Arab financial participation has
therefore grown in importance and maturity, with inter-Arab co-operation adding strength to the
trend. Significantly, both are having a stabilising effect in the current uncertainties, an additional
reason for governments to nurture them.

58
New foreign flows have likewise introduced bondholders and non-banking institutions to Arab
O&G, and were critical for closing many deals. O&G has been an enabling factor for Arab
countries accessing capital markets, with associated receivables acting as collateral and
underpinning good ratings. This is why new instruments such as project bonds were first used by
Arab oil exporters as opposed to other Arab borrowers. While bonds may not be appropriate for all
industry segments, it can be expected that new financing instruments will continue to appear in the
future.
New financing avenues have also created additional inter- linkages between O&G and the rest of the
economy. Sectoral finance mixes not only affect domestic credit markets, but are also linked to
country performance, because financiers assess them according to a similar matrix of factors. If
local financial markets have re- introduced local investors to the sector, international capital has re-
introduced sensitivity to country risk. In both senses, Arab O&G are more dependent than ever on
balanced development being achieved by the economy as a whole, i.e. on growth and maturity in
non-oil activities and on non-physical capital. The challenge is more qualitative than quantitative. It
is not about a quick fix or a financial shortfall. After all, the sectors’ financial history rarely
displayed a suffocating shortfall in finance, the current rise in revenues being a case in point.
Therefore, neither financing gaps nor access to reserves appear to be urgent priorities. Evidence
gathered here clearly shows that the lack of access to reserves is more a corporate IOC issue than a
determinant of oil and gas financing. Access to reserves has not always underpinned successful
financing deals. In fact, the opposite can be suggested: large reserves can be used to strengthen
bargaining positions of NOCs.
Beyond that, a historical feature of O&G financing is that it has always demonstrably involved the
participation of governments, NOCs and IOCs. This is likely to remain the governing framework
for sometime to come. The more distinguishing feature of the current period is that sectoral and
financial policies enhanced financial resources available to Arab O&G by involving more
instruments and more players. Therefore, current efforts must build on this success, fine tune
existing policies, and continue to improve the quality and flexibility of financing structures.

59
The policy directions that can be proposed by way of building on current strengths are as follows.
1. There is a need to address ‘software’ issues that concern all the economy (i.e. the depth and
spread of growth in non-oil sectors), with financial deepening and regulation meriting sustained
attention. Among these issues that governments and/or public bodies will have to take on or lead are
the monitoring and regulation of the financial activities of existing and new O&G players.
2. Attention must be paid to both inter-Arab co-operation and to domestic savings, so as to
consolidate the burgeoning participation by Arab investors. Rising oil revenues witnessed since
2004 make this an ideal time to build long-term stabilisers, including strengthening the
capitalisation of regional banks.
3. In so far as foreign investment has shown a preference for funding new plants, governments
have to take fuller responsibility, and plan more explicitly, for recurrent spending. Capital depletion
and technology acquisition may deserve more explicit itemisation.
Finally, this snapshot of interactions between Arab financial scenes and O&G sectors requires more
extensive investigations to arrive at a fuller picture. While financial profiles of IOCs are available,
we do not know what are their current investment levels in the region, nor can spending in O&G be
apportioned exactly between players. ‘Visibility’ seems to be limited around a few macro-economic
observations (declared projects, aggregated export revenues, or aggregated investment projections),
and a few micro level series (cost per barrel per field, wells drilled).
Hence, it is not possible to assess the adequacy of current financing mixes for sectoral needs in any
meaningful way. Ways forward include more country level case studies, and further investigations
of particular components of sectoral financing.

60
Table A1: Coverage of Arab countries in data sources
OECD, UNCTAD, Arab institutions World Bank
Algeria AlgeriaBahrain DjiboutiDjibouti EgyptEgypt JordanJordan LebanonKuwait MauritaniaLebanon MoroccoLibya Oman Mauritania SomaliaMorocco SudanOman SyriaQatar TunisiaSaudi Arabia YemenSudanSyriaTunisiaUAEYemenNotes:1. Due to their dire state of affairs, data for Iraq and Somalia are not available.2. The World Bank included Bahrain, Kuwait, and Saudi Arabia in its FDI data on a balance of payments basis.
Table A2: Arab economies by level of income and indebtedness 2002
Severely indebted
Moderately indebted Less indebted Not classified by
indebtednessLow- Mauritania Yemen, Rep.income Somalia
SudanMiddle- Iraq Tunisia Algeriaincome Jordan Bahrain
Lebanon DjiboutiSyria Egypt
LibyaMoroccoOman
High- Saudi Arabiaincome Kuwait
U.A.E* Income groups are classified using the World Bank Atlas method: low-income have GNI per capita of $745 or less;middle-income, GNI per capita between $746–9,205; and high-income, $9,206 or more. * Severely indebted : present value (PV) of debt/GNI exceeds 80%, or the PV of debt service/exports exceeds 220%. * Moderately indebted : either PV/GNI is betweeen 48%-80%, or the PV of debt service/export is between 132%-220%.

61
Table A3: Foreign Direct Investment Inflows, 1998-2003
Host economyAnnual Average
1992-19971998 1999 2000 2001 2002 2003
Algeria 93 501 507 438 1196 1065 634Bahrain 602 180 454 364 81 217 517Egypt 820 1076 1065 1235 235 647 237Iraq 2 7 -7 3 -6 -2 ..Jordan 67 310 158 787 100 56 379Kuwait 70 59 72 16 -147 7 67Lebanon 52 200 250 298 249 257 358Libya -31 -128 -128 -142 101 -96 700Mauritania 6 1 40 9 118 214Morocco 551 417 850 215 2825 481 2279Oman 79 101 39 16 83 23 138Palestinian 154 218 189 62 20 .. ..Qatar 182 347 113 252 296 631 400Saudi Arabia 280 4289 -780 -1184 20 -615 208Somalia 1 -1 1Sudan 35 371 371 392 574 713 1349Syria 108 82 263 270 110 115 150Tunisia 457 668 368 779 486 821 584UAE 254 258 -985 -515 1184 834 480Yemen 203 -219 -308 6 136 102 -89TOTAL $3,985 $8,737 $2,491 $3,332 $7,552 $5,374 $8,606Source: Annex Table B.1, World Investment Report 2004, UNCTAD
(US$ million)

62
Source: Bank of International Settlements, 2003
Figure A1: Syndicated loans by number of Arab borrowers 1993-2003
1110 10 10 1 30 11
41 200322
2 651 5432 43 42 4 5533
42244
1 31
0 1 2 3 4 5 6 7
1992-Q1
1992-Q4
1993-Q3
1994-Q2
1995-Q1
1995-Q4
1996-Q3
1997-Q2
1998-Q1
1998-Q4
1999-Q3
2000-Q2
2001-Q1
2001-Q4
2002-Q3
2003-Q2
US$ billion
Number of countries
Figure A2: Syndicated Loans by Qatari & Egyptian borrowers, 1993-2003
0
0.5
1
1.5
2
2.5
1992
-Q1
1992
-Q4
1993-Q
3
1994
-Q2
1995-Q
1
1995-Q
4
1996-Q
3
1997-Q
2
1998-Q
1
1998-Q
4
1999-Q
3
2000
-Q2
2001
-Q1
2001
-Q4
2002
-Q3
2003
-Q2
Us$
bill
ion
Egypt
Qatar

63
REFERENCES AND ADDITIONAL BIBLIOGRAPHY References Abdelrazzak, S. (1999), ‘Common woes in Arab capital markets’, al-Ahram Weekly, Cairo, no.448, 23-29 September, http://www.ahram.org.eg/weekly Alami, R. (2003), ‘Official external debt: Perspectives from the experience of Arab countries’, The Middle East Journal, Vol.39, No.3 July, pp.99- 126. Allen, R. (2001), ‘Lies, damned lies and statistics: The huge government share ownership of Arab companies creates many anomalies when calculating market capitalization’, Financial Times, May 11. Albuquerque, R. (2002), The Composition of International Capital Flows: Risk Sharing Through Foreign Direct Investment, Simon School of Business, University of Rochester, New York, http://www.ssb.rochester.edu/fac/albuquerque/capflows-final.pdf AME Infor (2003), ‘Credit Agencies at War’, Business Features, April, www.ameinfo.com Antill, N., and R. Arnott (2003), Oil company Crisis: Managing Structure, Profitability and Growth, Monographs SP15, Oxford Institute for Energy Studies, Oxford. APICORP Research Unit (2003), Financing Energy Investments in the Arab World: Some Lessons From APICORP’s Recent Experience, mimeo, 15 July Updated 22 November. APICORP Research Unit (2004), Financing Energy Investments in the Arab World: Some Lessons From APICORP’s Recent Experience, mimeo, Updated June. APICORP, Annual Report, Dahran, various issues, 1997-2002. Arab Monetary Fund (AMF), Arab Fund for Social and Economic Development, and OAPEC, Joint Annual Arab Economic Report 2002 and 2004, Abu-Dhabi. Arab Petroleum Research Center, Arab Oil & Gas Directory, Paris, 1997, 1998, 2001. Aziz, A.M (2001), Proposals For The International Conference On Financing For Development For Consideration By The G-24, Issue Paper for the Consideration of G-24 Ministers Paris, November 14, UNCTAD, Geneva. Azzam, H.T. (2001), ‘Arab bond markets: moving from embryonic stage to the take-off stage’, Middle East Capital Group, Lebanon, http://www.mecg.com.lb/research.htm (accessed July). Bank for International Settlements (BIS) (2003), ‘The international banking market’, BIS Quarterly Review, September, pp.13- 26. Barnett, S., and R.Ossowski (2002), Operational Aspects of Fiscal Policy in Oil-Producing Countries, IMF Working Paper WP/02/177, Washington D.C., October. Bartsch, U. (1998), Financial Risks and Rewards in LNG Projects, Oxford Institute for Energy Studies, NG3. Bindemann, K. (1999), Production Sharing Agreements: An Economic Analysis, WPM 25, Oxford Institute for Energy Studies, Oxford. Buresch, M. (2003), ‘The declining role of foreign private investment’, World Bank Energy Forum, 24 February, www.worldbank.org/energy/week2003/Presentations/ EnergyForum1/BureschWBForumpresentation.pdf Central Intelligence Agency (CIA) (2005), ‘Qatar’, http://www.odci.gov.cia.publications/factbookgeos/qa.html Claessens, S., and G., Embrechts (2002), Basel II, sovereign rating and transfer risk: external vs. internal ratings, presentation at the conference Basel II: An Economic Assessment, Basel, May

64
Creane, S., Goyal, R., Mobarak, M.A. and Sab, R. (2004), ‘Financial Sector Development in the Middle East and North Africa’, IMF Working Paper, WP/04/2, Washington D.C. Dailami, M., and R., Hauswald (2003), Contract Risks and Credit Spread Determinants in the International Project Bond Market, Country Economics Department Working Papers 2712, Washington D.C., November. Dailami, M., and R., Hauswald (2003), The Emerging Project Bond Market: Covenant Provisions and Credit Spreads, World Bank Policy Research Working Papers 3095, Washington D.C., July. ECGD, Annual Report 2001, http://www.ecgd.gov.uk/annualreport2001.pdf ECGD, Press release, 2003, 28 February. ECLAC, 2000, FDI in Latin America and the Caribbean 1999, Chile, January. Economic Research Forum for Arab Countries, Iran & Turkey, ‘Financial and capital markets, privatisation, and FDI,’ Chapter 2, Economic Trends 2002, Cairo, 2002. Eid, F. and F.Paua (2002), ‘Foreign Direct Investment In the Arab World: The Changing Investment Landscape’, Chapter 7, World Economic Forum, Arab World Competitiveness Report 2002-2003, Oxford University Press, Geneva, pp.108- 19. Euromoney (2003), ‘Project finance faces up to change’, May, www.euromoney.com Export Import Bank (EXIM), Press releases, 5/10/2001, 27/10/2003, Washington D.C., http://www.exim.gov/pressreleases.cfm al-Farrag (1999), Financing Oil & Gas Projects in Arab Countries (in Arabic), Paper presented at the 6th Arab Energy Conference, Damascus. Fgrais, W., and Zkantur (2003), the Changing Financial Landscape: Opportunities and Challenges for the Middle East and North Africa, World Bank Policy Research Working Paper 3050, May. Financial Times, ‘G8 Tensions underlie Iraq debt reduction’, London, 9 June 2004. Financial Times, ‘Tensions over Iraq resurface at G8 summit’, London, 10 June 2004. Financial Times, ‘Give me liberty and give me debt’, London, 10 June 2004. Gelos, R.G., Sayah, R., and G., Sandleris (2003), Sovereign borrowing by developing countries: what determines market access? IMF Working Paper WP/03/XX, Washington D.C., October 2003. Haddad, M., and S.R. Hakim (2003), ‘Did September 11 alter the sovereign risk in MENA? An empirical investigation’, Background paper, ERF Tenth Annual Conference, Marrakesh, Morocco, 16- 18 December. HSBC (2004), Qatar, Business Profile Series, 12th edition, 4th quarter. International Energy Agency (IEA) (2003), World Energy Outlook, Paris, November. International Monetary Fund (IMF) (2002), Public Information Notice (PIN) No. 02/99: IMF Concludes 2002 Article IV Consultation with Qatar, Washington, D.C., 10 September, http://www.imf.org/external/np/sec/pn/2002/pn0299.htm. --- (2003), ‘Emerging Market Developments and Financing Prospects’, Chapter 3, Global Financial Stability Report, Washington D.C., March, pp.34- 69. --- (2003), ‘Local Securities and Derivatives Markets in Emerging Markets: Selected Policy Issues’, Chapter IV, Global Financial Stability Report, March, Washington D.C., pp.70- 94. --- (2003), Financial Markets Update, International Capital Markets Department, Washington D.C., May. --- (2003), ‘Overview’, Chapter I, Global Financial Stability Report, September, Washington D.C., pp.1- 6. --- (2003), ‘Volatility of Private Capital Flows to Emerging Markets’, Chapter IV, Global Financial Stability Report, September, Washington D.C., pp. 89- 115.

65
--- 2003), Working Group of the Capital Markets Consultative Group, FDI in Emerging Market Countries, IMF, Washington, September, http://www.imf.org/external/np/cmcg/2003/eng/091803.HTM. Inter Arab Investment Guarantee Corporation, Annual Report 2002, Kuwait, http://www.iaigc.org/Publications/Annual_Report/2002 Joffe, A. and Soligo, R. (2000), ‘Impact of opening up of upstream sectors in the Gulf’, MEES, no.36, vol. XLIII, 4 September. Kether, S., and Re tha, D. (2001), ‘Securitization of Future Flow Receivables: A Useful Tool for Developing Countries’, Finance and Development, IMF, Washington D.C., No.1, Vol.38, March. Kuhn, M.G., Jarvis, C.J., and Horsath, B. (1999), Officially Supported Exports Credits: Recent Developments and Prospects, IMF Washington D.C. Lynch, M., (2000) ‘Oil market structure and oil market behaviour ’, MEES, 25 December 2000/1January 2001, Vol. XLIII/XLIV, No.52/01. Mabro, R., (2003), ‘Setting the Scene’, Special Issue: Joint OPEC/IEA Workshop on Oil Investment Prospects in Vienna, 25 June, OPEC Review, Vol. XXVII. No.3, September, pp.187- 90. al-Marraj, R. (2002), ‘Forecast investment requirements for the oil, gas, and petrochemical sectors in the Arab region’, Oil and Arab Coo-operation, OPEC, Vienna, Vol.28, Issue 101, pp.9-56. Megalli, M., and Noeman, R. (2002), ‘Egypt gets aid lifeline after Sept 11downturn’, February 6, http://www.reuters.com/news_article.jhtml?type=search&StoryID=574884 Middle East Infrastructure Development Congress (MEIDC) (2003), Research Findings, Dubai, http://www.meidc.net/MEIDC%20Research%20Report.pdf Middle East Economic Survey (MEES), Nicosia, various issues. http://mees.com Mohamedi, F. (1997), ‘Oil, Gas and the Future of Arab Gulf Countries’, MERIP Report, July-September, http://www.merip.org/mer/mer204/fareed.htm. Al-Moneef, M. (2000), ‘The national oil industry and corporate transformation’, MEES, 19 June, Vol. XLIII, No.25. Moody’s Investors Service (2003), Petroleos Mexicanos (PEMEX): lack of fiscal autonomy constrains production growth and raises financial leverage, Special Comment, January. Qatar Central Bank (2003), Twenty Seventh Annual Report. Qatar Central Bank (2004), Quarterly Statistical Bulletin, Vol. 23, No.4, Doha, Qatar, December. Razavi, H. (2003), ‘Challenges in financing energy projects’, Special Issue: Joint OPEC/IEA Workshop on Oil Investment Prospects in Vienna, 25 June 2003, OPEC Review, Vol. XXVII. No.3, September, pp. 250- 64. Rodgers, M (2003), ‘Sudan: projected oil production and revenues –Summary’, PFC Strategic Studies, PFC Energy, Washington D.C., August. Skinner, R. (2003), ‘Difficult Oil’, Presentation, Oxford Institute for Energy Studies Seminars, Oxford. Smith, M. (2003), ‘Investment from an IOC perspective’, Special Issue: Joint OPEC/IEA Workshop on Oil Investment Prospects in Vienna , 25 June 2003, OPEC Review, Vol. XXVII. No.3, September, pp. 260- 82. Standard and Poor (2004), Oil or Nothing? Stress-testing Ratings on Oil - Producing Countries, December, http://www2.standardandpoors.com

66
UNCTAD (1996), Trade and Development Report 1996, United Nations, New York and Geneva. UNCTAD (1999), FDI in Africa: Performance and Potential, UNCTAD/ITE/IIT/Misc15, United Nations, New York and Geneva. UNCTAD, World Investment Report, United Nations, New York and Geneva, 2000, 2002, 2003, 2004. United States General Accounting Office (GAO) (2002), EXPORT-IMPORT BANK: Energy Financing Trends Affected by Various Factors, GAO-02-1024, Washington D.C. --- (2003), Export Credit Agencies: Movement Toward Common Environmental Guidelines, but National Differences Remain, Report to Congressional Requesters, GAO-03-1093, Washington D.C., September. United States Office of Energy Markets and Energy Use (1996), Privatization and the Globalization of Energy Markets, Energy Information Administration, DOE-IEA-0609(96), Washington D.C. Williams, B. (2001), ‘Trends in place by 2000 span dramatic changes in oil and gas corporate culture’, IPE Essay 2001, International Petroleum Encyclopedia. Williamson, J. (2000), ‘Issues regarding the composition of capital flows’, paper presented at the ODI Conference on Capital Account Liberalisation, London. Wilson, R. (2003), ‘Arab Banking and Capital Market Developments’, Chapter 5, in World Economic Forum, Arab World Competitiveness Report 2002-2003, Oxford University Press, pp. 90- 107. World Bank (2003), ‘Energy Sector Management Assistance Programmeme: Meeting in Lebanon examines financing and reform needs for the Middle East and North Africa’, 11 June, http://wbln0018.worldbank.org/esmap/site.nsf/pages/NewsJun_11_03 ---, Global Development Finance, 2001, 2002, and 2003, Washington D.C. ---, ‘International Agreements to Improve Investments and Competition for Development ’, Chapter 4, Global Economic Prospects 2003, Washington D.C. ---, ‘Domestic Policies to Unlock Global Opportunities’, Chapter 3, Global Economic Prospects 2003, Washington D.C., pp.77- 111. Zanoyan, V.(2002), ‘NOC-IOC relations and their impact on investment in the upstream sector’, MEES, 14 October, Vol. XLV, No. 41. Additional Bibliography Abdelrazzak, S. (2000), ‘When in debt, borrow’, al-Ahram Weekly, Cairo, no. 485, 8-14 June, http:///www.ahram.org.eg/weekly Ait-Loussine, N. (2003), ‘Reflections and remarks’, Special Issue: Joint OPEC/IEA Workshop on Oil Investment Prospects, Vienna, 25 June 2003, OPEC Review, Vol. XXVII. No. 3, September, pp. 307- 11. Alexander’s Gas and Oil Connections (2003), Energy investments in the Arab world, volume 8, issue 16, 21 August. Alexander’s Gas and Oil Connections (2003), Qatar’s economy continues to go from strength to strength, volume 8, issue 16, 21 August http://www.gasandoil.com/goc/news/ntm33413.htm. Altunbas, Y., and B.Gadanez (2003), Developing country economic structure and the pricing of syndicated credit, BIS Working Paper no.132. American Chamber of Commerce in Egypt (2003), The Petroleum Industry in Egypt: Investment and Prospects, Cairo, December.

67
Appert, O. (2003), ‘Dramatic changes in the playing field ’, Special Issue: Joint OPEC/IEA Workshop on Oil Investment Prospects, Vienna , 25 June 2003, OPEC Review, Vol. XXVII. No. 3, September, pp.191- 202. Arab Fund for Social & Economic Development (2001), ‘Private sector participation in infrastructure in the Arab world: economic and social effects and some administrative and finance issues’, Oil and Arab Coo-operation, Vienna, Vol. 27, Issue 99, pp.19- 67. Aykut, D., Kalsi, H., and Ratha, D. (2003) ‘Sustaining and Promoting Equity-Related Finance for Developing Countries’, Chapter 4, Global Development Finance 2003, World Bank, Washington D.C., pp.85- 106. Badawi, M. (2001), ‘Electricity Landscape And Market Globalization: Options And Challenges For The Arab World’, World Energy Council 18th Congress, Buenos Aires, October. Bank for International Settlements (BIS) (2003), ‘The international debt securities market’, BIS Quarterly Review, September, pp.27- 34. Calderón, C., Loayza, N., and Servé, L. (2002), Greenfield FDI Vs. Mergers And Acquisitions: Does The Distinction Matter?, Working Papers N° 173, Central Bank of Chile, August http://www.bcentral.cl/esp/estpub/estudios/dtbc/pdf/dtbc173.pdf Dailami, M., Kalsi, H., and .Shaw, W. (2003) ‘Coping with Weak Private Debt Flows’, Chapter 3, Global Development Finance 2003, World Bank, Washington D.C., pp. 41- 67. Eltony, N. (2003), ‘Quantitative Measures of Financial Sector Reform’, Working Paper No.41, Arab Planning Institute, Kuwait, March, http://www.arab-api.org/wps0303.pdf. Everhart, S.S., and Sumlinski, M.A. (2001) Trends in Private Investment in Developing Countries Statistics for 1970- 2000, Discussion Paper Number 44, International Finance Corporation, Washington DC. Export Credits Guarantee Department (ECGD) (2003), Report On The Comparison Of Export Credit Agencies, London and Cardiff, February. Export Import Bank (EXIM), Annual Reports, 2001-2003, Washington D.C. Ferrett, B. (2003), Growth Investment versus Acquisition: Positive Analysis, Research Paper 2003/02, Globalisation Productivity and Technology Series, Leverhulme Centre for Research on Globalisation and Economic Policy, University of Nottingham. International Energy Agency (2003), ‘2003 Insights’, World Energy Investment Outlook, Paris, November. Meyer, K.E., Estrin, S., Buamik, S., Gelb, S., Hanoussa, H. Gokarn, and Than Ha, N. (2002), ‘Foreign Direct Investment in Emerging Markets: A Comparative Study in Egypt, India South Africa and Vietnam’, paper, the 6th European Association for Comparative Economic Studies, Forli, Italy, June. Middle East Desalination Research Centre (2000), ‘Middle East investment: regulatory reform first’, August, http://www.medrc.org.om/new_content/industry_news/aug00/Story1.htm Okogu, B.E. (2003), The Middle East and North Africa in a Changing Oil Market, http://www.imf.org/external/pubs/ft/med/2003/eng/okogu/okogu.htm Oman LNG (2002), ‘Oman LNG signs a refinancing agreement with major banks’, Press release, 9 January, http://www.omanlng.com/htm/news/press_releases_refin.asp Raynauld, A. (1992), Financing Exports to Developing Countries, OECD, Paris.

68
Sala-I-Martin, X, and Artadi, E.V. (2002), ‘Economic Growth and Investment In the Arab World’, Chapter 2, in World Economic Forum, Arab World Competitiveness Report 2002- 2003, Oxford University Press, pp.108- 119. Standard and Poor (2002), Petroleos Mexicanos (PEMEX): Major Rating Factors, 17 May. Stephens, M. (1998), Export Credit Agencies, Trade Finance and South East Asia, IMF Working Paper WP/98/175, IMF, Washington D.C., December. Stephens, M. (1999), The Changing Role of Export Credit Agencies, IMF, Washington D.C., May. http://www.imf.org/external/pubs/nft/1999/change/index.htm World Markets Research Centre (2002), ‘Scaling Back Energy Investment’, In Focus 2002, http://www.worldmarketsanalysis.com/InFocus2002/articles/mideast_energy_invest.html Zanoyan, V. (2003), ‘Non-price determinants of investment in the global oil sector’, Special Issue: Joint OPEC/IEA Workshop on Oil Investment Prospects, Vienna, 25 June, OPEC Review, Vol. XXVII. No. 3, September, pp.237- 50.
69
Glossary and definitions Terms and definitions are compiled mainly using World Bank’s definitions and terminology, particularly as they appear in Global Development Finance. UNCTAD and IMF definitions are also used as indicated. BENCHMARK ISSUES are high-quality debt securities, typically bonds. Investors use their yield for comparison purposes and to price other bond issues. (IMF) CAPITAL ACCOUNT LIBERALISATION is the removal of statutory restrictions on cross-border private capital flows. In particular, the relaxation of controls or prohibitions on transactions in the capital and financial accounts of the balance of payments, including the removal of foreign exchange convertibility restrictions. (IMF) CASH SECURITISATION is the creation of securities from a pool of pre-existing assets and receivables that are placed under the legal control of investors through a special intermediary created for this purpose. This compares with a ‘synthetic’ securitisation where the generic securities are created out of derivative instruments. (IMF) CONCESSIONAL DEBT conveys information about the borrower’s receipt of aid from official lenders at concessional terms as defined by the DAC, that is, loans with an original grant element of 25 percent or more. Loans from major regional development banks are classified as concessional according to each institution’s classification and not according to the DAC definition, as was the practice in earlier reports. CONTAGION is he transmission or spill-over of financial shocks or crises across countries and/or across asset classes, characterized by an apparent increase in the co-movement of asset prices. (IMF) CONSUMPTION OF FIXED CAPITAL is the decline, during an accounting period, in the value of fixed assets unit as a result of physical deterioration, normal obsolescence, or normal accidental damage (also called depreciation). Statistical coverage can include tangible and intangible fixed assets, such as infrastructure assets or the costs of ownership transfer incurred on the acquisition assets. (IMF) CORPORATE GOVERNANCE is the governing relationships between all the stakeholders in a company—including the shareholders, directors, and management—as defined by the corporate charter, bylaws, formal policy, and rule of law. (IMF) CREDIT INSURANCE is a form of guarantee to manufacturers and wholesalers against loss resulting from default on the part of debtors. (IMF) CREDIT RISK is the risk that a counter-party to the insurer is unable or unwilling to meet its obligations causing a financial loss to the insurer. (IMF) CREDIT SPREADS is the spread between sovereign benchmark securities and other debt securities that are comparable in all respects except for credit quality (e.g., the difference between yields on U.S. Treasuries and those on single A-rated corporate bonds of a certain term to maturity). (IMF) DEBT OUTSTANDING is the total outstanding debt at year end. DERIVATIVES are financial contracts whose value derives from underlying securities prices, interest rates, foreign exchange rates, market indexes, or commodity prices. DISBURSEMENTS are drawings on loan commitments by the borrower during the year.

70
DIRECT INVESTMENT (UNCTAD) or FOREIGN DIRECT INVESTMENT (World Bank) is investment to acquire abroad (defined according to residency), physical assets and/or a financial/ managerial stake in an enterprise. Direct investment involves a lasting management interest (usually 10% of voting stock) in an enterprise operating in a country other than that of the investor. It is the sum of equity capital, reinvestment of earnings, other capital for that purpose, as shown in the balance of payments. EMERGING MARKETS are developing countries’ financial markets that are less than fully developed, but are nonetheless broadly accessible to foreign investors. (IMF) EXPORT CREDITS includes official export credits, suppliers’ credits, the official non-ODA lending, and bank credits officially guaranteed or insured by an export credit agency. FINANCIAL GUARANTEE is a form of coverage in which the insurer guarantees the payment of insurance interest and/or principal of the insured in connection with debt instruments issued by the insured. (IMF) GRANTS are defined as legally binding commitments that obligate a specific value of funds available. They are available for disbursement for which there is no repayment requirement. GREENFIELD INVESTMENT is the acquisition of physical assets (plant or equipment or land) abroad by non-residents. HEDGE FUNDS are investment pools, typically organized as private partnerships and often resident offshore for tax and regulatory purposes. These funds face few restrictions on their portfolios and transactions. Consequently, they are free to use a variety of investment techniques— including short positions, transactions in derivatives, and leverage—to raise returns and cushion risk. (IMF) HEDGING is offsetting an existing risk exposure by taking an opposite position in the same or a similar risk, for example, by buying derivatives contracts. (IMF) INVESTMENT, according to UNCTAD’s World Investment Reports, does not have a generally accepted meaning. Its components commonly include: portfolio investment (both equity and debt components), other capital flows (bank loans, nonblank loans and other flows), and various investment assets (both tangible and intangible, including intellectual property rights). The internationally accepted method for classifying cross-border foreign investment flows for balance-of-payments statistics divides them into:
- direct investment (FDI in World Bank terms), - portfolio investment, - financial derivatives, and - other investments.
The conceptual difference between FDI and portfolio investment is that FDI implies a long-term interest in, and/or significant management influence over, a foreign affiliate. In contrast, portfolio investment does not imply managerial control. For statistical purposes, a threshold of 10% of share ownership has been established to differentiate equity holdings of direct and portfolio investors. According to the IMF, FDI is ‘The acquisition abroad of physical assets, such as plant and equipment, or of a controlling stake (usually greater than 10 percent of shareholdings).’ However, many flows are difficult to classify, and the distinction between FDI and portfolio investment is often blurred. For example, investors may use their INVESTMENT-GRADE ISSUE is a bond that is assigned a rating in the top four categories by (Sub-investment-grade issues) commercial credit rating agencies. S&P classifies investment grade bonds as BBB or higher, and Moody’s classifies
71
investment grade bonds as Baa or higher. (Sub- investment-grade bond issues are rated bonds that are below investment-grade.) (IMF) assets as collateral to borrow from local capital markets and use the proceeds for hedging or speculation. LEVERAGE is the proportion of debt to equity. Leverage can be built up by borrowing (on-balance-sheet leverage, commonly measured by debt-to equity ratios) or by using off-balance-sheet transactions. (IMF) LONG-TERM EXTERNAL DEBT is defined as debt that has an original or extended maturity of more than one year and that is owed to nonresidents and repayable in foreign currency, goods, or services. NET FOREIGN DIRECT INVESTMENT (World Bank) or NET DIRECT INVESTMENT (UNCTAD) is foreign direct investment minus repatriated profits or earnings (i.e FDI inflows minus FDI outflows) NET CAPITAL FLOWS Net private capital flows comprise net direct investment, net portfolio investment, and other long- and short-term net investment flows including borrowing (IMF) NET FLOWS (or net lending or net disbursements) are disbursements minus principal repayments. NET TRANSFERS are net flows minus interest payments (or disbursements minus total debt service payments). Negative transfers show net transfers made by the borrower to the creditor during the year NET RESOURCE FLOWS (LONG TERM) are the sum of net resource flows on long-term debt (excluding IMF credit) plus non–debt-creating flows. NON–DEBT-CREATING FLOWS are net foreign direct investment, portfolio equity flows, and official grants (excluding technical cooperation). ODA Official Development Assistance. It is monitored and defined by the Development Assistance Committee of the OECD. OFFSHORE INSTRUMENTS are securities issued outside of national boundaries. (IMF) PORTFOLIO EQUITY FLOWS are the sum of country funds, depository receipts (American or global), and direct purchases of shares by foreign investors. PRIVATE CREDITORS include bonds, commercial banks, and other private creditors. Commercial banks and other private creditors comprise bank and trade-related lending. PUBLIC DEBT is an external obligation of a public debtor, including the national government, a political subdivision (or an agency of either), and autonomous public bodies. PUBLICLY GUARANTEED DEBT, which is an external obligation of a private debtor that is guaranteed for repayment by a public entity. RETRENCHMENT (from risk) is a reduction in the purchases or holdings of risky securities. (IMF) RISK AVERSION is the degree to which an investor who, when faced with two investments with the same expected return but different risk, prefers the one with the lower risk. That is, it measures an investor’s aversion to uncertain outcomes or payoffs. (IMF) SECONDARY MARKETS are markets in which securities are traded after they are initially offered/sold in the primary market. (IMF) SHORT-TERM EXTERNAL DEBT is defined as debt that has an original maturity of one year or less. Available data permit no distinction between public and private non-guaranteed short-term debt. SOLVENCY is the ability of an insurer to meet its obligations (liabilities) at any time. (IMF)
72
SOLVENCY REQUIREMENTS are the statutory requirements or rules on the required solvency margin and eligible capital elements, including the performance of the solvency test, to prove compliance with these requirements. (IMF) SOVEREIGN RISK is the risk of default on a sovereign loan, i.e. the risk attached to a loan or obligation due to the fact that the issuance originates from a country different from the country of the investor or lender. The difference may create problems of monitoring, enforcing, and collecting payments, in the event of default, bankruptcy, or repudiation. Lending to governments, public entities, or commercial enterprises abroad, all have elements of sovereign risk. In the case where the borrower is a government, sovereign risk is the risk that this government will default on its payment obligations, repudiate them, or declare a moratorium preventing all debtors in the country from honouring their foreign obligations. SPECIAL PURPOSE VEHICLE: A lending arrangement whereby, instead of pledging assets, a debtor might ‘sell’ lenders a ‘vehicle’, a corporate entity whose only purpose is to hold the assets. The special purpose vehicle, in turn, pledges to the financier, and remits the financing to the original holder of the assets, as payment for the assets. The vehicle is structured so that it will not become insolvent, even if the debtor does. Hence, the financier will be paid regardless of the debtor’s insolvency. (IMF) SUBSIDIES are unrequited payments that the government to citizens and/or enterprises on the basis of their consumption and/or production activities, whether these concern goods or services. Subsidies also include transfers to public corporations to compensate for losses they incur on their productive activities as a result of charging prices that are lower than their average costs of production due to a deliberate government economic and social policy. (IMF) SYNDICATED LOANS are large loans made jointly by a group of banks to one borrower. Usually, one lead bank takes a small percentage of the loan and partitions (syndicates) the rest to other banks. (IMF) TOTAL DEBT FLOWS include disbursements, principal repayments, net flows and transfers on debt, and interest payments. TOTAL DEBT STOCKS are defined as the sum of public and publicly guaranteed long-term debt, private non-guaranteed long-term debt, the use of IMF credit, and short-term debt. UNDERWRITING The process by which an insurance company determines whether or not and on what basis it will accept an application for insurance. (IMF)