chap 4 - cvp relationships.2
DESCRIPTION
AccountingTRANSCRIPT
© The McGraw-Hill Companies, Inc., 2010. All rights reserved.
292 Managerial Accounting, 13th Edition
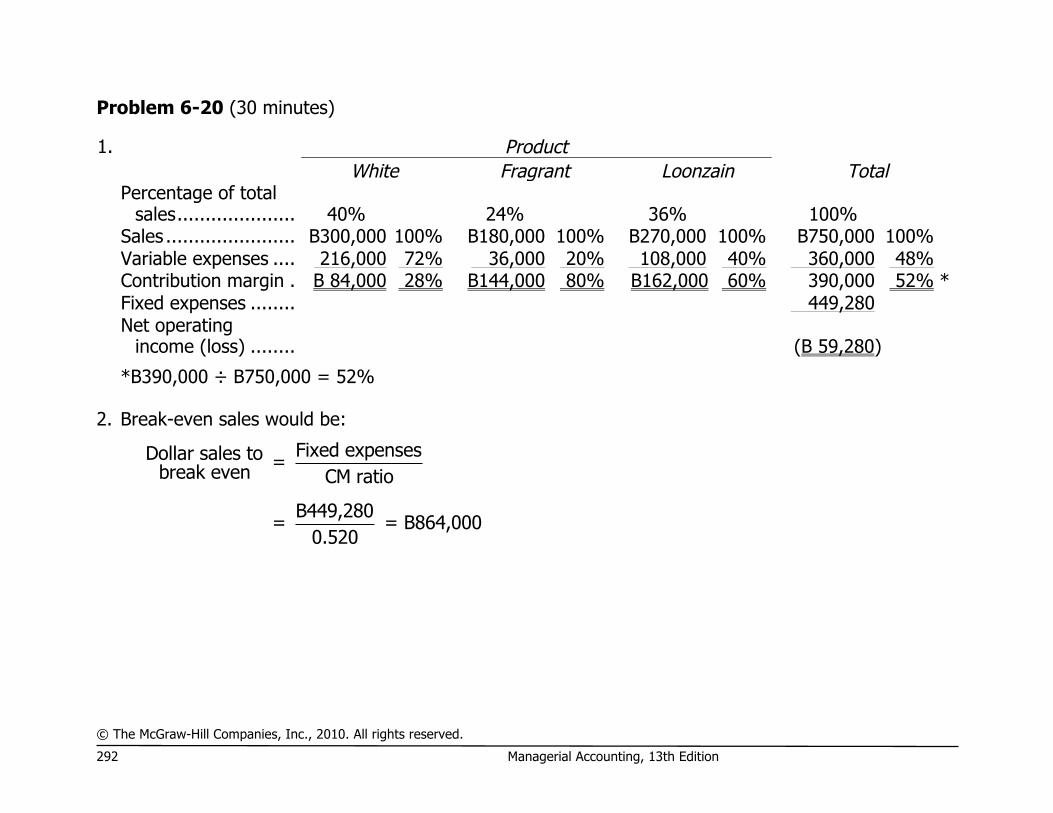
Problem 6-20 (30 minutes)
1. Product White Fragrant Loonzain Total
Percentage of total
sales ..................... 40% 24% 36%
100%
Sales ....................... B300,000 100% B180,000 100% B270,000 100% B750,000 100% Variable expenses .... 216,000 72% 36,000 20% 108,000 40% 360,000 48% Contribution margin . B 84,000 28% B144,000 80% B162,000 60% 390,000 52% * Fixed expenses ........ 449,280
Net operating
income (loss) ........
(B 59,280)
*B390,000 ÷ B750,000 = 52% 2. Break-even sales would be:
Fixed expensesDollar sales to = break even CM ratio
B449,280= = B864,000
0.520

© The McGraw-Hill Companies, Inc., 2010. All rights reserved.
Solutions Manual, Chapter 6 293
Problem 6-20 (continued)
3. Memo to the president:
Although the company met its sales budget of B750,000 for the month, the mix of products changed substantially from that budgeted. This is the reason the budgeted net operating income was not met, and the reason the break-even sales were greater than budgeted. The company’s sales mix was planned at 20% White, 52% Fragrant, and 28% Loonzain. The actual sales mix was 40% White, 24% Fragrant, and 36% Loonzain.
As shown by these data, sales shifted away from Fragrant Rice, which provides our greatest contribution per dollar of sales, and shifted toward White Rice, which provides our least contribution per dollar of sales. Although the company met its budgeted level of sales, these sales provided considerably less contribution margin than we had planned, with a resulting decrease in net operating income. Notice from the attached statements that the company’s overall CM ratio was only 52%, as compared to a planned CM ratio of 64%. This also explains why the break-even point was higher than planned. With less average contribution margin per dollar of sales, a greater level of sales had to be achieved to provide sufficient contribution margin to cover fixed costs.
© The McGraw-Hill Companies, Inc., 2010. All rights reserved.
294 Managerial Accounting, 13th Edition
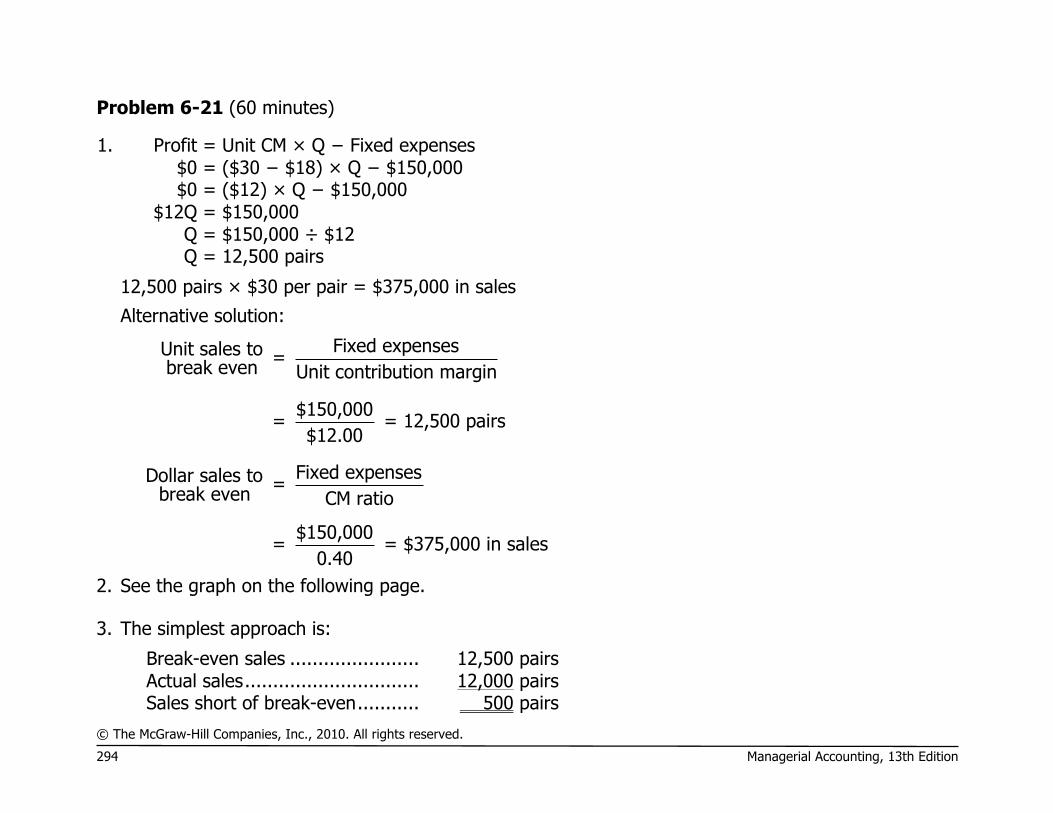
Problem 6-21 (60 minutes)
1. Profit = Unit CM × Q − Fixed expenses $0 = ($30 − $18) × Q − $150,000 $0 = ($12) × Q − $150,000 $12Q = $150,000 Q = $150,000 ÷ $12 Q = 12,500 pairs
12,500 pairs × $30 per pair = $375,000 in sales
Alternative solution:
Fixed expensesUnit sales to = break even Unit contribution margin
$150,000= = 12,500 pairs
$12.00
Fixed expensesDollar sales to = break even CM ratio
$150,000= = $375,000 in sales0.40
2. See the graph on the following page. 3. The simplest approach is:
Break-even sales ....................... 12,500 pairs Actual sales ............................... 12,000 pairs Sales short of break-even ........... 500 pairs

© The McGraw-Hill Companies, Inc., 2010. All rights reserved.
Solutions Manual, Chapter 6 295
500 pairs × $12 contribution margin per pair = $6,000 loss
Alternative solution: Sales (12,000 pairs × $30.00 per pair) .... $360,000 Variable expenses
(12,000 pairs × $18.00 per pair) .......... 216,000 Contribution margin ............................... 144,000 Fixed expenses ...................................... 150,000 Net operating loss .................................. ($ 6,000)
© The McGraw-Hill Companies, Inc., 2010. All rights reserved.
296 Managerial Accounting, 13th Edition
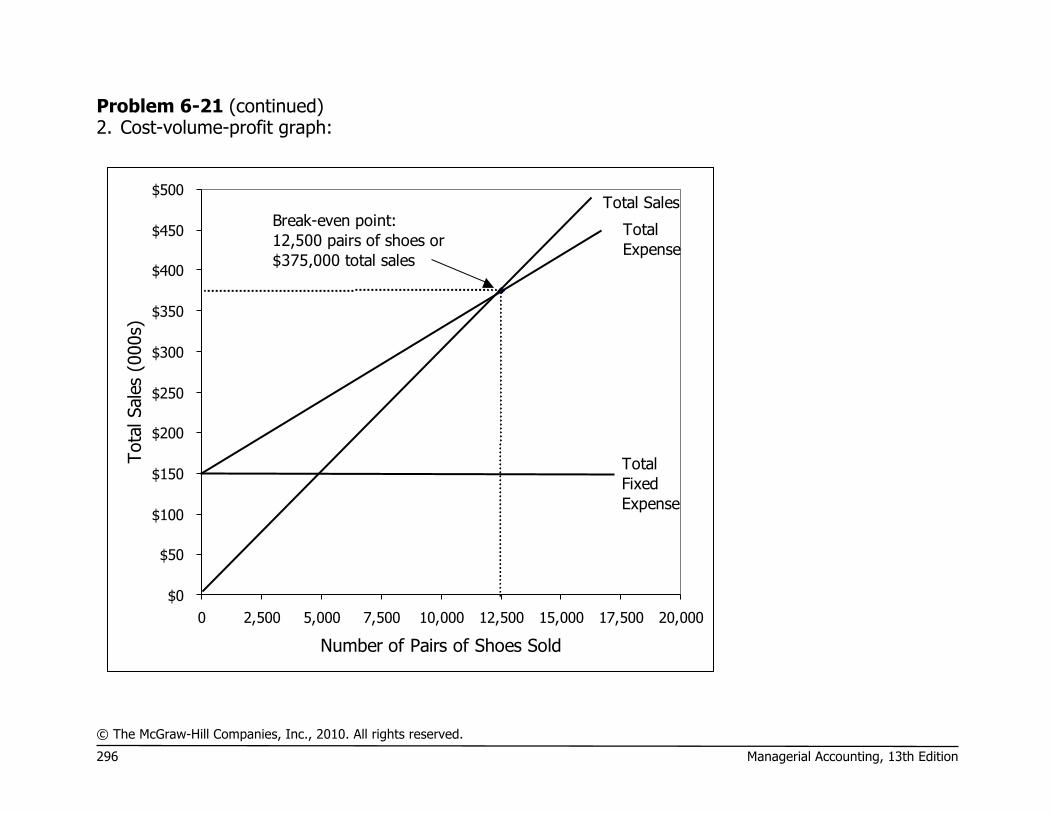
Problem 6-21 (continued) 2. Cost-volume-profit graph:
$0
$50
$100
$150
$200
$250
$300
$350
$400
$450
$500
0 2,500 5,000 7,500 10,000 12,500 15,000 17,500 20,000
Number of Pairs of Shoes Sold
Tota
l Sal
es (
000s
)
Break-even point:12,500 pairs of shoes or$375,000 total sales
Total Sales
Total Expenses
TotalFixed Expenses

© The McGraw-Hill Companies, Inc., 2010. All rights reserved.
Solutions Manual, Chapter 6 297
Problem 6-21 (continued)
4. The variable expenses will now be $18.75 ($18.00 + $0.75) per pair, and the contribution margin will be $11.25 ($30.00 – $18.75) per pair.
Profit = Unit CM × Q − Fixed expenses $0 = ($30.00 − $18.75) × Q − $150,000 $0 = ($11.25) × Q − $150,000 $11.25Q = $150,000 Q = $150,000 ÷ $11.25 Q = 13,333 pairs (rounded)
13,333 pairs × $30.00 per pair = $400,000 in sales
Alternative solution:
Fixed expensesUnit sales to = break even CM per unit
$150,000= = 13,333 pairs
$11.25
Fixed expensesDollar sales to = break even CM ratio
$150,000= = $400,000 in sales0.375
5. The simplest approach is:
Actual sales ................................ 15,000 pairs Break-even sales ........................ 12,500 pairs

© The McGraw-Hill Companies, Inc., 2010. All rights reserved.
298 Managerial Accounting, 13th Edition
Excess over break-even sales ...... 2,500 pairs
2,500 pairs × $11.50 per pair* = $28,750 profit
*$12.00 present contribution margin – $0.50 commission = $11.50
Alternative solution:
Sales (15,000 pairs × $30.00 per pair) .............. $450,000 Variable expenses (12,500 pairs × $18.00 per
pair; 2,500 pairs × $18.50 per pair) ............... 271,250 Contribution margin ......................................... 178,750 Fixed expenses ................................................ 150,000 Net operating income ....................................... $ 28,750

© The McGraw-Hill Companies, Inc., 2010. All rights reserved.
Solutions Manual, Chapter 6 299
Problem 6-21 (continued)
6. The new variable expenses will be $13.50 per pair.
Profit = Unit CM × Q − Fixed expenses $0 = ($30.00 − $13.50) × Q − $181,500 $0 = ($16.50) × Q − $181,500 $16.50Q = $181,500 Q = $181,500 ÷ $16.50 Q = 11,000 pairs
11,000 pairs × $30.00 per pair = $330,000 in sales
Although the change will lower the break-even point from 12,500 pairs to 11,000 pairs, the company must consider whether this reduction in the break-even point is more than offset by the possible loss in sales arising from having the sales staff on a salaried basis. Under a salary arrangement, the sales staff has less incentive to sell than under the present commission arrangement, resulting in a potential loss of sales and a reduction of profits. Although it is generally desirable to lower the break-even point, management must consider the other effects of a change in the cost structure. The break-even point could be reduced dramatically by doubling the selling price but it does not necessarily follow that this would improve the company’s profit.
© The McGraw-Hill Companies, Inc., 2010. All rights reserved.
300 Managerial Accounting, 13th Edition
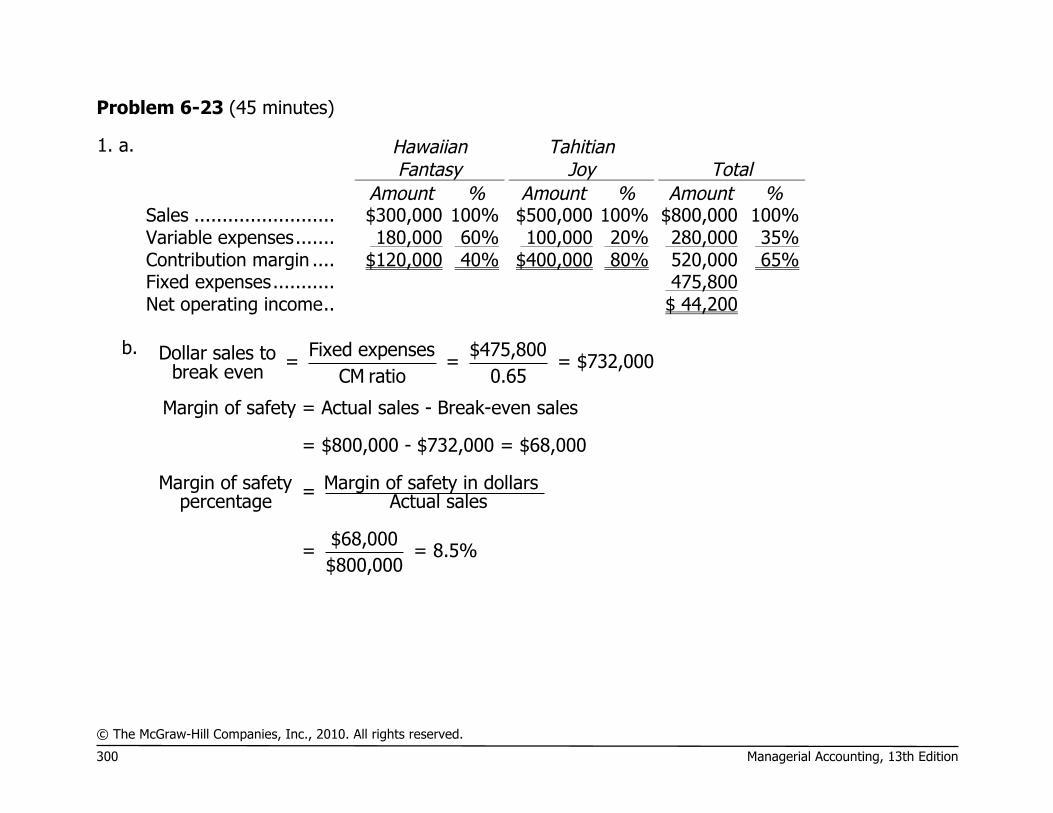
Problem 6-23 (45 minutes)
1. a.
Hawaiian Fantasy
Tahitian Joy
Total
Amount % Amount % Amount % Sales ......................... $300,000 100% $500,000 100% $800,000 100% Variable expenses ....... 180,000 60% 100,000 20% 280,000 35% Contribution margin .... $120,000 40% $400,000 80% 520,000 65% Fixed expenses ........... 475,800 Net operating income .. $ 44,200
b. Fixed expenses $475,800Dollar sales to = = = $732,000break even CM ratio 0.65
Margin of safety = Actual sales - Break-even sales
= $800,000 - $732,000 = $68,000
Margin of safety Margin of safety in dollars = percentage Actual sales
$68,000= = 8.5%$800,000

© The McGraw-Hill Companies, Inc., 2010. All rights reserved.
Solutions Manual, Chapter 6 301
Problem 6-23 (continued)
2. a. Hawaiian Fantasy
Tahitian Joy
Samoan Delight
Total
Amount % Amount % Amount % Amount % Sales ................. $300,000 100% $500,000 100% $450,000 100% $1,250,000 100.0%
Variable
expenses ........ 180,000 60% 100,000 20% 360,000 80% 640,000 51.2%
Contribution
margin ............ $120,000 40% $400,000 80% $ 90,000 20% 610,000 48.8% Fixed expenses .. 475,800
Net operating
income ........... $ 134,200