chap 4. software reliability - electrical engineeringitraore/seng426-06/notes/qual06-4-4.pdfchap 4....
TRANSCRIPT
1
4.4 Software Reliability Engineering (SRE)
1. Introduction2. SRE Process3. Reliability Targets4. Operational Profile5. Reliability Validation6. Example
Chap 4. Software Reliability
2
1. Introduction-Software reliability engineering (SRE) is the prediction, measurement,and management of software intensive systems, with the purpose ofachieving the highest customer satisfaction possible.
÷SRE can achieve significant reduction in testing and maintenance cost, betterresource and schedule control, and improved customer satisfaction.
-Software Reliability Engineering (SRE) is a multi-faceted disciplinecovering the software product lifecycle. It involves bothtechnical and management activities in three target areas:
÷Software reliability measurement, prediction, and estimation.÷Use of reliability target to guide software development process and maintenance.÷Study of the impact of software reliability metrics and activities on operational
software behavior.
3
A n a ly s isD e f in e
R e lia b il ity T a rg e ts
T e s t in g
C o d in g
D e s ig nD e v e lo p
o p e ra t io n a l p ro f i le s
R e lia b ili ty T e s t in g
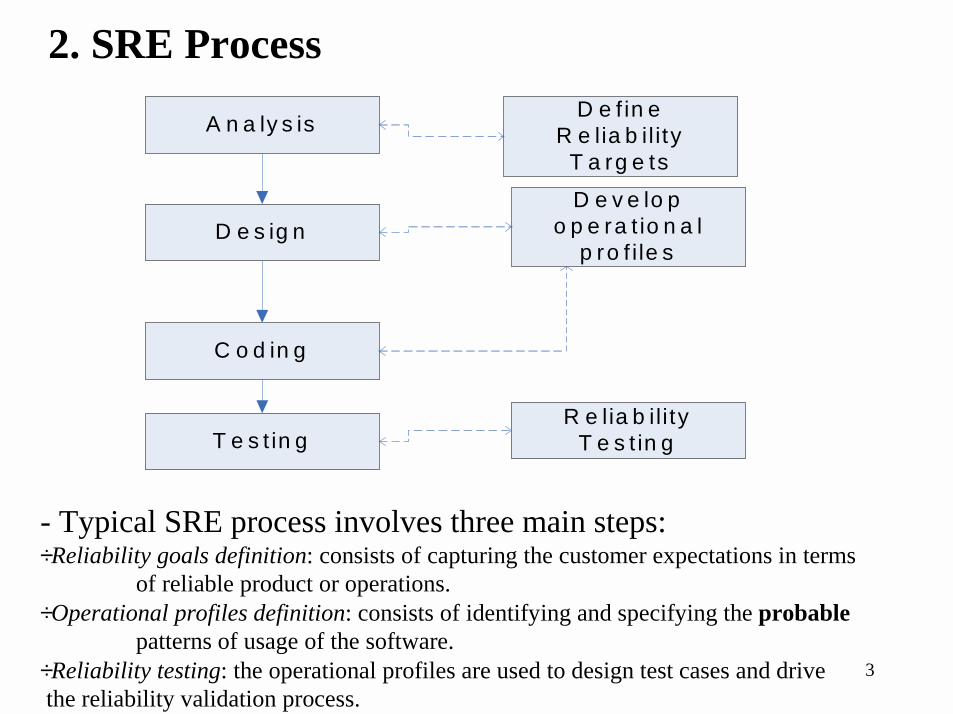
2. SRE Process
- Typical SRE process involves three main steps:÷Reliability goals definition: consists of capturing the customer expectations in terms
of reliable product or operations. ÷Operational profiles definition: consists of identifying and specifying the probable
patterns of usage of the software.÷Reliability testing: the operational profiles are used to design test cases and drivethe reliability validation process.
4
List associated systems
Define necessary reliability
Design Operational Profiles
Prepare for test
Use failure data to guidetest
Execute Test
Requirements Specification
Test Design &Implementation
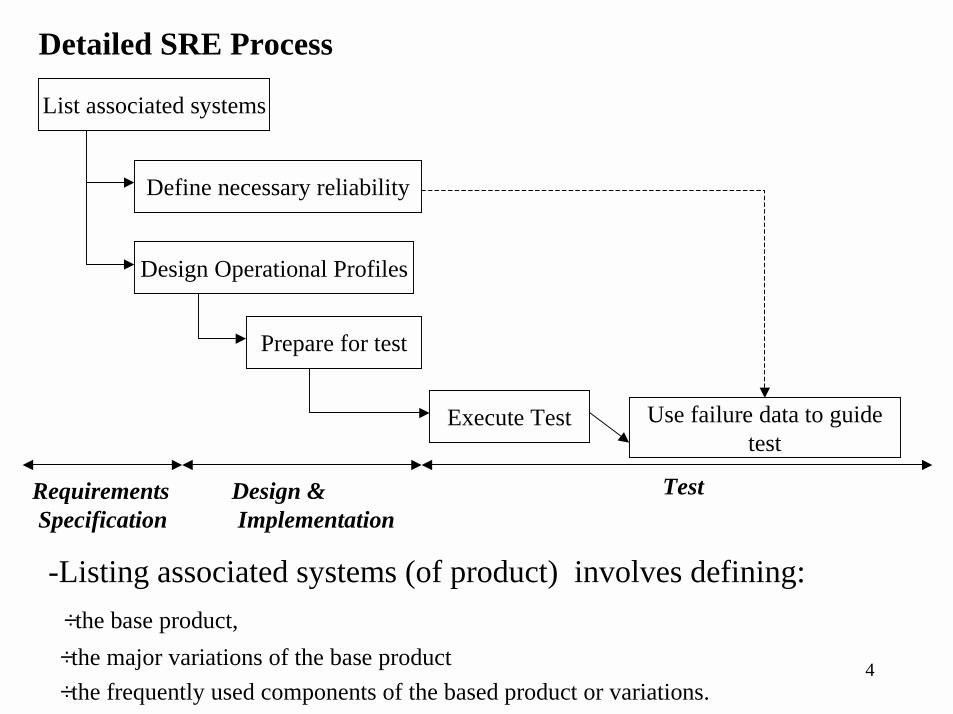
Detailed SRE Process
-Listing associated systems (of product) involves defining:÷the base product, ÷the major variations of the base product÷the frequently used components of the based product or variations.
5
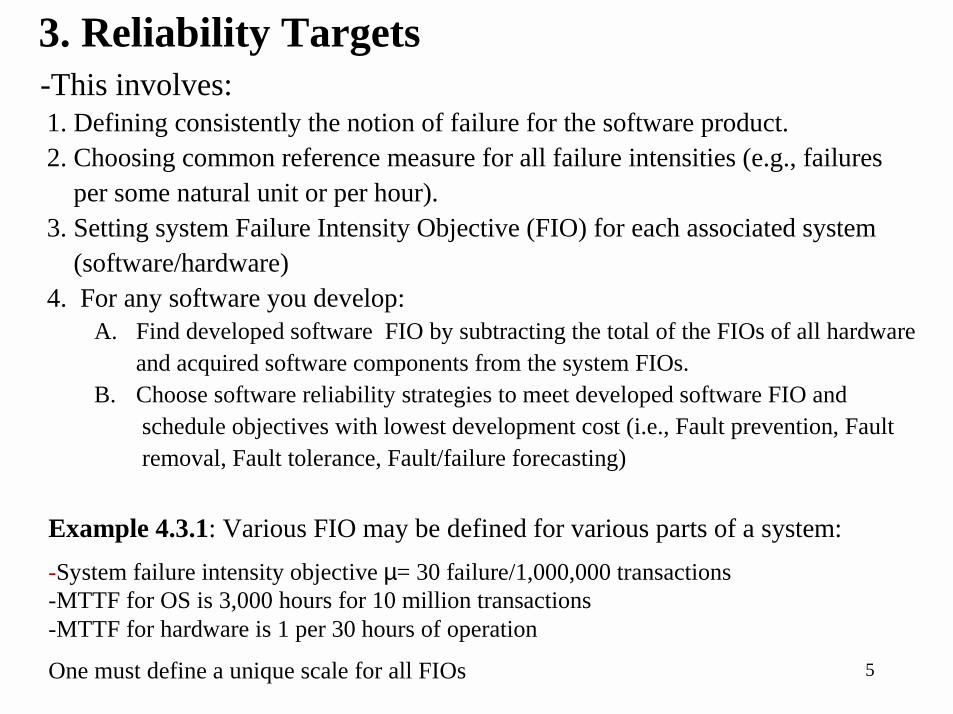
3. Reliability Targets-This involves:1. Defining consistently the notion of failure for the software product. 2. Choosing common reference measure for all failure intensities (e.g., failures
per some natural unit or per hour). 3. Setting system Failure Intensity Objective (FIO) for each associated system
(software/hardware)4. For any software you develop:
A. Find developed software FIO by subtracting the total of the FIOs of all hardwareand acquired software components from the system FIOs.
B. Choose software reliability strategies to meet developed software FIO andschedule objectives with lowest development cost (i.e., Fault prevention, Fault removal, Fault tolerance, Fault/failure forecasting)
Example 4.3.1: Various FIO may be defined for various parts of a system:-System failure intensity objective µ= 30 failure/1,000,000 transactions-MTTF for OS is 3,000 hours for 10 million transactions -MTTF for hardware is 1 per 30 hours of operation
One must define a unique scale for all FIOs
6
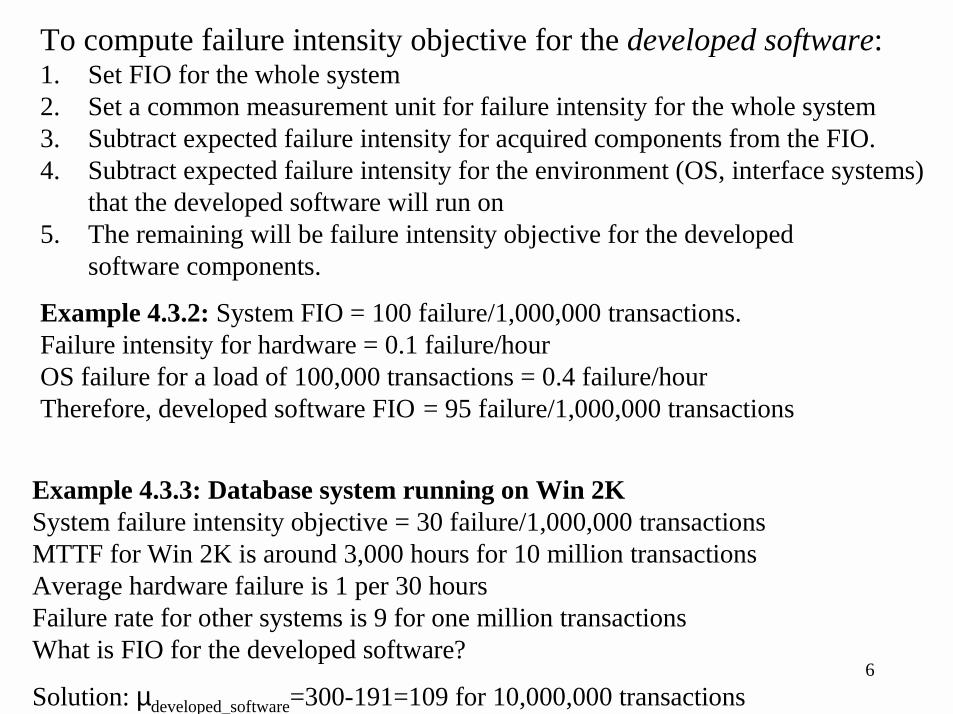
To compute failure intensity objective for the developed software: 1. Set FIO for the whole system 2. Set a common measurement unit for failure intensity for the whole system 3. Subtract expected failure intensity for acquired components from the FIO. 4. Subtract expected failure intensity for the environment (OS, interface systems)
that the developed software will run on 5. The remaining will be failure intensity objective for the developed
software components.
Example 4.3.2: System FIO = 100 failure/1,000,000 transactions. Failure intensity for hardware = 0.1 failure/hour OS failure for a load of 100,000 transactions = 0.4 failure/hourTherefore, developed software FIO = 95 failure/1,000,000 transactions
Example 4.3.3: Database system running on Win 2K System failure intensity objective = 30 failure/1,000,000 transactionsMTTF for Win 2K is around 3,000 hours for 10 million transactions Average hardware failure is 1 per 30 hours Failure rate for other systems is 9 for one million transactionsWhat is FIO for the developed software?
Solution: µdeveloped_software=300-191=109 for 10,000,000 transactions
7
4. Operational Profile-The operational profile of the software reflects how it will be usedin practice. ÷It consists of a specification of classes of input and the probability of their occurrence.÷It is relatively easy to assess the operational profile for a new software systemthat is replacing an existing manual or automated system.÷However, when the system is new and innovative it is more difficult to anticipatehow it will be used.
-The operational profile is based on the characteristics of the software environment, the functions used, their inputs and outputs,and their usage frequencies.
-Defining the operational profile involves identifying major system operations, their occurrence probabilities and their initiators:
1. Identify initiators of operations (i.e., user types, external systems, and the system itself) 2. Identify and list the operations invoked by each initiator3. Determine occurrence rates of the operations4. Determine occurrence probabilities by dividing the occurrence rates by the
total occurrence rate
8
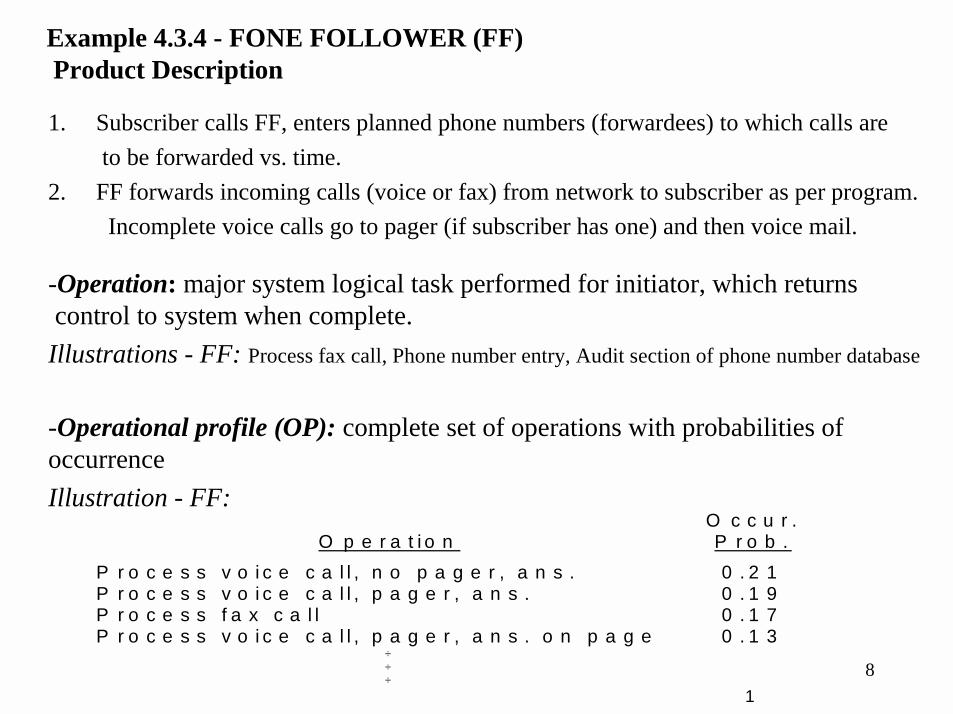
Example 4.3.4 - FONE FOLLOWER (FF) Product Description
1. Subscriber calls FF, enters planned phone numbers (forwardees) to which calls areto be forwarded vs. time.
2. FF forwards incoming calls (voice or fax) from network to subscriber as per program.Incomplete voice calls go to pager (if subscriber has one) and then voice mail.
-Operation: major system logical task performed for initiator, which returnscontrol to system when complete.
Illustrations - FF: Process fax call, Phone number entry, Audit section of phone number database
-Operational profile (OP): complete set of operations with probabilities of occurrenceIllustration - FF:
O p e r a t i o nO c c u r .P r o b .
P r o c e s s v o i c e c a l l , n o p a g e r , a n s . 0 . 2 1P r o c e s s v o i c e c a l l , p a g e r , a n s . 0 . 1 9P r o c e s s f a x c a l l 0 . 1 7P r o c e s s v o i c e c a l l , p a g e r , a n s . o n p a g e 0 . 1 3
÷÷÷
1
9
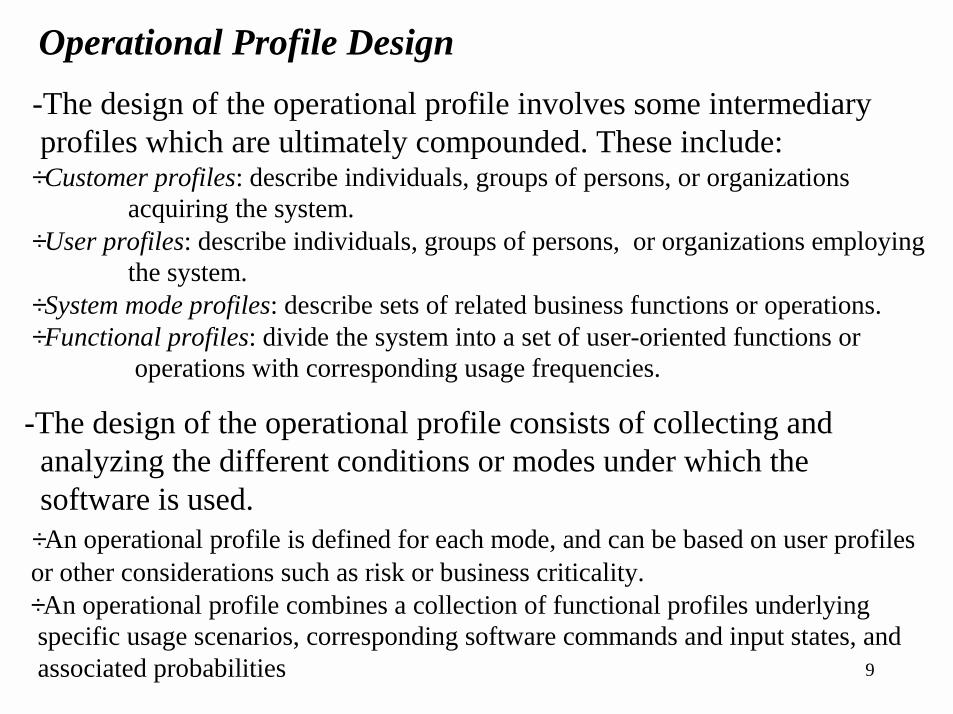
-The design of the operational profile involves some intermediaryprofiles which are ultimately compounded. These include:
÷Customer profiles: describe individuals, groups of persons, or organizations acquiring the system.
÷User profiles: describe individuals, groups of persons, or organizations employingthe system.
÷System mode profiles: describe sets of related business functions or operations.÷Functional profiles: divide the system into a set of user-oriented functions or
operations with corresponding usage frequencies.
-The design of the operational profile consists of collecting andanalyzing the different conditions or modes under which thesoftware is used.
÷An operational profile is defined for each mode, and can be based on user profilesor other considerations such as risk or business criticality. ÷An operational profile combines a collection of functional profiles underlyingspecific usage scenarios, corresponding software commands and input states, andassociated probabilities
Operational Profile Design
10
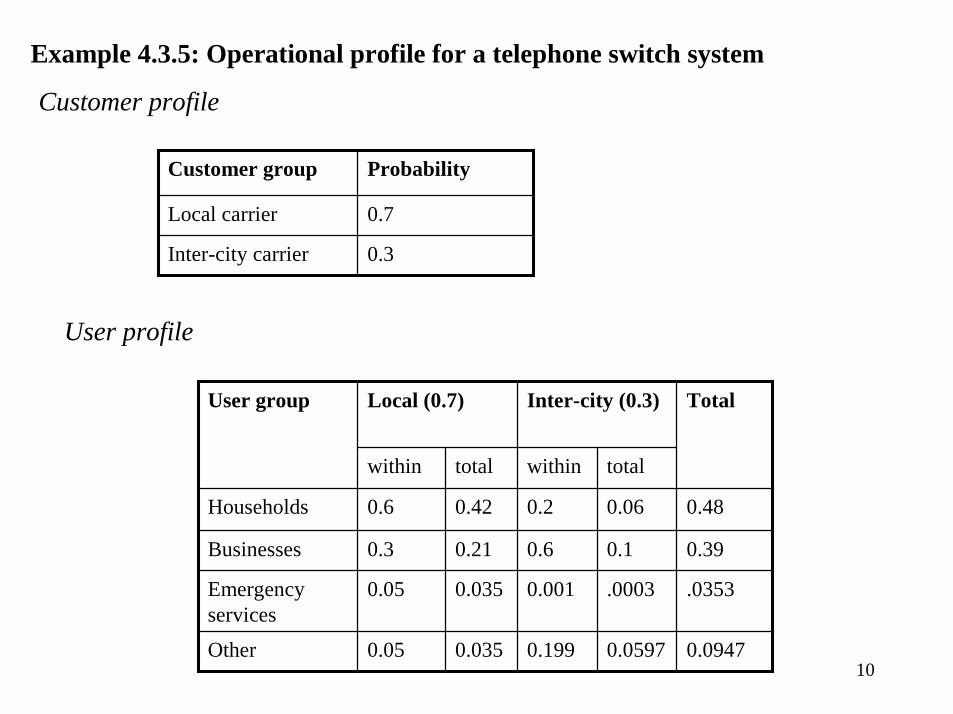
Example 4.3.5: Operational profile for a telephone switch system
Customer profile
0.3Inter-city carrier
0.7Local carrier
ProbabilityCustomer group
User profile
totaltotal withinwithin
0.0597
.0003
0.1
0.06
0.035
0.035
0.21
0.42
0.09470.1990.05Other
.03530.0010.05Emergency services
0.390.60.3Businesses
0.480.20.6Households
TotalInter-city (0.3)Local (0.7)User group
11
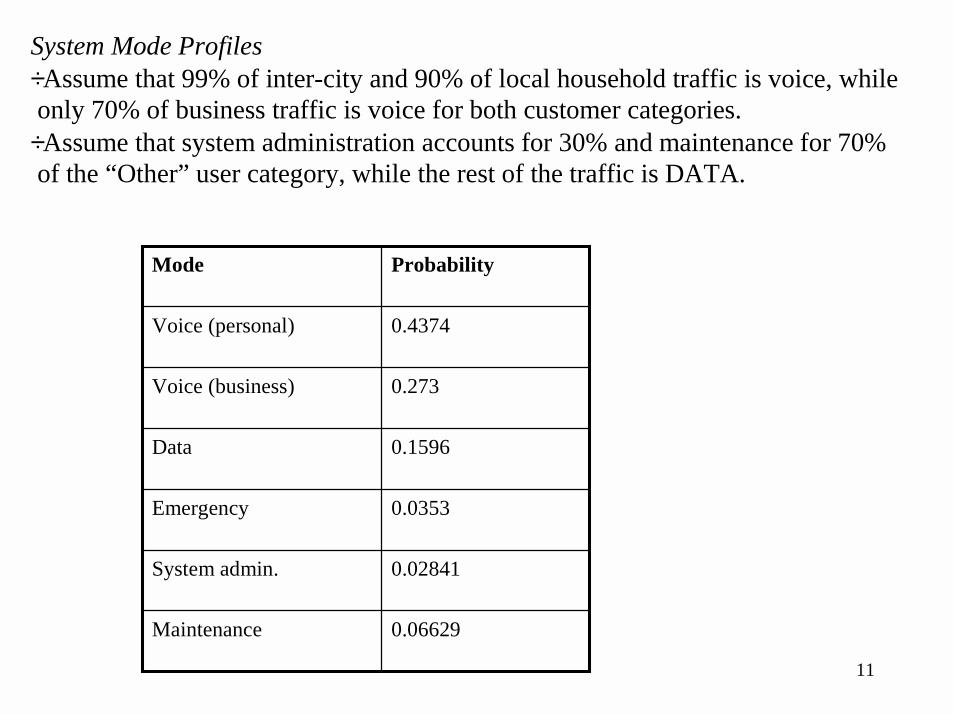
System Mode Profiles÷Assume that 99% of inter-city and 90% of local household traffic is voice, whileonly 70% of business traffic is voice for both customer categories. ÷Assume that system administration accounts for 30% and maintenance for 70% of the “Other” user category, while the rest of the traffic is DATA.
0.06629Maintenance
0.02841System admin.
0.0353Emergency
0.1596Data
0.273Voice (business)
0.4374Voice (personal)
ProbabilityMode
12
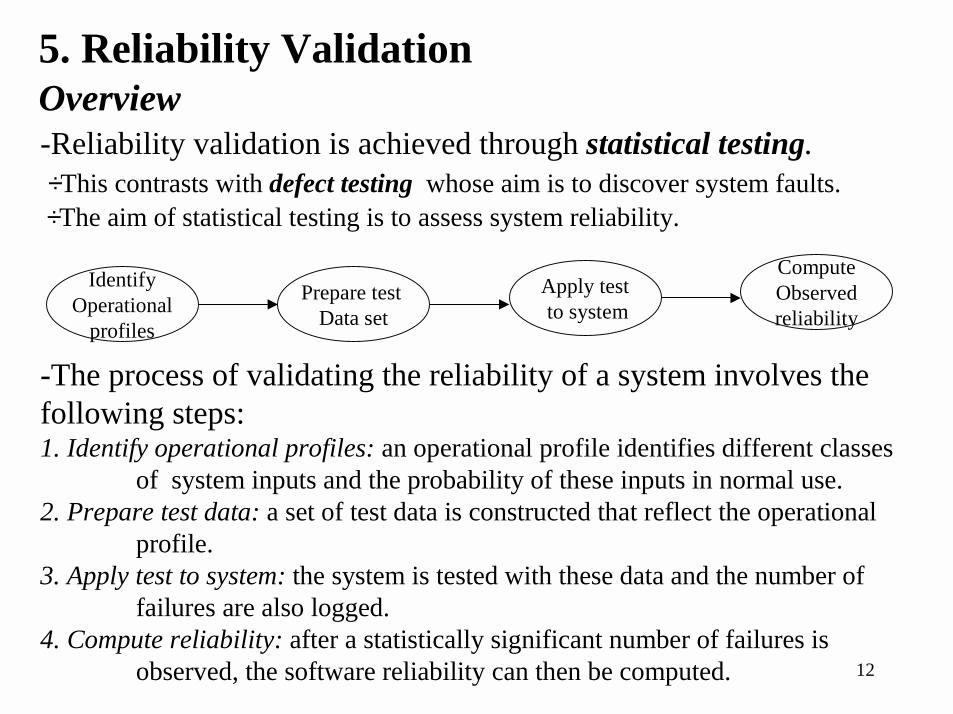
5. Reliability Validation
-The process of validating the reliability of a system involves thefollowing steps:1. Identify operational profiles: an operational profile identifies different classes
of system inputs and the probability of these inputs in normal use.2. Prepare test data: a set of test data is constructed that reflect the operational
profile.3. Apply test to system: the system is tested with these data and the number of
failures are also logged.4. Compute reliability: after a statistically significant number of failures is
observed, the software reliability can then be computed.
-Reliability validation is achieved through statistical testing. ÷This contrasts with defect testing whose aim is to discover system faults.÷The aim of statistical testing is to assess system reliability.
IdentifyOperational
profiles
ComputeObservedreliability
Apply testto system
Prepare test Data set
Overview
13
-However, statistical testing is not easy to apply in practice. Theprincipal difficulties include:÷Operational profiles may not be an accurate reflection of the real use of the system.÷Defining a large amount of test data may be time consuming and expensive ifit is not possible to generate this data automatically.÷It is important to generate a statistically significant number of failures to allowaccurate reliability measurements.
14
Sequence of System Test 1. Acquired components: Certification test only 2. Developed product: Feature test and then load test for a new product; Feature
test, and then regression test for subsequent releases 3. Other systems interface: Load test only
-It is possible to change this sequence or testing different systems in parallel.
Types of Test÷Certification Test: Accept or reject (binary decision) an acquired component fora given target failure intensity. ÷Feature Test: A single execution of an operation with interaction between operations minimized. ÷Load Test: Testing with field use data and accounting for interactions ÷Regression Test: Feature tests after every build involving significant change, i.e.,check whether a bug fix worked.
15
Test Preparation
-Use the operational profiles to prepare test cases and test procedures.
-This involves the following activities:
1. Specify new test cases for new operationsA. Distribute new test cases to new operations based on operational profile
Illustration - FF:Allocate 17% of test cases to Proc. fax call operation
B. Detail new test cases for each new operation by selecting from possible choices ofinput variable values with equal probability
Illustration - FF:Forwardee = Local calling area
2. Specify test procedure, based on the test operational profile. The test procedureis the controller that invokes test cases during execution.
16
-This involves the following tasks:1. Determine and allocate test time among associated systems and types of
test (i.e., feature, load, regression) 2. Invoke test in accordance with operational profile: this involves choosing
operations randomly in accordance with the operational profile.3. Identify system failures and when they occurred 4. Use data to guide testing.
Test Execution
-In the reliability growth test, perform feature test first and thenload test. Then conduct regression test after each build that has asignificant change.
÷Invocation of test cases should occur at random times. ÷In feature test select in random order from the set of all new test casesplus the regression test cases of the previous release. ÷In load test, invoke each operational mode for its allocated proportionof time. The number of test cases invoked will be determined basedon the time the operational mode runs and its occurrence rate.
17
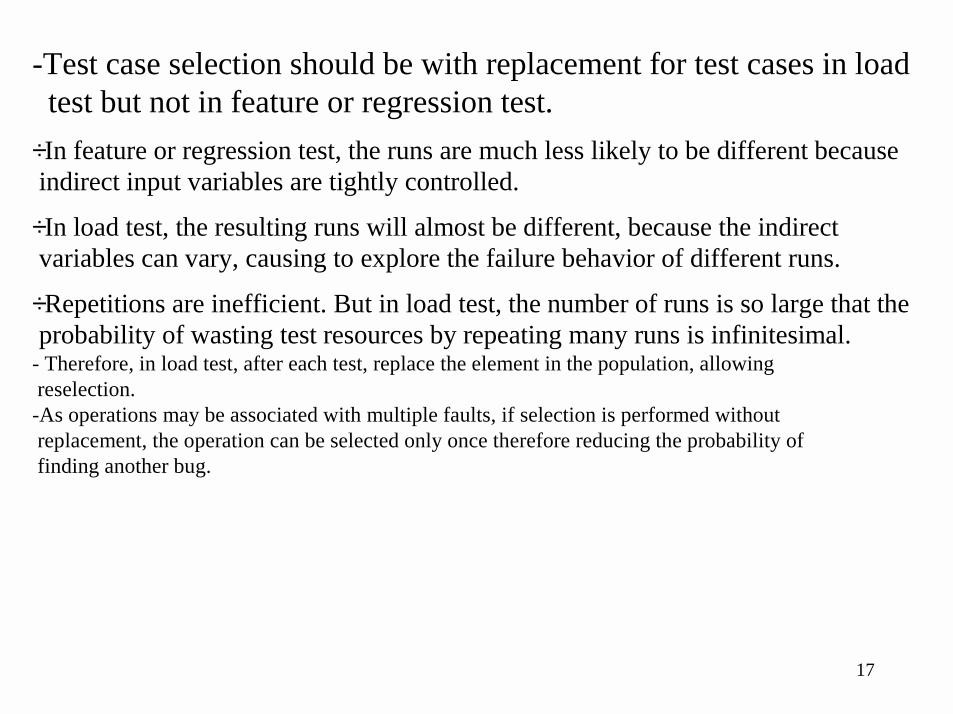
-Test case selection should be with replacement for test cases in loadtest but not in feature or regression test.
÷In feature or regression test, the runs are much less likely to be different becauseindirect input variables are tightly controlled.
÷In load test, the resulting runs will almost be different, because the indirectvariables can vary, causing to explore the failure behavior of different runs.
÷Repetitions are inefficient. But in load test, the number of runs is so large that theprobability of wasting test resources by repeating many runs is infinitesimal.
- Therefore, in load test, after each test, replace the element in the population, allowingreselection. -As operations may be associated with multiple faults, if selection is performed withoutreplacement, the operation can be selected only once therefore reducing the probability offinding another bug.
18
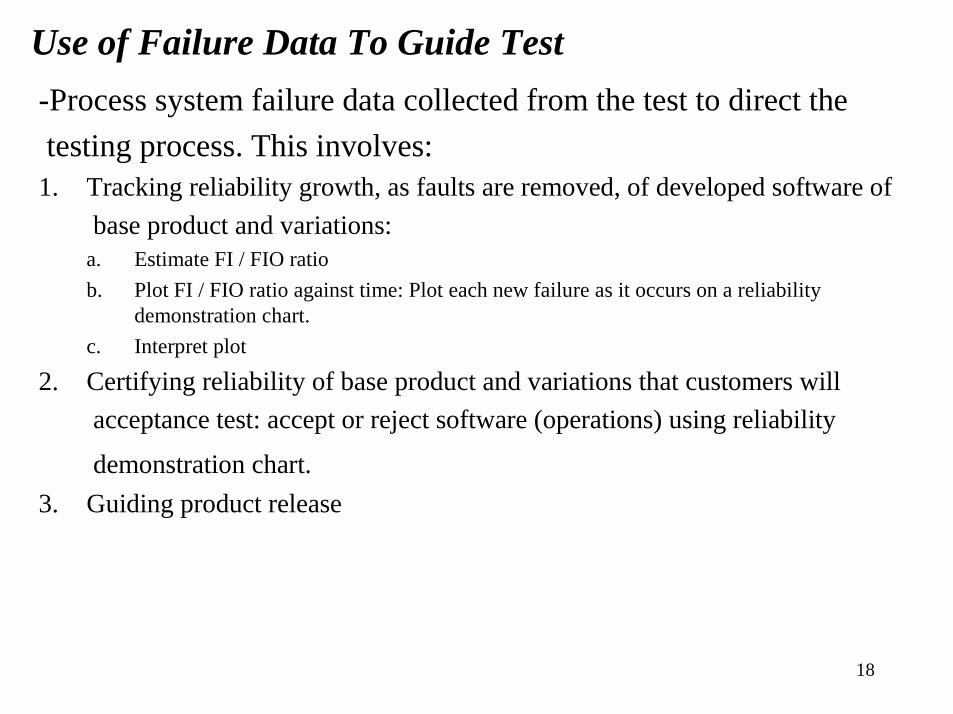
Use of Failure Data To Guide Test-Process system failure data collected from the test to direct thetesting process. This involves:
1. Tracking reliability growth, as faults are removed, of developed software ofbase product and variations:
a. Estimate FI / FIO ratiob. Plot FI / FIO ratio against time: Plot each new failure as it occurs on a reliability
demonstration chart. c. Interpret plot
2. Certifying reliability of base product and variations that customers willacceptance test: accept or reject software (operations) using reliability
demonstration chart.3. Guiding product release
19
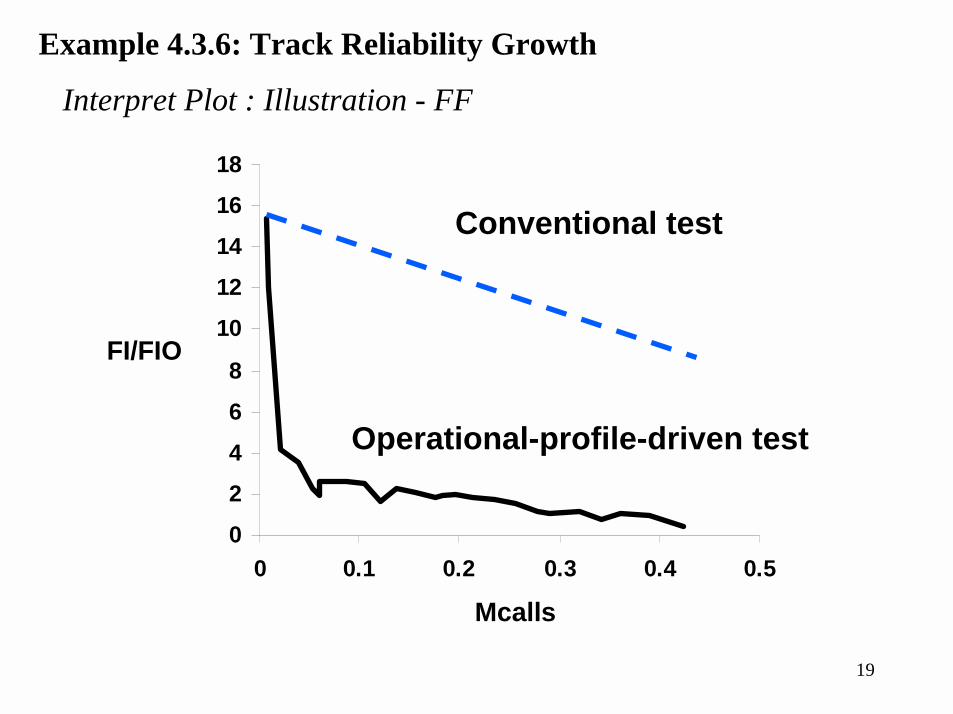
FI/FIO
Mcalls
0
2
4
6
8
10
12
14
16
18
0 0.1 0.2 0.3 0.4 0.5
Conventional test
Operational-profile-driven test
Example 4.3.6: Track Reliability Growth
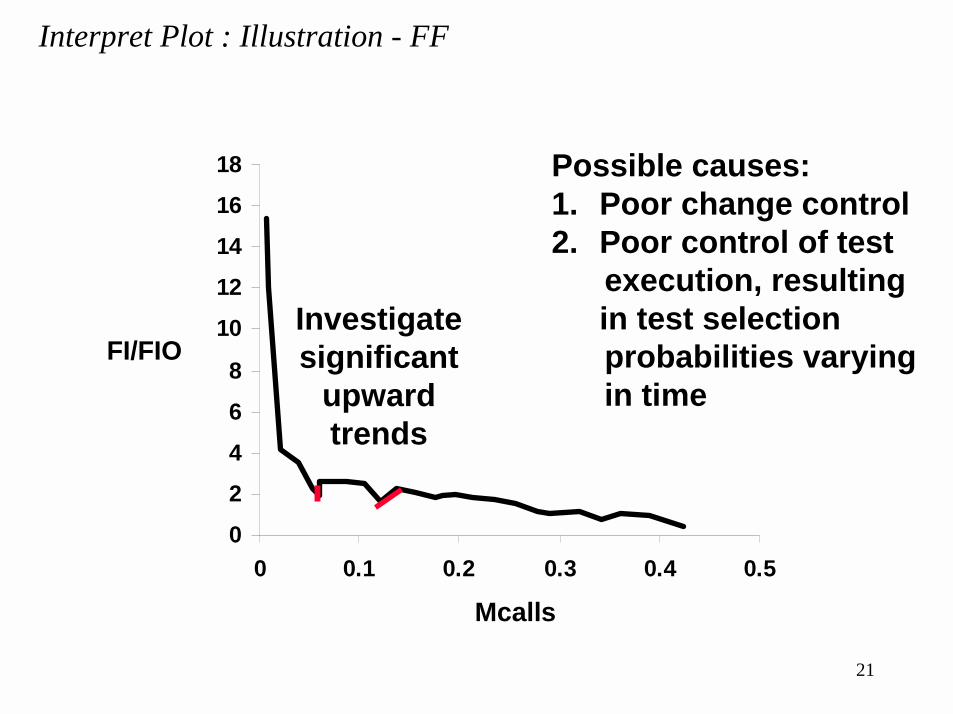
Interpret Plot : Illustration - FF
20
0
2
4
6
8
10
12
14
16
18
0 0.1 0.2 0.3 0.4 0.5
FI/FIO
Mcalls
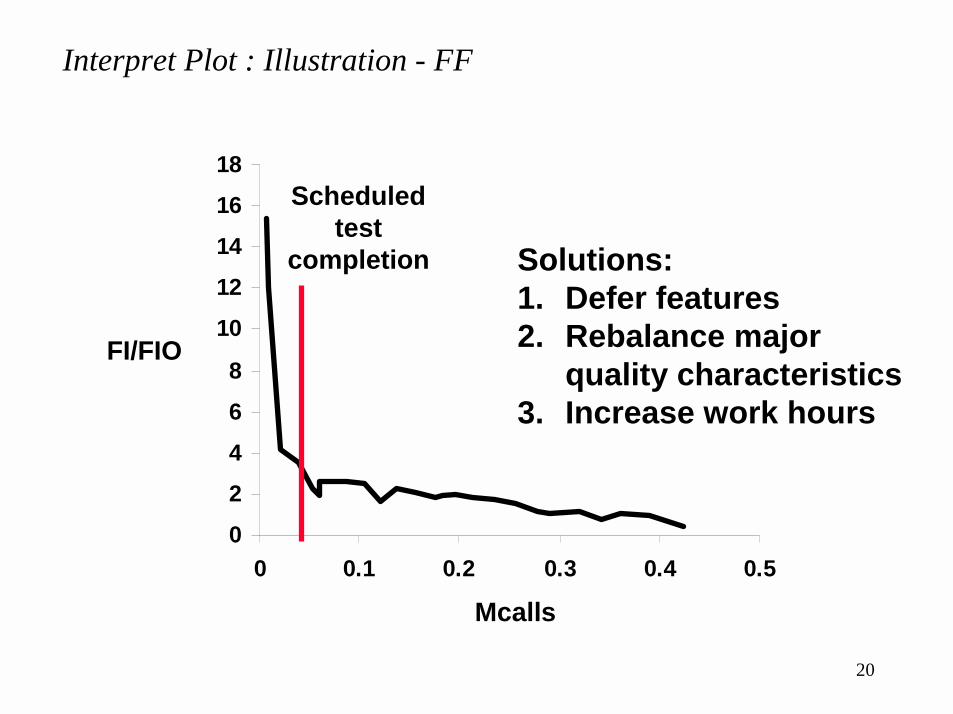
Solutions:1. Defer features2. Rebalance major
quality characteristics3. Increase work hours
Scheduledtest
completion
Interpret Plot : Illustration - FF
21
0
2
4
6
8
10
12
14
16
18
0 0.1 0.2 0.3 0.4 0.5
FI/FIO
Mcalls
Investigatesignificant
upwardtrends
Possible causes:1. Poor change control2. Poor control of test
execution, resultingin test selectionprobabilities varyingin time
Interpret Plot : Illustration - FF
22
Mcalls
0
2
4
6
8
10
12
14
16
18
0 0.1 0.2 0.3 0.4 0.5
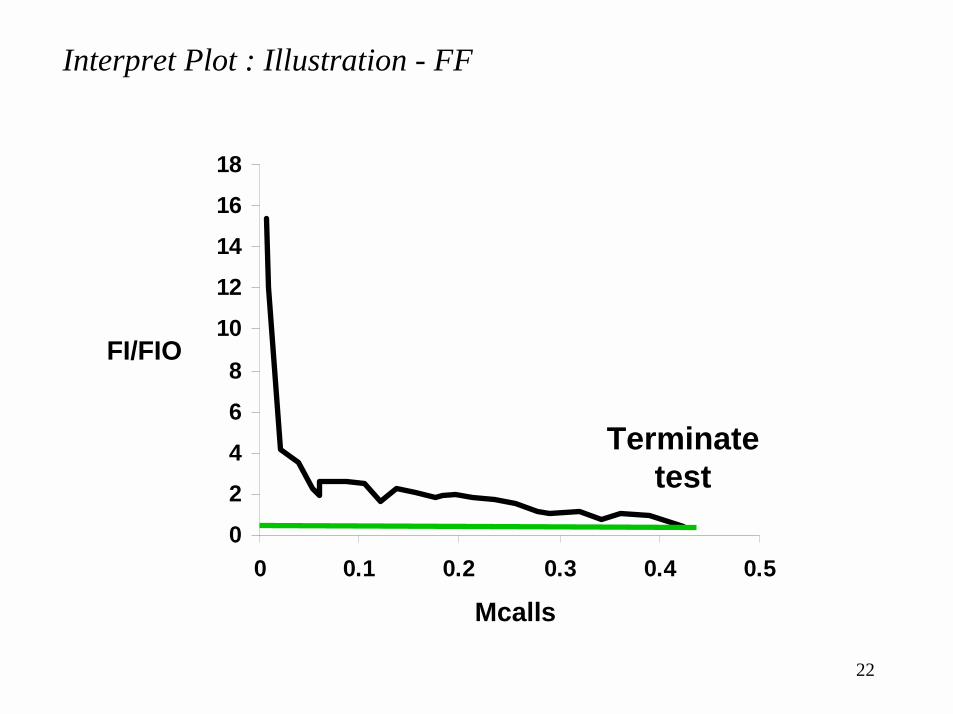
FI/FIO
Terminatetest
Interpret Plot : Illustration - FF
23
12
0 10862 4
1614
024
6
810
Normalized units
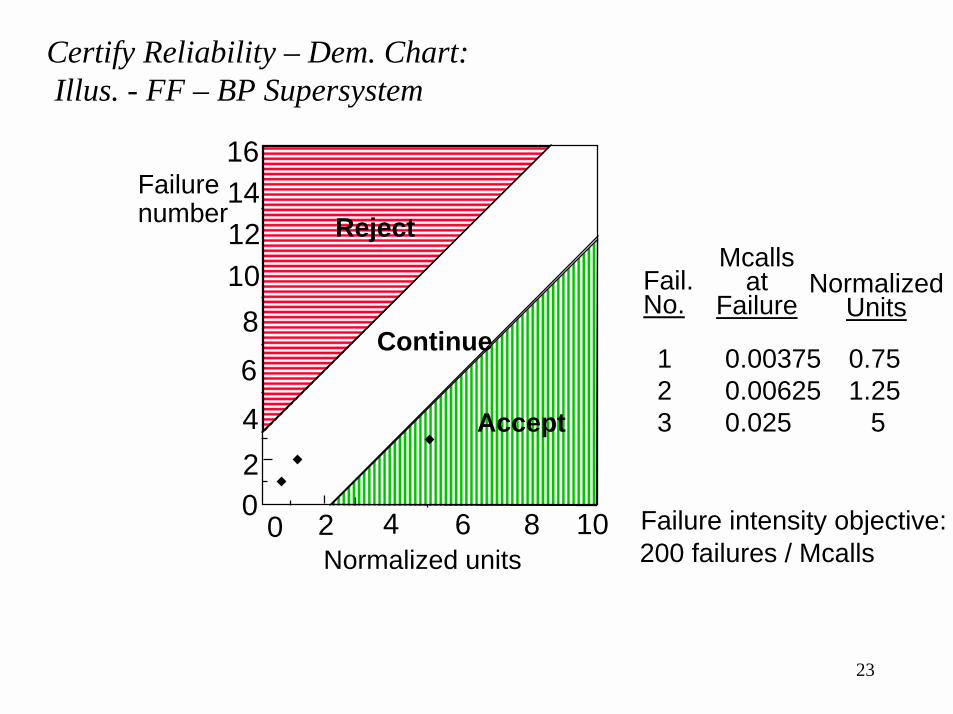
Failurenumber
Continue
Accept
Reject
Fail.No.
Mcalls at
FailureNormalized
Units
123
0.003750.006250.025
0.751.25
5
Failure intensity objective:200 failures / Mcalls
Certify Reliability – Dem. Chart:Illus. - FF – BP Supersystem