chapter 1 - aging societies: the setting for aging social policy
TRANSCRIPT
3
1Aging SocietiesThe Setting for Aging Social Policy
Introduction
For the past 25 years, politicians, academics, and laypeople have been discussing the fact that the world’s population—in the United States and elsewhere—is aging. The year 2000 marked the first time in human history that the number of older adults reached 600 million, and that number is expected to climb well into the middle of this century to a projected 2 billion (United Nations, 2007). Virtually all countries, with the exception of Africa, have experienced or are on the verge of experi-encing a marked growth in their aging population. This population aging has caused a discussion across the globe about how social policy should respond to this demographic shift. Should retire-ment age increase? What can be done to protect the solvency of public pension systems and health care services? How should our communities respond with regard to providing social services, hous-ing environments, and transportation? How will social policies support families in their role of primary caregiver? We are indeed living through a unique period in history and a time in which governments will be compelled to consider myriad aging social policy questions.
❖
The world stands on the threshold of a demographic revolution with few parallels in humanity’s past. It’s called global aging, and in the coming decades it will subject nations around the world to extraordinary economic, social, and political challenges.
—Center for Strategic and International Studies
I am a dressmaker, and I always worked at home. My husband who worked in a factory nearby died 6 years ago, and now I get his pension, [as] I haven’t got my own pension. I have one son who lives in the flat above mine and one daughter who lives 2 km away. [My] small pension is not a lot, but I do not have great needs. The house is mine, I have no car, I do not buy clothes because I make my own; so I manage to get by. I do not think a lot about the future, perhaps during the night, but then I say to myself, “Let’s live day by day,” and I do just that. I hope to be healthy, and I hope not to be a burden to my son and daughter later on in life.
— Mrs. C., age 70, Piedmonte Region, Italy
4 ❖ PART I THE CONTEXT OF AGING SOCIAL POLICY
We use two approaches to introduce you to aging social policy. First, we have cho-sen to use an international comparison approach that will give us the opportunity to compare and contrast U.S. aging social policy with policies in other countries. Learning about U.S. aging policy can be enhanced by becoming aware of how other countries approach the same social policy issues. As Hill (2006) points out, social policy comparisons have a practical purpose—they show us that there are alternative ways of doing things, and we can learn from the experiences of other countries.
However, making international comparisons is a challenging undertaking for a number of reasons. Terminology and meanings vary by country (e.g., home health, homemaker) and many countries, such as Italy, have a decentralized approach to social policy implementa-tion; so one must be cautious when making generalizations about an entire country. Perhaps the biggest challenge is the variability between countries in the amount of information and data readily available about a given social policy topic. Thus, the selection of countries to include in each chapter was somewhat restricted, because in some cases, particularly for non-European countries, there was not sufficient data available to make meaningful com-parisons. In contrast, data on European countries are gathered and regularly reported by organizations such as the Organization for Economic Cooperation and Development and EuroStat. We did, however, attempt to include non-European countries when possible. In addition, and not surprisingly, some topics such as retirement income and family care offer quite an extensive amount of data and information from which different countries can draw. Information about other topics such as mental health is a bit more scant. Thus, you will notice that some chapters provide a more in-depth discussion than do others.
The daunting task of selecting only two to five non-U.S. countries for each chapter was guided by how well a country could help illustrate the different governmental approaches to the social policy issue being discussed. The countries selected will provide you with some insight into the different social policy choices that are made to address the same social issue, such as retirement income in later life. We hope that by the end of each chapter, you will be compelled to find out more about the social policy approaches of countries we discussed, as well as countries we did not discuss. It should also be noted here that our approach to select four or five different countries to compare differs from other notable texts that briefly discuss policy topics for 20 or more countries (e.g., Giarchi, 1996; Kosberg, 1994) or those that take an in-depth look at a handful of countries with regard to a particular topic, such as family care (e.g., Blackman, Brodhurst, & Convery, 2001).
Our second approach in writing this book was to draw attention to the link between policies and people. Social policy discourse and analyses occur at the macrolevel and can easily become separated from the impact that such policies have on the day-to-day lives and quality of life of older adults—in other words, what occurs at the microlevel. We refer to this as the policy-person link. The policy-person link is a reminder that the existence and characteristics of a policy will influence the conditions that older people experience—for example, the quality of their retirement experience; their access to medical care, transportation, and housing; and even facilitate their social interactions. Consider the following circumstances of a caregiver in the United States:
My mother needs kidney dialysis three times a week for 3 hours a day. I work full-time, so I tried to arrange for specialized public transportation provided by the city to take her to and from the dialysis clinic. But they tell me they have limited service—so they can
Chapter 1 Aging Societies ❖ 5
drop her off, but they can’t arrange to pick her up. I could arrange to use my vacation days and take off from work to take her myself, but I am not strong enough to transfer her in and out of my car. I asked the staff in the dialysis clinic to help me take her from the clinic to my car in the parking lot, but they tell me they are prohibited from leaving the clinic to help me. She also needs help with basic needs—meal preparation, bathing, and clean-ing. But we can’t afford the cost of home help. I need help, but I’ve run out of options.
It is possible that this caregiver’s experience would be different if there were policies in place that made specialized transportation services more accessible, that provided assistance to help pay for a home help aid, or that provided paid leave from work to engage in caring activities. Being mindful of the policy-person link is one way to think about social policy outcomes and the role governments play in addressing the economic, health, and social needs of older adults. At the end of this chapter, we pro-vide a case study of an older adult that you can use throughout this book to illustrate how aging policies in different countries influence the day-to-day lives of older adults.
Organization of Remaining Chapters
We begin each chapter by highlighting the policy-person link with two quotes—one from a politician or leader in the field of gerontology, public policy, or an organizational body involved in policymaking and one from an older adult whom we interviewed for this book.1 We then provide, if available, macrolevel country data on the topic at hand to give you a sense of the scope of the issue on a global scale. This is followed by a separate discussion of each country we selected to include; by the end of the chapter, you will be able to compare and contrast the different policy approaches. We also embedded text boxes in each chapter to illustrate a connection between policy and people or policy and practice. At the end of each chapter, we provided more resources so that you can further explore the topic. We concluded with an interview of an older adult that will give you some insight into their daily lives and concerns and give you an opportunity to consider how their lives are influenced by the existence or absence of social policies.
Chapter 2 discusses the social policy process and the different factors that influence the creation and characteristics of social policies. We include a brief explanation of the federal legislative process in the United States and end that chapter with an overview of key international and U.S. aging policies. The next five chapters explore specific social policy themes of retirement income (Chapter 3), employment (Chapter 4), housing (Chapter 5), health care (Chapter 6), and mental health (Chapter 7). The next two chapters examine social policies that are more community-based. Chapter 8 examines community-based support policies, and Chapter 9 closes this section of chapters with a discussion about family care policy. Our last chapter (Chapter 10) summarizes the future challenges for aging social policy. We hope that this book expands your knowledge about aging social policy in the United States and elsewhere and increases your awareness that social policy decisions can make a marked difference in the quality of life of older adults.
We should also mention how we deal with different terminology and their spelling in this book. You will notice that in many chapters, we use the words aging and ageing
1. Please note that these interviews are not meant to be generalized to a country’s elderly popu-lation as a whole; rather, they are used to illustrate the policy-person connection.

6 ❖ PART I THE CONTEXT OF AGING SOCIAL POLICY
Fertility Rates and Life Expectancy
There are two primary reasons why the vast majority of countries in the world have experienced population aging. First is the decline in fertility rates, or the number of
interchangeably, as the latter is the common spelling used outside the United States. The same is true for the words caregiver and carer, the latter word being most often used in European countries to identify a person in the family designated to provide care and support to an elderly family member. Because we feel that it is important to honor these and other linguis-tic distinctions throughout the book, you will see differing spelling and usage of these terms.
For the remainder of this chapter, we will discuss in more detail one reason why aging social policy has risen to the forefront of political discourse across the globe—the growing number of older adults. We will discuss what has contributed to this increase and provide an overview of population aging statistics worldwide.
Population Aging
When we use the term population aging, we are referring to the demographic character-istics of a country whereby its older adults—usually those over the age of 60 or 65—account for an increasing proportion of the total population. In this next section, we will discuss factors that are responsible for an increase in the aged population and the extent of population aging in the United States and other countries. We have provided definitions of the demographic terms we use in this chapter in Box 1.1.
Total fertility rate: the average number of children a woman would bear over the course of her lifetime if current age-specific fertility rates remained constant throughout her childbearing years (normally between the ages of 15 and 49)
Life expectancy: the average number of additional years a person of that age could expect to live if current mortality levels observed for ages above that age were to continue for the rest of that person’s life. So life expectancy at birth is the average number of years a newborn would live if current age-specific mortality rates were to continue, and life expectancy at age 65 is the average number of years a person at age 65 would live if current age-specific mortality rates were to continue
Youth dependency ratio: the number of persons aged 0 to 14 years per one hundred persons aged 15 to 64
Old-age dependency ratio: the number of persons aged 65 years or older per one hundred per-sons aged 15 to 64
Total dependency ratio: the number of persons under age 15 plus persons aged 65 or older per one hundred persons aged 15 to 64; the sum of the youth dependency ratio and the old-age dependency ratio
Population ageing: the process whereby older individuals account for a proportionally larger share of the total population
Source: United Nations, (2007).
BOX 1.1 Demographic Definitions
Chapter 1 Aging Societies ❖ 7
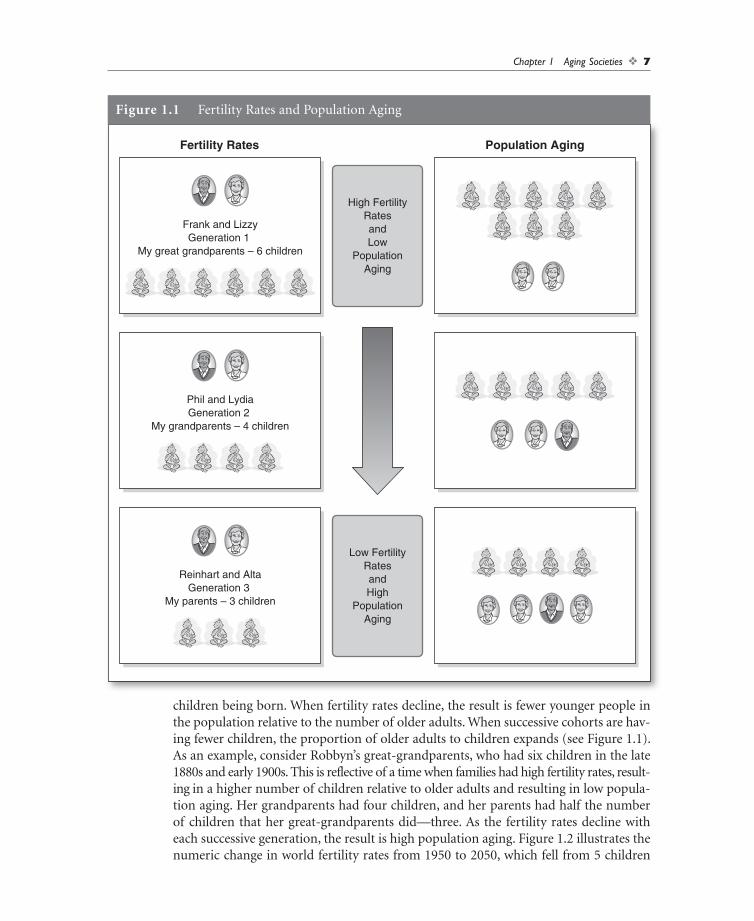
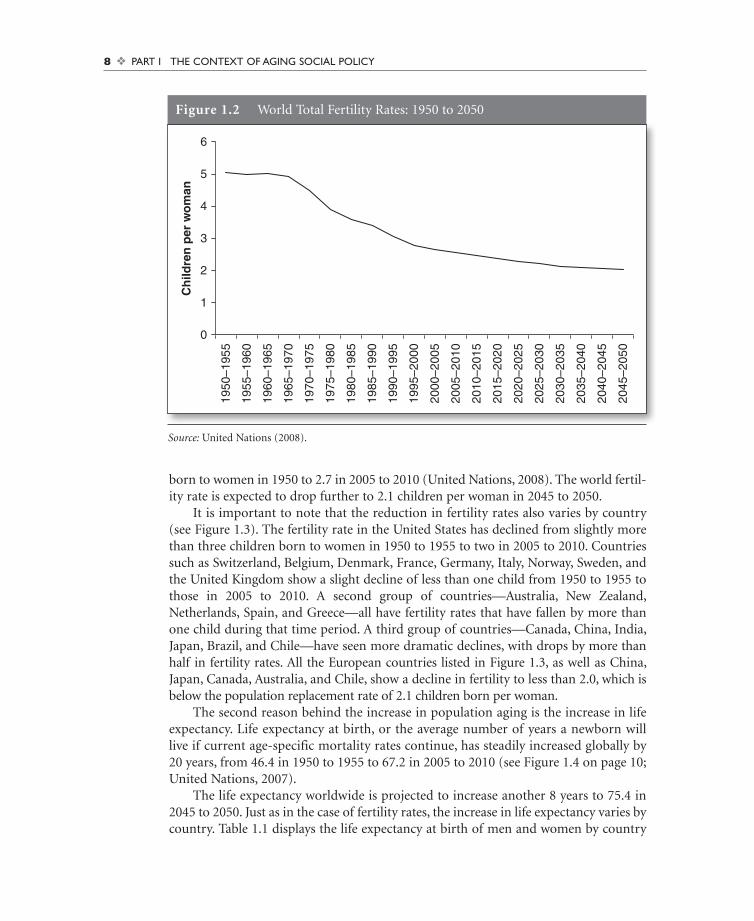
children being born. When fertility rates decline, the result is fewer younger people in the population relative to the number of older adults. When successive cohorts are hav-ing fewer children, the proportion of older adults to children expands (see Figure 1.1). As an example, consider Robbyn’s great-grandparents, who had six children in the late 1880s and early 1900s. This is reflective of a time when families had high fertility rates, result-ing in a higher number of children relative to older adults and resulting in low popula-tion aging. Her grandparents had four children, and her parents had half the number of children that her great-grandparents did—three. As the fertility rates decline with each successive generation, the result is high population aging. Figure 1.2 illustrates the numeric change in world fertility rates from 1950 to 2050, which fell from 5 children
Frank and LizzyGeneration 1
My great grandparents – 6 children
Phil and LydiaGeneration 2
My grandparents – 4 children
Reinhart and AltaGeneration 3
My parents – 3 children
Population AgingFertility Rates
High FertilityRatesandLow
PopulationAging
Low FertilityRatesandHigh
PopulationAging
Figure 1.1 Fertility Rates and Population Aging
8 ❖ PART I THE CONTEXT OF AGING SOCIAL POLICY
born to women in 1950 to 2.7 in 2005 to 2010 (United Nations, 2008). The world fertil-ity rate is expected to drop further to 2.1 children per woman in 2045 to 2050.
It is important to note that the reduction in fertility rates also varies by country (see Figure 1.3). The fertility rate in the United States has declined from slightly more than three children born to women in 1950 to 1955 to two in 2005 to 2010. Countries such as Switzerland, Belgium, Denmark, France, Germany, Italy, Norway, Sweden, and the United Kingdom show a slight decline of less than one child from 1950 to 1955 to those in 2005 to 2010. A second group of countries—Australia, New Zealand, Netherlands, Spain, and Greece—all have fertility rates that have fallen by more than one child during that time period. A third group of countries—Canada, China, India, Japan, Brazil, and Chile—have seen more dramatic declines, with drops by more than half in fertility rates. All the European countries listed in Figure 1.3, as well as China, Japan, Canada, Australia, and Chile, show a decline in fertility to less than 2.0, which is below the population replacement rate of 2.1 children born per woman.
The second reason behind the increase in population aging is the increase in life expectancy. Life expectancy at birth, or the average number of years a newborn will live if current age-specific mortality rates continue, has steadily increased globally by 20 years, from 46.4 in 1950 to 1955 to 67.2 in 2005 to 2010 (see Figure 1.4 on page 10; United Nations, 2007).
The life expectancy worldwide is projected to increase another 8 years to 75.4 in 2045 to 2050. Just as in the case of fertility rates, the increase in life expectancy varies by country. Table 1.1 displays the life expectancy at birth of men and women by country
Figure 1.2 World Total Fertility Rates: 1950 to 2050
0
1
2
3
Ch
ildre
n p
er w
om
an
4
5
6
1950
–195
5
1955
–196
0
1960
–196
5
1965
–197
0
1970
–197
5
1975
–198
0
1980
–198
5
1985
–199
0
1990
–199
5
1995
–200
0
2000
–200
5
2005
–201
0
2010
–201
5
2015
–202
0
2020
–202
5
2025
–203
0
2030
–203
5
2035
–204
0
2040
–204
5
2045
–205
0
Source: United Nations (2008).

Chapter 1 Aging Societies ❖ 9
Figure 1.3 Total Fertility Rates in Selected Countries: 1950 and 2005
United States
Canada
Oceania
Australia
New Zealand
Asia
China
India
Japan
Europe
Netherlands
Switzerland
Spain
Belgium
Denmark
France
Germany
Greece
Italy
Norway
Sweden
United Kingdom
Latin America
Brazil
Chile
0.0 1.0 2.0 3.0 4.0 5.0 6.0 7.0
3.42.0
3.71.5
3.21.8
3.72.0
6.21.7
6.02.8
2.81.4
3.11.7
2.31.4
2.61.3
2.31.7
2.61.8
2.71.9
2.21.3
2.31.3
2.31.4
2.61.8
2.21.7
2.21.7
6.22.2
51.5
1950–1955 2005–2010
Source: United Nations (2007).

10 ❖ PART I THE CONTEXT OF AGING SOCIAL POLICY
in different geographic regions. The life expectancy at birth for men in the United States, Canada, Northern, Western, and Southern Europe, and Oceania ranges from 75.6 years in the United States to 79 years in Switzerland. The life expectancy at birth pattern for men in Eastern Europe has a wider range, from 59 years in Russia to 73.4 in the Czech Republic. Asian countries also vary widely, as the life expectancy at birth for males is 63.2 years in India and 79 years in Japan. In Chile and Brazil, life expec-tancy at birth for men is 75.5 and 68.2, respectively. Without exception, women’s life expectancy at birth is greater than men in every region and every country. Again, women in the United States, Canada, Northern, Western, and Southern Europe, and Oceania have life expectancies at birth that range from 80.6 in Denmark to 84.2 in Spain, which has the highest life expectancy at birth for women of all the countries listed in Table 1.1. Women in Eastern European countries have life expectancies at birth ranging from 72.6 in Russia to 79.8 in Poland. Life expectancies at birth for women in Asia range from 66.4 in India to 86.1 in Japan.
While fertility rates and life expectancy are the two primary reasons for popula-tion aging, it is important to mention that one additional factor, in-migration rates, also has the potential to influence the rate of population aging. This is because in-migration rates—the number of immigrants coming into a country—can offset low fertility rates, as immigrants tend to be younger and have more children (Gavrilov & Heuveline, 2003). Migration may have a more prominent role in influencing population
0
10
20
30
Year
s
40
50
80
70
60
1950
–195
5
1955
–196
0
1960
–196
5
1965
–197
0
1970
–197
5
1975
–198
0
1980
–198
5
1985
–199
0
1990
–199
5
1995
–200
0
2000
–200
5
2005
–201
0
2010
–201
5
2015
–202
0
2020
–202
5
2025
–203
0
2030
–203
5
2035
–204
0
2040
–204
5
2045
–205
0
Source: United Nations (2008).
Figure 1.4 World Life Expectancy at Birth: 1950 to 2050

Chapter 1 Aging Societies ❖ 11
Country Life Expectancy Country Life Expectancy
Male Female Male Female
North America Western Europe
United States 75.6 80.8 Austria 76.9 82.6
Canada 78.3 82.9 Belgium 76.5 82.3
France 77.1 84.1
Northern Europe Germany 76.5 82.1
Denmark 76.0 80.6 Netherlands 77.5 81.9
Finland 76.1 82.4 Switzerland 79.0 84.2
Ireland 76.5 81.4
Norway 77.8 82.5 Southern Europe
Sweden 78.7 83.0 Greece 77.1 81.9
United Kingdom 77.2 81.6 Italy 77.5 83.5
Spain 77.7 84.2
Portugal 75.0 81.2
Asia
China 71.3 74.8 Eastern Europe
Japan 79.0 86.1 Bulgaria 69.5 76.7
South Korea 75.0 82.2 Hungary 69.2 77.4
Thailand 66.5 75.0 Poland 71.3 79.8
Vietnam 72.3 76.2 Russia 59.0 72.6
India 63.2 66.4 Czech Republic 73.4 79.5
Oceania Latin America
Australia 78.9 83.6 Chile 75.5 81.5
New Zealand 77.0 81.3 Brazil 68.2 75.7
Table 1.1 Life Expectancy at Birth for Selected Countries by Region for Years 2005 to 2010
Source: United Nations (2008).

12 ❖ PART I THE CONTEXT OF AGING SOCIAL POLICY
aging in the future, particularly in low-fertility countries such as Italy, Canada, and the United States.
Scope and Speed of World Population Aging
Now that we have explained how and why population aging has occurred over the past half-century, let us briefly examine the scope and speed at which population aging has occurred. As shown in Figure 1.5, there were 205 million persons aged 60 and older in the world in 1950; by 2007, that number increased to 705 million, with 11 countries reporting more than 10 million people over the age of 60 (United Nations, 2007). By 2050, the number of elderly adults 60 and older is expected to rise to 2 billion, with 32 countries having 10 million or more elderly adults. The growth in the older adult population aged 80 and over shows a similar pattern. According to the United Nations (2007), there were 14 million older adults aged 80 and over in 1950, and by 2007, that number had increased to 94 million. By 2050, the number of oldest old is expected to have increased fourfold to 394 million (see Figure 1.6).
The increase worldwide in the number of older adults is also reflected in increases in individual country demographics. Figure 1.7 on page 14 shows a selected number of countries and their expected percentage increases in the elderly population. In the United States, the older adult population is expected to increase 102% from the year 2000 to 2030 (Kinsella & Velkoff, 2001). Canada and Australia are also expected to
2,500,000
2,000,000
1,500,000
1,000,000
500,000
0
Mill
ion
s
1950
1955
1960
1965
1970
1975
1980
1985
1990
1995
2000
2005
2010
2015
2020
2025
2030
2035
2040
2045
2050
Source: United Nations (2008).
Figure 1.5 Number of Older Adults 60+ Worldwide: 1950 to 2050

Chapter 1 Aging Societies ❖ 13
experience an increase in elderly by 126% and 108%, respectively. Interestingly, European countries are expected to experience a smaller percentage increase in their elderly population over the next 30 years. The percentage increase is expected to vary from 43% in Greece to 64% in Denmark. The less-developed countries of Thailand, Brazil, India, and China all have an expected increase of more than 150% over the next 30 years. So the percentage increase of older adults is expected to vary by country, as is the percentage of older adults over age 65 and 80 in any given region.
Figure 1.8 on page 15 illustrates the expected increase in the percentage of persons aged 65 and older by geographic region. In the United States, the percentage of persons aged 65 and older is expected to increase from 12.3% in 2005 to 20.2% in 2035. Europe is expected to see increases from 15.9% to 24.2%. However, the percentage of the population aged 65 and older is expected to double during the years 2005 to 2035 in Asia and Latin America.
The increase in the percentage of persons aged 80 and older in the world’s regions is expected to increase markedly between the years 2005 and 2035 (see Figure 1.9 on page 16). In the United States in 2005, 3.5% of the population was adults aged 80 and older, and that percentage is expected to rise to 5.9% in 2035. Europe’s and Canada’s increase are expected to be greater, going from 3.5% to 6.9% and 7.4%, respectively. Asia’s and Latin America’s percentages are expected to increase by more than double from 1% to 2.7% and from 1.2% to 3.2%, respectively. Although Africa has a small percentage of older adults over age 80, the percentage is expected to double.
500,000
400,000
300,000
200,000
100,000
0
Mill
ion
s
1950
1955
1960
1965
1970
1975
1980
1985
1990
1995
2000
2005
2010
2015
2020
2025
2030
2035
2040
2045
2050
Figure 1.6 Number of Older Adults Aged 80+ Worldwide: 1950 to 2050
Source: United Nations (2008).

14 ❖ PART I THE CONTEXT OF AGING SOCIAL POLICY
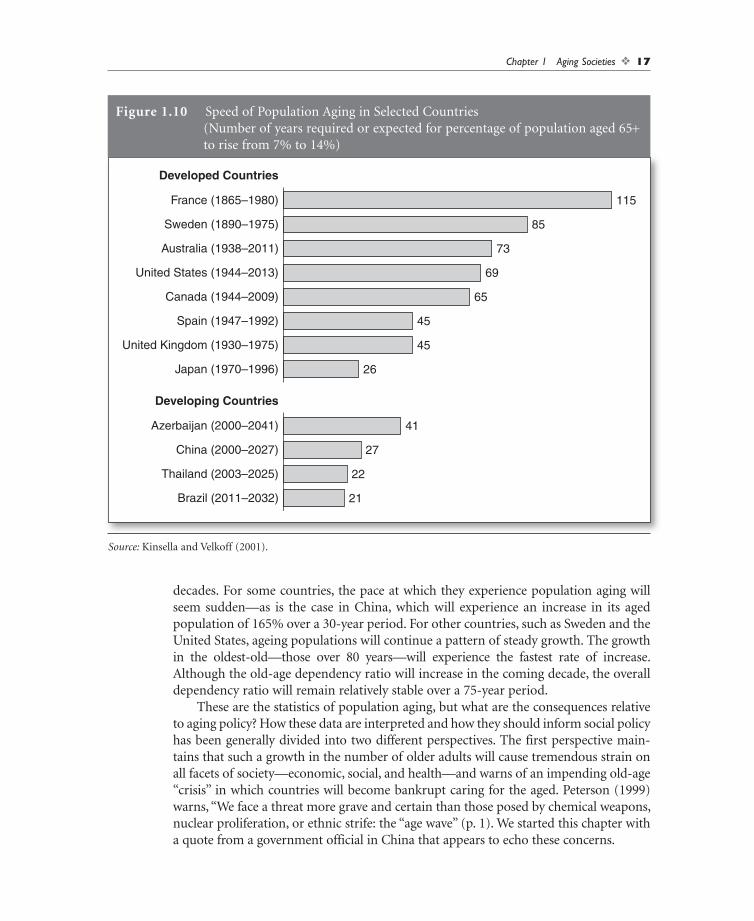
When examining characteristics of population, it is also constructive to consider the speed at which a country will experience population aging. Figure 1.10 on page 17 illustrates the number of years required or expected for the percentage of a country’s population aged 65 and older to increase from 7% to 14%. For example, it is estimated that it will take a period of 69 years (1944–2013) for the United States to experience an increase from 7% to 14% (Kinsella & Velkoff, 2001). This slower rate of population aging is consistent in most other developed countries with the exception of Japan, which increased to 14% in only 26 years (1970–1996). The speed of population aging is much more rapid in developing countries. China is expected to reach 14% in 27 years (2000–2027)—something that took France 115 years to do (1865–1980).
The final demographic characteristic of population aging that we will discuss is dependency ratios. The total dependency ratio is the number of people under 15 years
Thailand
Brazil
India
China
Canada
Australia
United States
Denmark
Germany
Norway
France
United Kingdom
Japan
Belgium
Sweden
Italy
Greece
0 50 100 150 200 250Percentage
Figure 1.7 Percentage Increase in Elderly Population in Selected Countries:2000 to 2030
Source: Kinsella and Velkoff (2001).

Chapter 1 Aging Societies ❖ 15
of age (i.e., youth dependency ratio) and the number of people aged 65 and older (i.e., old-age dependency ratio) to the number of people between the ages of 15 and 64. It is assumed that those under age 15 and over 65 are likely to be dependent on those assumed to be in the working ages of 15 to 64. It is important to discuss the total dependency ratio rather than present only the old-age dependency ratio, as this ratio provides a more complete picture of the potential social costs of caring for the young as well as elderly adults (Mullan, 2002). Figure 1.11 on page 18 shows the dependency ratio, which is composed of youth and old-age dependency ratios, for selected countries in the years 1950 and 2025. For example, the total dependency ratio in the United States was 54.5 in 1950 and is expected to increase slightly to 57.1. Although the total dependency ratio is expected to increase only a small amount, there should be a shift in the youth and old-age ratios. The youth ratio in 1950 in the United States was 41.7, and it is projected to drop to 29.3 by 2025. The old-age dependency ratio in the United States
Africa
Latin American
Asia
Oceania
Canada
Europe
United States12.3
15.820.2
15.918.9
24.2
13.118.4
24.3
10.313.7
17.5
6.48.9
13.5
6.38.9
13.6
3.43.9
4.9
2005 2020 2035
Figure 1.8 Percentage Aged 65 and Over in Selected Regions: 2005, 2020, 2035
Source: United Nations (2008).

16 ❖ PART I THE CONTEXT OF AGING SOCIAL POLICY
is projected to increase from 12.8 in 1950 to 27.9 in 2025. Japan, Canada, and Australia/New Zealand are projected to experience a modest increase in their total dependency ratios, whereas Switzerland, France, and Italy are expected to have a greater increase in their total dependency ratios. Interestingly, China and India are expected to experi-ence a decline in the total dependency ratio from 1950 to 2025. All countries listed in Figure 1.11 show a decline in youth dependency ratios from 1950 to 2025 and an increase in old-age dependency ratios. The country with the highest expected rate of increase in the old-age ratio from 1950 to 2025 is Japan, with an increase from 8.3 to 49.7.
In summary, the demographic evidence shows declines in fertility rates and increases in life expectancy, which have contributed to the increase in worldwide popu-lation aging. In some European countries—notably, Italy, Greece, Germany, and Spain—the fertility rate will be slightly above one child per woman. Life expectancy gains will result in individuals living well into their seventh, eighth, and even ninth
Africa
Latin American
Asia
Oceania
Canada
Europe
United States3.5
3.75.9
3.55.1
6.9
3.54.4
7.4
2.63.3
5.2
1.01.6
2.7
1.21.9
3.2
0.40.5
0.7
2005 2020 2035
Figure 1.9 Percentage Aged 80 and Over in Selected Regions: 2005, 2020, 2035
Source: United Nations (2008).
Chapter 1 Aging Societies ❖ 17
decades. For some countries, the pace at which they experience population aging will seem sudden—as is the case in China, which will experience an increase in its aged population of 165% over a 30-year period. For other countries, such as Sweden and the United States, ageing populations will continue a pattern of steady growth. The growth in the oldest-old—those over 80 years—will experience the fastest rate of increase. Although the old-age dependency ratio will increase in the coming decade, the overall dependency ratio will remain relatively stable over a 75-year period.
These are the statistics of population aging, but what are the consequences relative to aging policy? How these data are interpreted and how they should inform social policy has been generally divided into two different perspectives. The first perspective main-tains that such a growth in the number of older adults will cause tremendous strain on all facets of society—economic, social, and health—and warns of an impending old-age “crisis” in which countries will become bankrupt caring for the aged. Peterson (1999) warns, “We face a threat more grave and certain than those posed by chemical weapons, nuclear proliferation, or ethnic strife: the ‘‘age wave” (p. 1). We started this chapter with a quote from a government official in China that appears to echo these concerns.
Developed Countries
France (1865–1980)
Sweden (1890–1975)
Australia (1938–2011)
United States (1944–2013)
Canada (1944–2009)
Spain (1947–1992)
United Kingdom (1930–1975)
Japan (1970–1996)
115
85
73
69
Developing Countries
Azerbaijan (2000–2041)
China (2000–2027)
Thailand (2003–2025)
Brazil (2011–2032)
41
27
22
21
65
45
45
26
Source: Kinsella and Velkoff (2001).
Figure 1.10 Speed of Population Aging in Selected Countries (Number of years required or expected for percentage of population aged 65+
to rise from 7% to 14%)

18 ❖ PART I THE CONTEXT OF AGING SOCIAL POLICY
Australia/New Zealand—1950
Australia/New Zealand—2025
France—1950
France—2025
Italy—1950
Italy—2025
Canada—1950
Canada—2025
United States—1950
United States—2025
0 20 40 60 80 100 120 140 160
Japan—1950
Japan—2025
China—1950
China—2025
India—1950
India—2025
Switzerland—1950
Switzerland—2025
67.8 59.5 8.3
71.1 21.3 49.7
61.3 54.1 7.2
46.2 26.2 20
73.2 67.4 5.8
48.2 36.3 12
49.6 35.2 14.4
61.7 23.3 38.4
54.5 41.7 12.8
57.9 27.9 30
51.7 34.5 17.3
64.1 27 37
52.8 40.2 12.6
62 19.3 42.7
59.6 47.4 12.2
57.1 24.2 32.9
54.5 41.7 12.8
57.1 29.3 27.9
Total Youth Old Age
Figure 1.11 Dependency Ratios for Selected Countries: 1950 and 2025
Source: United Nations (2007).

Chapter 1 Aging Societies ❖ 19
The second perspective maintains that population aging has been happening since the 1900s and that societies have adapted. This perspective espouses that “demography is not destiny” (Friedland & Summer, 1999, 2005) and that policy choices, in conjunc-tion with market forces and economic growth, can adequately address the needs of a growing older adult population (Friedland & Summer, 2005; Mullan, 2002). As you can imagine, how one approaches aging policy will be markedly different depending on which perspective of population aging one takes. We will revisit this topic again in Chapter 10 when we discuss the issues facing aging social policy.
There is little doubt that as baby boomers move into retirement age, they will once again change the demographic landscape—the same way they did as children and as adults moving through the life course. Of interest to our discussion in this book is how countries are responding to their population aging. As Hill (2006) aptly notes, “Ageing people have to come to terms with ageing, perhaps ageing nations have to do so as well” (p. 250).
Learning Activity: Policy-Person Link Case Study
We have created a case study based on the different circumstances of some older adults interviewed for this book. As you read through the chapters, use the case study of Luciana to examine how she would experience income, health, social, and economic support in each of the different countries we discuss.
CASE STUDY
Luciana is an 87-year-old widow of 20 years who lives alone in her single-family home and has a small dog named Zita. Both adult daughters, in their 50s, work full-time. One lives 30 minutes away, and the other lives in another region 5 hours away. Luciana worked for 30 years in full-time employment, and when she retired she was making $45,000 a year (€35,338). She has savings of $10,000 (€7,854.33).
Luciana has mild cognitive impairment, and although she is still very engaged and social, she is aware that her mental capacity is “slipping” and often cries about “what is happening to me.” She is not able to drive, prepare meals, or manage her finances. She needs supervision to make sure she is dressed and has properly completed personal hygiene tasks both at night and in the morning. She also needs assistance in taking her medications. She ambulates with a cane and is able to ride specialized buses, with some assistance needed in getting on and off the bus.
Thus, Luciana needs the following support services:
• Assistance with shower, dressing, and personal care (e.g., hair, makeup, etc.) morning and evening, 7 days a week
• Meals morning and evening Monday through Friday and all meals on weekends
(Continued)
20 ❖ PART I THE CONTEXT OF AGING SOCIAL POLICY
For More Information
1. Population Pyramids: U.S. Census Bureau, International Databasehttp://www.census.gov/ipc/www/idb/informationGateway.php
Use this site to compare population pyramids for any country in the world.
2. United Nations: World Population Ageing: 1950 to 2050http://www.un.org/esa/population/publications/worldageing19502050/
This report was prepared by the United Nation’s Population Division as a contribution to the 2002 World Assembly on Ageing and its follow-up. The report provides a description of global trends in population ageing and includes a series of indicators of the ageing pro-cess by development regions, major areas, regions, and countries.
3. Center for Strategic and International Studieshttp://csis.org/program/global-aging-initiative
The CSIS Global Aging Initiative explores the long-term economic, social, and geo-political implications of demographic trends in the United States and around the world. Its website has a number of interesting publications on global aging, including aging issues in China and Latin America.
(Continued)
• Assistance with grocery shopping and laundry• Help administering medications and paying her bills• Help taking her dog for a walk• Companionship in the evenings and on weekends• Transportation to doctor visits and community events• Yard care and snow removal in the winter and home repair when needed• Mental health support
Select three or four different countries and identify the types of support to which Luciana would have access if she were living in that country. How much would she receive from her government pension? What support would she have paying for her doctor’s visits and prescrip-tions? What types of assistance would be available for her daily living needs listed above? What alternative housing environments might she consider given her needs and income? How much would she have to pay for these services? As you will discover, her daily living circumstances will be very different depending on which country she happens to reside in.

Chapter 1 Aging Societies ❖ 21
Mrs. V., age 71 Biella, Italy
I was born in Camburzano (a village nearby) in 1934. My mother was a weaver, and my father was a sewer. I have two brothers older than me and two sons but no grandsons because my sons want to keep me young so nobody will call me granny (haha)! Both I and my husband worked in a factory. I started to work when I was 10 years old.
A typical day for me is doing some work around the house. I go to see relatives or friends, I read and do some crosswords, I also do some embroidery and with my husband I play cards.
Together we go twice a week to the gym. I hardly see my sons. They are like white flies; from time to time, they come to visit us.
I haven’t got any serious health problems, just some disorders due to old age.I receive a pension, as I worked, but it is a very small one because for many years I stayed at home to look
after my children. The amount I get, it is not adequate to my needs. I would need “Ciampi’s” pension [ex Italian President] to sustain my needs or “Fazzio’s” [ex director of the central Italian bank]. If my husband and I are sick, we go to the hospital or doctor through the national health system. If we want to choose the doctor or avoid the lines, we go privately and pay for the checkups. We get what the convent gives us [an old saying in Italy].
Teeth, eye checkups can be obtained through the national health system for free, but the lines are very long. Dental implants are half of the charge, so we have to pay for the rest. Hearing aid is free, but we hardly get the new inventions. Sometimes the models are 10 years, so a lot of people pay the difference to get the newer models. In Italy, we can buy private insurances but only up to the age of 70/75 years old. If you have an illness that you had in the past, the private insurance does not cover for any treatments for that particular illness.
If we were by ourselves unable to move with no family or any help and in need of food, there is the “Comunita’ Montana” [“mountain community”; nongovernment run], which comes round to your house with warm meals every day. You pay a little amount towards it depending on your income. The maximum you pay is €7 per day. They come round once a day for 5 days a week. There is no help if you need transpor-tation, but if you need someone to help you with cleaning the house there are people who come and charge €7 per hour, which is much less than the normal rate. Basically, unless you are really poor, you need to pay for all of these services. If you are really poor and have nothing, the local town hall will investigate your case, check your bank account, and then help you out.
How do I feel being an older person? Ah, it is the end of the world (hahahahaha). Well, there is something good. You can say what you want, but I don’t like it because I feel I am at the end. When I was younger, I would not say everything about my life to my mother because I didn’t want her to worry. Now my sons don’t tell us all of their problems for the same reason, and I don’t like that. For the future, I hope my husband and I can have some health and to be able to hold our hands and die together. Cats and dogs means more than elderly people sometimes. I think we tend to be neglected by society.
What advice would I give students about growing older? To do what you can but not to lose old values in life. Young people have too much today, and they do not know how to make sacrifices. We have gone to extremes, and their “getting older” will be harder than our getting old. I was born during the fascist time and saw the war, we worked hard, our generation made this country.

Catullo, age 90, Switzerland
Lucio & Domingo, ages 85 & 76, United States