chapter 1: biomes and ecosystems - sardis secondary … 1 handouts.pdf · chapter 1: biomes and...
TRANSCRIPT
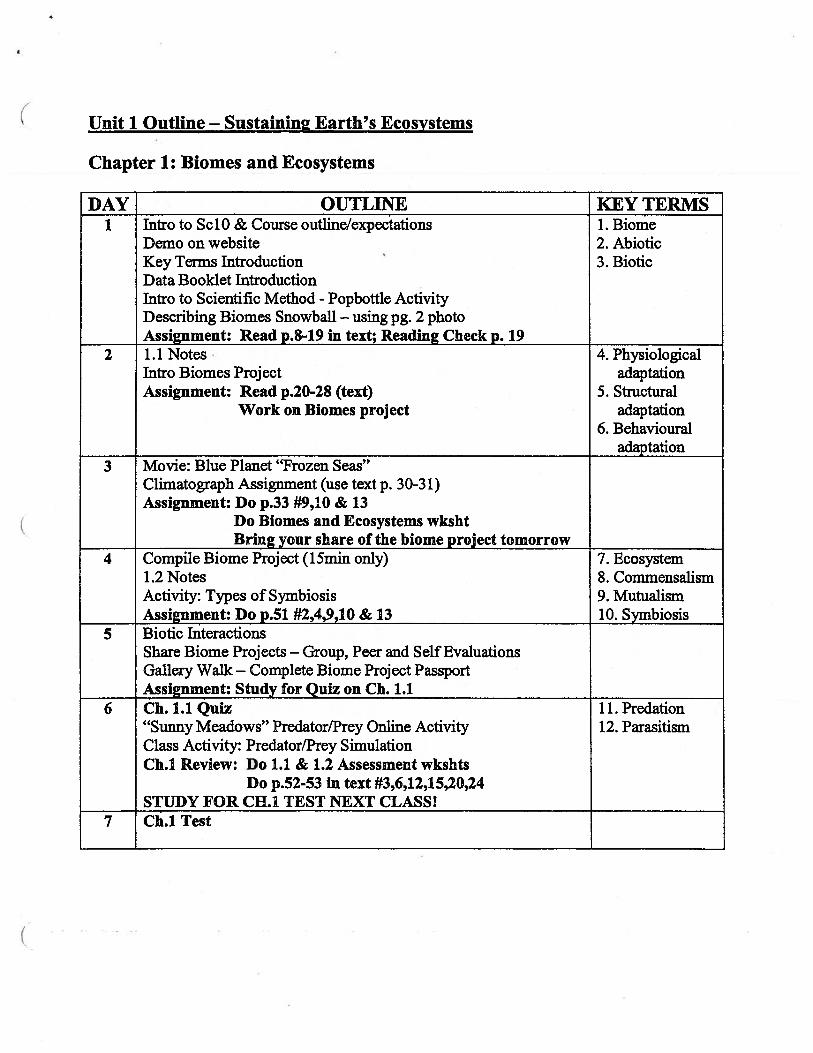
Unit 1 Outline — Sustaining Earth’s Ecosystems
Chapter 1: Biomes and Ecosystems
DAY OUTLINE KEY TERMSIntro to SclO & Course outline/expectations 1. BiomeDemo on website 2. AbioticKey Terms Introduction 3. BioticData Booklet IntroductionIntro to Scientific Method - Popbottle ActivityDescribing Biomes Snowball — using pg. 2 photoAssignment: Read p.8-19 in text; Reading Check p. 19
2 101 Notes 4. PhysiologicalIntro Biomes Project adaptationAssignment: Read p.20-28 (text) 5. Structural
Work on Biomes project adaptation6. Behavioural
adaptation3 Movie: Blue Planet “Frozen Seas”
Climatograph Assignment (use text p. 30-3 1)Assignment: Do p.33 #9,10 & 13
Do Biomes and Ecosystems wkshtBring your share of the biome project tomorrow
4 Compile Biome Project (15mm only) 7. Ecosystem1.2 Notes 8. CommensalismActivity: Types of Symbiosis 9. MutualismAssignment: Do p.51 #2,4,9,10 & 13 10. Symbiosis
5 Biotic InteractionsShare Biome Projects — Group, Peer and Self EvaluationsGallery Walk — Complete Biome Project PassportAssignment: Study for Quiz on Ch. 1.1
6 Ch. 1.1 Quiz 11. Predation“Sunny Meadows” Predator/Prey Online Activity 12. ParasitismClass Activity: Predator/Prey SimulationCh.1 Review: Do 1.1 & 1.2 Assessment wkshts
Do p.52-53 in text #3,6,12,15,20,24STUDY FOR CH.1 TEST NEXT CLASS!
7 Ch.1 Test

Chapter 1: Biomes and EcosystemsDefinition
1. Biome
2. Abiotic
3. Biotic
4. Physiological Adaptation
5. Structural Adaptation
6. Behavioural Adaptation
(
Key Term Example/Graphic
(.
(
7. Ecosystem
8. Commensalism
9. MutuaDism
10. Symbiosis
11. Predation
12. Parasitism

Name: Date: Block:
Purpose: To create an informational overview of one of the terrestrial Canadian biomesYou will be working in groups of 3-4 to create an informational overview poster of one of the terrestrial Canadianbiomes. You will select a specific city or region within your biome to research since each biome is so large.
TundraTemperate Deciduous ForestGrassland (Temperate and Tropical)Desert (Hot and Cold)
Your poster must include:1. Name of the biome and the representative city your group chooses.2. Name of the specific city or region within the biome (Ex. Vancouver, BC for the temperate
rainforest biome).3. Content
a) Latitude of the city or region.b) Description of climate. (Ex.: amount of rainfall each year, average monthly temperatures).c) Description of the physical features of the city or region within the biome. (Ex. soil quality, wind,
seasonal changes, elevation, latitude, common natural phenomena).c) Two (2) examples of region-specific plant adaptations with pictures.e) Three (3) examples of region-specific animal adaptations with pictures.
4. Graphicsa) Hand-drawn climatographb) Photos of plant and animal adaptations.
Marking Rubric:
______
MarkTitle Title can be read from 2 m. away and is informative. 3Content The poster includes all required elements (see above). All required elements 25
are clear, complete, and concise.Graphics Any graphics (tables or photos) can be viewed from 2 m. away, and are 10
related_to_the_topic.Grammar No grammar or spelling errors. 5Appearance The poster is attractive in terms of design, layout, and neatness. All text is 10
clear and readable.Action Plan and Action plan completed (Day 1) and handed in. Evaluation of group members 7Evaluation of Group completed and handed in.Members
Total Available Marks 60
*you wiN also be completing a self-evaluation and group-evaluation once your project is complete. These marks will beconsidered for your final mark on this project for the use of class time category.
Boreal ForestTemperate RainforestTropical RainforestPermanent Ice (Polar Ice)
(
Project Due Date:

Name:
_____________________________________
Date:
________________________
Block:
________
rz :‘zzz::My group’s biome:
My group’s city:
My group members’names:
For this project, will bein charge of:
Tonight for homework, Iwill research:
fl Evaluation of GrOup MembersL_ (to be done after project is complete)
Fill in your name and your group members’ names in the table below. Indicate the percentage of theirassigned task that each person completed (if they did everything they were supposed to, give them100%). Take into consideration each person’s use of class time, the amount of work done outside ofclass time, and the overall contribution towards the project.
Percentage of work completed1.
2.
3.

Biomes ProjectSelf and Group Evaluation
Consider the criteria below and write down the mark you think your project deserves. (
Title can be read from 2maway.Title is informative (name ofbiome and name of city orregion.)
Readable (1) 3Name of biome(1)Name of city/region(1)
Title
Mark Out Self Peer TeacherBreakdown of
Content Latitude. Each section 25Climate. Marked out of 5Physical features. (complete,clear,concise)Plant adaptations.Animal adaptations.
Graphics Hand-drawn climatograph. Climatograph (5) 10Photos (2) of plant adaptations. Photos (5)Photos (3) of animaladaptations.
Grammar No grammar or spelling errors. 5 5 (.
Appearance Poster is attractive. Attractive (3) 10Poster is layed out well. Layout(2)Poster is neat. Neat (2)Text size is clear and readable. Text(2)Font choice is readable. Font(1)
Action Plan Action plan completed (Day 1) and 7and handed in. Evaluation of groupEvaluation of members completed and handedGroup in.Members
Total 60

__
__
__
__
__
__
__
______________________________
Dat
e:
____
____
____
____
____
____
__
Blo
ck:
rM
yB
iom
eP
assp
ort
L
Qui
ckTr
ipar
ound
the
Bio
mes
1.T
ype
ofbi
ome:
______________________
Nam
eon
esp
ecif
iclo
cati
onw
ithi
nth
isbi
ome:
_
Des
criib
eth
eph
ysic
alfe
atur
esof
this
biom
e:—
Nam
epl
ant
andgj
anim
alin
this
biom
e:
2.
Type
of
biom
e:
___________________
Nam
eon
esp
ecif
iclo
cati
onw
ithin
this
biom
e:_
Des
crib
eth
eph
ysic
alfe
atur
esof
this
biom
e:
Nam
epl
ant
and
anim
alin
this
biom
e:
3.T
ype
ofbi
ome:
____
____
____
____
____
___
Nam
eon
esp
ecif
iclo
cati
onw
ithin
this
biom
e:_
Des
crth
eth
eph
ysic
alfe
atur
esof
this
biom
e:—
Nam
ejj
plan
tan
djj
anim
alin
this
biom
e:

4.T
ype
ofbi
ome:
____
____
____
____
____
__
Nam
eon
esp
ecif
iclo
cati
onw
ithin
this
bio
me:
Des
crib
eth
eph
ysic
alfe
atur
esof
this
biom
e:—
Nam
eon
epl
ant
and
one
anim
alin
this
biom
e:
5.T
ype
ofbi
ome:
____
____
____
____
____
__
Nam
eon
esp
ecif
iclo
cati
onw
ithin
this
biom
e:
Des
crib
eth
eph
ysic
alfe
atur
esof
this
biom
e:
Nam
eon
epl
ant
and
anim
alin
this
biom
e:
6.T
ype
ofbi
ome:
____
____
____
____
____
__
Nam
eon
esp
ecif
iclo
cati
onw
ithin
this
biom
e:_
Des
crib
eth
eph
ysic
alfe
atur
esof
this
biom
e:
Nam
eon
epl
ant
and
one
anim
alin
this
biom
e:

-C
-
7.T
ype
ofbl
ame:
______________________
Nam
eon
esp
ecif
iclo
cati
onw
ithi
nth
isbi
ome:
_
Des
crib
eth
eph
ysic
alfe
atur
esof
this
biom
e:—
Nam
eon
epl
ant
and
anim
alin
this
biom
e:
8.T
ype
ofbl
ame:
______________________
Nam
eon
esp
ecif
iclo
cati
onw
ithin
this
biom
e:_
Des
crIb
eth
eph
ysic
alfe
atur
esof
this
biom
e:
Nam
e2
plan
tan
dan
imal
inth
isbi
ome:

& are2
of the most important
in
identifying biomes.
• Distribution of Biomes:
Other identifying Factors:
• influences both temp.& precipitation.
Ex. The tropical zone has very warm temp. &high precipitation because the sun shinesstraight down &warm air holds more moisture than cooler air.
____________________
is the height abovesea level
— Higher elevations have less air, &therefore less heat is retained.
— Windward sides of mountains arewet, leeward sides are very dry.
___________________
carry warmth &moisture to coastal areas.
— Where warm currents meet land, —
1.1 Biomes — Student Notes
•
____________
are regions with similar
________________________
components (ex. BC &
New Zealand are similar biomes).
• Biomes are classified based on many characteristics:
• There are
_______________
on Earth: Boreal forest,desert, grassland, permanent ice, temperate deciduousforest, temperate rainforest, tropical rainforest and tundra
.
300
250
•200
150
boreal forest
rn desert
[. grassland
[] permanent ice
temperatedeciduous forest
temperaterainforestIropicalrainforest0
20 I0 0 10 20 30Average Annual Temperature
are found.
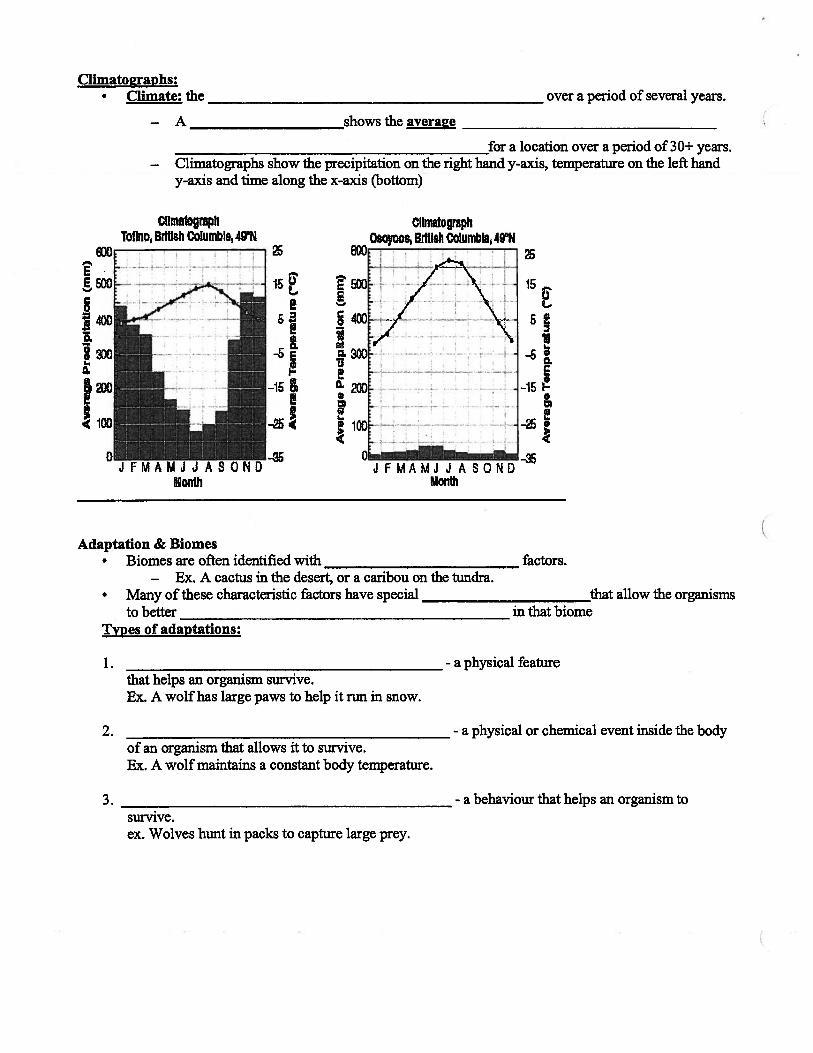
Climatoaraphs:Climate: the
______________________________________________
over a period of several years.
— A
_____________________shows
the averaae
______________________________________________________________________________for
a location over a period of 30+ years.— Climatographs show the precipitation on the right hand y-axis, temperature on the left hand
y-axis and time along the x-axis (bottom)
GllmatoraphTotho,BritishColumbia,49N
6’E
g400
11300a 200
hoc
Climatograph
6CCOsoyoos, British CoWmbla 49N
J F MAMJ J A SONDMonth
Adaptation & Biomes• Biomes are often identified with
____________________________
factors.
— Ex. A cactus in the desert, or a caribou on the tundra.• Many of these characteristic factors have special
________________________
to better
__________________________-______
in that biomethat allow the organisms
Types of adaptations:
1that helps an organism survive.Ex. A wolf has large paws to help it run in snow.
- a physical feature
2.of an organism that allows it to survive.Ex. A wolfmaintains a constant body temperature.
- a physical or chemical event inside the body
3. - a behaviour that helps an organism to
EE
-15
J J A S 0 N -
onth
survive.ex. Wolves hunt in packs to capture large prey.
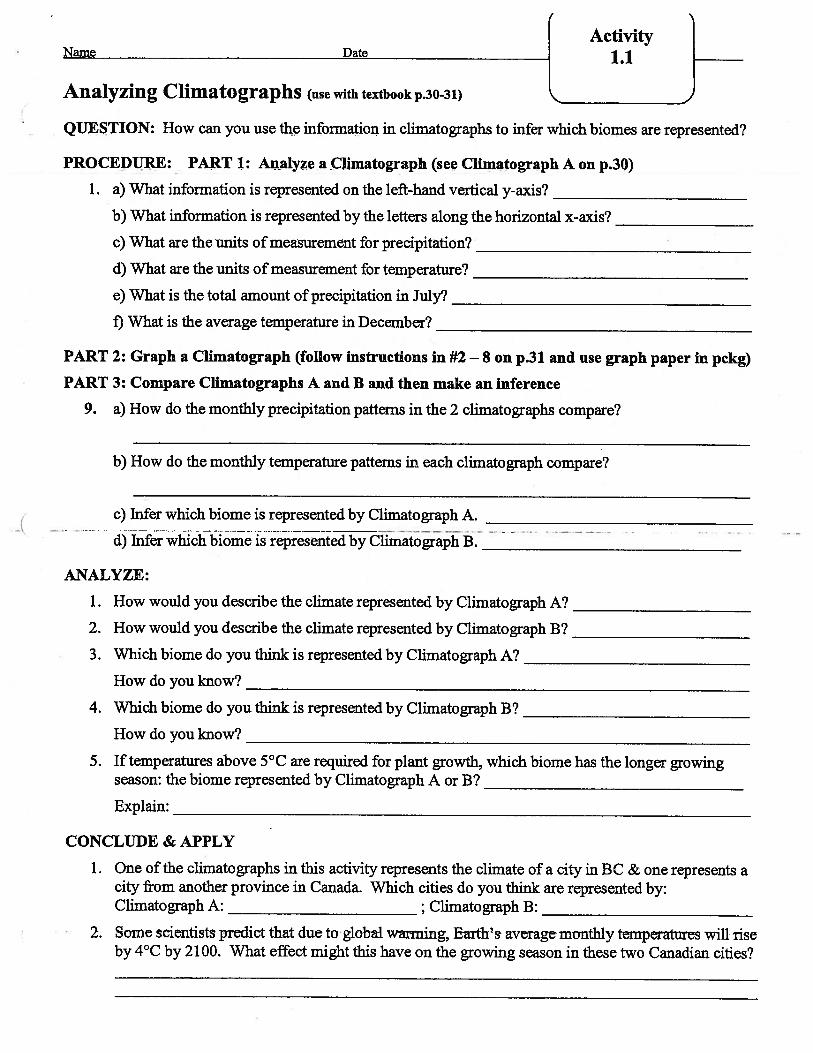
ActivityName Date 1.1
Analyzing Climatographs (use with textbook p.30-31)
QUESTION: How can you use the information in climatographs to infer which biomes are represented?
PROCEDURE: PART 1: Analyze a Cliinatograph (see Climatograph A on p.30)1. a) What information is represented on the left-hand vertical y-axis?
_________________________
b) What information is represented by the letters along the horizontal x-axis?
__________________
c) What are the units of measurement for precipitation?
_____________________________________
d) What are the units of measurement for temperature?
__________________________________
e) What is the total amount of precipitation in July?
_________________________________________
f) What is the average temperature in December?
_________________________________________
PART 2: Graph a Climatograph (follow instructions in #2—8 on p.31 and use graph paper in pckg)
PART 3: Compare Climatographs A and B and then make an inference
9. a) How do the monthly precipitation patterns in the 2 climatographs compare?
b) How do the monthly temperature patterns in each climatograph compare?
c) Infer which biome is represented by Climatograph A.
_________________________________
d) Infer which biome is represented by Climatograph B.
_______________________________
ANALYZE:
1. How would you describe the climate represented by Climatograph A?
_____________________
2. How would you describe the climate represented by Climatograph B?
______________________
3. Which biome do you think is represented by Climatograph A?
___________________________
How do you know?
__________________________________________________________
4. Which biome do you think is represented by Climatograph B?
___________________________
How do you know?
__________________________________________________________
5. If temperatures above 5°C are required for plant growth, which biome has the longer growing
season: the biome represented by Climatograph A or B?
________________________________
Explain:
CONCLUDE & APPLY
1. One of the climatographs in this activity represents the climate of a city in BC & one represents a
city from another province in Canada. Which cities do you think are represented by:
Climatograph A:
____________________
; Climatograph B:
______________________
2. Some scientists predict that due to global warming, Earth’s average monthly temperatures will riseby 4°C by 2100. What effect might this have on the growing season in these two Canadian cities?

z p S CD

VideoName Date Worksheet
BLUE PLANET VIDEO: “FROZEN SEAS”
1. Using the table below, list the differences between the Arctic and the Antarctic.
ARCTIC ANTARCTIC
2. List some abotic factors that make survival difficult in polar regions.
3. List some biotic factors that make survival difficult in polar regions.
4. Define the following terms and give at least one example of each from the video.
a) structural adaptation:
examples:
b) physiological adaptation:
examples:
c) behavioral adaptation:
examples:

Use
with
text
book
page
s8-
28.
Use
with
text
book
pag
es
16-2
8.
Bio
mes
crnd
eco
syem
s
Use
the
term
sin
the
voca
bula
rybo
xto
till
inth
ebl
anks
,U
seea
chte
rmon
lyon
ce.
1.co
mponen
tsar
eth
eliv
ing
org
anis
ms
ittan
env
iro
nm
ent,
such
asp
lan
ts,
anim
als,
fung
i,an
db
acte
ria.
2.co
mponen
tsar
eth
en
on
-liv
ing
par
tsof
anen
vir
on
men
t,su
ch
as
sunli
ght,
soil
,m
ois
ture
,an
dte
mper
ature
.
3.A
__
__
__
__
__
__
__
_____
incl
udes
larg
ere
gio
ns
that
hav
esi
mil
arbio
tic
com
po
nen
ts
and
abip
tic
com
ponen
ts.
4.A
__
__
__
__
__
__
_____
bio
me
isla
nd-b
ased
.
5.
__
__
__
__
__
__
__
___
and
__
__
__
__
__
__
__
__
_
are
two
Import
ant
abio
tic
fact
ors
that
infl
uen
ceth
ech
arac
teri
stic
sof
bio
mes
and
the
dis
trib
uti
on
of
blo
mes
on
Ear
th.
6.
__
__
__
__
__
__
__
__
___
isth
edis
tance
mea
sure
din
deg
rees
nort
hor
sou
thfr
om
the
equ
ato
r.
7.
__
__
__
__
__
__
__
__
___
isth
ehei
ght
of
ala
nd
mass
abo
ve
sea
leve
l.
8.
__
__
__
__
__
__
__
____
are
anoth
erab
ioti
cfa
ctor
that
affe
cts
tem
per
ature
and
pre
cipit
atio
nan
dth
eref
ore
Infl
uen
ces
the
char
acte
rist
ics
of
bio
mes
.
9.A
__
__
__
__
__
__
______
isa
gra
ph
of
clim
ate
data
for
asp
ecif
icre
gio
nan
dis
genera
ted
from
data
usu
ally
ob
tain
edover
30
yea
rsfr
om
loca
lw
eath
erobse
rvat
ion
stati
ons
10.
__
__
__
__
__
__
__
__
___
are
char
acte
rist
ics
that
enab
leo
rgan
ism
sto
bet
ter
surv
ive
and
repro
duce
.
11.
Aad
apta
tion
isa
physi
cal
feat
ure
of
anorg
anis
m’s
body
hav
ing
asp
ecif
icfu
nct
ion
that
contr
ibute
sto
the
surv
ival
of
the
org
anis
m.
A
adap
tati
on
isa
physi
cal
or
chem
ical
even
tth
ato
ccu
rsw
ithi
n
the
bo4y
of
anorg
anis
mth
aten
able
ssu
rviv
al.
Aad
apta
tio
n
refe
rsto
wh
atan
org
anis
md
oes
tosu
rviv
ein
the
uniq
ue
condit
ions
of
its
env
ito
nm
ent.
Voc
abul
ary
abio
ticla
ttude
adap
tatio
nsoc
ean
curre
nts
beha
viou
ral
phys
iolo
gica
lbl
ome
prec
ipita
tion
biot
icst
ruct
ural
clim
atog
rapt
tte
mpe
ratu
reel
evat
ion
terr
estri
al
Chm
atog
roph
sW
hich
wor
ldbi
omes
are
repr
esen
ted
byth
eda
tain
the
follo
win
gcl
imat
ogra
phs?
8 a ‘Or
.
Mon
th
iI
1100
5
0.I
FM
AM
JJA
SO
ND
Mon
th
Biom
e:Bl
ome:
CD
180
25
I°[/
’\‘:
.ieo[,/
eo
-isa
‘a
S-2
55
Mon
th<
20 0j
FMA
MJ
IA
SO
ND
35
Mon
th
Blom
e:Bl
ame:
EF
180
3531
/“\25
.5.2
!
i2o
isa
02
1
0.1
00
55.
01’
80
‘
6o
-So
a,a,
40
-is
20
0—
25I
FMA
MJ
IA
SON
DM
onth
Blom
e:Bl
ame:
35 !
I
-15
—25
4M
HR
Sec
tion
1.1
Bio
mes
02
00
8M
cGa,
w-H
i0R
yers
onum
lted
6M
HR
•S
ecti
on1.
1B
iom
es0
20
00
McG
raw
-Hill
Rye
rson
unit
ed

1.2 Ecosystems — Student Notes
•
____________________
a part of a biome in which
_________________
(non-living) factors
interact with
___________________________(living)
components
- Can be many hectares of land, or the size of an old log.,
• Within an ecosystem, there are many -
Abiotic Interactions in Ecosystems• It is the
_________________
components that allow the
________________components
to survive
in an ecosystem.
Abiotic factors include:
- produced by green plants & micro-organisms
•- necessary for all life
•- for growth
•- required for photosynthesis
•- contains water & nutrients
Biotic Interactions in Ecosystems
__________________
all organisms that interact within an ecosystem.
•
__________________:
all members of a certain species within an ecosystem.•
________________:
all organisms within an ecosystem that have the same structure & who canreproduce with each other (and produce fertile offspring).
Species can have many types of relationships in a population.•
_____________________
refers to the interaction between the members of two different species.
•- one species benefits, one is not affected
Ex. Barnacles living on a whale•
- both species benefitEx. A bee gathering nectar from a flower
•- one species benefits, the other is harmed
Ex. Hookworm living in dogs
Niches, Competition and Predation
•
______________:
the role an organism has within an ecosystem.— also refers to the environment in which a species prospers
• : occurs when a limited resource is desired by 2 or more individuals in aniche.
— this limits the size & health of individual organisms, & perhaps the population.
____________________
the relationship between the “eaters” & the “eaten”.
____________________have
adaptations to help them catch prey.
____________________have
adaptations to help avoid predators.Eg. spines & shells, camouflage and mimicry.
Biodiversity in Ecosystems• : the variety & number of different individuals & species in an ecosystem.
— Healthy ecosystems generally have
_____________________________
— Most bibdiversity losses occur from the
__________________________
— Humans often have a
___________________
on biodiversity.
________________________________________________
try to balance human progresswith maintaining biodiversity.

Activity ‘1Name Date 1.2
TYPES OF SYMBIOSIS
PROCEDURE: Classify each example:M = Mutualism: a symbiotic relationship that benefits both organisms.C = Commensalism: a symbiotic relationship that benefits 1 organism
and the other is not affected (not harmed or helped).P = Parasitism: a symbiotic relationship that benefits 1 organism and
harms the other.
EXAMPLES:1. A tick living on a dog.2. The honeyguide bird leading the honey badger to the bees hive; both eat
the honey.3. A tapeworm living in a 10t1i grade student’s intestines.4. A bird building their nest in a tree.5. The hermit crab carrying the sea anemone on its back.6. The bristle worm living with the hermit crab.7. Head lice living on the human scalp.8. Mistletoe putting its roots into its host tree.9. The ants and the acacia tree living together.10. The egret, an insect eating bird, grazing near a herbivore’s mouth.11. Orchids growing in tall tropical trees; the trees are not harmed but the
orchids get sun.12. Bacteria living on a human’s skin.13. The remora, a type of suckerfish, hitching a ride on a shark, with no
harm to the shark.14. Barnacles living on a whale.15. Bees and flowers.16. Bacteria living in the intestines of a cow to help it break down cellulose.17. The clownfish and the sea anemone.18. A 6th grader and their pet.19. The rhino and the tick bird. The rhino has pests removed by the tick bird
and the tick bird gets nutrients from eating the pests.20. The lichen; a close relationship between a fungus and an algae, that
benefits both.

Name
Use with textbook pages 39—47.
DateInterpretingIlustrations
Diotc interactions in ecosystems
1. Use the vocabulary words in the box above to label the Williams Creek ecosystem.
2. Give the ecological hierarchy for these biotic interactions from largest to smallest.
Largest
Smallest
3. List three populations that interact in your community.
Vocabulary
biosphere organismcommunity populationecosystem
© 2008 McGraw-Hill Ryerson Limited Section 1.2 Ecosystems • MHR 11

Science 10 Name:
____________________________
Block:
________
Predator-Prey 5imuation
Purpose: To study the relationship between predator and prey populations.
Procedure:
1. Each team should mark off a square approximately 50cm per side on their table. This squarerepresents Hoot Woods, where the mice and owls live.
2. You will simulate 25 generations of owls and mice. The mice can be eaten and the owls canstarve. Surviving mice and owls can reproduce.
3. In each generation, the surviving mouse population will double to form the next generation.For example, if six mice are living in the woods and two are caught by an owl, then four micewill survive, These four mice will each produce one offspring, and the next generation willbegin with eight mice. Remember, the number of offspring is always the same number as thenumber of surviving mice. The maximum mouse capacity of Hoot Woods is 300 mice.
4. In order to survive, each owl must catch at least three mice in every generation. If an owldoes not catch three mice, it will starve. For each three mice that an owl catches, itproduces one offspring. For example, if an owl catches eight mice, it will produce twooffspring, making a total of three owls to begin the next generation.
5. At the beginning of each generation, there must be at least three mice and one owl in thewoods. If the populations drop below these numbers (by being eaten or starving), new miceand owls will migrate in.
6. The simulation is played as follows:
a) Place the mouse squares at random in Hoot Woods. Then, from a height of about 30cm,drop the owl square into the woods. Try to hit as many mice as you can in one drop. Whenan owl square fully or partly covers a mouse square, that is a “catch”. If there is morethan one owl in a generation, drop the owl square once for each owl.
b) Remove and count the number of mice caught by each owl. Record the data on the chart.
c) Example: Suppose generation three begins with 20 mice and 2 owls. You make a drop forthe first owl and catch 7 mice. On the second drop, the second owl catches only 2 mice.The owls have caught a total of 9 mice. There are 11 mice left in Hoot Woods, and theyproduce 11 offspring. The next generation will start with 22 mice. Because the first owlcaught 7 mice, it produces 2 offspring. The second owl caught only 2 mice, so it starves todeath. The next generation will start with 3 owls.
The data chart for this example would look like this:
Number of Number of Number of Number ofNumber of Number of
GenerationMice at Start Owls at Start Mice Caught Owls Starved
SurvMng Mice Surviving Owls. + Offspring + Offspring
3 20 2 9 1 ll+1122 1÷23
4 j 22 3

bata:
GenerationNumber of Number of Number of Number of
Number of Number of
Mice at Start Owls at Start Mice Caught Owls Starved Surviving Mice Surviving Owls• Offspring ÷ Offspring
1 3
2
3
4
5
6
7
8
9
10
11
12
13
14
15
16
17
18
19
20
21
22
23
24
25
Note: There always must be at least three mice at the start; if necessary, have mice migrate in.
There always must be at least one owl at the start; if necessary, have one owl migrate in.

Popula
tion
Siz
e-
—1.3
1.3
1.3
1’.)
1%
)1
.3
-1.
3(3
.()
C)
4(C
0•
1,3
C)
C)
C)
(C(0
01.
)(i
iC
)-1
(C(0
00
00
00
00
00
00
00
00
00
00
00
00
00
00
00
00
(R
I.
.I
I_
‘_
_fl’J4
.._
__
_A
__
_...O
.I
II
II
II
II_
_________L
II._
II
4•
‘jP
II-
1,
:,‘
.-.
..
___.i
4_.[
..jrH
..
4.i1
4_
_I
-
j’I
—‘
——
-o
--
C
—r.
••:-1
.-,-‘--r
00
5-r
“—
--
-
44’
—
•.
‘.•i•
.•
..,
.•••.•
•,,4
..
(÷
D-J
o..
+o
ii.
..
..
.-
,.
jr
1-+
4I-
0
4I:
..
.‘.
..
..‘•
..
••,.•
4:’,,-
‘i.
•144.X
.••..
-.
0
i’
44’
44
‘.4
.•.
..
...
.4.
..
,.
‘,
.4
.•.•
0•44
‘T.
31
LI,
14
(i
(0
__
41
P0
-‘::‘‘;
:•*
.•0
m4
444
2-
z(‘
3‘fil
.•..
•l.j4
I.l4
‘..
,:::
I1
C.
44I
I+
4’+
-
4ii
Zr
4’P4’
1+
In
-+
+r
10
0
- 4f.4
..f....4
4.-4
4••
•••‘
•j.•.
•.
-•‘.•
--.
.•—
,(j
)
•.H
-
•-4
•.
4.
••--
0..
4,t
_:
W,
;.E
0
fi4
t4
0-
‘-‘
1.3
.‘
‘4’‘il
‘44
0—
4..
•4.4
..I4•_1.•
4’•,.
•-‘
,‘
,00
11
4[
1Z
I.)
.•.-.:.,
C—
1.3
44
4I
.L
.....1
•,
••,i•
II
P4
44
4
•.
4
If
,0
Z‘.
j..:
‘‘
‘-.I
’‘t
•.•
.,
..
.‘.
•‘
.Z
(U
I‘4
—oZ a 16

1. Which population first kicrease.d in size?
2. Describe the pattern of the fluctuations in the sizes of the Iwo popubtions
3. By looking only at the graph, how con you tell which species is the prey aid which is the
4. Which species attains the greater number of individuals? Why?
5. What do you think would happen to the mouse population in Hoot Woods if the owl were oilhinted to extinction? Explain.

LJ
8.W
hich
ofth
efo
llow
ing
isan
abio
ticco
mpo
nent
ofan
envi
ronm
ent?
A.
alga
e
B.su
nlig
ht
C.f
ungi
D.p
lant
s
Use
Wth
text
book
page
s34
—48
.
Eco
syst
ems
Mat
chea
chTe
rmon
the
left
with
the
best
Des
crip
tor
onth
erig
ht.E
ach
Des
crip
tor
may
beus
edon
lyon
ce.
A.th
esp
ecia
lrol
ean
orga
nism
play
sin
anec
osys
tem
B.a
part
ofa
blam
eIn
which
abio
tlcco
mpo
nent
sin
tera
ctwi
thbi
otic
com
pone
nts
C.a
sym
biot
icre
latio
nshi
pin
which
one
spec
ies
bene
fits
and
anot
heri
sha
rmed
0.a
sym
biot
icre
latio
nshi
pin
which
one
spec
ies
bene
fits
and
the
othe
rsp
ecie
sis
neith
erhe
lped
norh
anne
dF.
aha
rmftd
inter
actio
nbe
twee
ntw
oor
mor
eor
gani
smst
hato
ccur
sw
hen
the
orga
nism
sco
mpe
tefo
rthe
sam
ere
sour
cein
the
sam
elo
catio
nat
the
sam
etim
eF.
asy
mbi
otic
relat
ions
hip
betw
een
two
orga
nism
sin
hich
both
orga
nism
sbe
nefit
G.pr
edat
or-p
rey
inte
rac
tions
inw
hich
one
orga
nism
eats
allor
part
ofan
othe
ror
gani
sm
Nam
eD
ate
Use
with
text
book
page
s8-
28.
Dio
mes
Mat
chea
chTe
rmon
the
left
with
the
best
Des
crip
tor
onth
erig
ht.E
ach
Des
crip
torm
ayon
lybe
used
once
.
1.ab
iotic
2._
adap
tatio
ns3.
biom
e4.
biot
ic5.
cUm
ae6._
.._.
latit
ue
A.th
edi
stanc
em
easu
red
inde
gree
sno
rthor
sout
hfro
mth
eeq
uato
rB.
char
acte
ristic
sth
aten
able
orga
nism
sto
bette
rsur
vive
and
repr
oduc
eC.
relat
ing
tono
n-liv
ing
parts
ofan
envi
ron
men
t,su
chas
sunl
ight
,so
il,m
oistu
re,a
nti
tem
pera
ture
0.re
latin
gto
the
living
orga
nism
s,su
chas
plan
ts,an
imal
s,fu
ngi,
and
bact
eria
E.th
ela
rges
tdiv
isIon
ofth
ebi
osph
ere
F.th
eav
erag
eco
nditi
ons
ofth
eat
mos
pher
ein
alar
gere
gion
over
30ye
ars
1.co
mm
ensa
lism
2.co
mpe
titio
n3._
ecos
yste
m4.
mut
ualis
m5
._
nich
e6
._
para
sitism
7._
pred
atio
n
9.W
hich
ofth
efo
llow
ing
isa
biot
icco
mpo
nent
ofan
ecos
yste
m?
A.m
oist
ure
B.s
and
C.ba
cter
ia
0.te
mpe
ratu
re
10.W
hich
ofth
efo
llow
ing
isa
char
acte
rist
icof
the
bore
alfo
rest
biom
e?
A.
belo
wfr
eezi
ngha
lfth
eye
ar
B.lo
ng,h
otsu
mm
ers
C.po
lar
land
mas
ses
0.lo
tsof
prec
ipita
tion
11.
Whi
chw
orld
bion
icis
repr
esen
ted
bya
clim
atog
raph
that
illus
trat
esan
aver
age
prec
ipita
tion
of30
0cm
inth
em
onth
ofJa
nuar
y?
A.gr
assl
and
B.tr
opic
alra
info
rest
C.pe
rman
enti
ce
D.te
mpe
rate
deci
duou
sfo
rest
12.W
hich
wor
ldbi
onic
isre
pres
ente
dby
acl
imat
ogra
phth
atil
lust
rate
san
aver
age
tem
pera
ture
of—
25°C
inth
em
onth
ofJu
ly?
A.bo
real
fore
st
B.tr
opic
alra
info
rest
C.pe
rman
enti
ce
0.tu
ndra
Ass
essm
ent
Dat
e
____
____
____
_
Cir
de
the
lett
erof
the
bes
tan
swer
.
8.W
hatr
elat
ions
hip
isde
mon
stra
ted
bya
-:
barn
acle
bein
gat
tach
edto
aw
hale
?
A.m
utua
lism
B.co
mm
ensa
lism
C.pa
rasi
tism
D.co
mpe
titio
n
9.W
hich
ofth
efo
llow
ing
isan
exam
ple
ofm
utua
lism
?
A.si
mila
rco
lour
ing
ofsh
rim
pan
dcr
imso
nan
emon
e
B.bo
okw
orm
sat
tach
ing
toa
dog’
sin
test
ine
C.co
yote
sbu
ntin
gin
pack
sto
Idul
larg
ean
imal
s
0.sn
apdr
agon
flow
ers
that
open
forb
ees
ofa
spec
iñc
mas
s
10.W
hich
ofth
efo
llow
ing
situ
atio
nsbe
stde
scri
bes
the
rela
tions
hip
ofth
epr
edat
oran
dpr
eypo
pula
tion
show
nin
the
grap
hab
ove?
A.A
sth
epr
edat
orpo
pula
tion
incr
ease
sth
epr
eypo
pula
tion
incr
ease
s.
B.A
sth
epr
edat
orpo
pula
tion
decr
ease
sth
epr
eypo
pula
tion
decr
ease
s.
C.A
sth
epr
edat
orpo
pula
tion
incr
ease
sth
epr
eypo
pula
tion
decr
ease
s.
0.P
reda
tor
popu
latio
nha
sno
effe
cton
prey
popu
latio
n.
Cir
cle
the
lett
erof
the
bes
tan
swer
.
7.A
biom
ei
best
repr
esen
ted
bya:
A.ri
ver
B.ci
ty
C.la
titud
e
0.de
sert
02008
McG
raw
-Hill
Rye
rscn
Lknl
ted
Sec
tion
1.1
Bio
mes
•M
HR
70
2008
McG
raw
-Hill
Rye
rson
Lim
ited
Sect
ion
1.2
Eco
syst
ems•
MH
R13