chapter 10 capital market and the pricing of risk
TRANSCRIPT

Chapter 10
1
Capital Market and the Pricing of Risk

10.1 Risk and Return: Insights from 86 Years of Investor History
2
How would $100 have grown if it were placed in one of the following investments? Standard & Poor’s 500: 90 U.S. stocks up to 1957 and 500 after
that. Leaders in their industries and among the largest firms traded on U.S. Markets.
Small stocks: Securities traded on the NYSE with market capitalizations in the bottom 20%.
World Portfolio: International stocks from all the world’s major stock markets in North America, Europe, and Asia.
Corporate Bonds: Long-term, AAA-rated U.S. corporate bonds with maturities of approximately 20 years.
Treasury Bills: An investment in three-month Treasury bills.
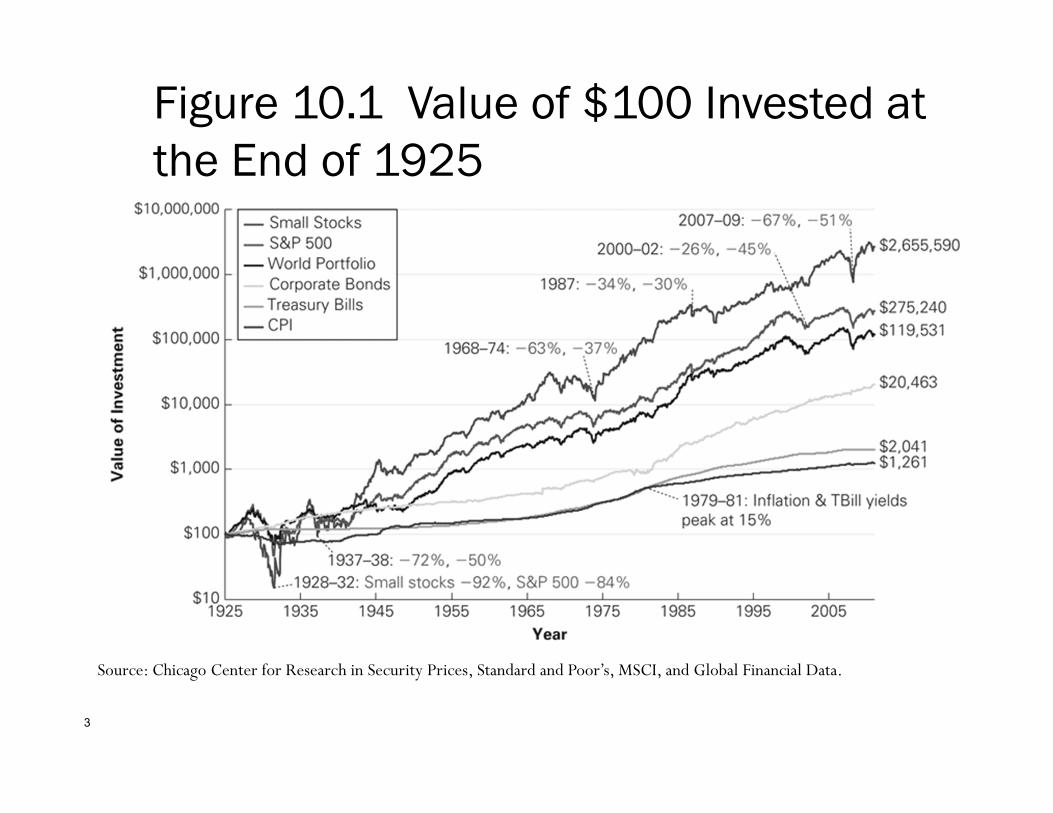
Figure 10.1 Value of $100 Invested at the End of 1925
3
Source: Chicago Center for Research in Security Prices, Standard and Poor’s, MSCI, and Global Financial Data.

Historical Rates of Return for U.S. Financial Securities: 1926–2011
4
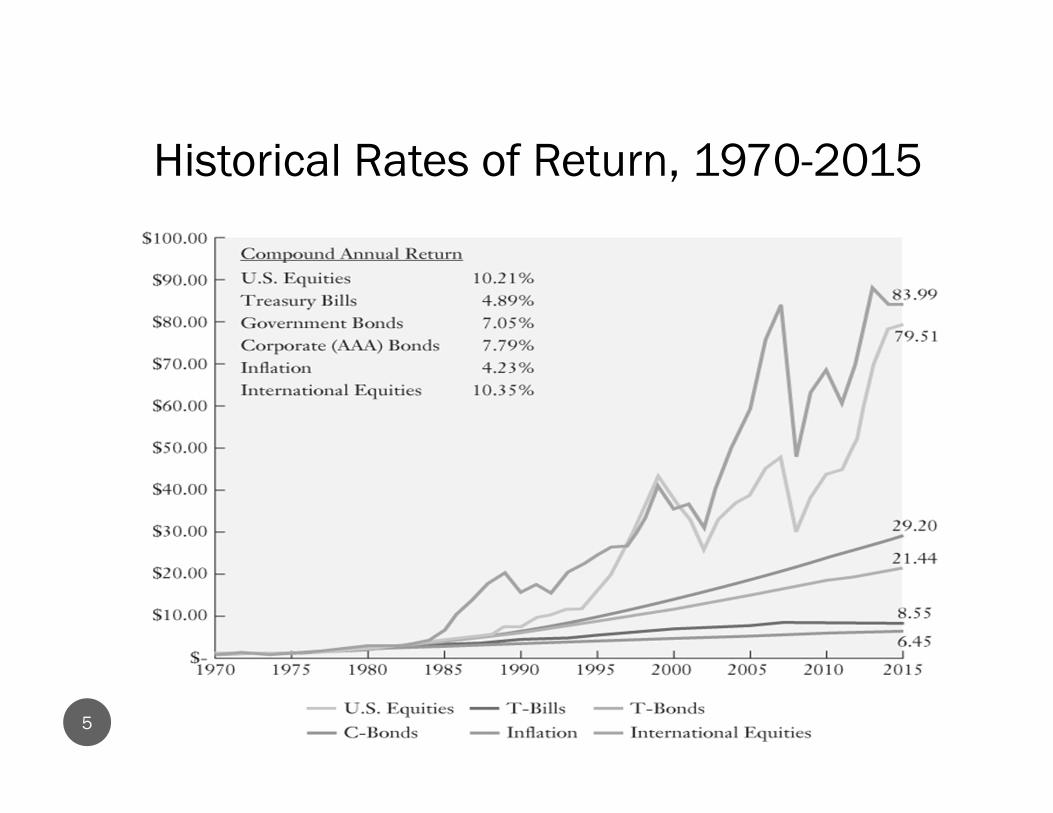
Historical Rates of Return, 1970-2015
5
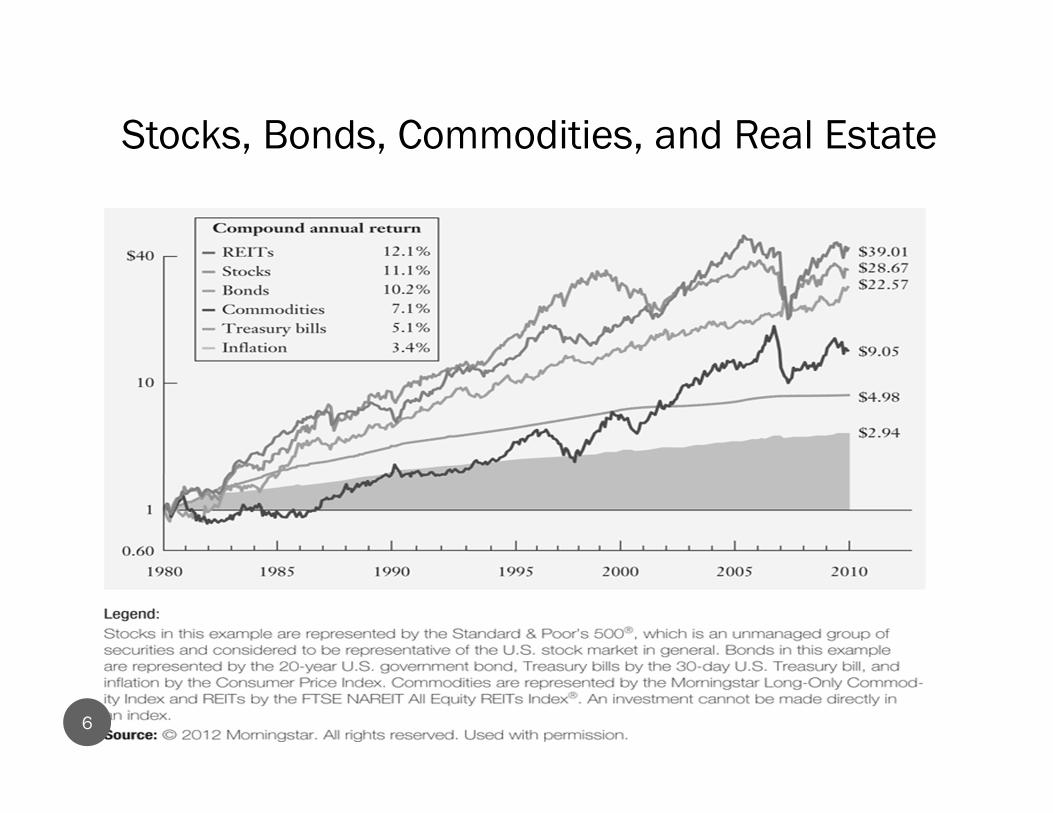
Stocks, Bonds, Commodities, and Real Estate
6
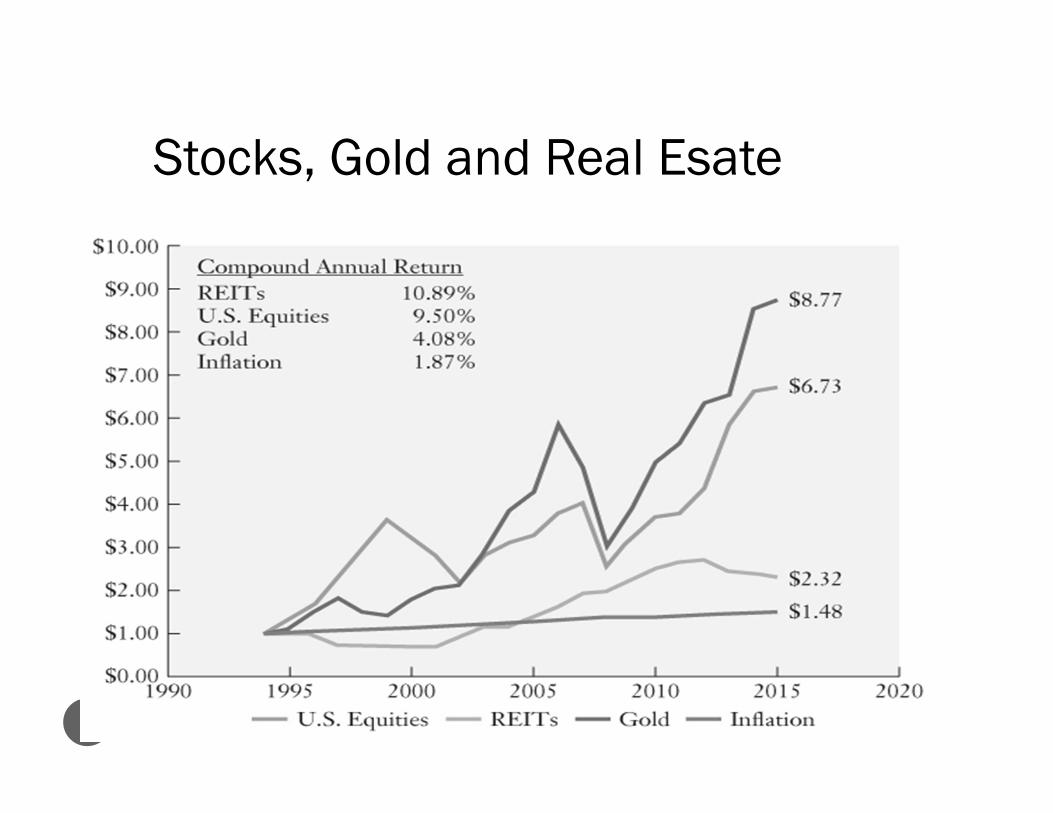
Stocks, Gold and Real Esate
7
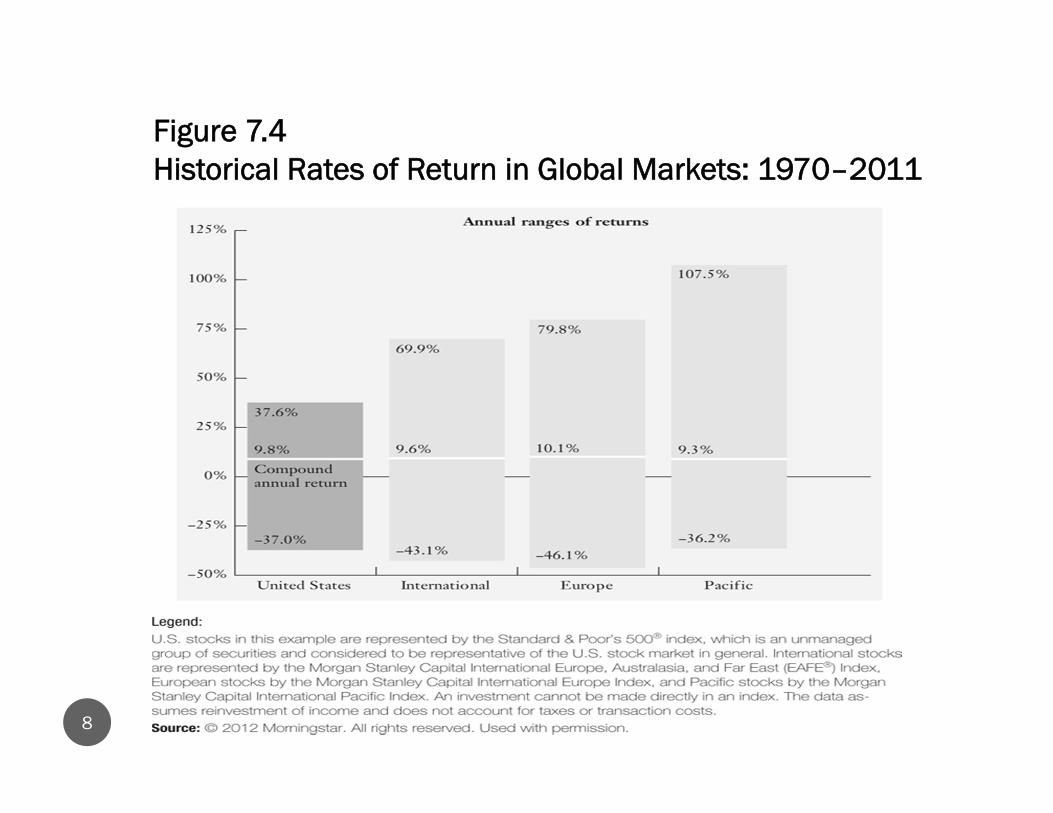
Figure 7.4Historical Rates of Return in Global Markets: 1970–2011
8

Figure 7.5 Investing in Emerging Markets: 1988–2011
9
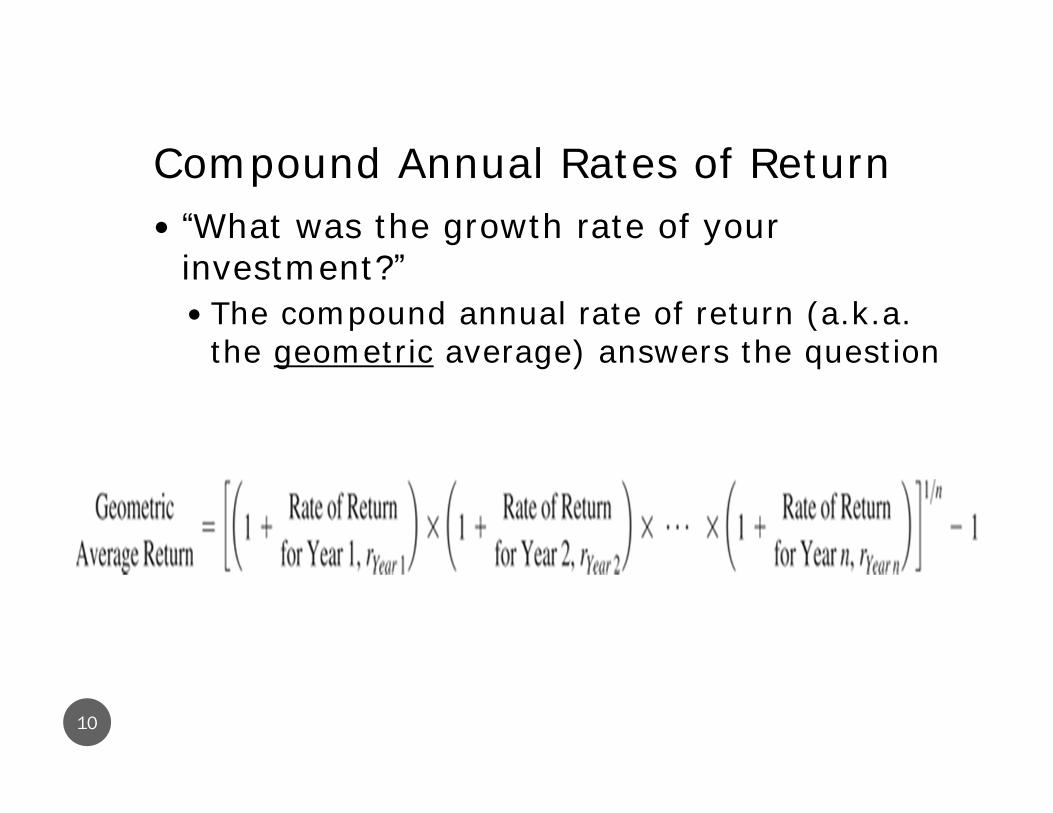
Compound Annual Rates of Return “What was the growth rate of your
investment?” The compound annual rate of return (a.k.a.
the geometric average) answers the question
10

Computing the Compound Annual Rate of ReturnCompute the arithmetic and CARR for the
following stock.
11

Computing Compound Annual Rate of Return Arithmetic Average= (40+(-50)) ÷ 2 = -5%
CARR = = [(1+Ryear1) × (1+Ryear 2)]1/2 - 1= [(1.4) × (1+(-.5))] 1/2 - 1= -16.33%
Which more accurately reflects performance?
12
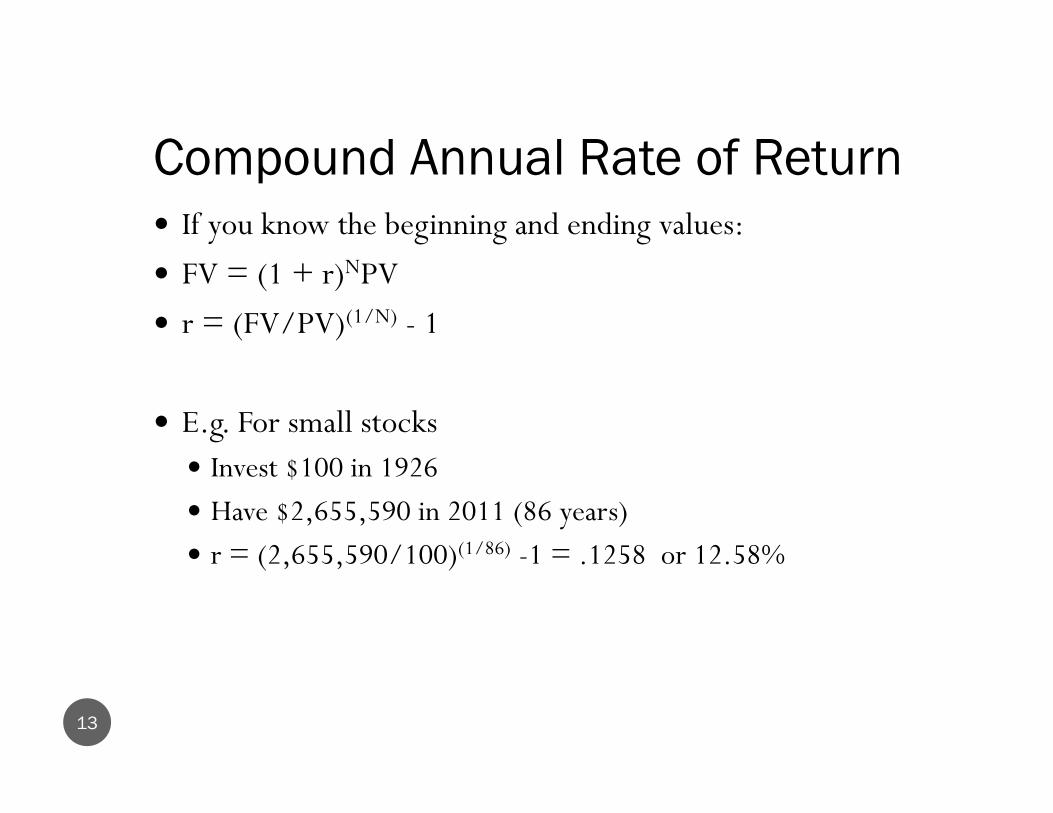
Compound Annual Rate of Return If you know the beginning and ending values:
FV = (1 + r)NPV
r = (FV/PV)(1/N) - 1
E.g. For small stocks Invest $100 in 1926 Have $2,655,590 in 2011 (86 years) r = (2,655,590/100)(1/86) -1 = .1258 or 12.58%
13

10.1 Risk and Return: Insights from 86 Years of Investor History
14
Small stocks had the highest long-term returns, while T-Bills had the lowest long-term returns.
Small stocks had the largest fluctuations in price, while T-Bills had the lowest.
Higher risk requires a higher return.
Few people ever make an investment for 86 years.
More realistic investment horizons and different initial investment dates can greatly influence each investment's risk and return.

Figure 10.2 Value of $100 Invested for Alternative Investment Horizons
15
Source: Chicago Center for Research in Security Prices, Standard and Poor’s, MSCI, and Global Financial Data.

10.4 The Historical Tradeoff Between Risk and Return
16
The Returns of Large Portfolios
Excess Returns
The difference between the average return for an investment and the average return for T-Bills
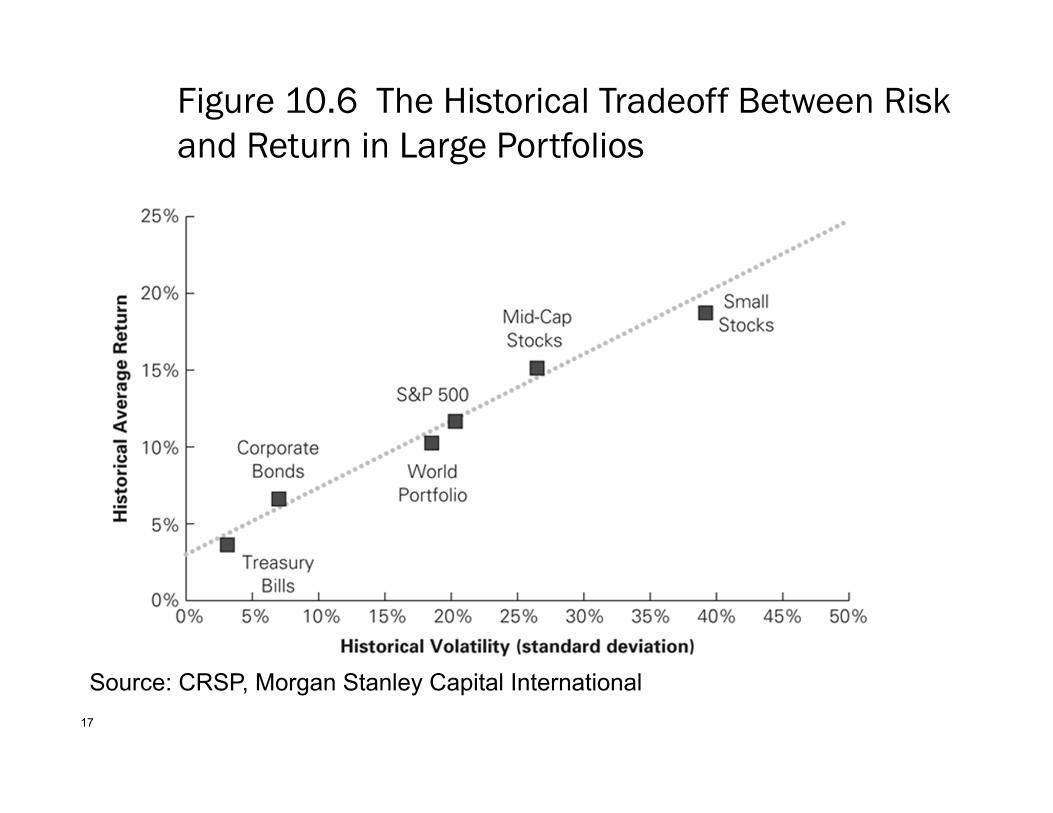
Figure 10.6 The Historical Tradeoff Between Risk and Return in Large Portfolios
17
Source: CRSP, Morgan Stanley Capital International
The Returns of Individual Stocks
18
Is there a positive relationship between volatility and average returns for individual stocks?
As shown on the next slide, there is no precise relationship between volatility and average return for individual stocks.
Larger stocks tend to have lower volatility than smaller stocks.
All stocks tend to have higher risk and lower returns than large portfolios.
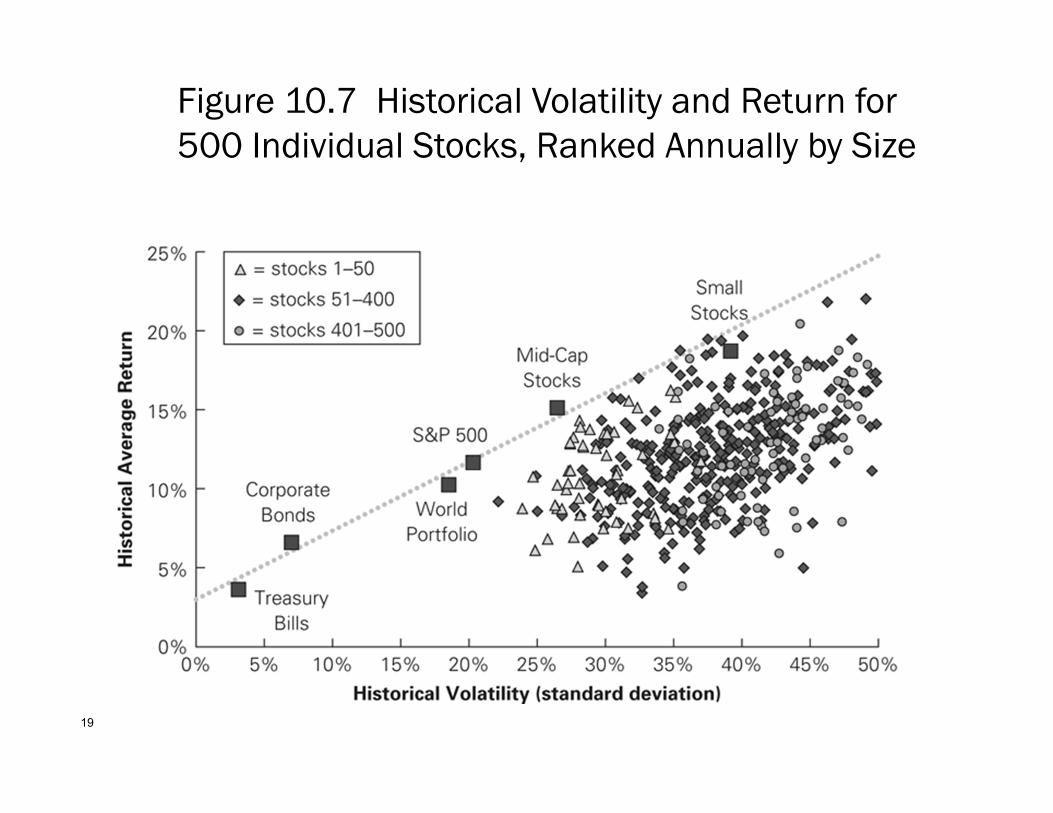
Figure 10.7 Historical Volatility and Return for 500 Individual Stocks, Ranked Annually by Size
19
10.5 Common Versus Independent Risk
20
Common Risk
Risk that is perfectly correlated Risk that affects all securities
Independent Risk
Risk that is uncorrelated Risk that affects a particular security
Diversification
The averaging out of independent risks in a large portfolio
10.6 Diversification in Stock Portfolios
21
Firm-Specific Versus Systematic Risk
Firm Specific News
Good or bad news about an individual company
Market-Wide News
News that affects all stocks, such as news about the economy
10.6 Diversification in Stock Portfolios
22
Firm-Specific Versus Systematic Risk
Independent Risks
Due to firm-specific news
Also known as:
o Firm-Specific Risk
o Idiosyncratic Risk
o Unique Risk
o Unsystematic Risk
o Diversifiable Risk

10.6 Diversification in Stock Portfolios
23
Firm-Specific Versus Systematic Risk
Common Risks
Due to market-wide news
Also known as:
o Systematic Risk
o Undiversifiable Risk
o Market Risk

10.6 Diversification in Stock Portfolios
24
Firm-Specific Versus Systematic Risk
When many stocks are combined in a large portfolio, the firm-specific risks for each stock will average out and be diversified.
The systematic risk, however, will affect all firms and will not be diversified.

No Arbitrage and the Risk Premium
25
The risk premium for diversifiable risk is zero, so investors are not compensated for holding firm-specific risk.
If the diversifiable risk of stocks were compensated with an additional risk premium, then investors could buy the stocks, earn the additional premium, and simultaneously diversify and eliminate the risk.
No Arbitrage and the Risk Premium
26
By doing so, investors could earn an additional premium without taking on additional risk. This opportunity to earn something for nothing would quickly be exploited and eliminated. Because investors can eliminate firm-specific risk “for free” by diversifying their portfolios, they will not require or earn a reward or risk premium for holding it.
No Arbitrage and the Risk Premium
27
The risk premium of a security is determined by its systematic (non-diversifiable) risk and does not depend on its diversifiable risk.
This implies that a stock’s volatility, which is a measure of total risk (that is, systematic risk plus diversifiable risk), is not especially useful in determining the risk premium that investors will earn.

No Arbitrage and the Risk Premium
28
Standard deviation is not an appropriate measure of risk for an individual security.
There should be no clear relationship between volatility and average returns for individual securities.
Consequently, to estimate a security’s expected return, we need to find a measure of a security’s systematic risk.
10.7 Measuring Systematic Risk
29
To measure the systematic risk of a stock, determine how much of the variability of its return is due to systematic risk versus unsystematic risk.
To determine how sensitive a stock is to systematic risk, look at the average change in the return for each 1% change in the return of a portfolio that fluctuates solely due to systematic risk.

10.7 Measuring Systematic Risk
30
Efficient Portfolio
A portfolio that contains only systematic risk. There is no way to reduce the volatility of the portfolio without lowering its expected return.
Market Portfolio
An efficient portfolio that contains all shares and securities in the market The S&P 500 is often used as a proxy for the market portfolio.
10.7 Measuring Systematic Risk
31
Sensitivity to Systematic Risk: Beta (β)
The expected percent change in the excess return of a security for a 1% change in the excess return of the market portfolio. Beta differs from volatility.
Volatility measures total risk (systematic plus unsystematic risk), while beta is a measure of only systematic risk.
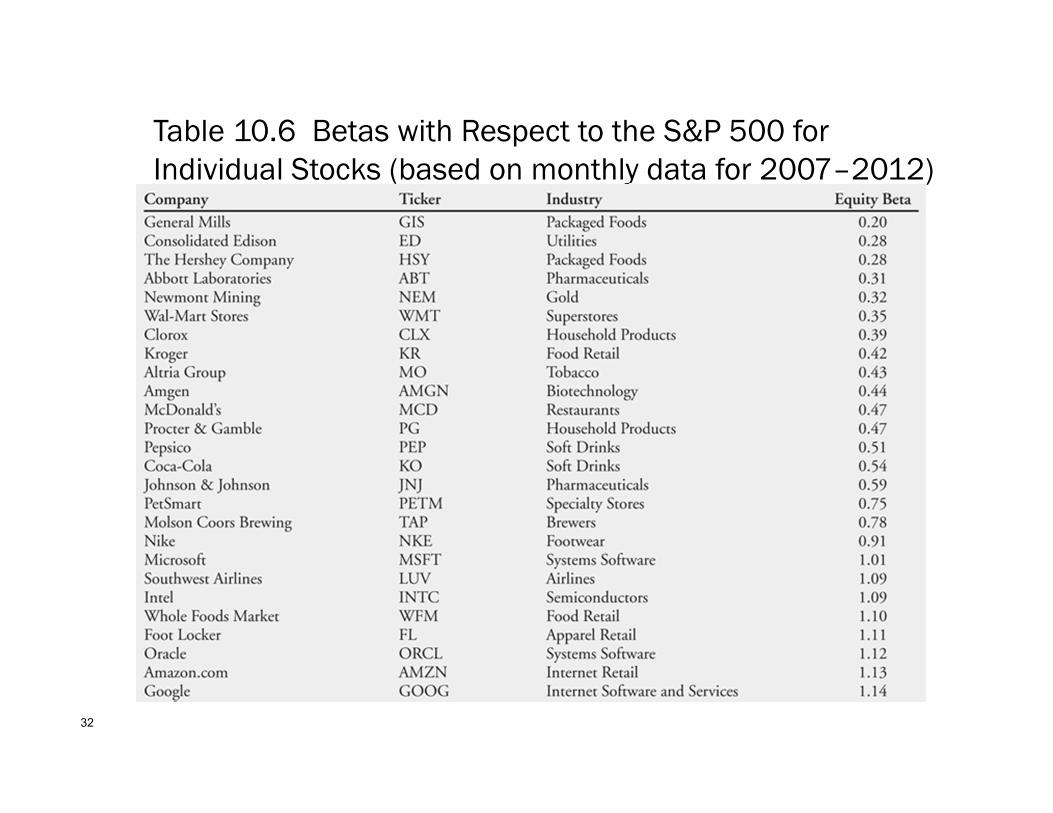
Table 10.6 Betas with Respect to the S&P 500 for Individual Stocks (based on monthly data for 2007–2012)
32
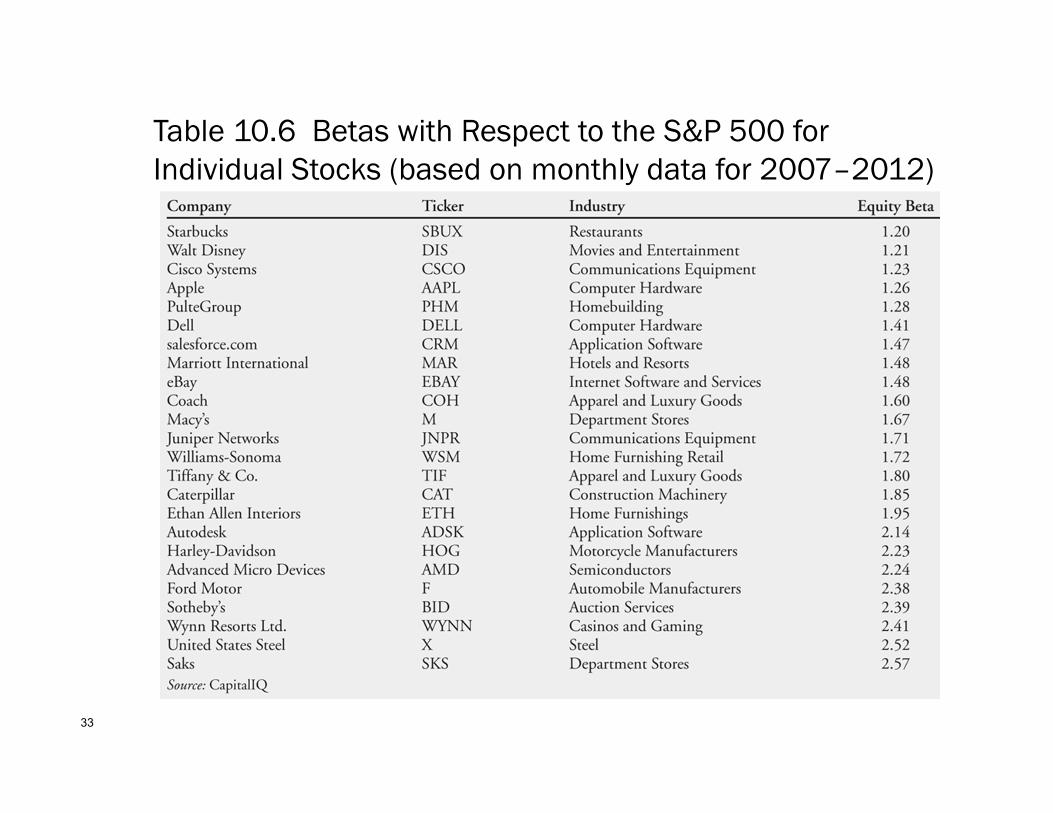
Table 10.6 Betas with Respect to the S&P 500 for Individual Stocks (based on monthly data for 2007–2012)
33
10.7 Measuring Systematic Risk
34
Interpreting Beta (β)
A security’s beta is related to how sensitive its underlying revenues and cash flows are to general economic conditions.
Stocks in cyclical industries are likely to be more sensitive to systematic risk and have higher betas than stocks in less sensitive industries.
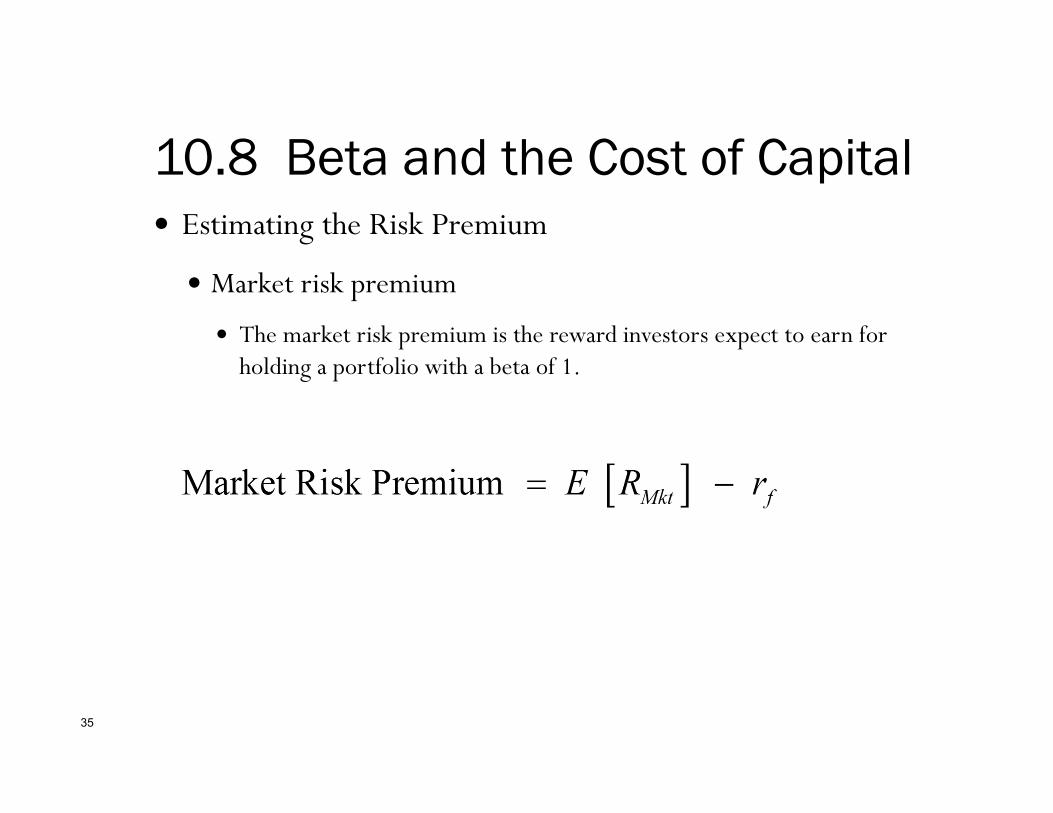
10.8 Beta and the Cost of Capital
35
Estimating the Risk Premium
Market risk premium
The market risk premium is the reward investors expect to earn for holding a portfolio with a beta of 1.

10.8 Beta and Cost of Capital
36
Adjusting for Beta Estimating a Traded Security’s Cost of Capital of an investment
from its Beta
This is known as the Capital Asset Pricing Model (CAPM) It is the most important method for estimating the cost of
capital that is used in practice
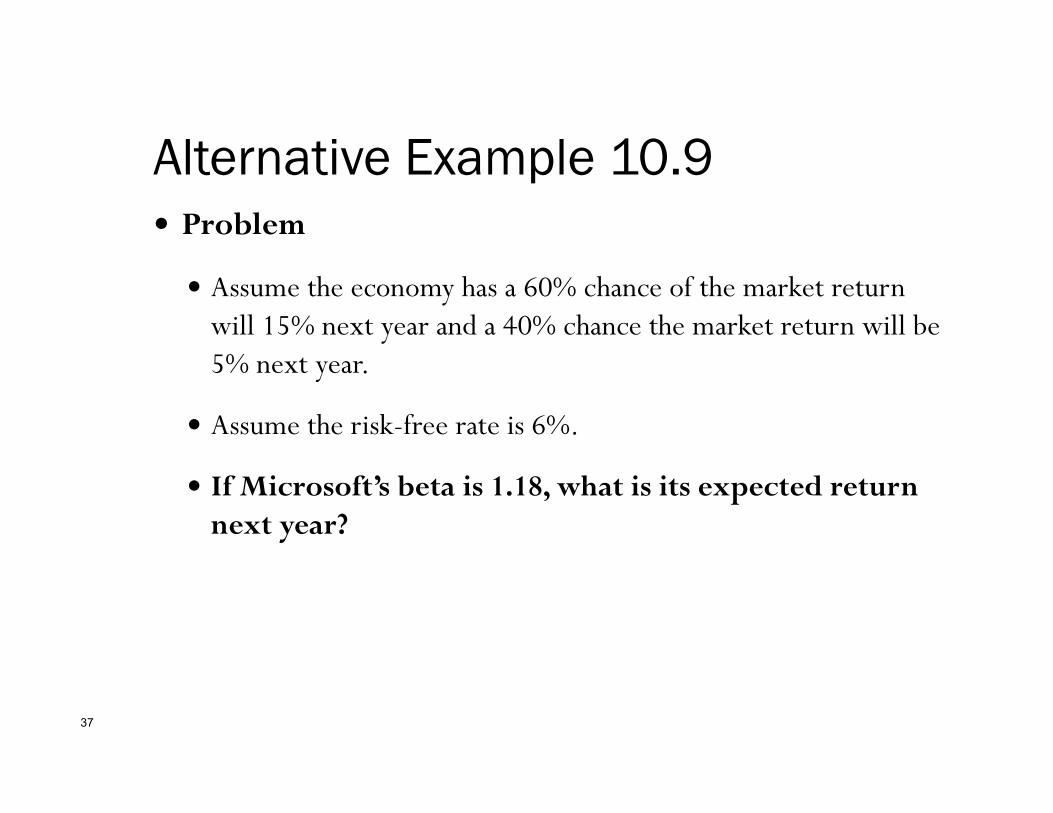
Alternative Example 10.9
37
Problem
Assume the economy has a 60% chance of the market return will 15% next year and a 40% chance the market return will be 5% next year.
Assume the risk-free rate is 6%.
If Microsoft’s beta is 1.18, what is its expected return next year?
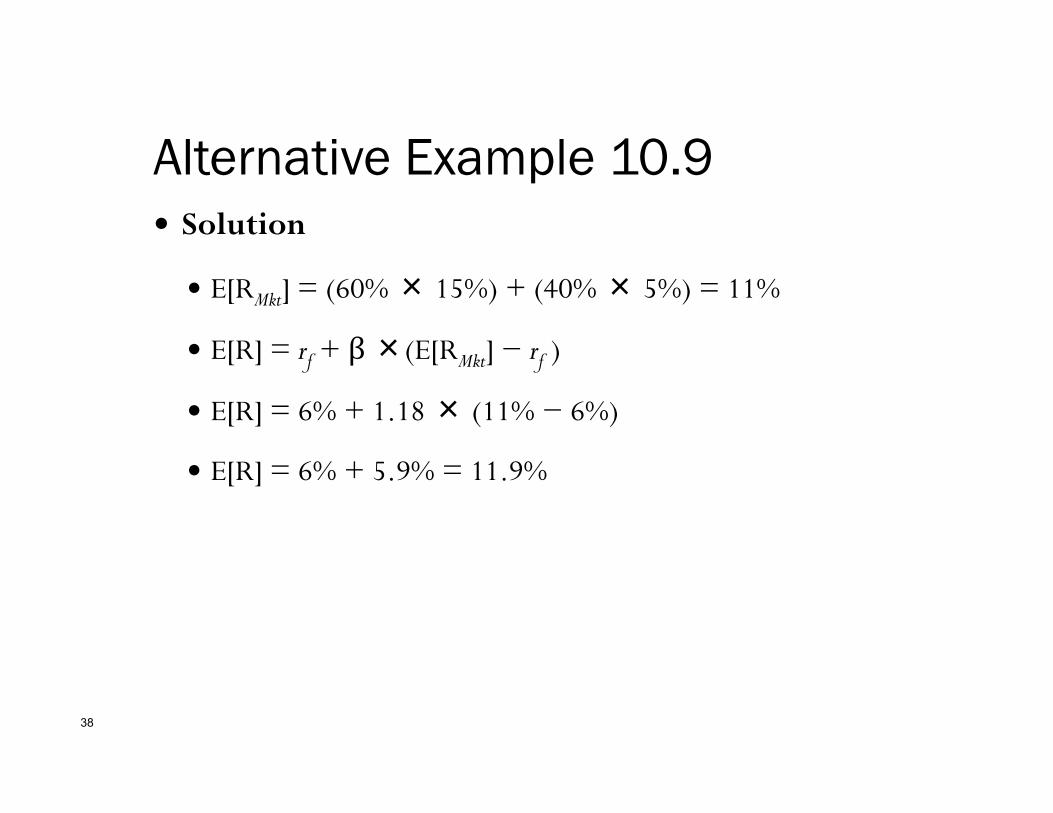
Alternative Example 10.9
38
Solution
E[RMkt] = (60% × 15%) + (40% × 5%) = 11%
E[R] = rf + β×(E[RMkt] − rf )
E[R] = 6% + 1.18 × (11% − 6%)
E[R] = 6% + 5.9% = 11.9%