chapter 10 politics - pbs: public broadcasting service · pdf file ·...
TRANSCRIPT


A staffer from Dr. George Gallup’s Instituteof Public Opinion takes notes during an inter-
view. Gallup did not invent scientific sam-pling, but he was the first to report results
publicly and regularly through his syndicatednewspaper column “America Speaks.”Courtesy of the Gallup Organization.
Chapter 10
Politics

Democrats and Republicans shared presidential electionvictories almost equally. Voter participation declined from
1900 to 1912 and then fluctuated during the rest of thecentury with no clear trend.
The twenty-five presidential elections of the twentieth century produced twelveDemocratic and thirteen Republican presidents (see upper chart). In seven of theseelections, the winning margin in the popular vote was 5 percent or less. In the1960 and 1968 elections, with Richard M. Nixon as the Republican candidate inboth, the winning margin was less than 1 percent. In two elections, the tally wasso close that the ultimate losers, Charles Evans Hughes in 1916 and Thomas E.Dewey in 1948, were announced as the winners on the morning after the election.
American voters seemed to prefer a two-party system and were often reluctant tocast their votes for third parties. Nevertheless, third-party candidates had con-siderable influence in four of the century’s twenty-five presidential elections.Theodore Roosevelt won nearly 30 percent of the popular vote in 1912. RobertLa Follette captured 17 percent of the vote in 1924. George Wallace garnered 14percent of the vote in 1968. Ross Perot won 19 percent of the vote in 1992. Inthree of these elections—1912, 1968, and 1992—the winning candidates gar-nered a plurality, rather than a majority, of the votes cast.
The American system is unique among industrial democracies. It is characterizednot only by the long-term balance between the two major parties and resistanceto third-party candidates, but also by an electoral college system that maintainsthe “winner-take-all” principle in every state.
Voter participation—the ratio of actual voters to the total number of eligible voters—is difficult to calculate. Ballot-box stuffing and miscounts cause errors in the count ofactual voters, but these problems are trivial compared with the difficulty of estimat-ing the number of eligible voters. Early in the century, each state decided independ-ently who was qualified to vote in national elections. A number of states gave the voteto resident aliens and a few to women. Residence, age, and literacy requirements var-ied from state to state, as did the administrative practices that in some states excludedblacks, American Indians, and Asian Americans from the voting population.
Amendments to the Constitution, federal legislation, and a series of federal courtdecisions that struck down literacy and residency requirements eliminated much ofthe discretion the states had enjoyed. But substantial differences among statesremained. In 2000, for example, fourteen states denied the vote to convicted felons.
For every presidential election since 1916, several official estimates of voter par-ticipation are available. The lower chart shows the maximum and minimum esti-mates of participation in each election. Both series indicate that voter participationwas exceptionally low in 1920, 1924, 1948, and 1996, and exceptionally high in1952 and 1960.
180 The First Measured Century
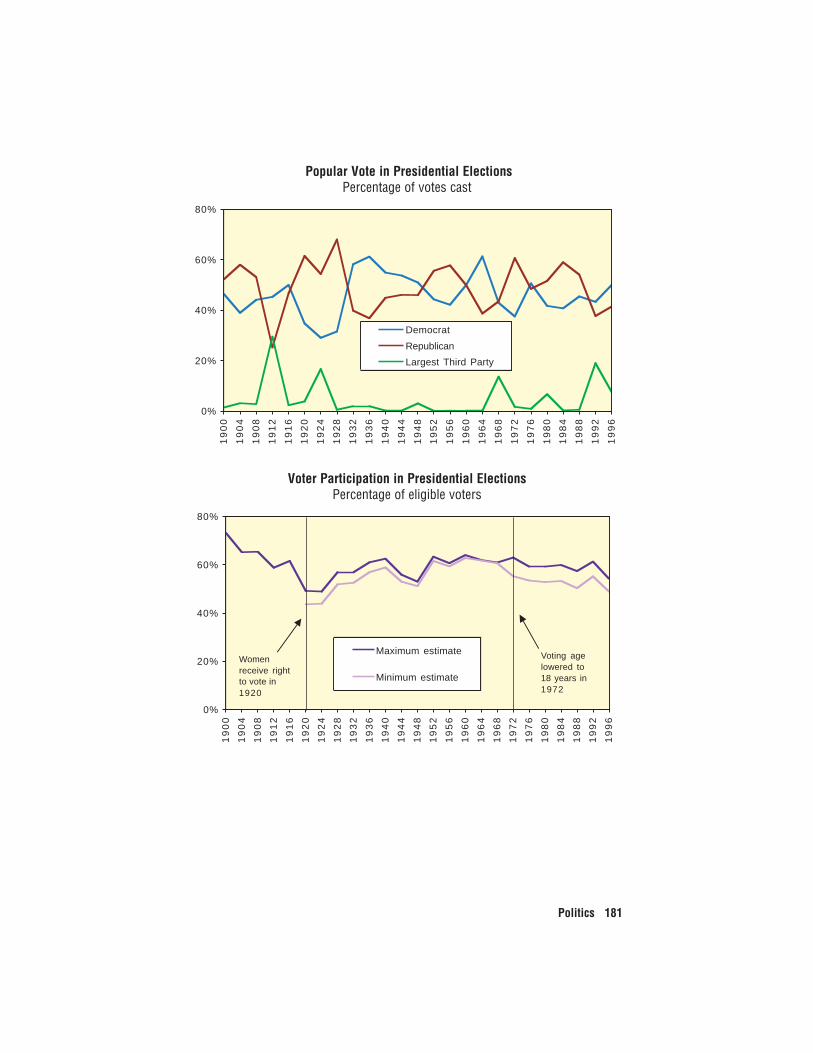
Popular Vote in Presidential ElectionsPercentage of votes cast
0%
20%
40%
60%
80%1
90
0
19
04
19
08
19
12
19
16
19
20
19
24
19
28
19
32
19
36
19
40
19
44
19
48
19
52
19
56
19
60
19
64
19
68
19
72
19
76
19
80
19
84
19
88
19
92
19
96
Democrat
Republican
Largest Third Party
0%
20%
40%
60%
80%
19
00
19
04
19
08
19
12
19
16
19
20
19
24
19
28
19
32
19
36
19
40
19
44
19
48
19
52
19
56
19
60
19
64
19
68
19
72
19
76
19
80
19
84
19
88
19
92
19
96
Maximum estimate
Minimum estimate
Voting age lowered to 18 years in 1972
Women receive to vote in
right
1920
Popular Vote in Presidential ElectionsPercentage of votes cast
Voter Participation in Presidential ElectionsPercentage of eligible voters
Politics 181

Control of the U.S. House of Representatives and the U.S.Senate oscillated between the two major parties.
In thirty-two of the fifty Congresses elected from 1900 to 1998, Democrats helda majority of seats in the U.S. House of Representatives, elected the Speaker, anddominated the committees. The Democrats held their largest majority in theSeventy-fifth Congress (1937–38), with 333 Democrats to 89 Republicans and 13third-party members. The Democrats ruled the House of Representatives withouta break from 1955 to 1995.
The periods of Republican advantage occurred earlier in the century, from 1901 to1911 and from 1917 to 1933. The latter period began and ended with majorities offewer than ten seats. The Republicans held their largest majority, 300 to 132, in 1921.
Dramatic turnarounds occurred in 1920, when the Republicans gained 64 seats,and in 1932, when the Republicans lost 99 seats. In the postwar election of 1946,the Democrats lost 55 seats, but in the following election, they gained 75. The“Republican Revolution” of 1994 was comparable in scale. The GOP gained 54seats to take control of the House for the first time in thirty years, and then main-tained control in the 1996 and 1998 elections.
The Democrats held a majority of U.S. Senate seats in twenty-nine of the fiftyCongresses elected during the century. As in the House, the largest Democraticmajority was achieved in the Seventy-fifth Congress (1937–39), with 75Democrats to 17 Republicans and 4 third-party Senators. The longest period ofDemocratic control lasted from 1955 until 1980.
The Constitution requires a two-thirds vote in the Senate to ratify a treaty, andthe rules of the Senate require a supermajority to close off debate. In more than80 percent of the century’s Congresses (forty-two of fifty), neither party had atwo-thirds majority in the Senate. In eighteen of those Congresses, the majorityparty had a margin of no more than ten seats. The Senate, by its structure, is moreinclined to bipartisan compromise than the House.
The House elects its own Speaker, but the vice president of the United States pre-sides over the Senate and casts the deciding vote in the case of a tie. In fifteen ofthe century’s fifty Congresses, the vice president did not belong to the same partyas the Senate majority.
182 The First Measured Century

U.S. SenateSeats held by each party
0
2 0
4 0
6 0
8 0
100
1900 1920 1940 1960 1980 2000
Republicans
Democrats
Third parties
U.S. House o Represe tativesSeats held by each party
0
100
200
300
400
1900 1920 1940 1960 1980 2000
Democrats
Republicans
Third parties
U.S. SenateSeats held by each party
U.S. House of RepresentativesSeats held by each party
Politics 183

After women first entered Congress early in the century, theirnumbers increased slowly and then rose rapidly.
The first woman member of Congress, Jeannette Rankin of Montana, was electedin 1916. That was four years before the adoption of the Nineteenth Amendmentto the Constitution enfranchised women nationally, but Montana and some otherstates had already done so.
Congresswoman Rankin served one term when first elected and another whenshe was elected again in 1940. In her first term, she was the only woman in theHouse. In 1941, she had eight female colleagues, and together they held less than2 percent of the seats in the House. By 1991, women held 28 seats. In 1999, theyheld 56 House seats—13 percent of the total.
Once elected, congresswomen won reelection as easily as their male colleagues.Forty-one of the 103 women elected to the House between 1916 and 1986remained for five or more terms. The longest-serving incumbent, Frances Boltonof Ohio, held office for thirty years.
The first female senator, Rebecca Felton of Georgia, was appointed to fill an unex-pired term in 1922. Hattie Caraway of Arkansas, the first woman senator to beregularly elected, served from 1931 to 1945. Only one other female senator,Margaret Chase Smith of Maine, was elected and reelected more than once.Twelve of the 27 women who entered the Senate during the century wereappointed to fill out unexpired terms, an honor often bestowed on the widows ofdeceased senators. Until 1992, there had never been more than three female sen-ators serving at the same time. Nine women held Senate seats in 1999, just under10 percent of the total.
184 The First Measured Century

0
2 0
4 0
6 0
8 0
1900 1920 1940 1960 1980 2000
1917 = 1
1999 = 65
CongresswomenNumber of women in the House of Representatives and the Senate
Politics 185

The number of black elected officials increasedgreatly after 1970.
From 1867 to 1877, following the Civil War, blacks had voting rights in the for-mer Confederate states. Numerous black officials won election to Congress dur-ing that period. With the demise of Reconstruction, however, a combination oflegal and illegal devices effectively canceled black suffrage throughout most of theSouth, where the black population was concentrated. Thereafter, a handful ofblacks held minor offices in communities with large black populations, but nonewas elected to national or state offices.
This situation persisted throughout the first half of the century and into the sec-ond half. It did not change very much until the civil rights movement gatheredmomentum in the 1960s. In 1966, Edward Brooke, Republican of Massachusetts,was elected as the first black U.S. senator in eighty-eight years. In 1967, Carl B.Stokes was elected as mayor of Cleveland and Richard G. Hatcher as mayor ofGary, Indiana. In 1968, Shirley Chisholm, Democrat of New York, became thefirst black woman ever elected to Congress. The trend in appointive offices wassimilar. Thurgood Marshall took his seat on the Supreme Court in 1967.
In the last three decades of the century, the number of black elected officialsincreased sixfold, from 1,469 in 1970 to 8,868 in 1998. During that time, blacksgradually achieved an impressive share of certain high public offices. Most of thecountry’s largest cities elected one or more black mayors. In 1999, the 37 Houseseats that black representatives held accounted for about 9 percent of all seats inthe U.S. House of Representatives.
But only one black governor and two black senators were elected in the century.At the lower levels of elected government—school boards, sheriffs, and countytax assessors, for example—blacks were also significantly underrepresented. Atthe end of the century, only about 2 percent of all elected officials were black.
186 The First Measured Century

Total number of blacks holding elected office at all levels of government
0
3,000
6,000
9,000
1900 1920 1940 1960 1980 2000
1900 = 50
1998 = 8,868
Black Elected OfficialsTotal number of blacks holding elected office at all levels of government
Politics 187

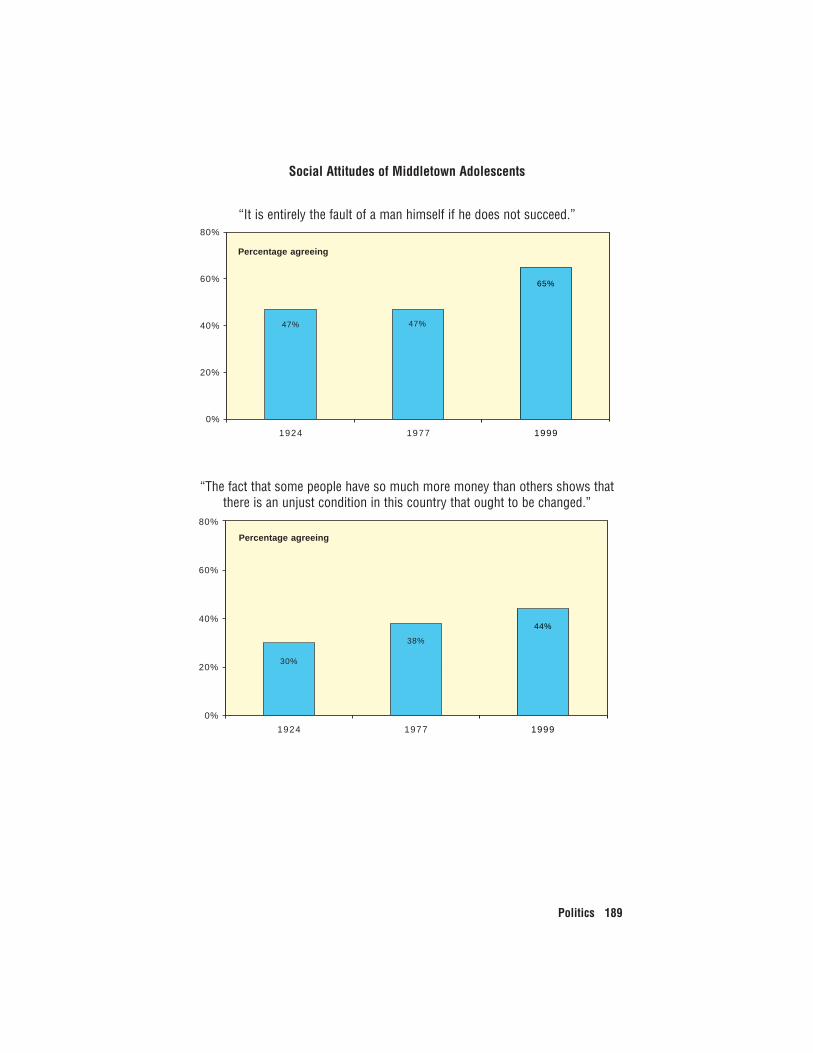
The attitudes of Middletown adolescents toward socialissues did not vary dramatically between 1924 and 1999.
The 1924 survey of Middletown high school students by Robert and Helen Lyndincluded items designed to elicit their attitudes toward two basic social issues: theProtestant Ethic of unlimited personal responsibility, and economic inequality inthe United States. Students were asked whether they agreed or disagreed with thefollowing statements:
“It is entirely the fault of a man himself if he does not succeed.”
“The fact that some people have so much more money than others shows thatthere is an unjust condition in this country that ought to be changed.”
These items were repeated without change in the 1977 and 1999 replications ofthese surveys. As the chart shows, the percentage of Middletown adolescentsagreeing with the Protestant Ethic remained level from 1924 to 1977 but increasedfrom 1977 to 1999, while the proportion agreeing with action against economicinequality increased in each of the three surveys from 1924 to 1999.
188 The First Measured Century
65%
47%47%
0%
20%
40%
60%
80%
1924 1977 1999
Percentage agreeing
Social Attitudes of Middletown Adolescents
“It is entirely the fault of a man himself if he does not succeed.”
38%
30%
44%
0%
20%
40%
60%
80%
1924 1977 1999
p p yunjust condition in this county that ought to be changed."
Percentage agreeing
“The fact that some people have so much more money than others shows thatthere is an unjust condition in this country that ought to be changed.”
Politics 189