chapter 2 -- financial accounting - we can offer most test...
TRANSCRIPT

CHAPTER 2
DISCUSSION QUESTIONS
1. Investors, creditors, and other external users need to know a company's financial status. For example, what assets does the company own? Are the assets still produc-tive? How hard would it be to sell the assets, if needed? Also, what debts must be paid? Are the owners' interests in the business in-creasing or decreasing and why? External users also need information on the profitabil-ity of the company. Is the company making or losing money? In addition, external users need to know what the total inflows and out-flows of cash are—those from operations as well as those from investing and financing activities. This information is provided in the primary financial statements consisting of a balance sheet, an income statement, and a statement of cash flows.
2. a. A balance sheet shows a company's fi-nancial status (the relationships among assets, liabilities, and owners' equity) at a particular date.
b. An income statement shows the results of an entity's operations during a period of time.
c. A statement of cash flows shows the major inflows and outflows of cash dur-ing a period of time.
3. The answer might seem obvious to you, but you would be surprised at how often people get so caught up in dreaming of the “guaran-teed” return that they forget to research the company's financial situation before invest-ing.
Would you buy a home on your friends' ad-vice without seeing the home yourself? No, you would view the home and most likely hire an inspector to check it for problems be-fore deciding if it would be a good invest-ment. Just as you would inspect a home be-fore investing, so should you inspect the company by, among other things, reviewing the financial statements.
By researching the past and current finan-cial statements of the company, you can de-termine (1) if past and present stock perfor-mances are indicative of the projected 150%
return; (2) if the company has a history of positive or negative cash flows; (3) if sales have been steadily increasing or decreasing over time; and (4) if the company historically has had net earnings or losses.
These are but a few of the many reasons why it is important to do the research your-self before immediately jumping into an in-vestment just on your friends' advice.
4. Readers of annual reports need to compare the financial status and results of operations of a company with other companies and with the same company's results for previous pe-riods. In this way, users can judge the rela-tive progress of a company toward its goals. Statements covering more than one ac-counting period and those statements that classify and highlight key relationships assist in this comparative analysis.
5. There are three ways that economic re-sources can be brought into a business: bor-rowing from others, owner contributions, and earnings. The first is a liability, whereas the latter two are included in the owners' equity section. Together these two balance sheet sections (liabilities and owners' equity) in-form readers of the “sources'' of assets.
6. Owners' equity is a residual value showing the amount of net assets (assets minus lia-bilities) that are claimed by the owners of the business. If a business were to sell all its assets, then pay all its creditors, the remain-ing amount would go to the owners. The amount of owners' equity reported on a bal-ance sheet generally will not be equal to the current worth of a business since the assets generally are reported at their historical costs, not at their current values. The amount of owners' equity is represented by all assets (after deducting liabilities), not just cash.
7. The balance sheet has two main limitations. First, assets are initially recorded at their purchase cost and subsequent changes in value may or may not be recorded on the books. The second limitation is that some important economic assets, called intangible
15

assets, are not reported at all, although they may be the most valuable assets to the company.
It is important to be aware of these limita-tions when evaluating a company's growth potential because the company may be worth much more (or less) than its book value shows.
8. Some people feel that the income statement is more important than the balance sheet because it shows the profitability of a com-pany. In turn, profitability relates to future cash-generating ability, which is of prime in-terest to most users of financial reports. Others feel that the balance sheet is more important than the income statement be-cause cash flow is eventually translated into the asset and equity balances reported on the balance sheet. Properly informed people realize that all three primary financial state-ments are equally important and comple-mentary.
9. By looking only at the net income or EPS number, an investor might not see the im-portant relationships of various categories on an income statement. For example, rev-enues less operating expenses equals oper-ating income. If an unusual gain or loss on some nonoperating item is added to or sub-tracted from operating income, net income and the EPS number may be distorted and would not reflect the results of normal oper-ations for the period.
10. Cash flows should be classified according to operating, investing, and financing activities in order to help investors and others see the sources and uses of cash by major activity. For example, if a company is not providing a net cash inflow from operations and instead has to borrow cash to keep the business running, it may not stay in business long. Thus, the amount of net cash provided from operations is a key figure that should be highlighted.
11. When financial statements are prepared in accordance with generally accepted ac-counting principles (GAAP), certain guide-lines or rules have been followed in measur-ing and reporting the yearly financial activi-ties. In expressing an opinion, an auditor at-tests and affirms that the guidelines followed are commonly accepted by the accounting profession. Thus, the auditor's opinion gives
assurance that the results of operations have not been distorted because a firm uses different or incorrect accounting principles and procedures. The auditor's opinion also gives some assurance that management's financial statements fairly represent what actually occurred during the year. Without such assurances, misleading or ill-prepared financial statements could cause substantial losses to unwary investors.
12. Auditors cannot assure that the financial statements are accurate, because their ex-amination is not based on a test of every item and every transaction. Time and fee constraints require that an audit be based on a sample of items. Auditors review a suf-ficient sample of evidential material to form a professional opinion, but accuracy is still the responsibility of the preparer of the statements—management. The auditor's function is to express an opinion about the financial statements.
13. The four types of financial statement notes typically included in an annual report are (1) summary of significant accounting policies, (2) additional information about summary to-tals, (3) disclosure of information not recog-nized, and (4) supplementary information.
14. The importance of the basic accounting con-cepts or assumptions is as follows:
a. The separate entity concept identifies the particular organizational unit for which accounting data are compiled. The entity is the focal point for accumu-lating, measuring, and communicating accounting data.
b. Arm's-length transactions are those in which the buyer and seller are rational and free to act independently. Account-ing for and analyzing economic transac-tions enable the accountant to measure the successes and failures of a reporting entity. If transactions between entities involve any favoritism or irregularity, the data measured by the accountant will lose validity; that is, the data will not ac-curately measure the success of the re-porting entity.
c. The cost principle requires transactions to be recorded at historical costs, the amounts originally paid in an arm's-length transaction. This ensures that ac-

Full file at http://testbankwizard.eu/Solution-Manual-for-Accounting-Concepts-and-Applications-10th-Edi-tion-by-Albrecht
counting data are objective, since the exchange price (historical cost) at the date of the transaction is presumed to reflect the fair market value of an item at that date.
d. Monetary measurement provides a quantitive means of measuring transac-tions and comparing the results of oper-ations for various reporting entities.
e. The going concern assumption states that, unless there is evidence to the contrary, the entity will continue in oper-ation for the foreseeable future. If the opposite assumption were made—that the entity was about to go out of busi-ness—accountants would record liquida-tion values on the books of the entity.

18 Chapter 2
PRACTICE EXERCISES
PE 2–1 (LO1) Total Assets
Computation of total assets:Cash............................................................................. $ 800Accounts receivable.................................................. 1,000Inventory..................................................................... 3,500Equipment................................................................... 10,000 Total assets................................................................. $15,300
PE 2–2 (LO1) Total Liabilities
Computation of total liabilities:Accounts payable....................................................... $ 900Wages payable........................................................... 500Loan payable.............................................................. 9,000 Total liabilities............................................................ $10,400
PE 2–3 (LO1) Total Owners’ Equity
Computation of total owners’ equity:Capital stock............................................................... $1,500Retained earnings...................................................... 3,400 Total owners’ equity................................................... $4,900
Refer to the solutions for PE 2–1, 2–2, and 2–3. To confirm the accuracy of the solutions, we can verify assets are equal to liabilities plus owners’ equity:
Total assets................................................................. $15,300Total liabilities............................................................ $10,400Total owners’ equity................................................... 4,900 Total liabilities and owners’ equity........................... $15,300
PE 2–4 (LO1) The Accounting Equation
Case A $10,000 – $4,000 = $6,000 Owners’ equityCase B $8,000 – $3,500 = $4,500 LiabilitiesCase C $5,500 + $7,000 = $12,500 AssetsCase D $13,000 – $15,000 = ($2,000) Owners’ equity
Note that in this case, total owners’ equity is negative because liabilities are greater than assets.

PE 2–5 (LO1) Balance Sheet
AssetsCash............................................................................. $ 800Accounts receivable.................................................. 1,000Inventory..................................................................... 3,500Equipment................................................................... 10,000 Total assets................................................................. $15,300
LiabilitiesAccounts payable....................................................... $ 900Wages payable........................................................... 500Loan payable.............................................................. 9,000 Total liabilities............................................................ $10,400
Owners’ EquityCapital stock............................................................... $ 1,500Retained earnings...................................................... 3,400 Total owners’ equity................................................... $ 4,900 Total liabilities and owners’ equity........................... $15,300
PE 2–6 (LO1) Current Assets
Computation of total current assets:Cash............................................................................. $ 625Accounts receivable.................................................. 800Inventory..................................................................... 2,100 Total current assets................................................... $3,525
PE 2–7 (LO1) Current Liabilities
Computation of total current liabilities:Accounts payable....................................................... $700Loan payable (due in 6 months)............................... 250 Total current assets................................................... $950For simplicity, the entire $10,000 amount of the mortgage payable is assumed to be a long-term liability. However, if monthly payments are to be made on the mortgage during the next year, some part of the liability is current. This portion might be labeled as “current portion of mortgage payable.”

20 Chapter 2
PE 2–8 (LO1) Book Value and Market Value of Equity
1. Book value of equity: Assets = Liabilities + Owners’ Equity
Case A $ 10,000 $ 4,000 $ 6,000Case B 8,000 7,000 1,000Case C 13,500 5,500 8,000Case D 100,000 150,000 (50,000)
2. Market value of equity:Shares of Stock Price per Market Outstanding Share = Value
Case A 1,000 $15 $15,000Case B 500 10 5,000Case C 300 20 6,000Case D 1,000 7 7,000Cases A and B illustrate the normal case in which the accounting book value understates the actual value of the company. In Case C, the market value is actually less than the book value; this can occur when a company makes unwise investment and operating decisions after the owners have in-vested their money. Case D illustrates that a company can have positive market value even when the book value of equity is negative. Surprisingly, about 5% of publicly-traded U.S. companies have negative equity book val-ues.
PE 2–9 (LO2) Total Revenues
Computation of total revenues:Sales............................................................................ $13,600Consulting revenue.................................................... 2,700Interest revenue.......................................................... 900 Total revenues............................................................ $17,200
PE 2–10 (LO2) Total Expenses
Computation of total expenses:Cost of goods sold..................................................... $10,200Advertising expense.................................................. 2,150 Total expenses........................................................... $12,350

PE 2–11 (LO2) Computation of Net Income
Computation of net income (or net loss): Case A Case B Case C Case D
Sales $ 100,000 $150,000 $70,000 $ 200,000Rent revenue 5,000 1,000 12,000 10,000Cost of goods sold (60,000) (30,000) (60,000) (110,000)Interest expense (18,000 ) (47,000 ) (25,000 ) (31,000 )Net income (loss) $ 27,000 $ 74,000 $ (3,000 ) $ 69,000
PE 2–12 (LO2) Income Statement
Income statement:Sales................................................................. $12,000Expenses:
Cost of goods sold..................................... $7,300Wage expense............................................ 900Interest expense......................................... 1,200Income tax expense................................... 800
Total expenses................................................. 10,200 Net income....................................................... $ 1,800
PE 2–13 (LO2) Computation of Ending Retained Earnings
Computation of ending retained earnings:Case A Case B Case C Case D
Beginning retained earnings $50,000 $15,000 $31,000 $70,000Net income (loss) 5,000 1,000 12,000 (10,000 )
$55,000 $16,000 $43,000 $60,000Less: Dividends 3,000 4,500 2,100 6,000 Ending retained earnings $52,000 $11,500 $40,900 $ 54,000
PE 2–14 (LO2) Expanded Accounting Equation
Case A $23,000 – $11,000 – $4,500 = $7,500 Capital stockCase B $17,500 – $4,500 – $3,600 = $9,400 LiabilitiesCase C $14,000 + $11,000 + $27,000 = $52,000 AssetsCase D $45,000 – $29,000 – $18,000 = ($2,000) Retained earnings
Note that in this case, retained earnings is negative indicating that either the company has reported a cumulative loss over its history or cumulative dividends have exceeded cumulative income.

22 Chapter 2
PE 2–15 (LO3) Computing Cash from Operating Activities
Computation of cash flow from operating activities:Cash collected from customers..................................................... $10,000Cash received from tenants renting part of a building................ 600Cash paid for interest...................................................................... (450)Cash paid for income taxes............................................................ (1,320 )Cash flow from operating activities............................................... $ 8,830
PE 2–16 (LO3) Computing Cash from Investing Activities
Computation of cash flow from investing activities:Cash received from sale of a building........................................... $ 5,600Cash paid to purchase land............................................................ (12,000 )Cash flow used by investing activities.......................................... $ (6,400 )
PE 2–17 (LO3) Computing Cash from Financing Activities
Computation of cash flow from financing activities:Cash paid to repay a loan............................................................... $(1,000)Cash paid for dividends.................................................................. (780)Cash received upon the issuance of new shares of stock.......... 3,000 Cash flow from financing activities............................................... $ 1,220

PE 2–18 (LO3) Preparing a Statement of Cash Flows
Statement of Cash FlowsOPERATING ACTIVITIES:
Cash collected from customers..................................... $10,000Cash received from tenants renting part of a building 600Cash paid for interest...................................................... (450)Cash paid for income taxes............................................ (1,320 )Cash flow from operating activities............................... $ 8,830
INVESTING ACTIVITIES:Cash received from sale of a building........................... $ 5,600Cash paid to purchase land............................................ (12,000 )Cash flow used by investing activities.......................... (6,400)
FINANCING ACTIVITIES:Cash paid to repay a loan............................................... $ (1,000)Cash paid for dividends.................................................. (780)Cash received upon the issuance of new shares of stock 3,000 Cash flow from financing activities............................... 1,220
Net increase in cash............................................................. $ 3,650Cash balance, beginning of year......................................... 2,000 Cash balance, end of year.................................................... $ 5,650
PE 2–19 (LO3) Financial Statement Articulation
Case A Case B Case C Case DCash, beginning $13,000 $15,700C $ 4,200 $22,000Net increase (decrease) in cash 8,200 5,300 (2,600 )E (6,300 )Cash, ending $21,200B $21,000 $ 1,600 $ 15,700 H
Case A Case B Case C Case DBeginning retained earnings $41,000 $ (1,700)D $22,000 $51,000Net income (loss) 18,000 25,000 (5,700 )F (11,000 )
$59,000 $ 23,300 $16,300 $40,000Less: Dividends 6,500 7,300 800 5,000 G
Ending retained earnings $52,500A $ 16,000 $15,500 $ 35,000

24 Chapter 2
EXERCISES
E 2–20 (LO1) Classification of Financial Statement Elements
1. BS/L2. IS3. BS/A4. IS5. BS/A6. BS/A
7. IS8. BS/A9. BS/OE
10. IS11. BS/A12. BS/A
13. BS/L14. BS/L15. BS/A16. IS17. BS/OE18. IS
E 2–21 (LO1) Accounting Equation A B C
Cash.................................................................. $31,000 $ 8,400 $13,000Accounts receivable........................................ 14,000 13,000 16,500Land and buildings......................................... 95,000 42,600 67,000Accounts payable............................................ 15,000 16,000 23,000Mortgage payable............................................ 80,000 31,000 41,500Owners' equity................................................. 45,000 17,000 32,000
E 2–22 (LO1, LO2) Comprehensive Accounting Equation
X Y Z Assets: January 1, 2009.................................. $360 $1,080 $230Liabilities: January 1, 2009............................. 280 460 80Owners' equity: January 1, 2009.................... 80 620 150Assets: December 31, 2009............................ 380 1,240 310Liabilities: December 31, 2009....................... 320 520 90Owners' equity: December 31, 2009.............. 60 720 220Revenues in 2009............................................ 80 216 400Expenses in 2009............................................. 100 116 330

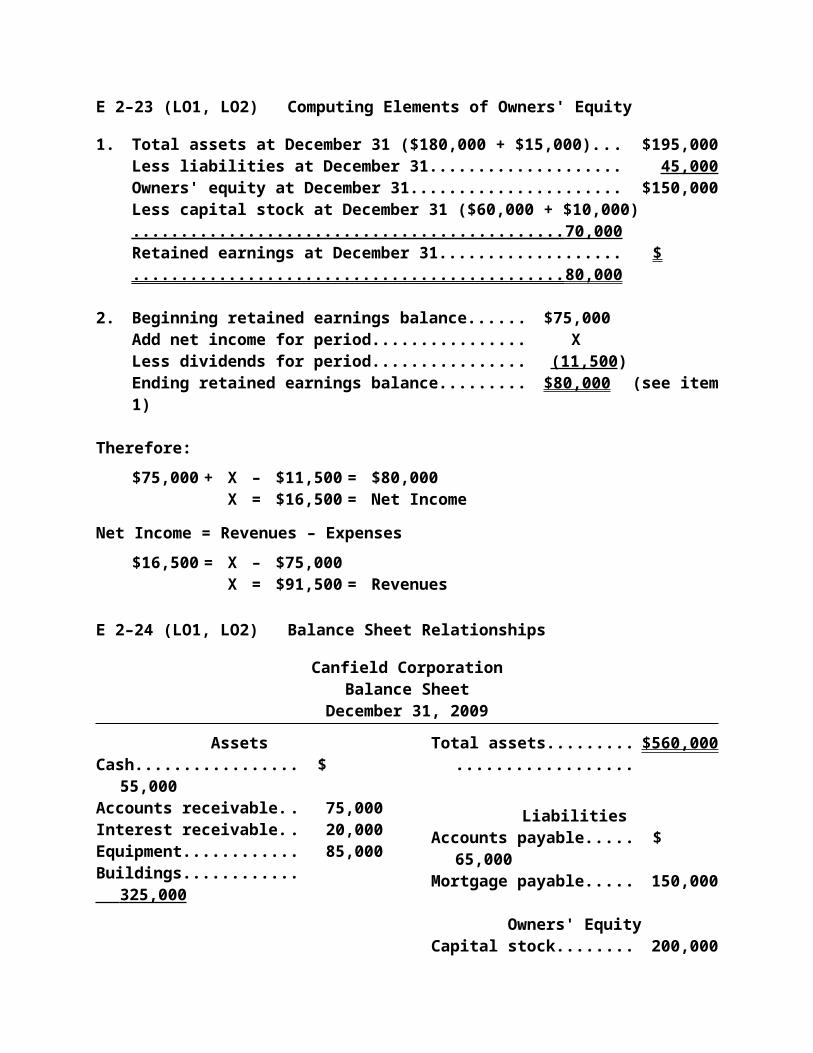
E 2–23 (LO1, LO2) Computing Elements of Owners' Equity
1. Total assets at December 31 ($180,000 + $15,000).......................... $195,000Less liabilities at December 31......................................................... 45,000 Owners' equity at December 31........................................................ $150,000Less capital stock at December 31 ($60,000 + $10,000)................. 70,000 Retained earnings at December 31................................................... $ 80,000
2. Beginning retained earnings balance......................... $75,000Add net income for period........................................... XLess dividends for period............................................ (11,500 )Ending retained earnings balance.............................. $80,000 (see item 1)
Therefore:$75,000 + X – $11,500 = $80,000
X = $16,500 = Net Income
Net Income = Revenues – Expenses$16,500 = X – $75,000
X = $91,500 = Revenues
E 2–24 (LO1, LO2) Balance Sheet Relationships
Canfield CorporationBalance Sheet
December 31, 2009
AssetsCash.................................... $ 55,000Accounts receivable.......... 75,000Interest receivable.............. 20,000Equipment........................... 85,000Buildings............................. 325,000
Total assets........................ $560,000........................................
LiabilitiesAccounts payable.............. $ 65,000Mortgage payable.............. 150,000
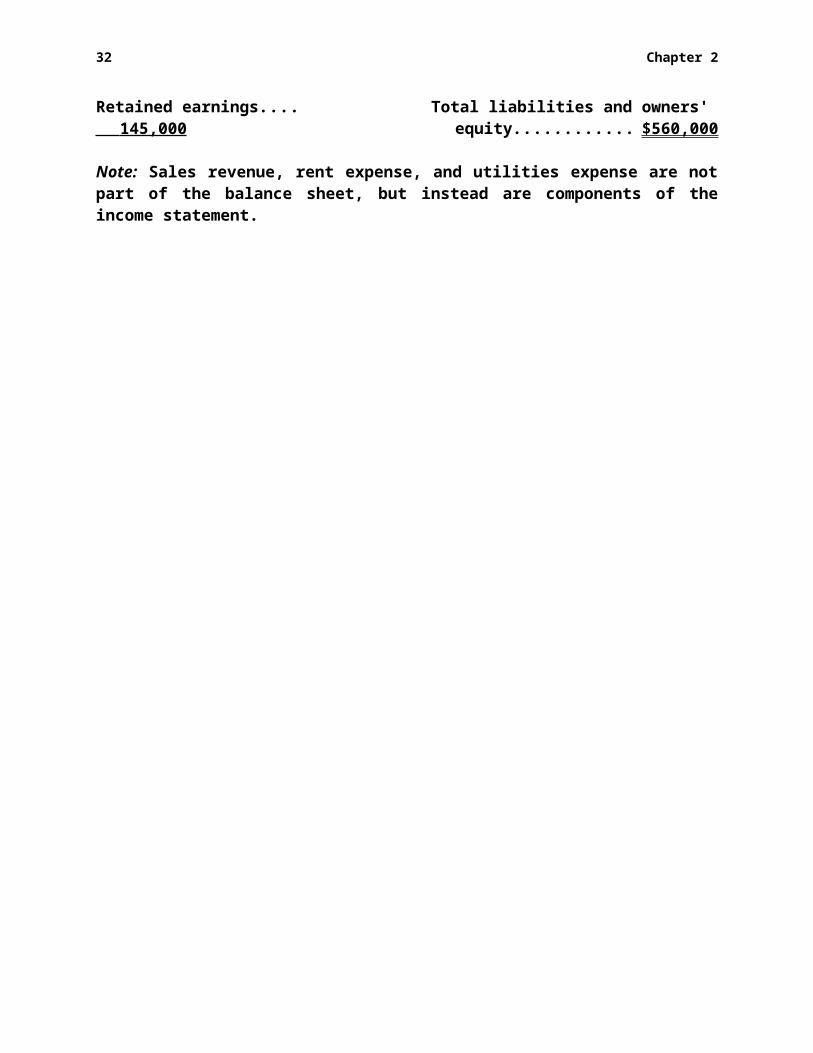
Owners' EquityCapital stock....................... 200,000Retained earnings.............. 145,000 Total liabilities and owners'
equity............................. $560,000
Note: Sales revenue, rent expense, and utilities expense are not part of the bal-ance sheet, but instead are components of the income statement.

26 Chapter 2
E 2–25 (LO1, LO2) Balance Sheet Preparation
Taylorsville Construction CompanyBalance Sheet
December 31, 2009
AssetsCurrent assets:
Cash.................................................................................. $153,600Accounts receivable........................................................ 113,500Supplies............................................................................ 4,250
Total current assets................................................... $271,350
Long-term assets:Land.................................................................................. $ 90,000Buildings.......................................................................... 512,000
Total long-term assets............................................... 602,000 Total assets........................................................................... $873,350
Liabilities and Owners' EquityLiabilities:
Accounts payable............................................................ $ 74,300Mortgage payable............................................................ 423,400
Total liabilities............................................................ $497,700Owners' equity....................................................................... 375,650 *Total liabilities and owners' equity..................................... $873,350
*Computations of Owners' Equity:Owners' equity, January 1, 2009.......................................... $314,300Add net income for 2009...................................................... 109,450
$423,750Less distribution to owners during 2009............................ 48,100 Owners' equity, December 31, 2009.................................... $375,650

E 2–26 (LO2) Income Statement Computations
1. Revenues....................................................................... $175,000Expenses:
Supplies expense.................................................... $45,000Salaries expense...................................................... 70,000Rent expense........................................................... 1,500Administrative expense.......................................... 6,000 122,500
Income before taxes..................................................... $ 52,500
2. Income before taxes..................................................... $ 52,500Income tax rate.............................................................. 30% Income taxes................................................................. $ 15,750
3. Income before taxes..................................................... $ 52,500Income taxes................................................................. 15,750 Net income..................................................................... $ 36,750
4. Earnings per share ($36,750/15,000 shares).............. $ 2.45
E 2–27 (LO2) Income Statement Preparation
1. Pickard and AssociatesIncome Statement
For the Year Ended December 31, 2009
Fees (revenues)............................................................. $476,000Expenses:
Advertising expense .............................................. $14,500Supplies expense.................................................... 31,500Rent expense........................................................... 12,000Utilities expense...................................................... 2,500Miscellaneous expense........................................... 5,100Salaries expense...................................................... 78,000 143,600
Income before taxes..................................................... $332,400Income taxes (30%)....................................................... 99,720 Net income..................................................................... $ 232,680 Earnings per share ($232,680/11,000 shares)............ $ 21.15
2. EPS tells the reader that for every individual share of stock outstanding, Pickard and Associates earned $21.15 during 2009. This helps investors see how profitable their individual investments in Pickard and Associates are.

28 Chapter 2
E 2–28 (LO2) Income and Retained Earnings Relationships
1. Increase in retained earnings............................................................ $375,000Plus dividends paid............................................................................ 135,000 Net income.......................................................................................... $510,000
2. Revenues............................................................................................. $830,000Less net income................................................................................. 510,000 Expenses for the year........................................................................ $320,000
E 2–29 (LO2) Retained Earnings Computations
Retained earnings, December 31, 2008 = $60,000Retained earnings, December 31, 2009 = $75,000
Computations:Revenues in 2009....................................................................................... $ 230,000Expenses in 2009........................................................................................ (190,000 )Net income in 2009..................................................................................... $ 40,000
Assets: December 31, 2008....................................................................... $ 350,000Liabilities: December 31, 2008.................................................................. (80,000 )Owners' equity: December 31, 2008......................................................... $ 270,000
Owners' equity: December 31, 2008......................................................... $ 270,000Capital stock: December 31, 2008............................................................. (210,000 )Retained earnings: December 31, 2008.................................................... $ 60,000
Retained earnings: December 31, 2008.................................................... $ 60,000Add net income for 2009 ($230,000 – $190,000)...................................... 40,000Deduct dividends for 2009......................................................................... (25,000 )Retained earnings: December 31, 2009.................................................... $ 75,000

E 2–30 (LO2) Preparation of Income Statement and Retained Earnings Statement
Big Sky Corporation Income Statement
For the Year Ended June 30, 2009
Ski rental revenue...................................................... $77,900Expenses:
Rent expense......................................................... $ 6,000Salaries expense................................................... 38,600Utilities expense.................................................... 2,400Advertising expense............................................. 7,500Miscellaneous expense........................................ 7,700 62,200
Income before taxes................................................... $15,700Income taxes............................................................... 2,100 Net income.................................................................. $13,600Earnings per share ($13,600/1,500 shares).............. $ 9.07 (rounded)
Big Sky Corporation Statement of Retained Earnings
For the Year Ended June 30, 2009
Retained earnings, July 1, 2008................................................................ $76,800Add net income for the year...................................................................... 13,600
$90,400Less dividends............................................................................................ 6,500 Retained earnings, June 30, 2009............................................................. $83,900
E 2–31 (LO2) Articulation: Relationships between a Balance Sheet and anIncome Statement
1. Assets (increased $64,000) = Liabilities (increased $16,000) + Owners' equity (increased $48,000). If owners' equity increased by $48,000 and dividends of $12,100 were paid, net income must have been $48,000 + $12,100, or $60,100.
2. Assets (increased $64,000) = Liabilities (increased $16,000) + Owners' equity (increased $48,000). If owners' equity increased $48,000 and $18,000 of this was the result of additional issuance of stock, net income must have been $48,000 – $18,000, or $30,000.
3. Again, if owners' equity increased by $48,000 but additional stock was is-sued for $72,000 and dividends of $12,400 were paid, then the net loss must have been $48,000 – $72,000 + $12,400, or ($11,600).
30 Chapter 2
E 2–32 (LO3) Cash Flow Computations
1. Cash receipts from:Customers................................................................ $ 270,000
Cash payments for:Wages....................................................................... $ 82,000Utilities...................................................................... 3,000Advertising............................................................... 4,000Rent........................................................................... 36,000Taxes......................................................................... 67,000 192,000
Net cash provided by operating activities.................. $ 78,000
2. Cash receipts from sale of building............................ $ 90,000Cash payments for purchase of land.......................... (106,000 )Net cash used by investing activities......................... $ (16,000 )
3. Cash receipts from:Investments by owners........................................... $ 54,000Bank loan.................................................................. 60,000 $ 114,000
Cash payments for:Dividends.................................................................. $ 20,000Repayment of principal on loan............................. 40,000 60,000
Net cash provided by financing activities.................. $ 54,000
4. Cash flows from operating activities.......................... $ 78,000Cash flows from investing activities........................... (16,000)Cash flows from financing activities........................... 54,000 Net increase in cash..................................................... $116,000
5. Cash balance at beginning of year............................. $386,000Net increase in cash during the year.......................... 116,000 Cash balance at the end of the year........................... $502,000
E 2–33 (LO3) Cash Flow Classifications
a. OAb. OAc. FAd. IAe. FAf. FAg. OAh. OAi. OAj. IA
E 2–34 (LO4) Notes to Financial Statements
The notes to financial statements are very important because they explain how a company has prepared its financial statements and also clarify specific items that need more detail. The first section of its notes to financial statements is enti-tled “Summary of Significant Accounting Policies.” The second section gives ad-ditional information regarding long-term debt, financial instruments, income taxes, and other items. This section explains how Wal-Mart came up with the to-tals given earlier in its financial statements. The third section examines Wal-Mart's stock and employee stock and savings plans. The last section of the notes to financial statements details segment information for Wal-Mart, as well as unaudited quarterly information.
E 2–35 (LO6) The Cost Principle
The property purchased by Save-More Construction Company on January 1, 2009, should be recorded at $150,000, the amount of cash paid for the property. This assumes that the land was purchased in an arm's-length transaction. The amount reported at year-end, after the rezoning decision, would still be $150,000—the historical cost, or exchange price, at the date of the transaction. The histor-ical cost provides an objective measure of value in accounting measurements. The increased value of the land would be recognized later, when the land is sold in another arm's-length transaction.
E 2–36 (LO6) The Monetary Measurement Concept
Accounting records report only those transactions and events that can be mea-sured in dollars. Some items are not measurable in monetary terms and therefore are not reported on financial statements. There can be little doubt that good em-ployees add great value to a business enterprise. However, measuring that value is very difficult, and it is the main reason why that information is not reported on a balance sheet.
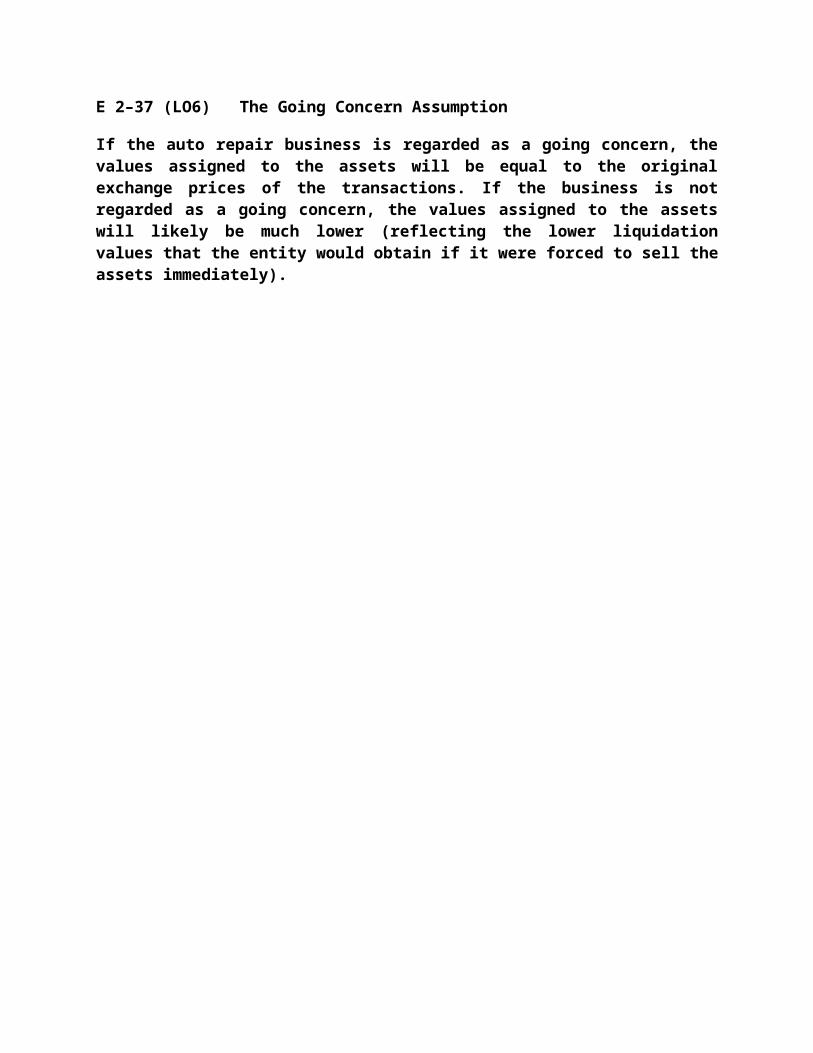
E 2–37 (LO6) The Going Concern Assumption
If the auto repair business is regarded as a going concern, the values assigned to the assets will be equal to the original exchange prices of the transactions. If the business is not regarded as a going concern, the values assigned to the as-sets will likely be much lower (reflecting the lower liquidation values that the en-tity would obtain if it were forced to sell the assets immediately).

32 Chapter 2
PROBLEMS
P 2–38 (LO1) Balance Sheet Classifications and Relationships
1. Cash..................................................................................................... $71,000*Accounts receivable........................................................................... 119,000Inventory............................................................................................. 72,000
Total current assets...................................................................... $262,000
*Computations:Total liabilities plus stockholders' equity = Total current liabilities ($199,000) + Long-term liabilities ($253,000) + Total stockholders' equity ($386,000) = $838,000.Total current assets ($262,000) = Total assets ($838,000) – Total long-term assets ($576,000).Cash ($71,000) = Total current assets ($262,000) – Accounts receivable ($119,000) – Inventory ($72,000).
2. Land..................................................................................................... $136,000Building............................................................................................... 225,000Equipment........................................................................................... 215,000
Total long-term assets.................................................................. $576,000
3. Accounts payable............................................................................... $101,000Notes payable (short-term)................................................................ 98,000
Total current liabilities.................................................................. $ 199,000
4. Mortgage payable (Total long-term liabilities)................................. $253,000
5. Capital stock....................................................................................... $200,000Retained earnings.............................................................................. 186,000
Total stockholders' equity............................................................ $386,000

P 2–39 (LO1, LO2) Preparation of a Classified Balance Sheet
1. Siraco CompanyBalance Sheet
December 31, 2009
AssetsCurrent assets:
Cash.......................................................................... $ 1,950Accounts receivable................................................ 2,500Supplies.................................................................... 1,800
Total current assets........................................... $ 6,250Long-term assets:
Equipment................................................................ $11,275Total long-term assets....................................... 11,275
Total assets................................................................... $17,525
Liabilities and Owners' EquityCurrent liabilities:
Accounts payable.................................................... $ 3,450Wages payable ........................................................ 250
Total current liabilities....................................... $ 3,700Owners' equity:
Capital stock............................................................ $ 775Retained earnings................................................... 13,050 *
Total owners' equity........................................... 13,825 Total liabilities and owners' equity............................. $17,525*Retained Earnings as of December 31, 2009, is equal to the January 1, 2009, Retained Earnings balance plus net income, less dividends paid for 2009.
Beginning retained earnings............................................................. $12,000Net income (see following calculation)............................................ 2,550Dividends paid.................................................................................... (1,500 )Ending retained earnings.................................................................. $13,050
During 2009, Siraco earned $2,550, as shown below.Revenues............................................................................................. $10,000Expenses:
Wages expense........................................................ $2,200Supplies expense.................................................... 3,700Miscellaneous expense........................................... 1,550 7,450
Net income..................................................................... $ 2,550

34 Chapter 2
P 2–39 (LO1, LO2) (Concluded)
2. The decision to pay dividends was probably a reasonable one. The earnings were positive, and sufficient cash was available to cover the amount of divi-dends paid.
P 2–40 (LO1) Balance Sheet Preparation with a Missing Element
1. Schubert Products Inc.Balance Sheet
December 31, 2009
AssetsCash............................................................................... $ 7,500Accounts receivable..................................................... 20,000Supplies......................................................................... 2,000Building.......................................................................... 49,500Land............................................................................... 20,000
Total assets.............................................................. $99,000
Liabilities and Owners' EquityLiabilities:
Accounts payable.................................................... $24,000
Owners' equity:Capital stock............................................................ $42,000Retained earnings................................................... 33,000 * 75,000
Total liabilities and owners' equity............................. $99,000
*2. Assets – Liabilities = Owners' equity – Capital stock = Retained earnings$99,000 – $24,000 = $75,000 – $42,000 = $33,000
3. The balance sheet is a depiction of the accounting equation because it shows total assets being equal to total liabilities and owners' equity. Thus, A = L + OE, as shown on each balance sheet.

P 2–41 (LO2) Income Statement Preparation
1. Rulon Candies, Inc.Comparative Income Statement
For the Years Ended December 31, 2009 and 2008
2009 2008 Sales............................................................................... $300,000 $350,000Cost of goods sold....................................................... 115,000 85,000 Gross margin................................................................. $185,000 $265,000Operating expenses:
Employee salaries................................................... $115,000 $110,000Advertising expenses............................................. 10,000 20,000Utilities expenses.................................................... 15,000 8,500
Total operating expenses............................................. $140,000 $138,500
Operating income.......................................................... $ 45,000 $126,500Interest revenue....................................................... 10,000 10,000Interest expense...................................................... (25,000 ) (15,000 )
Income before taxes..................................................... $ 30,000 $121,500Income tax expense................................................ 9,000 36,500
Net income..................................................................... $ 21,000 $ 85,000 Earnings per share........................................................ $ 5.25 $ 21.25
2. From just the limited information on the income statements, the following recommendations could be made to improve profitability for the year 2010: Increase sales. Sales dropped by nearly 15% from 2008 to 2009. Reduce cost of goods sold if possible. Cost of goods sold per dollar of net
revenues increased 58% from $0.24 in 2008 to $0.38 in 2009. Why did employee salaries increase when both revenues and profits sig-
nificantly decreased? Instead of increasing salaries in 2010, give bonus incentives to employees for reaching sales and cost-saving goals.
Expenditures for advertising decreased 50% from 2008 to 2009. The de-crease in advertising may have caused the lower sales volume. In-crease advertising expenditures in the year 2010.
Interest expense increased from $15,000 in 2008 to $25,000 in 2009, a 67% increase. Did Rulon borrow a large amount in 2009? It may be a good idea to repay some loans and increase owner investment.

36 Chapter 2
P 2–42 (LO2) Income Statement Preparation
Wadley’s Car WashIncome Statement
For the Year Ended December 31, 2009
Service revenues............................................. $210,000Expenses:
Rent expense.............................................. $ 6,000Salaries expense........................................ 41,000Utilities expense......................................... 4,300Supplies expense....................................... 10,300Miscellaneous expense............................. 970 62,570
Income before taxes........................................ $147,430Income taxes.................................................... 45,000 Net income....................................................... $ 102,430 Earnings per share ($102,430/3,000 shares). $ 34.14 (rounded)
P 2–43 (LO1, LO2) Expanded Accounting Equation
1. Compute net increase in assets:Cash..................................................................................................... $ 12,500Interest receivable.............................................................................. (7,500)Inventory............................................................................................. 50,000Accounts receivable........................................................................... (11,750)Building............................................................................................... 157,500
Net increase in assets.................................................................. $200,750
2. Compute net increase in liabilities:Accounts payable............................................................................... $ 22,500Mortgage payable............................................................................... 137,500Wages payable.................................................................................... (35,250 )
Net increase in liabilities.............................................................. $124,750
3. Figure overall increase in owners' equity from net increases in assets and li -abilities:Net increase in assets........................................................................ $200,750Less: Net increase in liabilities......................................................... 124,750
Net increase in owners' equity.................................................... $ 76,000

P 2–43 (LO1, LO2) (Concluded)
4. Compute known net increase in owners' equity:Capital stock....................................................................................... $ 26,250Retained earnings (dividends paid).................................................. (25,000 )
Known net increase in owners' equity........................................ $ 1,250
5. Net increase of $76,000 in owners' equity resulted from changes in (1) the known net increase in owners' equity and (2) net income. Thus, net income can be figured by:Overall net increase in owners' equity............................................. $ 76,000Less: Known net increase in owners' equity................................... (1,250 )
Net income for 2009...................................................................... $ 74,750
P 2–44 (LO2) Income Statement Preparation
1. Precision CorporationIncome Statement
For the Year Ended December 31, 2009
Sales revenue................................................................ $68,000Expenses:
Advertising expense............................................... $ 1,530Delivery expense..................................................... 480Packaging expense................................................. 355Salaries expense...................................................... 18,350Supplies expense.................................................... 8,410 29,125
Income before taxes..................................................... $38,875Income taxes................................................................. 4,360 Net income..................................................................... $34,515Earnings per share........................................................ $ 3.45
2. 10,000 shares
*Rounded

38 Chapter 2
P 2–45 (LO2) Net Income
1. Streuling CompanyIncome Statement
For the Year Ended May 31, 2009
Consulting fees................................................ $115,100Expenses:
Advertising expense.................................. $ 2,760Supplies expense....................................... 37,820Rent expense.............................................. 1,500Salaries expense........................................ 18,150Miscellaneous expense............................. 4,170Administrative expense............................. 7,250 71,650
Income before taxes........................................ $ 43,450Income taxes.................................................... 21,180 Net income....................................................... $ 22,270 Earnings per share ($22,270/3,000 shares)... $ 7.42 (rounded)
2. If Streuling Company had a loss, it may or may not be a good idea to pay dividends. It would depend on the amount of cash available, whether the loss is considered only a temporary situation, and the expectations of the shareholders. Many large companies do continue to pay dividends, even though they have a loss, in order to satisfy both perceived and real share-holder expectations.
P 2–46 (LO2) Net Income and Statement of Retained Earnings
1. Quincy CompanyIncome Statement
For the Year Ended May 31, 2009
Consulting fees................................................ $176,400Expenses:
Advertising expense.................................. $ 4,650Supplies expense....................................... 38,410Rent expense.............................................. 2,400Salaries expense........................................ 25,340Miscellaneous expense............................. 10,200Administrative expense............................. 13,900 94,900
Income before taxes........................................ $ 81,500Income taxes.................................................... 20,760 Net income....................................................... $ 60,740 Earnings per share ($60,740/8,000 shares)... $ 7.59 (rounded)

P 2–46 (LO2) (Concluded)
2. Quincy CompanyStatement of Retained EarningsFor the Year Ended May 31, 2009
Retained earnings, June 1, 2008....................................................... $175,670Add net income for the year.............................................................. 60,740
$236,410Less dividends.................................................................................... 19,500 Retained earnings, May 31, 2009...................................................... $216,910
3. Quincy CompanyStatement of Retained EarningsFor the Year Ended May 31, 2009
Retained earnings, June 1, 2008................................. $175,670Less: Net loss for year............................................... $38,000
Dividends......................................................... 19,500 57,500 Retained earnings, May 31, 2009................................. $118,170
4. If Quincy Company had a loss, as in (3) above, it may or may not be a good idea to pay dividends. It would depend on the amount of cash available, whether the loss is considered only a temporary situation, and the expecta-tions of the shareholders. Many large companies do continue to pay divi -dends, even though they have a loss, in order to satisfy both perceived and real shareholder expectations.
P 2–47 (LO1, LO2) Comprehensive Financial Statement Preparation
1. Wilcox, Inc.Income Statement
For the Year Ended December 31, 2009
Revenues....................................................................... $389,950Expenses:
Salaries expense...................................................... $125,350Utilities expense...................................................... 5,250Supplies expense.................................................... 110,600Rent expense........................................................... 21,200Other expenses........................................................ 11,250 273,650
Income before taxes..................................................... $116,300Income taxes................................................................. 35,000 Net income..................................................................... $ 81,300 Earnings per share ($81,300/2,000 shares)................ $ 40.65

40 Chapter 2
P 2–47 (LO1, LO2) (Concluded)
2. Wilcox, Inc.Balance Sheet
December 31, 2009
AssetsCurrent assets:
Cash.......................................................................... $ 61,100*Accounts receivable................................................ 90,000Supplies.................................................................... 72,500
Total current assets........................................... $223,600Long-term assets:
Land.......................................................................... $ 42,500Buildings.................................................................. 197,550
Total long-term assets....................................... 240,050 Total assets................................................................... $463,650
Liabilities and Owners' EquityCurrent liabilities:
Accounts payable.................................................... $ 38,050Long-term liabilities:
Notes payable.......................................................... 63,800 Total liabilities.................................................... $101,850
Owners' equity:Capital stock............................................................ $ 65,000Retained earnings................................................... 296,800 *
Total owners' equity........................................... 361,800 Total liabilities and owners' equity............................. $463,650
*Computations:Retained earnings, December 31, 2009 ($296,800) = Retained earnings, Janu-ary 1, 2009 ($311,000) + Net income ($81,300) – Dividends ($95,500)Total current assets ($223,600) = Total assets ($463,650) – Total long-term assets ($240,050)Cash ($61,100) = Total current assets ($223,600) – Accounts receivable ($90,000) – Supplies ($72,500)
3. The company has been profitable over the past several years, even though more was paid out in dividends this year than was earned. The company ap-parently has retained most of the past years' earnings in the business.

P 2–48 (LO1, LO2) Elements of Comparative Financial Statements
1. Utilities expense................................................................................. $ 5,700Salaries and commissions expense................................................. 38,700Miscellaneous expenses................................................................... 2,200Income tax expense........................................................................... 4,500
Total expenses.............................................................................. $51,100
2. Retained earnings, December 31, 2009............................................ $35,000Less retained earnings, December 31, 2008.................................... 18,000 Net increase for 2009......................................................................... $
17,000Add dividends paid............................................................................ 8,000 Net income for 2009........................................................................... $25,000
3. Total expenses (item 1)...................................................................... $51,100Add net income (item 2)..................................................................... 25,000 Total revenue...................................................................................... $76,100
4. Comparative financial statements enable users to compare operating results and the financial position of the company for more than one year. Often, trends in a company's financial position are more important than absolute figures.
42 Chapter 2
P 2–49 (LO3) Statement of Cash Flows
1. Pratt & Jordan Development, Inc.Statement of Cash Flows
For the Year Ended December 31, 2009
Cash Flows from Operating ActivitiesCash inflows from:
Customer sales................................................... $ 750,000Cash outflows from:
Payment of operating expenses....................... $ 215,000Payment of wages and salaries........................ 135,000Payment of taxes................................................ 43,000Other expenses.................................................. 32,000 425,000
Net cash provided by operating activities............ $ 325,000
Cash Flows from Investing ActivitiesInvestments in securities.................................. $(245,000)
Net cash used by investing activities.................... (245,000)
Cash Flows from Financing ActivitiesProceeds from land loans................................. $ 75,000Payment of building loan.................................. (50,000)Distributions to owners..................................... (60,000 )
Net cash used by financing activities................... (35,000 )
Net increase in cash..................................................... $ 45,000Cash at beginning of year............................................ 130,000 Cash at end of year....................................................... $ 175,000
2. Yes, Pratt & Jordan Development, Inc., appears to be in good shape from a cash flow standpoint. It generated $325,000 in cash flows from operating ac-tivities, which was used for investing and financing activities. Pratt & Jordan Development, Inc., was able to distribute an amount to its owners and still add $45,000 toward its end-of-year cash balance. It would help to have com-parative statements of cash flows, as well as the other financial statements, to see the trends and relationships of the information.

P 2–50 (LO3) Statement of Cash Flows
Esplin EnterprisesStatement of Cash Flows
For the Year Ended December 31, 2009
Cash Flows from Operating Activities Cash receipts from:
Services....................................................................... $2,214,000Cash payments for:
Operating expenses................................................... $1,735,000Taxes........................................................................... 207,000 1,942,000
Net cash provided by operating activities.......................... $ 272,000
Cash Flows from Investing ActivitiesCash receipts from sale of land..................................... $ 194,000Cash payment to purchase building.............................. (352,000 )
Net cash used by investing activities................................. (158,000)
Cash Flows from Financing ActivitiesCash receipts from investments by owners................. $ 93,000Cash payments for distributions to owners................. (68,000 )
Net cash provided by financing activities.......................... 25,000
Net increase in cash............................................................. $ 139,000Cash at beginning of year.................................................... 676,000 *Cash at end of year............................................................... $ 815,000
*X + $139,000 = $815,000X = $676,000

44 Chapter 2
ANALYTICAL ASSIGNMENTS
AA 2–51 Creditor and Investor Information Needs
Discussion
As the bank's loan officer, you would want to see comparative balance sheets, income statements, and statements of cash flows. The profitability of a company is a major factor in determining whether a com-pany will have sufficient future cash flows to repay its loans as well as to pay the interest on those loans. In analyzing the liquidity, solvency, and overall financial position of the company, you also would be inter-ested in the relationships disclosed on the balance sheet and the cash flow statement.
As a potential investor, you would want to determine Ink Spot's cash flow position and its operating prof -itability during its first two years of existence. These factors will affect the value of the company's stock (and therefore its resale value) as well as the company's ability to pay dividends to its stockholders.
AA 2–52 Analyzing Trends and Key Financial Relationships
Discussion
Net income and earnings per share (EPS) increased in 2008 and again in 2009. The cause of this in-crease, however, was the reduction in selling and advertising expenses. Revenues actually decreased during the three-year period. Revenues in 2008 were approximately 3% less than in 2007. In 2009 there was a further decline of more than 8%. Another significant trend was the increase in interest expense.
A potential investor would be very concerned about the declining revenues and the increasing interest ex-pense. The increase in interest expense from 2007 to 2009 could indicate that the company has been forced to rely more and more on borrowed funds to meet its operating expenses. Also, the significant de-crease in selling and advertising expenses suggests that the company may be cutting back on sales staff and promotional efforts in an attempt to show increasing income and EPS. Administrative and other ex-penses have remained fairly stable, indicating that they are relatively “fixed'' costs. Future decreases in selling and advertising expenses may accelerate the downward trend in revenues.
This case illustrates the danger in looking only at the “bottom line'' results, such as net income and EPS.
In addition to the income statement data presented, a prospective investor would want to analyze com-parative balance sheet and cash flow data. The balance sheet and statement of cash flows, combined with the notes to the financial statements and the independent auditor's report, would help the investor determine the significance of the trends reflected in the income statement. This information considered collectively provides the basis for an informed investment decision.
AA 2–53 How Many Accounting Equations Are There?
Discussion
Congratulations to your friend for remembering a few important terms from his accounting class. How-ever, you might want to ask your friend what grade he got in the class because his “equations” are all wrong. His mistakes are as follows:
Revenues = Assets. It is common for introductory students to mistakenly think that revenues and assets are one and the same thing. Assets are items of value owned or controlled by a company. Those assets can arise from a number of sources—the cash to buy the assets can be borrowed, can be invested, or can be generated through business operations. When describing the source of assets, “revenue” is the

AA 2–53 (Concluded)
label given to the source of assets that are generated through business operations, just as “loan payable” is the label used when the source of assets is a bank loan and “paid-in capital” is the label used when the source of the assets is owner investment.
Net Income = Cash from Operating Activities. As explained in the chapter, accountants make many ad-justments, assumptions, and estimates in the computation of net income. These adjustments are made in order to convert the raw cash from operating activities number, computed simply as the difference be-tween cash inflows and cash outflows from operating activities, into a better measure of the company’s economic performance, net income.
Retained Earnings = Cash. Net income represents the amount of assets generated through profitable op-erations. Some of these assets are used to pay dividends to investors. The difference between the as-sets generated (net income) and the assets paid out to investors (dividends) is called retained earnings. Once these excess assets are generated, they can be converted into any form the company desires. They can be turned into cash in order to increase the cash balance. They can be turned into inventory, into land, or into buildings. The point is that there is no reason to think that all of a company’s retained earnings will be used to increase the company’s cash balance.
AA 2–54 Can Financial Statement Information Be Used to Successfully Pick Stocks?
Discussion
This is an extremely controversial question. For some stock traders, the answer is unequivocally “yes.” These stock traders believe in the usefulness of fundamental analysis which involves using existing infor-mation, including financial statement information, to determine the fundamental underlying value of a company. Using this approach, if a stock’s current price is below its computed fundamental value, then shares of that stock should be purchased.
An alternate view is based on the belief in an efficient market. In an efficient stock market, stock prices respond very quickly (within a few minutes or hours) to any information contained in a company’s finan-cial statements. This means that potential investors who come along a week or a month later cannot use those financial statements to identify winning and losing stocks because stock prices have already moved to reflect the financial statement information. For example, it seems foolish to think that an investor can use the fact that Wal-Mart’s net income, announced six weeks ago, had increased 25% over the preced-ing year in order to predict that Wal-Mart’s stock price will jump in the future. Any jump that was going to occur would have occurred six weeks ago when the big-money investors in New York City first got the news about the net income increase.
Some academic research has indicated that financial models using accounting information can be used to identify, in advance, winning and losing stocks. However, one must have a little skepticism about these models because we typically don’t observe accounting professors getting rich on their ability to pick stocks.
AA 2–55 Who Audits American Companies?
Discussion
Your sister is completely correct about the importance of financial statement reliability to the ability of U.S. companies to compete in the global marketplace. However, she is mistaken about who pays audit

46 Chapter 2
fees. Auditors are not hired by the U.S. federal government; instead, each company chooses and pays its own

AA 2–55 (Concluded)
auditor. As explained in the chapter, this market for auditors works because auditors want to maintain their reputations and because they want to avoid lawsuits.
As explained in the chapter, the Sarbanes-Oxley Act of 2002 increased the federal government oversight of the auditing profession. However, auditors are still hired and paid by the companies they audit, not by the federal government.
AA 2–56 Accounting for the Proper Entity
Discussion
You would need to explain to Mr. Masters that the financial reports you have been asked to prepare are for the company, which is a separate and distinct reporting entity. Mixing personal and business transac-tions will not accurately reflect the financial results of the business. The payments should be classified as personal expenses, not business expenses.
The entity concept of reporting is an important consideration in this situation. Of equal or greater impor-tance is the fact that deducting personal expenditures on the tax return as business expenses is not only improper, but illegal. You should encourage Mr. Masters to do what is right, not what he might get away with. If he insists on including the payments as business expenses, you should decline to provide further services for him.
AA 2–57 You Decide: What is the most important number in the financial statements—net income or EPS?
Judgment Call
Issues to be discussed are:
1. There is an almost fixated focus on EPS these days. And, instead of annual EPS, the focus seems to be on quarterly EPS and whether or not the company has met Wall Street’s estimate of the EPS.
2. EPS is only a summary of much more information. Sometimes, focusing on EPS doesn’t allow you to see why things changed the way they did.
3. Net income by itself isn’t much more useful than EPS because it is a net number that, when looked at alone, obscures the reasons why it increased or decreased.
4. The best thing to do is to study the detail of the income statement (and the other financial state-ments) and not just look at one number. It is only when you have a complete financial picture by look-ing at all the financial statements and the way and reasons they changed that you really understand what went on.
AA 2–58 You Decide: Is the cash flow statement necessary?
Judgment Call
Issues to be discussed are:
1. Many companies focus on EBITDA these days and pay much more attention to EBITDA than to cash flows.

48 Chapter 2
AA 2–58 (Concluded)
2. Most of the information on the statement of cash flows can be derived from looking at successive bal -ance sheets and income statements, although it is much harder to obtain.
3. In the end, it is cash flows, much more than earnings or EBITDA, that really matters. If a company doesn’t have sufficient cash, it cannot pay its obligations and will have liquidity problems.
4. It is important to see how much of cash flows comes from the three activities of operations, financing, and investments.
5. EBITDA is often used as a surrogate for cash flows. It adjusts earnings for depreciation and amorti -zation, which is also done on the statement of cash flows.
AA 2–59 You Decide: Should Wall Street place so much importance on the EPS figure or not?
Judgment Call
Issues to be discussed are:
1. There is a huge penalty for missing expected EPS. The stock market is built and based on expecta-tions. When those expectations are not met, it often doesn’t matter by how much. Rather, the “bad news” often results in a stock price dropping considerably.
2. It is the EPS number that Wall Street focuses on—usually quarterly EPS.
3. If she diversifies enough, unless the entire market drops, the stocks that go up should compensate for the stocks that go down. In fact, in a market where gains are unlimited and losses are limited (by the amount of the investment), in a portfolio, often one or two stocks increase enough to more than compensate for all the losers.
4. People care about EPS because it is a nice, easy-to-understand summary of the financial statements and the performance of a company.
AA 2–60 You Decide: Are the notes to the financial statements necessary?
Judgment Call
Issues to be discussed are:
1. It is impossible to completely understand the financial statements without reading and understanding the notes. There are many estimates and assumptions involved in preparing financial statements and those estimates and assumptions must be explained in the notes.
2. The notes also provide additional detail that helps explain many of the changes in the financial state-ments from year to year.
3. The notes help readers understand the risk posture of the company—is it using aggressive account-ing principles or conservative accounting principles?
4. Without notes, it would be difficult to know whether or not GAAP is being followed.

AA 2–61 Wal-Mart
Real Company Analysis
1. On January 31, 2006, Wal-Mart had $6.414 billion in cash and cash equivalents. This amount com-prised 4.6% of Wal-Mart's total assets. Wal-Mart had $31.024 billion in long-term debt, including the current portion. Wal-Mart typically has a large amount of long-term debt because of the large amount of property it finances.
2. Revenues increased 9.5% [($312,427 – $285,222)/$285,222] over the previous year. Compared to the prior year, when sales increased by 11.3%, the company's rate of increase in sales has de-creased slightly.
3. Wal-Mart paid a dividend of $2.511 billion in 2005. Wal-Mart both issued shares under its stock option plan and purchased shares of its own stock in 2005. The amount of stock repurchased ($3,580) dur -ing the year exceeded the amount of stock issued under its stock option plan during the year ($276).
4. Wal-Mart generates most of its cash from operations. The company uses that cash to repurchase its own stock, pay dividends, make long-term debt payments, invest in other companies, and invest in other operating assets like property and equipment.
AA 2–62 Safeway
Real Company Analysis
1. Current assets as a percentage of total assets increased slightly from 23.4% in 2004 to 23.5% in 2005. The primary reason for the increase was a slight increase in all of the current asset accounts.
2. The gross profit ratio was slightly higher for 2004 (29.6% vs. 28.9%). The slight increase indicates that groceries (and other products sold by Safeway) were being sold with a slightly higher margin in 2004.
3. For 2005, Safeway generated more cash from operations than was spent through investing activities ($1.9 billion from operations compared to $1.3 billion spent relating to investing). Safeway borrowed $0.8 billion in long-term financing and paid $1.2 billion to reduce the company’s long-term debt. It would be reasonable to expect that Safeway’s long-term debt decreased during the year.
AA 2–63 Diageo
International
1. The first major difference students should notice on Diageo's balance sheet is the listing of fixed as-sets first. Most companies in the United States list current assets first and fixed assets second. An-other thing students will notice is that there is no easy way to conclude that the balance sheet does balance. As indicated in the next question, there is no total for assets or for liabilities and stockhold-ers' equity.
2. Diageo does not provide a number indicating total assets. The company nets current assets and lia -bilities and then adds that net figure to its fixed assets. In the United States, a number indicating total assets is always provided.
3. Companies around the world use different terms than we might be accustomed to, but we can un-ravel the meaning of the words. For example, stocks is included in the current assets section. The most common current assets include cash, inventory, and accounts receivable. By a process of elimi-nation we can conclude that Stocks means Inventory. Likewise, Debtors represents Accounts Receiv-able. Called-up Share Capital is the same as Common Stock, and Profit and Loss Account is the English equivalent of Retained Earnings.

50 Chapter 2
AA 2–64 Violating a Covenant
Ethics
There are many ways to change the current ratio. Some of them have a legitimate business purpose and some don't. For example, selling a product or service at a profit will cause the current ratio to increase, as will selling equipment. The difference is that selling a product or service is a long-term solution to the cur -rent problem, while selling equipment that the company will need is a short-term solution.
Would investors want management deciding on short-term, quick-fix solutions to avoid violating debt covenants? Management might argue that it is in the best interest of shareholders to keep the bank out of the company's business. Thus, manipulating the current ratio is the proper thing to do. The lender would counter that selling equipment to inflate the current ratio violates the spirit of the debt covenant.
What's the right answer? As is often the case in gray areas, it is probably not clear. But one thing is cer -tain: you must always be careful when making business decisions that do not have a clear business pur-pose.
AA 2–65 The Most Important Financial Statement
Writing
Obviously, there is no one most important financial statement. Each is used for a different purpose. While students may disagree on how well the individual financial statements fulfill the objectives for which they were designed, each financial statement provides valuable information. Although it is a good exercise for students to be able to provide support for their most important financial statement, it is equally important for them to be able to identify the limitations of each of the financial statements. Thus, make sure stu -dents also focus on identifying why they determined the other statements are not as important.
AA 2–66 Creating a Balance Sheet and Income Statement
Cumulative Spreadsheet Project
The solutions to the Cumulative Spreadsheet Project are in the Solutions Manual files in the Instructor’s Resource section of the Albrecht Web site at http://www.thomsonedu.com/accounting/albrecht. In addition, the solutions can be found on the Instructor’s Resource CD-ROM, ISBN 0-324-64578-3.
