chapter 2 geologic history of west texas - texas water
TRANSCRIPT

17
Chapter 2
Geologic History of West TexasKevin Urbanczyk1, David Rohr1, and John C. White1
IntroductionThe region embraced within the Trans-Pecos region of Texas encompasses manysnapshots of North American geologic history. Precambrian crystalline metamorphicrocks are exposed in the Franklin Mountains, Van Horn Mountains, and Sierra DiabloMountains. Xenoliths of these rocks recovered from volcanic rocks in the DavisMountains, Bofecillos Mountains, and Chisos Mountains provide strong evidence thatalmost all of Trans-Pecos Texas is underlain by Precambrian rocks similar to those thatcrop out at the surface. Cambrian to Pennsylvanian rocks crop out in the FranklinMountains, Marathon Basin, Solitario, and at Persimmon Gap. These rocks represent atransgressive, then regressive, marine sequence that was caught between the NorthAmerican continent and another unidentified continent during the Pennsylvanian andintensely deformed and thrust onto North America forming the Marathon-OuachitaMountains. The foreland basin of these mountains became the Permian Basin, and thecarbonate rocks associated with this intracratonic sea now crop out in the Guadalupe,Glass, Apache, Van Horn, and Sierra Diablo mountain ranges. A depositional hiatus fromthe Triassic to Mid-Cretaceous was followed by the deposition of Mid- to Late-Cretaceous limestone that covers much of central and west Texas and frequently hostsimportant aquifers. From the Late Cretaceous to the Early Tertiary, these rocks werelocally deformed during the Laramide Orogeny, which can be seen in the Del Norte-Santiago Mountains, Mariscal Mountain, the Terlingua-Fresno Monocline, and in theChihuahua Tectonic Belt. Laramide compression was followed by a long period of large-scale ignimbritic volcanism in Trans-Pecos Texas. As compression continued to wane,ignimbritic volcanism yielded to smaller-scale effusive volcanism that was coupled withextensional tectonics, resulting in Basin and Range structures and related mountainranges in the Trans-Pecos. Between these ranges, which include the Franklin, Hueco,Guadalupe, Delaware, Sierra Diablo, Sierra Vieja, and Van Horn mountains, large basinsformed that filled with thick sequences of gravel and sand eroded from the adjacentmountains. It is in this setting that we presently reside.
1 Department of Earth and Physical Sciences, Sul Ross State University

18
Figure 2-1: Geologic maps of time intervals discussed in the text.

19
Precambrian GeologyPrecambrian metamorphic rocks crop out only near Van Horn and El Paso (fig. 2-1). Therocks have been interpreted to represent igneous and sedimentary rocks associated withan island arc system that were metamorphosed and accreted to the margin of NorthAmerica during collision with an unknown continent. These rocks are coeval with theLlano terrane of Central Texas, which also formed during the Grenville orogeny, atapproximately 1 billion years ago.
Paleozoic GeologyAlthough Paleozoic strata underlie most of Trans-Pecos Texas, they crop out only in afew regions (fig. 2-1). These can be broadly divided into the Paleozoic shelfal facies inthe El Paso and Van Horn areas, the basinal (or geosynclinal) Marathon facies, and thePermian intracratonic basinal facies in the Guadalupe Mountains southward through theSierra Diablo and Apache Mountains, the Glass Mountains, and the Shafter-Pinto Canyonarea.
Paleozoic Facies and Tectonics
What is now the Trans-Pecos was situated along the south margin of the North Americancontinent (Laurentia) during early Paleozoic time. The El Paso and Van Horn areas werethe site of deposition of limestone, dolomite, and sandstone in a shallow, tropical sealocated near the edge of the continental shelf (Stoudt, 1996). The strata in these areaswere slightly deformed during Mesozoic and Cenozoic uplift, resulting in the beds beingtilted from horizontal. The Franklin Mountains are a good example of a block-faultedmountain range.
Lower Paleozoic sandstone and limestone unconformably overlie Precambrian graniteand metamorphic rocks in the El Paso and Van Horn areas. In the Sierra Diablo, latePaleozoic uplift has resulted in the older Paleozoic rocks being stripped off, and upperPaleozoic rocks lie unconformably over Precambrian.
In contrast, the Paleozoic rocks in the Marathon Basin have very different lithologies andhave been folded and faulted to a much greater degree. These rocks, exposed in theMarathon Basin and in the Solitario to the southwest, are part of the Ouachita OrogenicBelt. The strata were originally deposited as shales, cherts, and turbidite sandstones in adeep oceanic setting south of the North American continent and represent one of thelongest intervals of essentially continuous deposition known (King, 1978). At the close ofthe Paleozoic, the south margin of North America collided with South America (then partof Gondwanaland), and the rocks were deformed and thrust northward over the NorthAmerican platform margin. Folding and thrust faults (fig. 2-2) result in some wellspenetrating distinctive units such as the Caballos Novaculite (Folk and McBride, 1978)several times in one borehole.

20
Figure 2-2: Cross section of the Marathon Basin showing the complex structure.Deformation near the rocks during the Ouachita Orogeny end of thePaleozoic caused extensive folding and faulting when geosynclinalfacies were thrusted over cratonic (modified from King, 1981).
The Permian Basin
Up to 3,000 m of Permian rocks underlies much of West Texas and southeastern NewMexico. Because of prolific oil production, the stratigraphy of the West Texas or PermianBasin has been studied in great detail (Hill, 1996). Subsurface information in the forms ofwell logs and seismic profiles is available for most of the area. The Permian Basin can bethought of as a small but deep inland sea that developed in a sag of the North Americancontinental crust after collision of the continent with Gondwanaland.
The earliest oil drilling in the Permian Basin revealed that the basin actually consists ofthree smaller basins: the Midland, Delaware, and Marfa Basins. During the PermianPeriod, these basins were enclosed marine basins accumulating organic-rich sediments.The edges of the two basins in Trans-Pecos Texas (the Delaware and Marfa Basins) werepartly surrounded by massive limestone reefs. Parts of the reef can now been seen at thesurface in the Guadalupe Mountains, including the peak of El Capitan. The margins ofthe basins are characterized by rapid lithologic facies changes. The basinal facies arebedded shales and sandstones, the reef is massive limestone, and the back reef iscommonly dolomite. A small amount of Permian gypsum, the Castile Formation, isexposed near the Texas-New Mexico border. Permian strata were uplifted to their presentelevation during the Cenozoic, and have been subjected to relatively minor deformation,mostly normal faulting (fig. 2-3).
Figure 2-3: Cross section of the Permian Basin. Most of the structural features werepresent during the Permian and controlled the sedimentary facies(modified from King, 1959).

21
Mesozoic GeologyThe paucity of Triassic and Jurassic rocks in Trans-Pecos Texas either at the surface or inthe subsurface strongly suggests that this region was subaerially exposed during theseperiods and experienced no active tectonism (McCormick and others, 1996). In adjacentnorthern Chihuahua, however, rifting and subsidence of the Chihuahua Trough related tothe opening of the Gulf of Mexico and Atlantic Ocean began during the Middle Jurassic.Triassic rocks are lacking throughout the Trans-Pecos area and adjacent Chihuahua.Jurassic rocks have been mapped at the surface only in the Malone Mountains, nearSierra Blanca (Albritton and Smith, 1965) and in the subsurface in the Chihuahua Trough(Henry and Price, 1985). Widespread clastic and carbonate sedimentation did not begin inthe Trans-Pecos until the Middle Cretaceous with the deposition of the Comancheanseries rocks, which represent primarily carbonate sedimentation associated with awidespread, intracontinental sea that inundated much of North America from Texas toAlberta (fig. 2-1). Late Cretaceous uplift related to the Laramide orogeny is responsiblefor Gulfian series rocks, a regressive sequence of limestone to terrigenous shales andsandstones that overlie the Comanchean series.
Comanchean deposition began with a coarse-grained, basal conglomerate consisting ofclasts of Paleozoic rocks. This conglomerate unconformably overlies the PennsylvanianTesnus Formation, where it is exposed in the Solitario, Big Bend Ranch State Park, and atPersimmon Gap, Big Bend National Park. In the Solitario, it is mapped separately as theShutup Conglomerate; in Big Bend National Park, it is mapped as a lower part of theGlen Rose Limestone (McCormick and others, 1996). The Glen Rose Limestone isoverlain by the Del Carmen Limestone, which is equivalent to the Edwards Limestone inCentral Texas. Completing the Comanchean (Lower Cretaceous) series in West Texasabove the Del Carmen Limestone are the Sue Peaks Formation (equivalent to theKiamichi Formation) and the Santa Elena Limestone (equivalent to the GeorgetownLimestone) (Maxwell and others, 1967; McCormick and others, 1996). The Comancheanseries is overlain by the Gulfian series, a regressive sequence beginning with the Del RioClay, followed by the Buda Limestone, and the Boquillas, Pen, Aguja, and JavelinaFormations.
Cenozoic GeologySedimentation from the Late Cretaceous into the Early Tertiary was nearly continuousand shows a regressive sequence of marine limestone yielding to swampy shale andterrigenous sandstone (Maxwell and others, 1967). This sedimentation wascontemporaneous with the compressive Laramide orogeny, which uplifted long, linearmountain chains (including the Del Norte-Santiago Mountains and the ChihuahuaTectonic belt) and was the most likely cause of the retreat of the epeiric seas in Trans-Pecos Texas (Lehman, 1986).
The Laramide orogeny, lasting from about 100 to 50 million years ago (Ma), began withthe onset of subduction of the Farallon plate under the North American plate (Coney andReynolds, 1977; McDowell and Clabaugh, 1979). Laramide compression produced folds,

22
thrust faults, and high-angle reverse faults; shortened Trans-Pecos Texas about 3.4percent; and reactivated west-northwest-striking, left-lateral strike slip basement faults(Barker, 1987). Laramide features in the Trans-Pecos include the Terlingua-Fresnomonocline, Mariscal Mountain, the Del Norte-Santiago Mountains, and the ChihuahuaTectonic Belt (Muehlberger and Dickerson, 1989). Laramide compression peaked in theLate Paleocene and ended during the Eocene (Coney and Reynolds, 1977; Price andothers, 1987). Magmatism began during the Eocene (~48 Ma) as compressive stressesbegan to wane and continued through the Oligocene and into the Miocene, ending about17 Ma (Henry and McDowell, 1986).
Early magmatism began with the emplacement of a suite of intrusive rocks in the El Pasoarea around 48 Ma and was followed by activity in the Christmas Mountains and westernBig Bend National Park between 45 and 40 Ma. Large-scale silicic volcanism began inthe Davis Mountains and Sierra Vieja about 39 Ma and continued until about 35 Ma. TheCrossen Trachyte and Star Mountain Rhyolite are generally accepted to be the oldestvolcanic units within the Davis Mountains, erupting from unknown sources about 38.6Ma (Henry and others, 1994). The Buckhorn caldera, the first recognized caldera in theDavis Mountains, formed about the same time, with the eruption of the Gomez Tuff(Parker, 1986). Volcanism was nearly contemporaneous in the Sierra Vieja and Van HornMountains, with the eruption of the Buckhorn Ignimbrite from unknown sources and theeruption of the Chambers and High Lonesome Tuffs from the Van Horn caldera (Henryand Price, 1986). The Solitario laccocaldera also erupted during this initial phase. In thesouthern Davis Mountains, several widespread flows of mafic to intermediate lavaserupted, producing the lavas of the Pruett Formation, including the Sheep Canyon Basalt,Potato Hill Andesite, and Cottonwood Springs Basalt. This activity was followed by theformation of the Paisano volcano, a large trachyte-rhyolite shield volcano, around 36 Ma(Parker, 1983). The Eagle Mountain and Quitman Mountain calderas are approximatelycontemporaneous with the Paisano volcano (Henry and Price, 1984). Large-scalevolcanism in the Davis Mountains ended with the eruption of the Barrel Springs and WildCherry Formations from the Paradise Mountain–Pine Peak caldera between 36.4 and 35.4Ma (Henderson, 1979).
Following the cessation of activity in the Davis Mountains, volcanism shifted southwardto Big Bend National Park and the Chinati Mountains. The earliest known episode ofvolcanism in Big Bend National Park is represented by the 47 to 40 Ma Alamo CreekBasalt. Magmatism in Big Bend resumed between 35 and 32 Ma with the eruption oflavas and tuffs of the Chisos Group, followed by those of the South Rim Formation.From the Chinati Mountains area, lavas and tuffs of the Shelly Group and MoritaFormation were erupted from unknown sources between 34 and 32 Ma. Between 33 and32 Ma, the Chinati Mountains caldera formed as a result of the eruption of the MitchellMesa Tuff, the largest (>1000 km3) ash-flow tuff in Trans-Pecos Texas. This eruptionwas followed by several hundreds of thousand years of continued volcanic activity thatresulted in the accumulation of a large volcaniclastic alluvial apron around the ChinatiMountains, which is represented by the Tascotal Formation.
During the Oligocene, between 31 and 28 Ma, the compressive stress regime yielded to atensional (extensional) environment, which persisted through the remainder of the

23
Cenozoic (Muehlberger and others, 1978; Henry and others, 1991). Volcanism duringthis phase was restricted to Big Bend Ranch State Park and adjacent Mexico and beganwith the eruption of the San Carlos and Santana Tuffs from the Sierra Rica calderacomplex in northern Mexico at 30 and 27.8 Ma. Volcanism continued between 27.8 and26 Ma with the eruption of the Rawls Formation, a complex series of mostly mafic tointermediate lavas. Faulting associated with extensional tectonics produced adiscontinuous series of north-northwest-trending pull-apart grabens that terminate atwest-northwest-trending strike-slip faults (Barker, 1987). Mafic volcanism closelyassociated with faulting continued until about 17 Ma.
ReferencesAlbritton, C. C., Jr., and Smith, J. F., Jr., 1965, Geology of the Sierra Blanca area,
Hudspeth County, Texas: U.S. Geological Survey Professional Paper 479, 131 p.
Barker, D. S., 1987, Tertiary alkaline magmatism in Trans-Pecos Texas: in GeologicalSociety of America Special Publication No. 30, p. 415-431.
Coney, P. J., and Reynolds, S. J., 1977, Cordilleran benioff zones: Nature, v. 270, p. 403-406.
Folk, R. L., and McBride, E. F., 1978, Origin of the Caballos Novaculite: in Mazzullo, S.J., ed., Tectonics and Paleozoic facies of the Marathon Geosyncline, West Texas:Permian Basin Section, SEPM, Publication no. 78-17, p. 101-130.
Henderson, G., 1979, Geology of the Medley Kaolin deposits and associated volcanicrocks, Jeff Davis County, Texas. Unpublished M.S. thesis, Baylor University, Waco,Texas, p. 186.
Henry, C. D., Kunk, M. J., and McIntosh, W. C., 1994, 40Ar/39Ar chronology andvolcanology of silicic volcanism in the Davis Mountains, Trans-Pecos Texas:Geological Society of America Bulletin, v. 106, p. 1359-1376.
Henry, C. D., and McDowell, F. W., 1986, Geochronology of magmatism in the Tertiaryvolcanic field, Trans-Pecos Texas: in Price, J. G., Henry, C. D., Parker, D. F., andBarker, D. S., eds., Igneous geology of Trans-Pecos Texas�Field trip guide andresearch articles: The University of Texas at Austin, Bureau of Economic GeologyGuidebook 23, p. 99-122.
Henry, C. D., and Price, J. G., 1984, Variations in caldera development in the Tertiaryvolcanic field of Trans-Pecos Texas: Journal of Geophysical Research, v. 91, p. 6213-6224.
Henry, C. D., and Price, J. G., 1985, Summary of the tectonic development of Trans-Pecos Texas: The University of Texas at Austin, Bureau of Economic Geology,Miscellaneous Map No. 36, p 7.
Henry, C.D. and Price, J.G., 1986, Early Basin and Range development in Trans-PecosTexas and adjacent Chihuahua: Magmatism and orientation, timing, and style ofextension, Journal of Geophysical Research, v. 91, p. 6213-6224.

24
Henry, C.D., Price, J.G., and James, E.W., 1991, Mid-Cenozoic stress evolution andmagmatism in the southern Cordillera, Texas and Mexico: Transition fromcontinental arc to intraplate extension, Journal of Geophysical Research, v. 96, p.13545-13560.
Hill, C. A., 1996, Geology of the Delaware Basin: Permian Basin Section, SEPM,Publication 96-39, p. 480.
King, P. B., 1959, The evolution of North America: Princeton University Press, 190 p.
King, P. B., 1978, Tectonics and sedimentation of the Paleozoic rocks in the Marathonregion, West Texas: in Mazzullo, S. J., ed., Tectonics and Paleozoic facies of theMarathon Geosyncline, West Texas: Permian Basin Section, SEPM, Publication No.78-17, p. 5-38.
King, P. B., 1981, Geology of the eastern part of the Marathon Basin, Texas: U.S.Geological Survey Professional Paper 1157, 40 p. [1980 FIG. 2.2]
Lehman, T. M., 1986, Late Cretaceous sedimentation in Trans-Pecos Texas: in Pause, P.H. and Spears, R. G., eds., Geology of the Big Bend area and Solitario dome, Texas:West Texas Geological Society 1986 Field Trip Guidebook, p. 105-110.
Maxwell, R. A., Lonsdale, J. T., Hazzard, R. T., and Wilson, J. A., 1967, Geology of BigBend National Park, Brewster County, Texas: The University of Texas at Austin,Bureau of Economic Geology, Publication 6711, 320 p.
McCormick, C. L., Smith, C. I., and Henry, C. D., 1996, Cretaceous stratigraphy: inHenry, C. D. and Muehlberger, W. R., eds., Geology of the Solitario dome, Trans-Pecos Texas: Paleozoic, Mesozoic, and Cenozoic sedimentation, tectonism, andmagmatism: The University of Texas at Austin, Bureau of Economic Geology Reportof Investigations No. 240, p. 30-46.
McDowell, F. W., and Clabaugh, S. E., 1979, Ignimbrites of the Sierra Madre Occidentaland their relation to the tectonic history of western Mexico: in Geological Society ofAmerica Special Publication 180, p. 113-124.
Muehlberger, W. R., Belcher, R. C., and Goetz, L. K., 1978, Quaternary faulting inTrans-Pecos Texas: Geology, v. 6, p. 337-340.
Muehlberger, W. R., and Dickerson, P. W., 1989, A tectonic history of Trans-PecosTexas: in Muehlberger, W. R., and Dickerson, P. W., eds., Structure and stratigraphyof Trans-Pecos Texas: American Geophysical Union Field Trip Guidebook T317, p.35-54.
Parker, D.F., 1983. Origin of the trachyte-quartz trachyte-peralkalic rhyolite suite of theOligocene Paisano volcano, Trans-Pecos Texas. Geological Society of AmericaBulletin, v. 94, p. 614-629.
Parker, D.F., 1986. Stratigraphy, structural, and petrologic development of the Buckhorncaldera, northern Davis Mountains, Trans-Pecos Texas, in Price, J.G., Henry, C.D.,Parker, D.F., and Barker, D.S., eds., Igneous geology of Trans-Pecos Texas: Field tripguide and research articles. The University of Texas at Austin Bureau of EconomicGeology Guidebook 23, p. 286-302.

25
Price, J. G., Henry, C. D., Barker, D. S., and Parker, D. F., 1987, Alkalic rocks ofcontrasting tectonic settings in Trans-Pecos Texas: Geological Society of AmericaSpecial Paper 215, p. 335-346.
Stoudt, E. L., ed., 1996, Precambrian-Devonian geology of the Franklin Mountains, WestTexas�analogs for exploration and production in Ordovician and Silurian karstedreservoirs in the Permian Basin: West Texas Geological Society, Publication 96-100,p. 117-123.

26
Chapter 3
Evaluation of Groundwater Recharge inBasins in Trans-Pecos Texas
Bridget R. Scanlon1, Bruce K. Darling2, and William F. Mullican III3
IntroductionThe Trans-Pecos Texas region, in the southeast part of the Basin and Range province,consists of topographically high plateaus and mountains separated by major normal faultsfrom adjacent, topographically low desert basins. The basins were progressively filled bydetritus eroded from adjacent ranges and from Colorado and New Mexico by theancestral Rio Grande (Gustavson, 1990). The study area includes the Diablo Plateau,Hueco Bolson, and Eagle Flat and Red Light Basins (fig. 3-1). Depth to groundwaterranges from 100 to 900 ft (30 to 274 m) beneath the Diablo Plateau, 350 to 500 ft (107 to152 m) in the Hueco Bolson, 100 to 1,100 ft (30 to 335 m) in Eagle Flat Basin, and 10 to500 ft (3 to 152 m) in Red Light Basin.
Trans-Pecos Texas lies within the northern Chihuahuan Desert (King, 1948). The regionhas a subtropical, arid climate (Larkin and Bomar, 1983). Long-term average annualprecipitation ranges from 11 inches (280 mm) in Hueco Bolson to 12.6 inches (320 mm)in Sierra Blanca in Eagle Flat and Red Light Basins. Most precipitation occurs in thesummer months as thunderstorms.
The geology of the different regions is quite variable. The Diablo Plateau site consists ofshallow alluvium over Cretaceous limestone. The Hueco Bolson is made up of about 0 to75 ft (~0 to 23 m) of coarse-grained material over 600 ft (183 m) of clay interbedded withsilts and sands. Basin-fill deposits in the Eagle Flat region are generally fine grainedmuds, which are overlain by sand sheets in some parts of the basin.
MethodsThe theoretical basis for the various techniques used to evaluate groundwater recharge inthe study area is described next in order to provide the reader with a conceptualunderstanding of the different approaches. We used physical, chemical, and isotopic datafrom the unsaturated zone to determine whether groundwater recharge was occurring on 1 Bureau of Economic Geology2 L.B.G. Guyton and Associates3 Texas Water Development Board

27
QAa4848c
10
1111
Hot Wells
Allamoore
SierraBlanca
TEXAS
Area of higher relief
N
Diablo Plateau
GraytonLake
Northwest Eagle Flat
Scott's Crossing
Southeast Eagle Flat
Streeruwitz Hills
SierraBlancaPeaks
0 20 km
0 15 mi
Figure 3-1: Location of the study area, including Diablo Plateau and Hueco Bolsonand Eagle Flat and Red Light Basins.

28
the valley floors and on the Diablo Plateau. The unsaturated zone is the zone between theland surface and the water table, where pore spaces are filled with water and air. Waterpressures are negative in the unsaturated zone and positive in the saturated zone. Physicaldata were used to determine the direction of water movement at a site. Chemical andisotopic tracers were used to quantify net water fluxes over long time periods.Groundwater tracers were also used on the Diablo Plateau and in the Eagle Flat and RedLight Basins to evaluate recharge.
Direction of Water Movement
Increasing potential energy with depth in the subsurface in the study area indicates thatwater is moving upward and that there is no recharge there. We can understand thisconcept by considering the gravitational force field, which is related to elevation of anobject relative to a datum. Gravitational potential energy increases with elevation above adatum, such as the land surface, and objects will move from higher to lower gravitationalpotential energy (i.e., from higher to lower elevations). In soils, potential energy is relatedto forces in the soil, such as capillary, adsorptive, and osmotic forces (water-potentialenergy), and water will move from regions of high to low potential energy. Energy can beexpressed in different units such as pressure (mega Pascals [Mpa] bars, or atmospheres)or head (ft, m). One MPa is equivalent to 10 bars, or 102 m. Thermocouplepsychrometers were used to measure the relative humidity of the soil air, which wasconverted to matric potential energy according to the Kelvin equation.
Chemical and Isotopic Tracers
Chloride concentrations in unsaturated-zone pore water have been used to study rechargein semiarid systems over time scales ranging to thousands of years. Chlorideconcentrations in unsaturated-zone pore water are inversely proportional to water flux:high chloride concentrations in pore water indicate low water fluxes because chlorideaccumulates in the unsaturated zone as a result of evapotranspiration. In contrast, lowchloride concentrations indicate high water flux because chloride is flushed through theunsaturated zone. The recharge rate, or water flux, is calculated by dividing the chlorideinput (precipitation × chloride concentration in precipitation) by the chlorideconcentration in the unsaturated zone. The age represented by chloride at any depth canbe estimated by dividing the total amount of chloride from the surface to that depth by theannual chloride input.
Chlorine-36, a radioactive isotope of chlorine, has been used to a limited extent to datepore water in arid unsaturated zones. Chlorine-36 (36Cl), which is produced naturally inthe atmosphere (Bentley and others, 1986), has a half-life of 301,000 yr. The term half-life refers to the amount of time required for one-half of the atoms of a radioactiveelement to decay to half of the initial value. Nuclear-weapon tests conducted in thePacific between 1952 and 1958 resulted in 36Cl concentrations in rainfall that were asmuch as 1,000 times greater than natural fallout levels (fig. 3-2; Bentley and others,1986). Bomb-pulse 36Cl:Cl ratios have been used to estimate water fluxes during the past40 yr and to evaluate preferential flow (Phillips and others, 1988; Scanlon, 1992;

29
0
1
2
3
4
5
1950 1960 1970
10
4 a
tom
s 3
6C
l m
-2 s
-1
600
500
400
300
200
100
0
QA14516c
TU
36Cl
3H *
3H†
Figure 3-2: Temporal variations in 3H and 36Cl fallout from Ottawa, Canada(Scanlon, 1992).
Fabryka-Martin and others, 1993) (fig. 3-1). The depth of this high concentration of36Cl:Cl ratios in the soil water can be used to estimate how far water has moved duringthe time between bomb-pulse fallout and soil-sample collection (~ 40 yr). Radioactivedecay of 36Cl can also be used to estimate water ages to 1 million yr.
Tritium (3H), a radioactive isotope of the element hydrogen (H) and produced naturally inthe upper atmosphere, results in concentrations in precipitation over the northernhemisphere of 1 to 20 tritium units (TU) (Michel, 1989; Solomon and Sudicky, 1991) andaverages approximately 5 TU (Mazor, 1991, p. 151). We define 1 TU as one atom of 3Hin 1018 atoms of H, and the half-life of 3H is 12.43 yr. Tritium concentrations increasedfrom 10 to ≥ 2,000 TU during atmospheric nuclear testing (IAEA, 1983) that began in1952 and peaked in 1963 to 1964 (fig. 3-2). Tritium generated by the above-grounddetonations of nuclear weapons is referred to as bomb-pulse tritium. Tritium thatrecharged groundwater in 1953 would have decayed to less than 0.5 TU by 2001,assuming an initial average value of 5 TU. Therefore, tritium concentrations of less than0.5 TU are often interpreted to indicate recharge before 1952, and higher levels of tritiumare regarded as indicative of post-1952 recharge. Subsurface distribution of bomb-pulsetritium in the unsaturated zone can be used to estimate how deep water has moved in thepast 40 yr—a procedure similar to the one described for 36Cl.
Carbon-14 (14C), a radioactive isotope of carbon, is formed naturally in the upper levelsof the atmosphere. Because of its long half-life, 14C can be used to date groundwater withrecharge ages to 10,000 yr. The concentration of 14C is reported as percent moderncarbon (pmc), which is the ratio of 14C in a sample of groundwater measured against theconcentration in an internationally accepted standard of oxalic acid. The apparent age of awater sample is inversely related to the concentration of 14C. A value of 100 pmc

30
indicates modern water. A value of 50 pmc represents an apparent age of 1 half-life, or5,730 yr.
Stable isotopes of oxygen (18O) and hydrogen (2H, or deuterium) have been used toevaluate unsaturated flow. Because of coupling between fractionation of oxygen andhydrogen, a plot of stable isotopes of water samples from precipitation, rivers, and lakesthroughout the world follows a straight line called the global meteoric water line (Craig,1961).
Although the isotopic composition of individual rain events is highly variable, the annualmean values are fairly constant (Gat, 1981). The isotopic composition of pore water inthe unsaturated zone is generally either depleted or enriched relative to the mean isotopiccomposition of rainwater. Enriched values of the stable isotopes relative to the meteoricwater line indicate evaporation from surface water before infiltration or from pore waterin the unsaturated zone. Slopes of 2H versus 18O are about 5 for surface-waterevaporation but can decrease to 2 for evaporation of pore water in the unsaturated zone(Allison, 1982).
Field and Laboratory Methods
Sediment samples were collected for water-potential measurements in the laboratoryfrom 8 boreholes to 46-ft (14-m) depth in the Hueco Bolson and 48 boreholes to 102-ft(31-m) depth in Eagle Flat Basin (Scanlon and others, 1991, 2000). The boreholes weredrilled by using a hollow-stem auger, and samples were collected in split-tube corebarrels (1.5 m [4.9 ft] long). To monitor water-potential variations, field psychrometerswere installed in two locations in the Hueco Bolson and in one location in Eagle FlatBasin.
Sediment samples were collected from 10 boreholes to 31.5-ft (9.6-m) depth on theDiablo Plateau, 10 boreholes to 73.5-ft (22.4-m) depth in Hueco Bolson, and 52boreholes to 102-ft (31-m) depth in Eagle Flat Basin for laboratory determination ofchloride content (fig. 3-1). 36Cl:Cl ratios and 3H were measured in soil samples collectedin a shallow pit in Hueco Bolson and in five boreholes in Eagle Flat Basin. Samples for36Cl:Cl were analyzed by Accelerator Mass Spectrometry at Lawrence LivermoreNational Laboratory. Samples for 3H from Hueco Bolson were analyzed unenriched atthe University of Waterloo, and those from Eagle Flat Basin were analyzed, enriched bystandard direct scintillation methods, at the University of Arizona Tritium Laboratory orby gas proportional counting at the University of Miami Tritium Laboratory. Samplesfrom seven boreholes in Eagle Flat Basin were analyzed for stable isotopes of hydrogen(2H) and oxygen (18O). The analyses were done by the Desert Research Institute(University of Nevada, Las Vegas).
Groundwater samples were collected from 30 wells on the Diablo Plateau for 3H analysis.A total of 74 samples were collected from 59 wells in Eagle Flat and Red Light Basinsfor 14C and 3H analyses.

31
0-5-10-15(a)
-5
-10
0
-15
0(b) Water potential (MPa) Water potential (MPa)
-5-10-15
0
10
20
30
EF 110
0
10
20
30
(d)
EF 91
GL 2GL 5GL 6
QAc9590c
EF 111
(c)
(e)
HB 50HB 15
DrainageInterdrainage
Basin fill Sand sheet
Blanca Draw Grayton Lake
EF 85
EF 41
(f)
Figure 3-3: Typical water-potential profiles in (a, b) Hueco Bolson (interdrainagearea, HB 15, drainage area, HB 50) and in (c–f) Eagle Flat Basin(interdrainage mud flats [EF 111], interdrainage sand sheet [EF 91],Blanca Draw [EF 41, 85, 110], and Grayton Lake [GL 2, 5, and 6]).
Results
Valley-Floor Settings in the Hueco Bolson and Eagle Flat Basin
Measured water potentials in interdrainage areas were extremely low in the HuecoBolson and Eagle Flat Basin, indicating that the sediments are dry (Scanlon and others,1991, 2000) (fig. 3-3). Water potential generally increased with depth, suggesting thatwater is moving upward in the profile as a result of long-term drying. Long-termmonitoring of water potentials in the Hueco Bolson and Eagle Flat Basin in interdrainageareas indicates that during the past 7 to 10 yr, water did not move below the top 3 ft in asandy location in Hueco Bolson or below 1 ft in a silt-loam site in the Hueco Bolson or asimilar site in Eagle Flat Basin. Drainage areas in the Hueco Bolson and Eagle Flat Basin(Blanca Draw) also had low water potentials and upward gradients indicating upwardwater movement. The drainage areas are generally characterized by vegetation, such asmesquite, that can readily remove water from the subsurface and dry out the soil profile.However, water potentials at depths of more than 15 to 30 ft beneath Blanca Draw weremuch higher than those in adjacent regions, indicating downward water movement atthese depths. Water potentials beneath Grayton Lake playa in Eagle Flat Basin were also

32
HB 15
0 1000 2000 3000Chloride (mg/L)(a)
-15
-10
-5
0
(b)
Chloride (mg/L) x 1000 Chloride (mg/L) x 1000
Chloride (mg/L)0 1000 2000 3000
0 20151050
10
20
30
0 2 4 6 8 10(d)
EF 91
0
10
20
30
GL 2GL 5GL 6
(f)
QAc9589c
EF 111
(c)
EF 28
(e)
Basin fill Sand sheet
Blanca Draw Grayton Lake
HB 50
DrainageInterdrainage
EF 85
EF 110
EF 41
Figure 3-4: Typical chloride profiles in (a, b) Hueco Bolson (interdrainage area, HB15; drainage area, HB50) and in (c–f) Eagle Flat Basin (interdrainagebasin fill [EF 28, 111], interdrainage sand sheet [EF 91], Blanca Draw[EF 41, 85, and 110], and Grayton Lake [GL 2, 5, and 6]).
low, indicating dry conditions. Recent studies indicate that these upward water-potentialgradients in interdrainage areas may take thousands of years to develop, and theseprofiles may reflect drying of the soils since Pleistocene time (Walvoord and others,1999).
Chloride concentrations in the unsaturated zone in interdrainage areas were generallyhigh, indicating low water fluxes (fig. 3-4). Maximum chloride concentrations in theHueco Bolson profiles ranged from 1,858 to 9,343 mg/L. The chloride profiles aregenerally bulge shaped, with low concentrations near the surface increasing to amaximum at depth and decreasing below the peak to total depth. The bulge has beenattributed to higher water fluxes before the last 10,000 yr (during Pleistocene glaciation)and reduction or change from downward to upward flow during the Holocene (~last10,000 yr). Water fluxes at depth below the bulge in the Hueco Bolson profiles were asmuch as 0.04 inches/yr (1 mm/yr). Chloride profiles in the sand-sheet areas of Eagle Flat
33
-2.0
-1.0
0
De
pth
(m
)
0 2 4 6 8
QA14518c
0 10 20 30 40TU
atoms 36Cl 10-12 atoms Cl
36Cl/Cl
3H
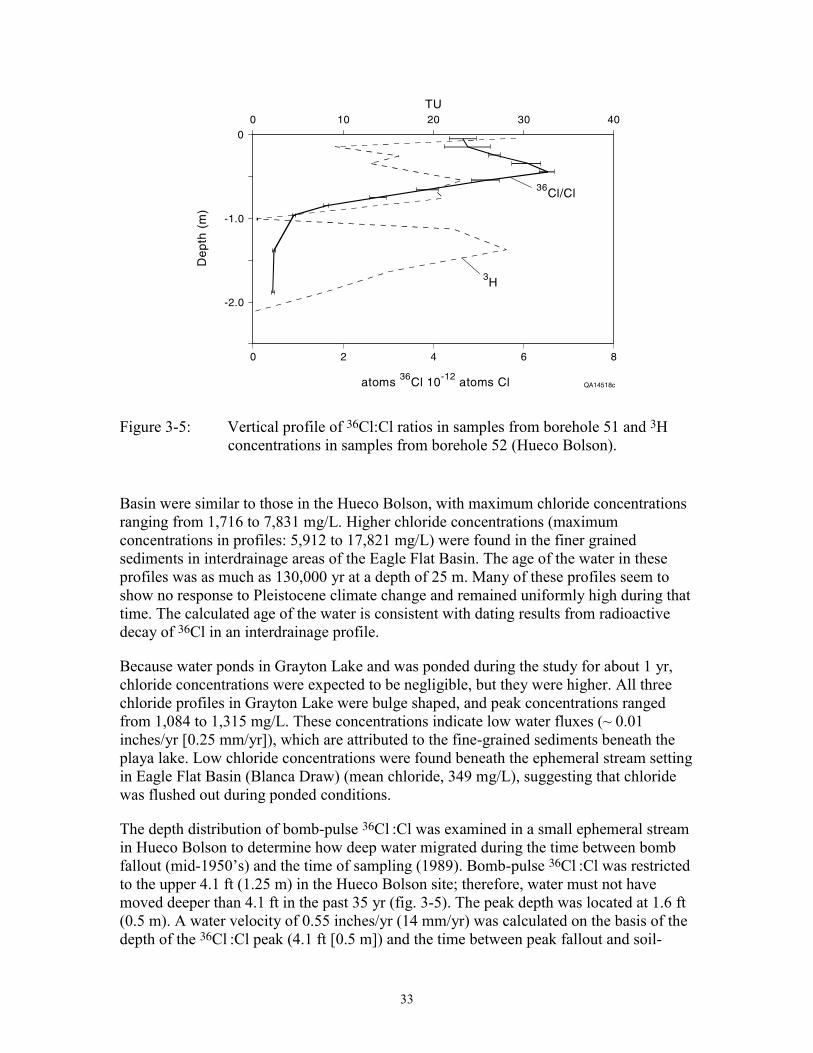
Figure 3-5: Vertical profile of 36Cl:Cl ratios in samples from borehole 51 and 3Hconcentrations in samples from borehole 52 (Hueco Bolson).
Basin were similar to those in the Hueco Bolson, with maximum chloride concentrationsranging from 1,716 to 7,831 mg/L. Higher chloride concentrations (maximumconcentrations in profiles: 5,912 to 17,821 mg/L) were found in the finer grainedsediments in interdrainage areas of the Eagle Flat Basin. The age of the water in theseprofiles was as much as 130,000 yr at a depth of 25 m. Many of these profiles seem toshow no response to Pleistocene climate change and remained uniformly high during thattime. The calculated age of the water is consistent with dating results from radioactivedecay of 36Cl in an interdrainage profile.
Because water ponds in Grayton Lake and was ponded during the study for about 1 yr,chloride concentrations were expected to be negligible, but they were higher. All threechloride profiles in Grayton Lake were bulge shaped, and peak concentrations rangedfrom 1,084 to 1,315 mg/L. These concentrations indicate low water fluxes (~ 0.01inches/yr [0.25 mm/yr]), which are attributed to the fine-grained sediments beneath theplaya lake. Low chloride concentrations were found beneath the ephemeral stream settingin Eagle Flat Basin (Blanca Draw) (mean chloride, 349 mg/L), suggesting that chloridewas flushed out during ponded conditions.
The depth distribution of bomb-pulse 36Cl :Cl was examined in a small ephemeral streamin Hueco Bolson to determine how deep water migrated during the time between bombfallout (mid-1950’s) and the time of sampling (1989). Bomb-pulse 36Cl :Cl was restrictedto the upper 4.1 ft (1.25 m) in the Hueco Bolson site; therefore, water must not havemoved deeper than 4.1 ft in the past 35 yr (fig. 3-5). The peak depth was located at 1.6 ft(0.5 m). A water velocity of 0.55 inches/yr (14 mm/yr) was calculated on the basis of thedepth of the 36Cl :Cl peak (4.1 ft [0.5 m]) and the time between peak fallout and soil-

34
Adjacent to playa (GL 4)
Playa (GL 2)
QAc2459(a)c�18OVSMOW
-10 -8 -6 -4 -2 0 2 4-12
LMWL
EF 113EF 91
GMWL
EF 64
100
80
60
40
20
0
Figure 3-6: Deuterium versus oxygen-18 in soil samples collected beneath GraytonLake and in interdrainage profiles in Eagle Flat Basin (GMWL, globalmeteoric water line, LMWL, local meteoric water line).
sample collection (35 yr). The corresponding water flux (0.055 inches/yr [1.4 mm/yr])was calculated by multiplying water velocity by the average water content in the profile(0.1 ft3/ ft3). Distribution of bomb-pulse 3H was also evaluated. The 3H profile wasmultipeaked (fig. 3-5), with 3H concentrations ranging from 23 to 29 TU. The deepestpeak (1.4 m) was attributed to the 1963 peak fallout, which resulted in a water velocity of2.2 inches/yr (56 mm/yr) (assuming a time of 25 yr since peak fallout). Thecorresponding water flux of 0.28 inches/yr (7 mm/yr) was calculated on the basis of anaverage volumetric water content of 0.13 ft3/ ft3. High 3H concentrations beneathGrayton Lake playa were attributed to preferential flow along desiccation cracks in thefloor of the playa.
Stable isotopes of oxygen and hydrogen were used to evaluate subsurface evaporation. Alocal meteoric water line was estimated from 18O and 2H data from precipitation that issimilar to the global meteoric water line (fig. 3-6). Interdrainage profiles showenrichment of �18O relative to �2H that is described by �2H = 3.1�18O. This low slope isconsistent with evaporation of pore water in the unsaturated zone. In contrast, stableisotope data from beneath Grayton Lake plot parallel the meteoric water line, indicatingnegligible evaporation in these sediments.

35
Recharge on the Diablo Plateau
Results of tritium analysis in groundwater samples in the Diablo Plateau indicate thatbomb-pulse tritium was found in most wells in the area (Kreitler and others, 1987).Tritium concentrations ranged from more than 0.8 to 32 TU. Approximately 18 percentof the wells had bomb-pulse tritium (> 0.8 TU). The most likely mechanism for rapidrecharge to groundwater is through arroyos and depressions where water ponds at thesurface. This hypothesis is supported by the chloride profiles, which were variable inarroyo settings. Low chloride concentrations were measured in one profile (135 mg/L),which corresponds to a water flux of 0.0688 inches/yr (1.75 mm/yr). The other twoprofiles in arroyo settings had higher chloride concentrations (2,286 to 3,292 mg/L),which resulted in lower water fluxes (0.0041 to 0.0028 inches/yr [0.10 to 0.07 mm/yr]).Low chloride concentrations were also measured in a closed depression (186 mg/L),which corresponds to a water flux of 0.0501 inches/yr (1.27 mm/yr). In contrast, chlorideconcentrations in interarroyo settings were high in all profiles. Chloride concentrationsranged from 4,211 to 10, 226 mg/L, and calculated water fluxes were low in thesesettings (0.0022 to 0.0009 inches/yr [0.056 to 0.023 mm/yr]).
Mountain-Front Recharge in Eagle Flat and Red Light Basins
Results of 3H, 14C, and apparent 14C ages of groundwater in Eagle Flat and Red LightBasins are shown in figure 3-7. Average values are shown for wells having multiplesamples. The estimated ages are maximum values and are not based on adjustments forthe effects of factors that are known to lower the concentrations of 14C in groundwater. Inthis study, 14C is not regarded as an indicator of absolute age, but of relative age.
The highest 3H and 14C values are found in groundwater along the mountain fronts(adjacent to Eagle Mountain) and where bedrock is exposed or covered by a thin layer ofbasin-fill sediments. The lowest values of 14C and 3H are found in the deepestgroundwater of Eagle Flat and Red Light Basins.
In southeast Eagle Flat Basin, 14C ranges from >107 pmc to 2 pmc, and 3H ranges from 8to 0 TU. The highest 14C values occur in groundwater of Bean and Millican Hills and theCarrizo and Eagle Mountains. Depth to the potentiometric surface is generally less than200 ft (<61 m) in these areas, and bedrock is either exposed or covered by a thin layer ofbasin-fill sediments. The lowest 14C values are consistent with apparent ages that rangefrom 23,000 to 31,000 yr. These age estimates are in line with estimates of recharge agesof groundwater in the Hueco Bolson (Fisher and Mullican, 1990) west of Eagle FlatBasin.
In northwest Eagle Flat, 14C values range from 80.5 to 1.3 pmc, and 3H ranges from 2.0to 0 TU. The largest concentrations occur in groundwater near the margins of the basinwhere bedrock of Precambrian or Cretaceous age is exposed. Concentrations of 0 TU arecharacteristic of deep groundwater near the central area of the flow system.

36
QAa4850(a)c
1111
N
0 TU4.7 PMC25,300 yrs
0 TU8 PMC21,000 yrs
10
0 TU15.20 PMC15,600 yrs
0 TU22 PMC12,500 yrs
6.78 TU7.00 TU
0 TU3.90 PMC27,000 yrs 0 TU
6.63 PMC22,400 yrs
0 TU3.70 PMC27,200 yrs
0.7 TU8.65 PMC20,200 yrs
0 TU26.10 PMC11,100 yrs
0 TU3.8 PMC27,000 yrs
0 TU1.3 PMC36,000 yrs
1.7 TU42.5 PMC7,100 yrs
0.30 TU9.95 PMC19,500 yrs
2 TU47.3 PMC6,200 yrs
0 TU10.1 PMC18,900 yrs
0.37 TU28.5 PMC10,400 yrs
3.67 TU62.80 PMC3,800 yrs
5.22 TU94.40 PMC500 yrs
6.27 TU107.2 PMCModern
3.00 TU45.10 PMC6,600 yrs
2.22 TU
0.40 TU5.25 PMC5,300 yrs
0 TU2.2 PMC31,500 yrs 0 TU
6.10 PMC23,100 yrs
0 TU5.6 PMC23,800 yrs
0 TU8 PMC20,900 yrs
1.25 TU11.7 PMC17,700 yrs
0 TU3.7 PMC27,000 yrs
0 TU
2.61 TU
0 TU4.30 PMC26,000 yrs
0 TU6.10 PMC23,100 yrs
1.36 TU23 PMC12,100 yrs
0 20 km
0 15 mi
Area of higher relief
TEXAS
6.19 TU
4.16 TU
4.22 TU
0 TU
0.96 TU33.90 PMC8,900 yrs
0 TU
4.5 TU79.50 PMC1,900 yrs
.039 TU5.9 PMC23,400 yrs
6.21 TU
7.69 TU100.8 PMCModern
3.11 TU47.10 PMC6,200 yrs
1.25 TU54.3 PMC5000 yrs
0 TU2.1 PMC31,900 yrs
0 TU3.4 PMC28,000 yrs
Data point
Tritium unitsTU
Percent modern carbonPMC
Figure 3-7: Map of groundwater 3H (TU) and 14C (pmc) concentrations anduncorrected 14C ages in Trans-Pecos Texas.

37
In Red Light Basin, 14C ranges from 54.3 to 2.1 pmc, and 3H ranges from 6.9 to 0 TU.The highest 14C values are associated with wells in the Eagle Mountains and along thenorthwest part of Devil Ridge. Spatial distribution is one of sharply decreasing 14C withincreasing distance from the Eagle Mountains toward the central area of the northwest-oriented basin. For example, 14C decreases from 54.3 to 15.2 pmc or less in wellsbetween the upper and middle alluvial fans of the Eagle Mountains (fig. 3-7). Most 14Cconcentrations in this area of the basin are less than 8 pmc.
Six wells within Red Light Basin produce groundwater having measurable 3H. Thelargest values occur in groundwater within the upper elevations of the Eagle Mountainsand the upper to middle alluvial fans of the southern Quitman Mountains. Two otherwells less than 1 mi north of the Rio Grande produce tritiated groundwater (2.61 and 4.22TU).
DiscussionUnsaturated-zone studies conducted on the valley floors of the Hueco Bolson and EagleFlat Basin clearly demonstrate that there is no groundwater recharge in interarroyosettings. Lack of recharge is evidenced by upward water-potential gradients; highchloride concentrations, which result from evapotranspiration, prebomb 36Cl:Cl ratiosand 3H concentrations below the shallow subsurface; and enrichment in stable isotopes ofoxygen and hydrogen relative to the local meteoric water line. Similar results were foundin alluvial-fan settings in Ward Valley (California), Amargosa Valley (Beatty, Nevada)(Prudic, 1994) and the Nevada Test Site (Tyler and others, 1996). Chlorideconcentrations at the Beatty site in Nevada decreased to 50 mg/L at depths more than33 ft(�10 m), indicating an increase in water flux from 0.25 inches/yr (0.01 mm/yr) (3- to 33-ft zone) to 0.08 inches/yr (2 mm/yr) (>33 ft [10 m] depth). The higher water fluxes atdepth were attributed to the Amargosa River being more active during the Pleistocene(Prudic, 1994). Low chloride concentrations at depths of 100 to 197 ft (~30 to 60 m[mean 18 mg/L]) at one of the Nevada Test Site profiles were attributed to the site’slocation at the confluence of alluvial fans, which affected the system’s response to higherprecipitation during the Pleistocene.
Recharge occurs primarily on the Diablo Plateau and on the mountain fronts of Eagle Flatand Red Light Basins, judging from the 3H concentrations in groundwater beneath theDiablo Plateau. These are attributed to recharge along arroyos and depressions wherewater ponds, as shown by chloride profiles. High recharge rates in the mountains andupland areas of Eagle Flat and Red Light Basins are indicated by high 3H concentrations(post-1953 recharge) and high 14C concentrations. Tritium concentrations in deepgroundwater in these basins are typically 0 TU, whereas 14C concentrations are low andindicate ages of 20,000 to 30,000 yr. The low 14C values of the deeper groundwaterindicate that flow rates within these basins are less than a few feet per year.
Similar results have been found at Yucca Mountain, Nevada: high recharge on the ridgetops and slopes and much lower or no recharge on the valley floors (Flint and others,2000). The high recharge on the ridge tops and side slopes is attributed to the exposure of

38
fractured rocks near the surface that allows water to migrate rapidly with depth andminimizes evapotranspiration.
ConclusionsRegional evaluation of recharge in the Trans Pecos demonstrates that it occurs primarilyin the Diablo Plateau and in the mountains and adjacent areas in Eagle Flat and Red LightBasins and that no recharge occurs in interdrainage areas on the valley floors. Highrecharge on the Diablo Plateau is evidenced by tritium in groundwater. The primaryrecharge mechanism is flow in depressions, such as arroyos through fractured rocks,where soils are thin or absent. Deep migration of water minimizes the amount of time thatthe water resides in the zone of evapotranspiration. High recharge rates in the mountainsand adjacent regions and near bedrock exposures in Eagle Flat and Red Light Basins areshown by high 3H and 14C concentrations. In contrast, deep groundwater in these basinstypically has 0 TU and low concentrations of 14C , indicating old groundwater (20,000 to30,000 yr).
Absence of recharge in the interdrainage areas on the valley floors is evidenced byupward water-potential gradients, high chloride concentrations, evapotranspirativeenrichment of stable isotopes of oxygen and hydrogen, shallow penetration of bomb-pulse tracers during the past 40 to 50 yr, and radioactive decay of 14C . The water-potential profiles may reflect upward water movement for the past several thousand yearsduring the Holocene and suggest long-term drying of the sediments. The bulge-shapedchloride profiles in the Hueco Bolson indicate higher water fluxes during Pleistocenetimes (>10,000 yr), with accumulation of chloride since that time. Some of the chlorideprofiles in the sand-sheet areas of Eagle Flat Basin also showed higher water fluxesduring the Pleistocene; however, most of the chloride profiles in Eagle Flat interdrainageareas did not show any response to Pleistocene climate change, probably because thesediments are too fine grained. The drainage areas of the basin floors did show evidenceof higher water fluxes, which is attributed to ponding of water in these systems. The sizeof the drainage systems is important in affecting water fluxes. Small drainages in theHueco Bolson with low topographic expressions had much higher chloride concentrationsand correspondingly lower water fluxes relative to larger drainages in Eagle Flat Basin(e.g., Blanca Draw). Although water fluxes were expected to be high beneath GraytonLake playa as a result of ponding, the fine-grained sediments in the playa flooreffectively reduce water movement through the floor of the playa.
ReferencesAllison, G. B., 1982, The relationship between 18O and deuterium in water in sand
columns undergoing evaporation: Journal of Hydrology, v. 55, p. 163-169.
Allison, G. B., Stone, W. J. and Hughes, M. W., 1985, Recharge in karst and duneelements of a semi-arid landscape as indicated by natural isotopes and chloride:Journal of Hydrology, v. 76, p. 1-26.

39
Bentley, H. W., Phillips, F. M., and Davis, S. N., 1986, 36Cl in the terrestrialenvironment: in Fritz, P., and Fontes, J.-C., eds., Handbook of environmental isotopegeochemistry, Elsevier Science, New York, p. 422-475.
Craig, H., 1961, Isotopic variations in meteoric waters: Science, v. 133, p. 1702-1703.
Darling, B. K., 1997, Delineation of the ground-water flow systems of the Eagle Flat andRed Light Basins of Trans-Pecos, Texas: The University of Texas at Austin, Ph.D.dissertation, 179 p.
Fabryka-Martin, J. T., Wightman, S. J., Murphy, W. J., Wickham, M. P., Caffee, M. W.,Nimz, G. J., Southon, J. R., and Sharma, P., 1993, Distribution of chlorine-36 in theunsaturated zone at Yucca Mountain�An indicator of fast transport paths: in Focus’93: Site characterization and model validation: American Nuclear Society, LasVegas, Nevada, p. 58-68.
Fisher, R. S., and Mullican, W. F., III, 1990, Integration of ground-water and vadose-zone geochemistry to investigate hydrochemical evolution�a case study in arid landsof the northern Chihuahuan Desert, Trans-Pecos, Texas: The University of Texas atAustin, Bureau of Economic Geology, Geological Circular 90-5, 36 p.
Flint, A. E., Flint, L. E., Hevesi, J. A., D’Agnese, F., and Faunt, C., 2000, Estimation ofregional recharge and travel time through the unsaturated zone in arid climates: inFaybishenko, B., Witherspoon, P. A., and Benson, S. M., (eds., Dynamics of fluids infractured rock: American Geophysical Union, Washington, D.C., p. 115-128.
Gat, J. R., 1981, Groundwater: in Gat, J. R., and Gonfiantini, R., eds., Stable isotopehydrology, deuterium and oxygen-18 in the water cycle: IAEA, Vienna, Austria, p.223-240.
Gustavson, T. C., 1990, Regional stratigraphy and geomorphic evolution of the SouthernHueco Bolson, West Texas and Chihuahua, Mexico: in Kreitler, C. W., and Sharp, J.M., Jr., eds., Hydrology of Trans-Pecos Texas The University of Texas at Austin,Bureau of Economic Geology, Guidebook 25, p. 27-36.
I.A.E.A., 1983, Isotope techniques in the hydrogeological assessment of potential sitesfor the disposal of high-level radioactive wastes: in IAEA Technical Report Ser. 228,chapter 7, p. 57-61.
King, P. B., 1948, Geology of the southern Guadalupe Mountains, Texas: U.S.Geological Survey Professional Paper 215, 183 p.
Kreitler, C. W., Raney, J. A., Mullican, W. F., III, Collins, E. W., and Nativ, R., 1987,Geologic and hydrologic studies of sites HU1A and HU1B in Hudspeth County,Texas: final report prepared for the Low-Level Radioactive Waste Disposal Authorityunder contract no. IAC(86-97)-1061, The University of Texas at Austin, Bureau ofEconomic Geology, 172 p.
Larkin, T. J., and Bomar, G. W., 1983, Climatic atlas of Texas: Texas Department ofWater Resources, 151 p.
Mazor, E., 1991, Applied chemical and isotopic groundwater hydrology: Halsted Press,New York, 274 p.
40
Michel, R. L., 1989, Tritium deposition in the continental United States, 1953-1983: U.S.Geological Survey Water-Resources Investigations Report 89-4072, 46 p.
Phillips, F. M., Mattick, J. L., and Duval, T. A., 1988, Chlorine 36 and tritium fromnuclear weapons fallout as tracers for long-term liquid movement in desert soils:Water Resources Research, v. 24, no. 11, p. 1877-1891.
Prudic, D. E., 1994, Estimates of percolation rates and ages of water in unsaturatedsediments at two Mojave Desert sites, California-Nevada: U.S. Geological SurveyWater Resources Investigation Report 94-4160, 19 p.
Scanlon, B. R., 1992, Environmental and applied tracers as indicators of liquid and vaportransport in the Chihuahuan Desert, Texas: The University of Texas at Austin, Bureauof Economic Geology, Report of Investigations No. 207, 51 p.
Scanlon, B. R., Goldsmith, R. S., and Langford, R. P., 2000, Relationship between aridgeomorphic settings and unsaturated zone flow: case study, Chihuahuan Desert,Texas: The University of Texas at Austin, Bureau of Economic Geology, Report ofInvestigations No. 261, 133 p.
Scanlon, B. R., Wang, F. P., and Richter, B. C., 1991, Field studies and numericalmodeling of unsaturated flow in the Chihuahuan Desert, Texas: The University ofTexas at Austin, Bureau of Economic Geology, Report of InvestigationsNo. 199, 56 p.
Solomon, D. K., and Sudicky, E. A., 1991, Tritium and helium-3 isotopic ratios for directestimation of spatial variations in groundwater recharge: Water Resources Research,v. 27, p. 2309-2319.
Tyler, S. W., Chapman, J. B., Conrad, S. H., Hammermeister, D. P., Blout, D. O., Miller,J. J., Sully, M. J., and Ginanni, J. M., 1996, Soil-water flux in the southern GreatBasin, United States—Temporal and spatial variations over the last 120,000 years:Water Resources Research, v. 32, p. 1481-1499.
Walvoord, M. A., Phillips, F. M., Plummer, M. A., and Wolfsberg, A., 1999, Thick desertvadose zones—What is the equilibrium state? Geological Society of America,Abstracts with Programs, v. 31, no. 7.