chapter 2 literature review -...
TRANSCRIPT

8
CHAPTER 2
LITERATURE REVIEW
Rapidly changing global marketplace calls for improving the
performance of manufacturing organizations by focusing on cost cutting,
increasing productivity levels, maximizing quality and guaranteeing deliveries
in order to satisfy customers (Raouf, 1994). Companies apply different tools
to measure their performance in order to retain a competitive edge in the
market. An empirical study conducted by Anvari and Edwards (2011) showed
that most of the companies need relevant performance measures for a
systematic and an accurate performance measurement. Understanding the
scope and relevance of different performance measures is essential to the
process of integrating the different dimensions of any organizational
performance (Gomes et al 2011). The literature on the topics related to
performance measurement, performance measurement systems, and
maintenance performance measurement system is presented in this chapter.
Also a review on a widely adopted maintenance performance metric, viz.
Overall Equipment Effectiveness (OEE), a measure of Total Productive
Maintenance (TPM) effectiveness, is also presented.
2.1 PERFORMANCE MEASUREMENT
Performance Measurement is defined as the process of quantifying
the efficiency and effectiveness of the past and future activities (Neely 1999).
Major issues related to this field concern what to measure and how to measure
it in a practically feasible and cost-effective way. Measuring performance can
9
provide the status of the variable, compare the data with the target or standard
data and can point out what actions should be taken and where they should be
used for as corrective and preventive measures. Performance measurement is
an absolutely essential operational element in order to lead the organization
towards improvement, guide progress and direct the efforts towards planned
objectives.
Amaratunga and Baldry (2003) described performance
measurement as a process of assessing the progress towards achieving pre-
determined goals, including information on the efficiency by which resources
are transformed into goods and services, the quality of these outputs and
outcomes, and the effectiveness of organizational objectives. Anderson and
Fagerhaug (2002) have listed the reasons for measuring performance, like
providing employees with the feedback on the work carried out which would
help the management make appropriate decisions; helping in implementing
the better strategies and policies for the organization; and using performance
measurement data to monitor the performance trend over time.
Performance measurement is perceived to be a critical management
tool that can help determine a success or a failure in both organizational and
functional performance (Putu et al 2007). It is the language of progress, and
provides a sense of where we are and – more importantly – where we are
going (Sharma and Bhagwat 2007). The performance measurement
framework basically addresses the performance measures in a company and it
needs to be populated by specific metrics in each of their dimensions in order
to be actionable (Unahabhokha et al 2007). Performance measurement of
process essentially involves mapping of the process, measurement of the
performance, undertaking root-cause analysis and bench marking of the
performance (Kobaccy and Murthy 2008).

10
Performance measurement has gained more recognition from
researchers and practitioners over the past two decades (Try and Radnor
2007; Hoque 2008). Performance measurement is the key to improve
productivity, and is a prerequisite to diagnose, trouble-shoot and improve the
manufacturing system (Mathur et al 2011). In order to be successful in the
highly global competitive market, the manufacturing organizations must pay
closer attention to the performance measurement and management processes
(Gomes and Yasin 2011).
2.1.1 Performance Measurement Systems
A Performance Measurement System (PMS) must provide
information that can be used for the formulation of strategies as well as
information about day-to-day performance and therefore include ‘strategic
measures’, which generate knowledge that can be used for the formulation of
strategies and ‘operational measures’, which provide instant feedback on the
implementation of strategies (Feurer and Chaharbaghi 1995). The primary
purpose of the performance measurement system is to prompt behavior and
decision making that will promote the company’s strategy. The design of
performance measurement systems must be independent of the organization
structure and should provide feedback on the performance of business
processes rather than specialized functions (Feurer and Chaharbaghi 1995).
Performance measurement systems are means of gathering data to support and
co-ordinate the process of making decisions and taking action throughout the
organization (Schalkwyk 1998).
The performance measurement literature has advocated the
effective utilization of Performance Measurement Systems as a critical factor
in the road toward competitiveness. Several performance measurement
systems have been proposed over the years. Taylor and Davis (1977)
developed the total factor productivity. Sumanth (1985) proposed a total
11
productivity model that considered the impact of all input factors on the
output in a tangible sense. Total productivity (Schroeder 1985), total
productivity of products (Andersson 1996) and total productivity in the firm
(Slack et al 2001) are some of the measures proposed for performance
measurement.
2.1.2 Performance Measures, Metrics and Indicators
A ‘performance measure’ can be defined as a measure for
quantifying the efficiency and/or effectiveness of the past or future activities,
where as a ‘performance metric’ is the definition of the scope, content and
component parts of a broadly based performance measures (Neely et al 2002).
The characteristics of performance measures include relevance,
interpretability, timeliness, reliability and validity (Al-Turki and Duffuaa
2003). Performance measures provide an essential feedback-loop in the
process of strategic change. However, the learning process is often hampered
as the measurement system provides wrong or incomplete information. This is
because the system in use ignores the existence of different value systems
within the organization.
Traditionally, performance measures have been primarily based on
management accounting systems. This has resulted in most measures focusing
on financial data (i.e. return on investment, return on sales, price variances,
sales per employee, productivity and profit per unit production). Of these
performance measures, productivity has been considered the primary
indicator of performance (Mathur et al 2011).
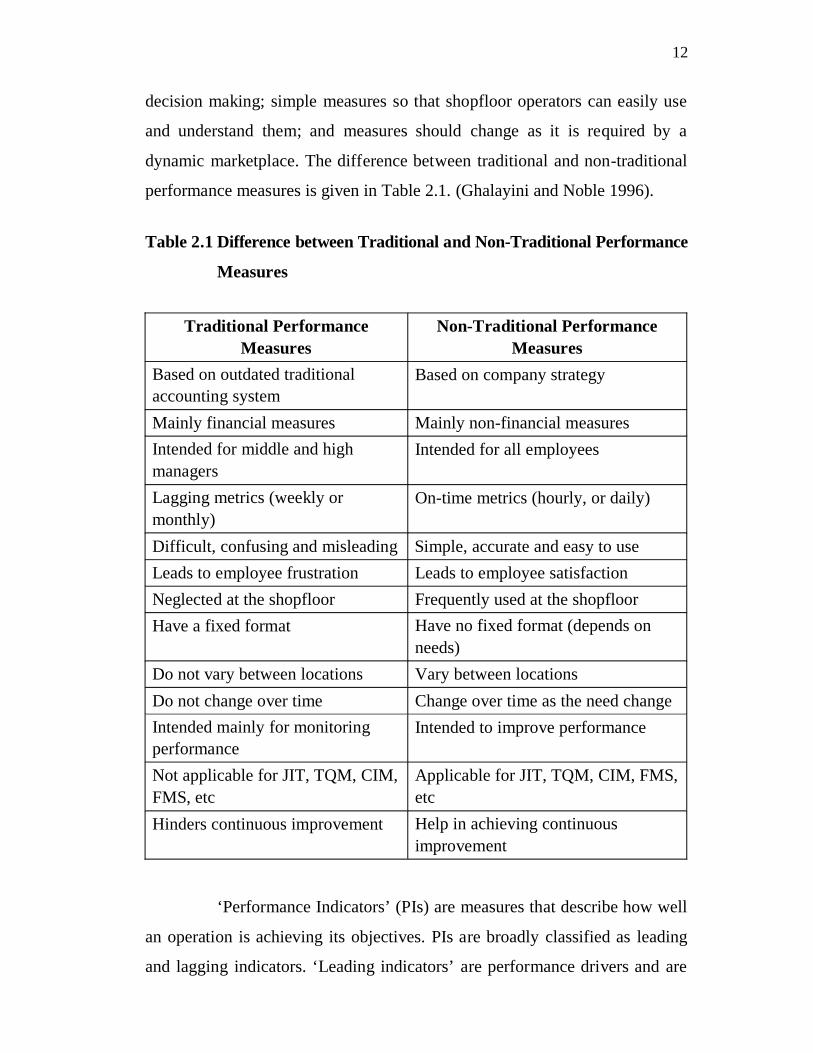
The characteristics of emerging performance measures
(non-traditional) include: measures related to manufacturing strategy;
primarily nonfinancial measures (i.e. operational) and so they can provide
managers, supervisors, and operators with information required for daily
12
decision making; simple measures so that shopfloor operators can easily use
and understand them; and measures should change as it is required by a
dynamic marketplace. The difference between traditional and non-traditional
performance measures is given in Table 2.1. (Ghalayini and Noble 1996).
Table 2.1 Difference between Traditional and Non-Traditional Performance
Measures
Traditional Performance Measures
Non-Traditional Performance Measures
Based on outdated traditional accounting system
Based on company strategy
Mainly financial measures Mainly non-financial measures Intended for middle and high managers
Intended for all employees
Lagging metrics (weekly or monthly)
On-time metrics (hourly, or daily)
Difficult, confusing and misleading Simple, accurate and easy to use Leads to employee frustration Leads to employee satisfaction Neglected at the shopfloor Frequently used at the shopfloor Have a fixed format Have no fixed format (depends on
needs)Do not vary between locations Vary between locations Do not change over time Change over time as the need change Intended mainly for monitoring performance
Intended to improve performance
Not applicable for JIT, TQM, CIM, FMS, etc
Applicable for JIT, TQM, CIM, FMS, etc
Hinders continuous improvement Help in achieving continuous improvement
‘Performance Indicators’ (PIs) are measures that describe how well
an operation is achieving its objectives. PIs are broadly classified as leading
and lagging indicators. ‘Leading indicators’ are performance drivers and are
13
used for understanding the present status and taking corrective measures to
achieve the desired target. A leading indicator is of the non-financial and
statistical type that fairly and reliably predicts in advance
(Kobaccy and Murthy 2008). A leading indicator thus works as a performance
driver and ascertains the present status in comparison with the reference
indicator level. For example, in maintenance, condition monitoring indicators
such as vibration and noise can be ‘leading indicators’. ‘Lagging indicators’
are outcome measures and provide basis for studying the deviations after
completion of the activities. Cost of maintenance and mean time between
failures are few examples of ‘lagging indicators’ (Kobaccy and Murthy 2008).
2.2 MAINTENANCE PERFORMANCE MEASUREMENT
Maintenance is normally perceived to have a poorer rate of return
than any other major budget item. Yet, most companies can reduce
maintenance costs by at least one-third, and improve the level of productivity,
by giving maintenance the management priority it requires. That priority must
span all levels of an organization’s management structure to develop an
understanding at each level of the significance maintenance can have upon the
success or failure of organization objectives (Al-Hassan et al 2000).
Maintenance Performance Measurement (MPM) is the process of
measuring maintenance performance, to know how well the maintenance
process is performing and to identify the opportunities for improvement.
Maintenance performance measurement is a complex task involving
measurement of varying inputs and multiple outputs of the maintenance
process (Parida et al 2003; Kobaccy and Murthy 2008). In a MPM system,
data are collected, analyzed and relevant information extracted for a timely
decision making. The data from the measurement tells the status of the job
carried out and the action to be taken thereafter, and to indicate where those
actions should be targeted. The measurement of maintenance performance has

14
become an essential element of the strategic thinking of assets owners and
managers. Moreover, without having a formal measurement system for
performance, it is difficult to plan, control and improve the maintenance
process (Ahren and Parida 2009).
2.2.1 Maintenance Performance Indicator
Maintenance performance indicator (MPI) is used for the
measurement of maintenance performance, as a performance indicator is
precisely an indicator of performance (Wireman 1998). A MPM system
includes all related maintenance performance indicators and their
interrelationship within the whole maintenance process.
Maintenance performance indicators can act as an early warning
system for operation and maintenance process, indicating the present status of
the process, so as to enable evaluation, prediction and corrective action. MPIs
identify the weak spots in the maintenance process, which can be analyzed
further to specify the problem and ultimately find a solution for best practices.
Therefore, it is important that the MPIs in use should be clearly defined,
explained, and standardized so that they may be interpreted by every
employee as conveying the same meaning (Ahren and Parida 2009). There are
a large number of MPIs used by different industries which need to be
carefully identified and selected to meet the specific requirements of the
organization (Kobaccy and Murthy 2008).
Besides the four perspectives (customer, financial, internal
processes, and innovation and learning) of Kaplan and Norton (1992), three
more criteria like Health, Safety and the Environment (HSE), Employee’s
Satisfaction and Plant/Equipment related indicators are considered and
included in the MPM framework by Parida and Kumar (2006).
‘Plant/ Equipment related indicators’ measure the performance pertaining to

15
the plant and equipment of the organizations. These MPIs provide relevant
information to the management at different hierarchical level for appropriate
decision making. Some of these MPIs considered under this criterion as listed
by Kobaccy and Murthy (2008) are given below:
Availability: This is represented by the percentage of the plant
availability used for manufacturing/production and this is
calculated as the ratio of the mean time to failure (MTTF) to the
total time, i.e. MTTF plus mean time to repair (MTTR).
Performance (output per hour): This MPI indicates the speed
of production and is expressed as a percentage of the
production/ performance speed.
Quality: This MPI refers to the quality of the product/service.
This is the percentage of good products produced out of the total
number of parts produced.
Number of minor and major stops: This indicator is the
number of stops, either minor or major. Stoppages can also be
quantified in time (hours and minutes)
Down-time for the number of minor and major stops: This is
expressed in hours and minutes for the total number of stops or
for each minor and major stop.
Rework: Rework due to maintenance lapses (for example, not
sharpening the tools) expressed in time (hours and minutes), the
number of pieces on which rework has been carried out and the
cost of the rework undertaken (Kobaccy and Murthy 2008).
The ‘Maintenance related indicators’ show the efficiency and
effectiveness of the maintenance department of the organization. Some of
16
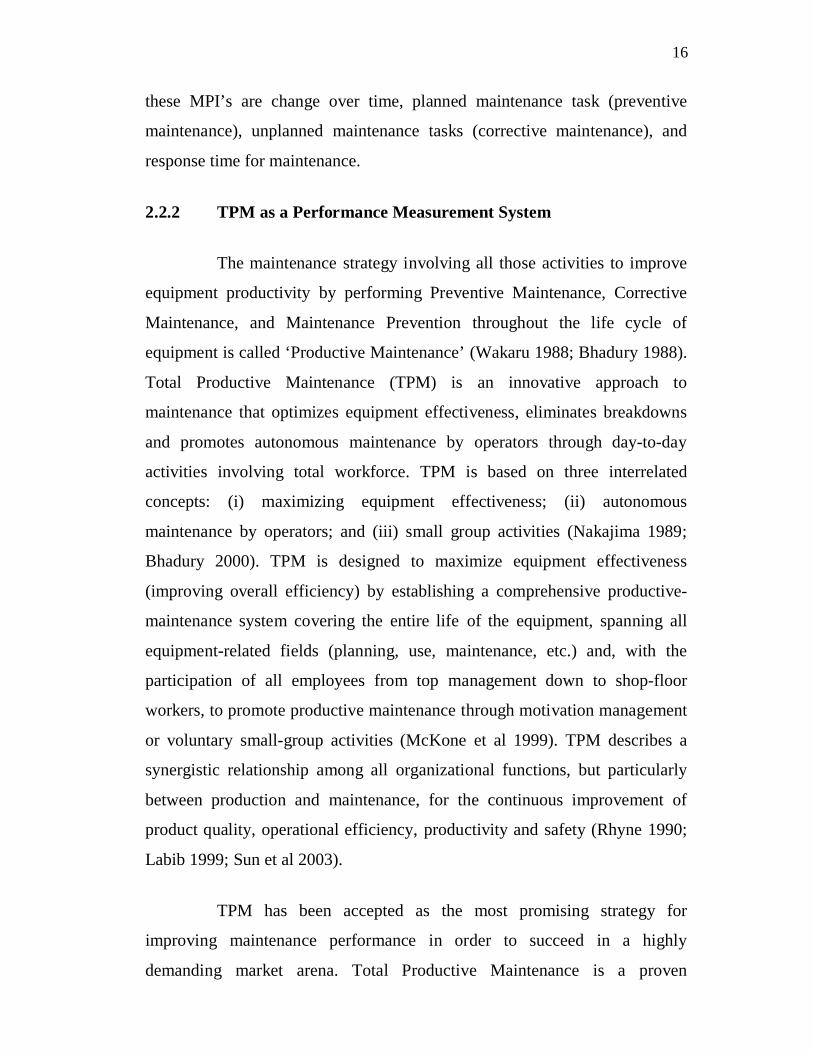
these MPI’s are change over time, planned maintenance task (preventive
maintenance), unplanned maintenance tasks (corrective maintenance), and
response time for maintenance.
2.2.2 TPM as a Performance Measurement System
The maintenance strategy involving all those activities to improve
equipment productivity by performing Preventive Maintenance, Corrective
Maintenance, and Maintenance Prevention throughout the life cycle of
equipment is called ‘Productive Maintenance’ (Wakaru 1988; Bhadury 1988).
Total Productive Maintenance (TPM) is an innovative approach to
maintenance that optimizes equipment effectiveness, eliminates breakdowns
and promotes autonomous maintenance by operators through day-to-day
activities involving total workforce. TPM is based on three interrelated
concepts: (i) maximizing equipment effectiveness; (ii) autonomous
maintenance by operators; and (iii) small group activities (Nakajima 1989;
Bhadury 2000). TPM is designed to maximize equipment effectiveness
(improving overall efficiency) by establishing a comprehensive productive-
maintenance system covering the entire life of the equipment, spanning all
equipment-related fields (planning, use, maintenance, etc.) and, with the
participation of all employees from top management down to shop-floor
workers, to promote productive maintenance through motivation management
or voluntary small-group activities (McKone et al 1999). TPM describes a
synergistic relationship among all organizational functions, but particularly
between production and maintenance, for the continuous improvement of
product quality, operational efficiency, productivity and safety (Rhyne 1990;
Labib 1999; Sun et al 2003).
TPM has been accepted as the most promising strategy for
improving maintenance performance in order to succeed in a highly
demanding market arena. Total Productive Maintenance is a proven

17
manufacturing strategy that has been successfully employed globally for the
past three decades, for achieving the organizational objectives of achieving
core competence in the competitive environment (Ahuja et al 2004). TPM has
been widely recognized as a strategic weapon for improving manufacturing
performance by enhancing the effectiveness of production facilities
(Dossenbach 2006).
2.2.2.1 Need for TPM in Manufacturing Scenario
According to Nakajima (1988), Total Productive Maintenance
when implemented fully, dramatically improves productivity and quality, and
reduces costs. TPM is not a maintenance specific policy; it is a culture, a
philosophy and a new attitude towards maintenance (Chowdhury 1995). It is a
system that takes advantage of the abilities and skills of all individuals in an
organization (Patterson et al 1995). TPM is an innovative approach to plant
maintenance that is complementary to Total Quality Management, Just-in-
Time Manufacturing, Total Employee Involvement, Continuous Performance
Improvement, and other world-class manufacturing strategies (Schonberger
1996; Ollila and Malmipuro 1999; Cua et al 2001). TPM also succeeded well
in making maintenance into an overall company-wide issue, by focusing on
continuous improvements, autonomous small group activities, training,
education, communication and the flow of information (Jonsson 1997).
One of the main aims of TPM is to increase the productivity of
plant with only a modest investment in maintenance (Al-Hassan et al 2000).
The emergence of TPM is intended to bring both production and maintenance
functions together by a combination of good working practices, team-working
and continuous improvement (Cooke 2000). The study conducted by Brah
and Chong (2004) focused on gaining insights into the impact of TPM on the
performance of the organization. There is a support for a positive correlation
between TPM and business performance.

18
Total productive maintenance is a methodology that aims to
increase the availability of existing equipment hence reducing the need for
further capital investment. Investment in human resources can further result in
better hardware utilization, higher product quality and reduced labour costs
(Chan et al 2005). Ahmed et al (2005) stated that a well drawn TPM
implementation plan not only improves equipment efficiency and
effectiveness but also brings appreciable improvements in other areas such as
reduction of manufacturing cycle time, size of inventory, customer
complaints, and creates cohesive small group autonomous teams and
increases the skill and confidence of individuals. TPM not only leads to
increase in efficiency and effectiveness of manufacturing systems, measured
in terms of OEE index, by reducing the wastages but also prepares the plant to
meet the challenges put forward by globally competing economies to achieve
world class manufacturing status. (Sharma et al 2006; Dossenbach 2006).
With the achievements of zero breakdowns, zero accidents and zero defects,
operators get new confidence in their own abilities and the organizations also
realize the importance of employee contributions towards the realization of
manufacturing performance (Ahuja and Khamba 2008).
2.2.3 OEE as a Maintenance Performance Measure
Due to intense global competition, companies are striving to
improve and optimize their productivity in order to stay competitive. This
situation has led to the need for more rigorously defined productivity metrics
that are able to take into account several important factors, such as equipment
availability (breakdowns, set-ups and adjustments), performance (reduced
speed, idling and minor stoppages), and quality (defects, rework and yield)
(Dal et al 2000). Campbell (1995) has classified the commonly used measures
of maintenance performance into three categories on the basis of their focus;
viz. measures of equipment performance – e.g. availability, reliability, overall
19
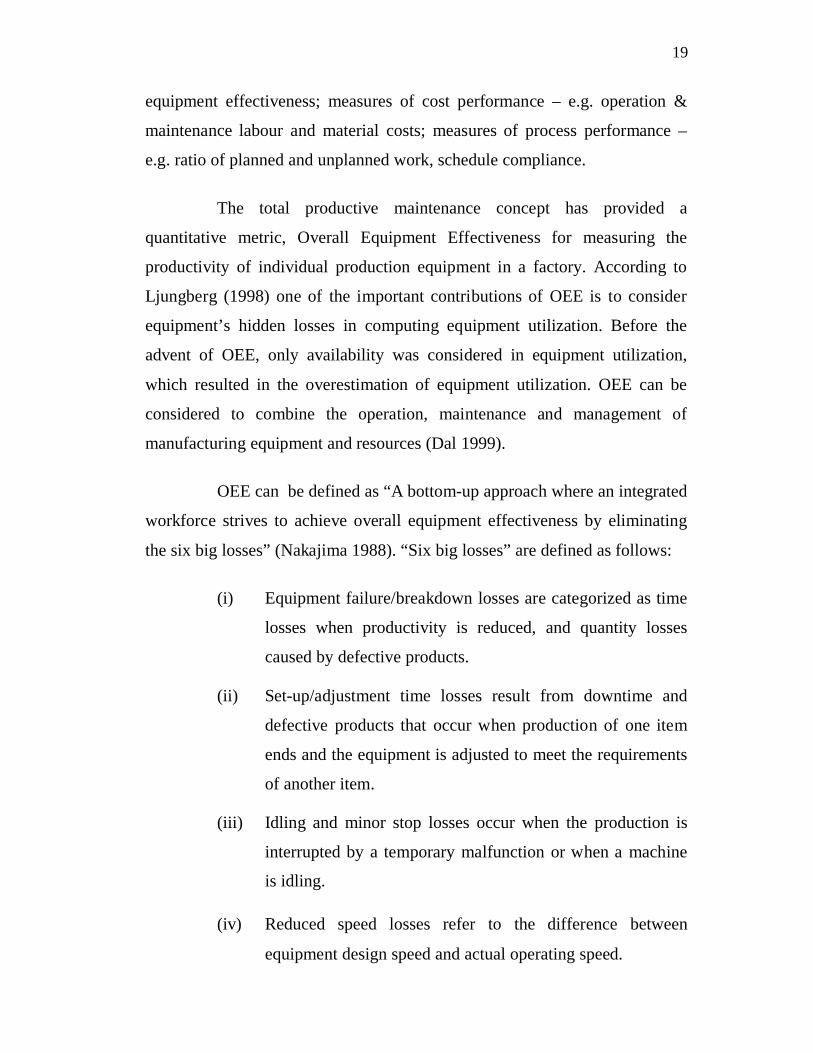
equipment effectiveness; measures of cost performance – e.g. operation &
maintenance labour and material costs; measures of process performance –
e.g. ratio of planned and unplanned work, schedule compliance.
The total productive maintenance concept has provided a
quantitative metric, Overall Equipment Effectiveness for measuring the
productivity of individual production equipment in a factory. According to
Ljungberg (1998) one of the important contributions of OEE is to consider
equipment’s hidden losses in computing equipment utilization. Before the
advent of OEE, only availability was considered in equipment utilization,
which resulted in the overestimation of equipment utilization. OEE can be
considered to combine the operation, maintenance and management of
manufacturing equipment and resources (Dal 1999).
OEE can be defined as “A bottom-up approach where an integrated
workforce strives to achieve overall equipment effectiveness by eliminating
the six big losses” (Nakajima 1988). “Six big losses” are defined as follows:
(i) Equipment failure/breakdown losses are categorized as time
losses when productivity is reduced, and quantity losses
caused by defective products.
(ii) Set-up/adjustment time losses result from downtime and
defective products that occur when production of one item
ends and the equipment is adjusted to meet the requirements
of another item.
(iii) Idling and minor stop losses occur when the production is
interrupted by a temporary malfunction or when a machine
is idling.
(iv) Reduced speed losses refer to the difference between
equipment design speed and actual operating speed.

20
(v) Reduced yield occurs during the early stages of production
from machine start up to stabilization.
(vi) Quality defects and rework are losses in quality caused by
malfunctioning production equipment.
The first two big losses are known as downtime losses and are used
to help calculate a true value for the availability of a machine. The third and
fourth big losses are speed losses that determine the performance efficiency of
a machine, i.e. the losses which occur as a consequence operating at less than
the optimum conditions. The final two losses are considered to be losses due
to defects, the larger the number of defects the lower the quality rate of parts
within the factory.
Availability Rate (%) = (Operation time / loading time) x 100
Where
Operation time = loading time – down time
Performance Rate (%) = (Net operating rate x Operating speed
rate) x 100
Where
Net operating rate = (Processed Quantity x Actual cycle time) /
Operation time
Operating speed rate = Ideal cycle time / Actual cycle time
Quality Rate = (Total quantity produced – Quantity
scrapped) / (Total quantity produced) x 100
The concept of OEE is becoming increasingly popular and has been
widely used as a quantitative tool essential for measurement of productivity

21
(Huang et al 2003). Overall equipment effectiveness (OEE) is used as a key
performance indicator for the manufacturing industry in its continuous search
for new ways to reduce downtime, costs and waste, to operate more
efficiently, and to achieve greater capacity. OEE is a measurement tool to
evaluate equipment corrective action methods and ensure permanent
productivity improvement. OEE can be used as a ‘benchmark’ for measuring
the initial performance of a manufacturing plant in its entirety. In this manner
the initial OEE measure can be compared with future OEE values, thus
quantifying the level of improvement made (Nachiappan and Anantharaman
2006).
Dal et al (2000) presented a practical analysis of operational
performance measurement in an automotive industry and the potential
benefits of developing OEE as an operational measure. A new loss
classification by Jeong and Phillips (2001) scheme for computing the overall
equipment effectiveness is presented for capital intensive industry. Based on
the proposed loss classification scheme, a new interpretation of OEE
including state analysis, relative loss analysis, lost unit analysis and product
unit analysis is attempted. A methodology is presented for constructing a data
collection system and developing the total productivity improvement visibility
system to implement the proposed OEE and related analyses.
The study carried out by Bamber et al (2003) presented OEE as a
total measure of performance that relates the availability of the process to the
productivity and quality of the product. And it is stated that OEE measure is
appropriate to all operations performed in any plant and machinery.
Kwon and Lee (2004) proposed a new methodology to calculate the
total saving monetary amount composed of contribution profit and saving
costs that are obtained by improving the overall equipment efficiency of
processing type equipment. Nachiappan and Anantharaman (2006) presented
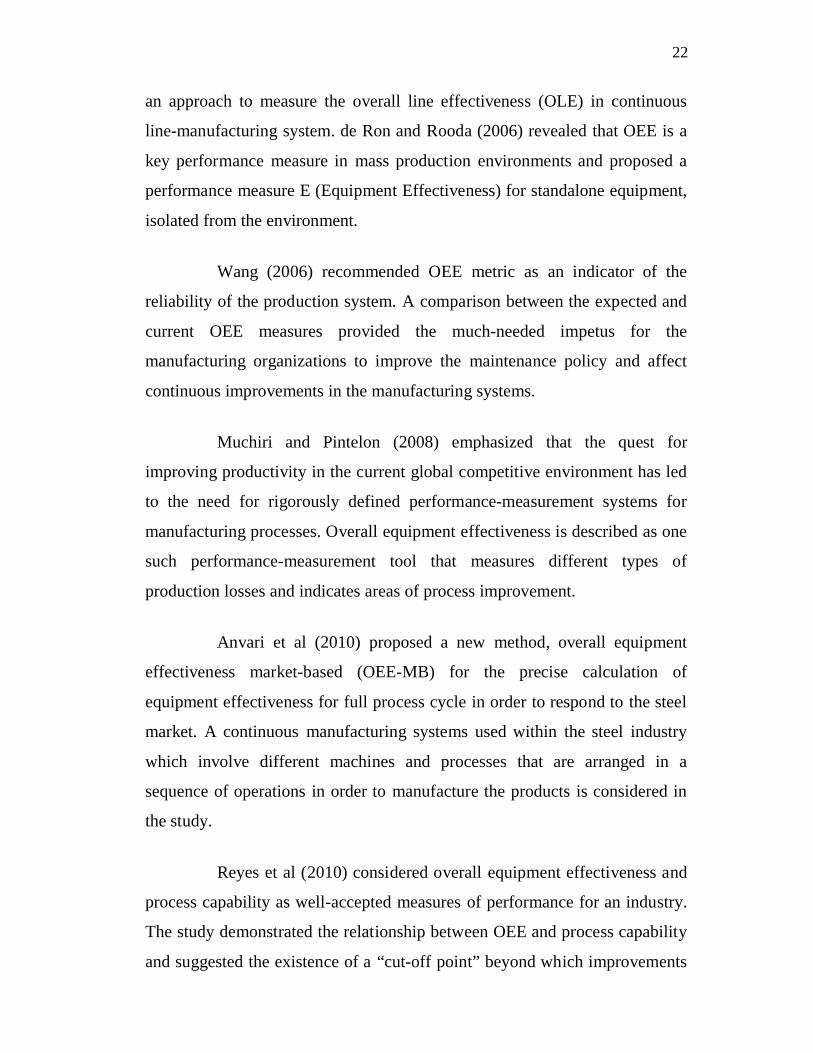
22
an approach to measure the overall line effectiveness (OLE) in continuous
line-manufacturing system. de Ron and Rooda (2006) revealed that OEE is a
key performance measure in mass production environments and proposed a
performance measure E (Equipment Effectiveness) for standalone equipment,
isolated from the environment.
Wang (2006) recommended OEE metric as an indicator of the
reliability of the production system. A comparison between the expected and
current OEE measures provided the much-needed impetus for the
manufacturing organizations to improve the maintenance policy and affect
continuous improvements in the manufacturing systems.
Muchiri and Pintelon (2008) emphasized that the quest for
improving productivity in the current global competitive environment has led
to the need for rigorously defined performance-measurement systems for
manufacturing processes. Overall equipment effectiveness is described as one
such performance-measurement tool that measures different types of
production losses and indicates areas of process improvement.
Anvari et al (2010) proposed a new method, overall equipment
effectiveness market-based (OEE-MB) for the precise calculation of
equipment effectiveness for full process cycle in order to respond to the steel
market. A continuous manufacturing systems used within the steel industry
which involve different machines and processes that are arranged in a
sequence of operations in order to manufacture the products is considered in
the study.
Reyes et al (2010) considered overall equipment effectiveness and
process capability as well-accepted measures of performance for an industry.
The study demonstrated the relationship between OEE and process capability
and suggested the existence of a “cut-off point” beyond which improvements

23
in process capability have little impact on OEE. Zammori et al (2011) have
proposed the use of OEE as a key performance indicator typically adopted to
support Lean Manufacturing and Total Productive Maintenance.
Zuashkiani et al (2011) have found that the significant returns on
small improvements in OEE justify investment in the management of physical
assets, but the wide variation of OEE across firms raises a question regarding
the differences persist despite a high return on investments to maximize OEE.
2.2.3.1 Issues in OEE Study
The OEE metric considered the effect of three factors viz.
equipment availability (breakdowns, set-ups and adjustments); equipment
performance (reduced speed, idling and minor stoppages); and output quality
(defects, rework and yield). According to Nakajima (1989), speed losses are
much larger in equipment such as automated machinery, automated
assemblers and automated packers. Idling and minor stoppages stands for
20-30 per cent of OEE in most automated lines (Suehiro 1992). Ericsson and
Dahlen (1993) stated that over 80 per cent of the measured disruption in
manufacturing is due to machine downtime.
Different opinions appear to exist within the OEE literature as to
what levels of availability, performance efficiency and quality constitute
acceptable levels of OEE performance. This reflects the difference in potential
OEE achievement across different business sectors and industries.
Ljungberg (1998) expressed that in the literature there is no general
agreement on the magnitude of different types of losses, nor on the reasons
for losses. The need for enterprises to measure losses is to find causes for
major losses and use this information as a basis for remedies. It is therefore,

24
important to know the extent of different types of losses and the reasons for
losses.
Nakajima (1989) mentioned that under ideal conditions the world
class companies should have Availability > 0.90, Performance > 0.95 and
Quality > 0.99, and OEE > 0.84. Kotze (1993), on the other hand, argued that
an OEE less than 0.50 is more realistic. This value corresponds to the
summary of different OEE measurements presented by Ericsson (1997),
where OEE varies between 0.30 and 0.80. Ljungberg (1998) reported OEE
values between 60 percent and 75 percent. These values indicate the
difficulties of comparing OEE between processes (Jonsson and Lesshammar
1999).
The OEE measure can be used in all types of systems, but it is
considered most applicable in decentralized organizations with clear
bottom-up approaches (Jonsson and Lesshammar 1999). Owing to different
definitions of OEE and other varying circumstances between companies, it is
difficult to identify optimum OEE values and to compare OEE between the
firms (Dal et al 2000).
According to Chan et al (2005), OEE is best suited to environments
of high volume process based manufacture where capacity utilization is of a
high priority, and stoppages or disruptions are expensive in terms of lost
capacity. There appears to be little empirical evidence of OEE being deployed
within the batch manufacturing environments.
Though the OEE tool has become increasingly popular and has
been widely used as a quantitative tool essential for measurement of
productivity, it is only limited to productivity behaviour of individual
equipments (Huang et al 2003). Moreover the definition of OEE does not take

25
into account all factors that reduce the capacity utilization, e.g. planned
downtime, lack of material input, lack of labour etc (de Ron and Rooda 2006).
2.2.4 Other Performance Measures
Mathur et al (2011) have stated that the six losses originally
identified with the OEE metric have been expanded to cover a range of other
losses in differing circumstances, and OEE as an effectiveness tool has
evolved over time and usage to cover not only individual equipment, but also
systems of equipment, leading to its acquiring several names, such as
Production Equipment Effectiveness (PEE), Total Equipment Effectiveness
Performance (TEEP), Overall Throughput Effectiveness (OTE), Overall
Factory Effectiveness (OFE), Overall Line Effectiveness (OLE), Overall
Asset Effectiveness (OAE), Overall Plant Effectiveness (OPE), Overall
Equipment Effectiveness of a Manufacturing Line (OEEML).
Production Equipment Effectiveness (PEE) formulated by Raouf
(1994), is similar to OEE. The main difference is the allocation of weights to
the various items in the overall effectiveness. It assumes that quality has a
different weight from performance and different to availability contrary to the
basic assumption in OEE that the three elements have the same weight. It also
makes a distinction between two different types of production operations, viz.
discrete-type production operations and continuous process operation.
Total Equipment Effectiveness Performance (TEEP) proposed by
Ivancic (1998), is very similar to OEE. The main difference lies in the
inclusion of planned downtime in the total planned time horizon. In order to
show clearly how maintenance contributes to the bottom line productivity of
the plant, a clear distinction is made between planned downtime and
unplanned down time. The TEEP measure, like OEE is limited to equipment-
level productivity.
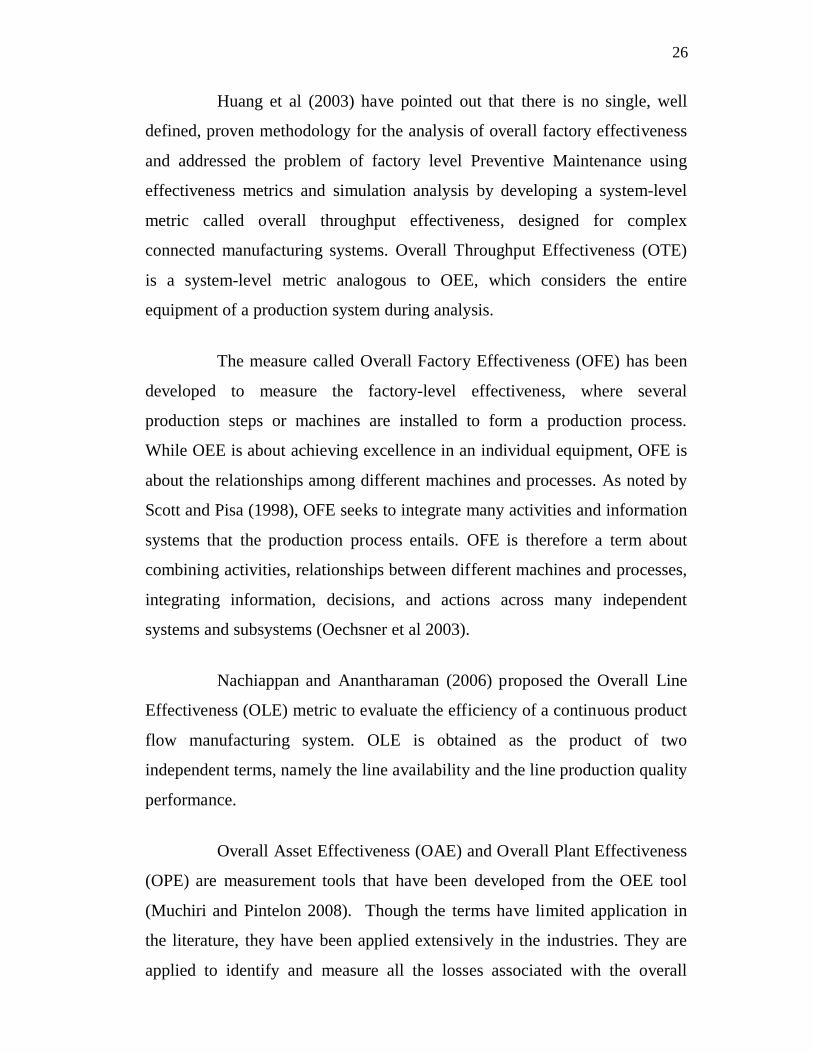
26
Huang et al (2003) have pointed out that there is no single, well
defined, proven methodology for the analysis of overall factory effectiveness
and addressed the problem of factory level Preventive Maintenance using
effectiveness metrics and simulation analysis by developing a system-level
metric called overall throughput effectiveness, designed for complex
connected manufacturing systems. Overall Throughput Effectiveness (OTE)
is a system-level metric analogous to OEE, which considers the entire
equipment of a production system during analysis.
The measure called Overall Factory Effectiveness (OFE) has been
developed to measure the factory-level effectiveness, where several
production steps or machines are installed to form a production process.
While OEE is about achieving excellence in an individual equipment, OFE is
about the relationships among different machines and processes. As noted by
Scott and Pisa (1998), OFE seeks to integrate many activities and information
systems that the production process entails. OFE is therefore a term about
combining activities, relationships between different machines and processes,
integrating information, decisions, and actions across many independent
systems and subsystems (Oechsner et al 2003).
Nachiappan and Anantharaman (2006) proposed the Overall Line
Effectiveness (OLE) metric to evaluate the efficiency of a continuous product
flow manufacturing system. OLE is obtained as the product of two
independent terms, namely the line availability and the line production quality
performance.
Overall Asset Effectiveness (OAE) and Overall Plant Effectiveness
(OPE) are measurement tools that have been developed from the OEE tool
(Muchiri and Pintelon 2008). Though the terms have limited application in
the literature, they have been applied extensively in the industries. They are
applied to identify and measure all the losses associated with the overall
27
production process. The two terms have the same meaning with regard to
industrial application. However, the elements or losses measured differed
from industry to another. Production losses are measured by measuring either
time losses or production output losses.
Braglia et al (2009) suggested that when machines operate jointly
in a manufacturing line, OEE alone is not sufficient to improve the
performance of the system as a whole and a new metric called Overall
Equipment Effectiveness of a Manufacturing Line (OEEML) should be
considered.
2.2.5 Factors Related to Measures of Performance
The various factors considered in the past by researchers while
studying the measures of performance such as productivity and technological
measures and other manufacturing performance dimensions including overall
equipment effectiveness are presented in this section. The influence of factors
on performance, productivity, safety and various other parameters are
discussed. Chakrabarti (1984) explored the critical factors which affect the
technological innovation process and their policy implications. Some general
guidelines for policy making purposes are examined. Hunt and Pomykalski
(1985) considered the factors affecting technological innovation such as
economic conditions, size of market, sources of finance, patents and licensing.
Hawaleshka and Mohamed (1987) evaluated the productivity and
technology measures in manufacturing industries and explored a relationship
between Total Operational Productivity (TOP) and Technology Factor Index
(TFI) for productivity improvement. The study based on a Canadian Metal
Fabricating Industry is used to illustrate the applicability and workability of
the developed models. Seidel and Arndt (1988) have identified various factors

28
affecting productivity, which includes technological, organizational,
psycho1ogical, historical, social, educational and economic factors.
Shirose (1996) observed that other than equipment related losses,
the losses affecting human performance and yield inefficiencies also need to
be accounted appropriately for achieving world-class performance. Strategies
for reducing the impact of the losses, or eliminating the losses from the
manufacturing systems have been proposed. The study identified 16 major
losses that affect the manufacturing performance and efficiency. These losses
have been classified into four categories, which include seven major losses
impeding equipment efficiency (failure losses, setup/adjustment losses,
reduced speed losses, idling/minor stoppage losses, defect/rework losses,
start-up losses, and tool changeover losses), losses that impede machine
loading time (planned shutdown losses), five major losses that impede human
performance (distribution/logistic losses, line organization losses,
measurement/adjustment losses, management losses and motion related
losses) and three major losses that impede effective use of production
resources (yield losses, consumable – jig/tool/die losses, and energy losses).
Nti and Dompere (1997) analyzed the employment and investment
demands of the competitive firm when technological progress embodied in
new investment goods is a source of productivity improvements. Tuijl et al
(1997) proposed methods of measuring and enhancing organizational
productivity by means of Productivity Measurement and Enhancement
System (ProMES). Schmidt and Kleinbeck (1997) discussed the relationships
between the ProMES and several context factors that have proven to be
critical in the process of developing and implementing this system. The
factors addressed are existing pay systems, supervisory behaviour, and the
nature of group tasks combined with types of feedback and goals.
29
Clegg et al (1997) conducted a performance study and the role of
human and organizational factors in information technology. The context of
technical change, the ways in which information technology is developed and
implemented, a range of human and organizational factors, and the roles of
managers and end-users, are identified as critical areas affecting performance.
Rundmo et al (1998) studied how job stress, physical working
conditions, commitment and involvement in safety work, and attitudes
towards safety and accident prevention work among employees on offshore
petroleum platforms have changed during a short period (1990-1994) among
offshore oil personnel. Luczak and Mjema (1999) analyzed the factors
affecting personnel capacity requirement in maintenance department. The
main factors affecting the capacity requirement are determined and
quantitatively analyzed. This quantitative analysis is conducted by means of
simulation modelling using a simulation package SIMPLE++ and an
empirical data collection.
Jayaram et al (1999) studied the impact of human resource
management practices on manufacturing performance and found that four
priority-specific human resource management factors like quality, flexibility,
cost and time are strongly related to their respective manufacturing
performance dimensions. Jung et al (2001) have discussed about the
measurement of corporate environmental performance, and its application to
the analysis of efficiency in the petroleum firms. A framework called
‘Gscore’ is proposed to measure corporate environmental performance based
on voluntary environment, health, and safety report and is calculated by
aggregating the points of the above five-categories.
Toriizuka (2001) proposed a performance shaping factor (PSF) for
work improvement in industrial plant maintenance tasks. The study was
carried out not only from the standpoint of human reliability but also from the
30
viewpoint of work efficiency and workload. Tien et al (2002) investigated
Taiwan’s industries to identify the characteristics of companies, viz. the use
of raw materials, use of energy, design for recyclability, product life cycle
assessment, and packaging optimization. Roberts and Bellotti (2002)
proposed a general framework for analyzing the impact of various managerial
strategies on the industrial Research and Development (R&D) performance.
Multifaceted measures of R&D impact are evaluated and important
differences among the strategies that most affect each performance measure
are indicated.
Pullig et al (2002) carried out an exploratory examination of
organizational factors associated with effective implementation and salesforce
productivity. Results suggested that an appropriate implementation climate
includes sufficient training, encouragement, facilitative leadership, and
organizational support. The study further indicated that an effective
implementation may lead to enhanced productivity through better account
prospecting, development, and buyer profiling. The study carried out by
Jensen (2002) showed that human factors and ergonomic considerations
should be integrated into the production planning processes, but it is seldom
the case in practice. An overview of the tools developed and discussed in the
Scandinavian countries is presented.
Gomez (2004) studied the influence of environmental,
organizational, and Human Resource Management (HRM) factors on
employee behaviors in subsidiaries in Mexico. The case study pointed to the
importance of the human resource management practices as a mechanism that
facilitates the implementation of management strategies in subsidiaries.
Shikdar and Das (2003) investigated the manner by which production
standards or goals, performance or production feedback and monetary or

31
wage incentive affected the relationship between worker satisfaction and
productivity in a repetitive production task in a fishing industry.
Zilahy (2004) identified the organizational factors determining the
implementation of cleaner production measures. Zwick (2004) measured the
productivity impact of shop-floor employee involvement. On the basis of a
representative German establishment data set, the study revealed that the
introduction of teamwork and autonomous work groups, significantly
increased average establishment productivity.
Strandholm et al (2004) examined the interrelationships among
perceived environmental change, strategic response, managerial
characteristics, and organizational performance. It is found that organizations
which are able to achieve the alignment among perceived environmental
change–strategic adaptive response–managerial characteristics exhibit
superior performance in terms of a variety of performance outcomes as
compared to organizations where such alignment is lacking. Pattnayak and
Thangavelu (2005) studied the effects of the economic reforms in the year
1991 and productivity growth in Indian manufacturing industries and
observed total factor productivity (TFP) improvements for most of the
industries after the 1991 reform initiatives.
Karjalainen et al (2005) determined the causes of labour
productivity improvement in the Finnish machine and metal product
manufacturing industry. Hamamoto (2006) attempted to provide empirical
evidence on the effect of the stringency of environmental regulations on
innovative activity and the productivity enhancement effect of environmental
regulations in Japanese manufacturing industries. It is found that increases in
R&D investment stimulated by the regulatory stringency have a significant
positive effect on the growth rate of total factor productivity.

32
The study conducted by Bon and Merunka (2006) aimed to
understand how salespeople's motivation and effort to gather and transmit
marketing intelligence to management may be influenced by individual
(organizational commitment, desire for upward mobility) and managerial
(control system, participation in decision making, feedback, recognition)
factors. Other than participation in decision making, all the managerial factors
play influential roles in structuring both motivation and behavioral effort
toward marketing intelligence by salespeople.
Bruzzone et al (2007) evaluated the impact of different human
factor models on industrial and business processes. The study provided also
real cases as support for validation of the proposed approach. Sola and Xavier
(2007) presented a study aimed at verifying the correlation between
organizational human factors (OHF) and the level of energy losses in
organizations. The research is carried out in ten industries of the following
sectors: pulp and paper; food; wood and chemical products.
Arocena et al (2008) analyzed the impact of risk prevention
practices and organizational factors on occupational injuries. These consist of
occupational safety measures, orientation of risk prevention, implementation
of quality management tools, enhancing of workers empowerment, and the
use of flexible production technologies. The results showed that the emphasis
on the intensive use of quality management tools, and the empowerment of
workers are factors contributing to reduce the number of injuries.
Wang et al (2008) investigated the effects of different
organizational environment settings on the employee technostress levels. The
results showed that the employees from more centralized companies often
perceive more technostress and in organizations that are both highly
centralized and highly innovative, the overall technostress level is the highest.

33
On the other hand, in organizations with low centralization and low
innovation, technostress is the lowest.
Kerr et al (2008) examined the effectiveness of human factors
initiatives and addressed some difficulties reported in calculating the value of
such interventions. Kraemer et al (2009) carried out a study to identify how
human and organizational factors may be related to technical computer and
information security vulnerabilities. The factors considered are external
influences, human error, management, organization, performance and
resource management, policy issues, technology, and training.
Liu et al (2009) introduced a ‘human error cost estimation model’
to facilitate the production managers with a proper tool to calculate the total
losses of its impact on the manufacturing environment. Becker et al (2009)
analyzed the impact of technological and organizational implementation of
customer relationship management (CRM) on customer acquisition,
maintenance, and retention.
Azorin et al (2009) examined the relationship between
environmental practices and firm performance in a Spanish hotel industry
using cluster analysis and regression analysis. The findings showed that
environmental practices impact significantly on several performance
variables. Gonzalez (2009) focused on the determinants for environmental
technological change in small and medium size enterprises which include
cross-sectoral technologies, barriers to different types of environmental
technologies, international dimension of environmental technological change
and several issues related to the environmental policy variable.
Su et al (2009) stressed the importance of enhancing employee
organizational commitment (EOC) and its positive impact on employees’ job
performance, reducing absenteeism and turnover rates, and improving
34
employees’ adaptability to organizational change. The study examined the
association between cultural, organizational, and demographic factors with
the level of EOC in a Australian manufacturing industry. Dolage et al (2010)
investigated the influence of the adoption of Flexible Manufacturing
Technology (FMT) on the Total factor Productivity Growth (TFPG) of a
Malaysian Manufacturing Industry. The study provided sufficient evidence to
conclude that FMT has a direct and moderately significant relationship with
TFPG.
Soriano (2010) analyzed high-technology firms within the
European Union to determine the management factors that influence
performance through business productivity. The study examined six different
factors from the areas of production and technology, human resources,
strategy and marketing. The results indicated a direct relation between
productivity and factors such as private borrowing, dynamism or using price
as a strategic factor.
Schonbeck et al (2010) presented a new approach to address human
and organizational factors which affect the performance of safety
instrumented systems during operation and may threaten the achieved safety
integrity level (SIL). The study conducted by Ruan and Gopinath (2010) used
a monopolistic competition model to investigate the effects of international
technological convergence on factor rewards, output composition, and welfare
in manufacturing industries.
Ryan et al (2011) have investigated work at the interface between
human factors and operational research in the case example of road
resurfacing work. Descriptive material on the factors affecting performance in
road maintenance work is collected with support from a range of human
factors-based methods and is used to inform operational research analyses.
Shan et al (2011) studied the impact of management practices on mechanical
35
construction productivity. The findings showed that the implementation of
several management programmes, including pre-project planning, team
building, automation and integration of information systems and safety had a
positive correlation with improved mechanical productivity.
Cainelli et al (2011) analyzed the impact of environmentally
oriented innovative strategies on firms’ economic performance in terms of
employment, turnover and labour productivity growth. Moreno and Melendez
(2011) studied the impact of knowledge management on Customer
relationship management (CRM) success and the mediating effects of
organizational factors. Organizational factors indeed impact CRM success
and they appear to be intermediaries of the impact of other factors such as
Knowledge Management (KM), capabilities/technological/customer
orientation factors in the success of CRM (in financial and marketing terms).
2.3 CONCLUSIONS BASED ON THE REVIEW
The literature review on the performance measurement and the
review of topics related to maintenance performance measurement systems
and overall equipment effectiveness revealed the following facts:
i) Performance measurement study has received a great amount
of attention from researchers, practitioners and from industry
as well (Meng and Minogue 2011). A maintenance
performance measurement system forms a part of the
organization’s operational system and include all related
maintenance performance indicators (MPIs) and their
interrelationship within the whole maintenance process
(Kobaccy and Murthy 2008). It is observed form the literature
survey that Overall Equipment Effectiveness (OEE) is used as
a key maintenance performance indicator in manufacturing
36
industries in order to search for new ways to reduce
downtime, costs and waste, to operate more efficiently, and to
achieve manufacturing excellence (Ahren and Parida 2009).
ii) Though OEE measure has been widely used as a quantitative
tool to study the productivity behaviour of individual
equipments, the literature review revealed that the original
OEE measure can be redefined to fit a broader perspective as
deemed important in the manufacturing systems (de Ron and
Rooda 2006). It is observed that the description of OEE is
directed towards only equipment, but OEE is impacted greatly
by factors beyond the equipment itself, including the operator,
facilities, material (input items) availability, scheduling
requirements, etc.
iv) Owing to different definitions of OEE and other varying
circumstances between companies, it is difficult to identify
optimum OEE figures and to compare OEE between firms
(Dal et al 2000). Different opinions appear to exist within
the OEE literature as to what levels of availability,
performance efficiency and quality constitute acceptable
levels of OEE performance (Chan et al 2005, de Ron and
Rooda 2006). It is observed that the widely accepted
definition of OEE does not take into account all factors that
reduce the capacity utilization, e.g. planned downtime, lack of
material input, lack of labour etc .
iv) OEE is calculated based on six major losses viz. failure
losses, setup/adjustment losses, reduced speed losses,
idling/ minor stoppage losses, defect/rework losses, and
start-up losses. In the literature there appears to be no general
37
agreement on the magnitude of different types of losses, nor
on the reasons for losses (Ljungberg 1998, Ahuja and
Khamba 2008). The losses that are not considered viz.
planned shutdown losses, measurement/adjustment losses,
management losses, motion related losses, yield losses,
consumable – jig/tool/die losses, and energy losses also need
to be accounted appropriately for achieving world-class
performance
v) It is found from the literature that an empirical study on the
factors influencing OEE has been seldom carried out. In this
study, an attempt is made to conduct an empirical
investigation of the influence of human factors, technical
factors, production factors, maintenance factors,
environmental factors, economic factors, managerial factors
and organizational factors on the overall equipment
effectiveness.