chapter 2 - mathematical description of...
TRANSCRIPT

M. J. Roberts - 8/16/04
Solutions 2-1
Chapter 2 - Mathematical Description of Signals
Selected Solutions
1. If g t e t( ) = − −7 2 3 write out and simplify
(a) g .3 7 7 8 639 102 3 3 9 4( ) = = ≅ ×− ( )− − −e e
(b) g 2 −( )t
(c) gt
et
104 7 5
11+
=
− −
(d) g jt( ) (e)g gjt jt( ) + −( )
2
(f)g g
cos
jt jte e
tjt jt
−
+
− −
=+
= ( )−
32
32
27
27
2. If g x x x( ) = − +2 4 4 write out and simplify
(a) g z( )(b) g u v u v u v u v uv u v+( ) = +( ) − +( ) + = + + − − +2 2 24 4 2 4 4 4
(c) g e jt( )
(d) g g gt t t t t t t( )( ) = − +( ) = − +( ) − − +( ) +2 2 2 24 4 4 4 4 4 4 4
g g t t t t t( )( ) = − + − +4 3 28 20 16 4
(e) g 2( )
3. What would be the numerical value of “g” in each of the following MATLABinstructions?
(a) t = 3 ; g = sin(t) ;
(b) x = 1:5 ; g = cos(pi*x) ; [-1,1,-1,1,-1]
(c) f = -1:0.5:1 ; w = 2*pi*f ; g = 1./(1+j*w’) ;
4. Let two functions be defined by

M. J. Roberts - 8/16/04
Solutions 2-2
x, sin
, sin1
1 20 0
1 20 0t
t
t( ) =
( ) ≥− ( ) <
ππ
and x, sin
, sin2
2 0
2 0t
t t
t t( ) =
( ) ≥− ( ) <
ππ
.
Graph the product of these two functions versus time over the time range, − < <2 2t .
To graph these functions set up an array of times, t, compute the arrays of sin functionvalues, check each sin function value and apply the constraints of being +/- 1 or being +/- t,to form the function arrays, x1 and x2 , array- multiply the two function arrays and plot theproduct versus t.
t-2 2
x(t)
-2
2
5. For each function, g t( ), sketch g −( )t , − ( )g t , g t −( )1 , and g 2t( ).
(a) (b)
t
g(t)
2
4
t
g(t)
1-1
3
-3
6. A function, G f( ) , is defined by
G rectf efj f( ) =
− 2
2π .
Graph the magnitude and phase of G Gf f−( ) + +( )10 10 over the range, − < <20 20f .
First imagine what G f( ) looks like. It consists of a rectangle centered at f = 0 of width, 2,multiplied by a complex exponential. Therefore for frequencies greater than one inmagnitude it is zero. Its magnitude is simply the magnitude of the rectangle functionbecause the magnitude of the complex exponential is one for any f.
e f j f f jj f− = −( ) + −( ) = ( ) −2 2 2 2 2π π π π πcos sin cos sin ff( )
e f fj f− = ( ) + ( ) =2 2 22 2 1π π πcos sin
The phase (angle) of G f( ) is simply the phase of the complex exponential between f = −1
and f = 1 and undefined outside that range because the phase of the rectangle function is

M. J. Roberts - 8/16/04
Solutions 2-3
zero between f = −1 and f = 1and undefined outside that range and the phase of a productis the sum of the phases. The phase of the complex exponential is
∠ = ∠ ( ) − ( )( ) = − (− −e f j ffj f2 12 2
2π π ππ
cos sin tansin ))
( )
= − ( )( )
−
costan
sin
cos2
2
21
πππf
f
f
∠ = − ( )( )− −e fj f2 1 2π πtan tan
The inverse tangent function is multiple-valued. Therefore there are multiple correct answersfor this phase. The simplest of them is found by choosing
∠ = −−e fj f2 2π π
which is simply the coefficient of j in the original complex exponential expression.
A more general solution would be ∠ = − +−e f n nj f2 2 2π π π , an integer .
The solution of the original problem is simply this solution except shifted up anddown by 10 in f and added.
G G rect rectf f ef
efj f j f−( ) + +( ) =
−
+
+
− −( ) − +( )10 1010
210
22 10 2 10π π
f -20 20
|G( f )|
1
f -20 20
Phase of G( f )
-π
π
7. Sketch the derivatives of these functions.
(All sketches at end.)
(a) Use the definition of the sinc function and the rule for differentiating afraction.
(b) g ut e tt( ) = −( ) ( )−1 This function is constant zero for all time before time,t = 0 , therefore its derivative during that time is zero. This function is a
M. J. Roberts - 8/16/04
Solutions 2-4
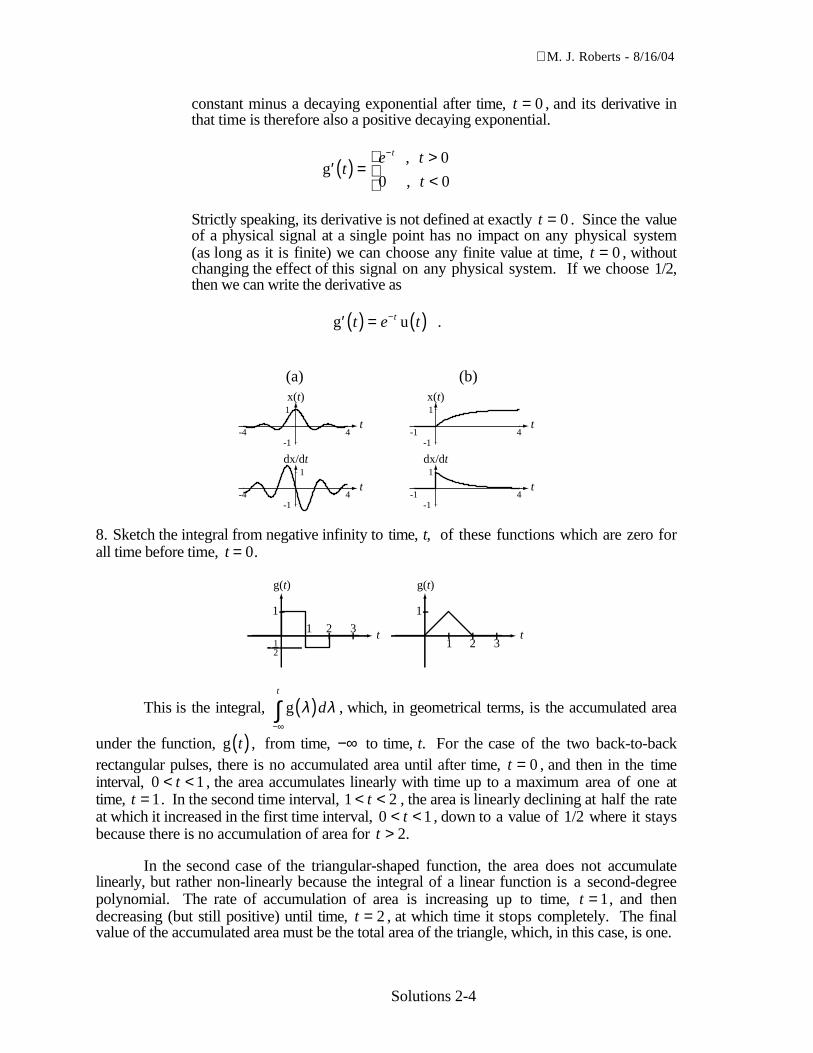
constant minus a decaying exponential after time, t = 0 , and its derivative inthat time is therefore also a positive decaying exponential.
′ ( ) =><
−
g,
,t
e t
t
t 0
0 0
Strictly speaking, its derivative is not defined at exactly t = 0 . Since the valueof a physical signal at a single point has no impact on any physical system(as long as it is finite) we can choose any finite value at time, t = 0 , withoutchanging the effect of this signal on any physical system. If we choose 1/2,then we can write the derivative as
′ ( ) = ( )−g ut e tt .
t-4 4
x(t)
-1
1
t-4 4
dx/dt
-1
1
t-1 4
x(t)
-1
1
t-1 4
dx/dt
-1
1
(a) (b)
8. Sketch the integral from negative infinity to time, t, of these functions which are zero forall time before time, t = 0.
g(t)
t
1
1 2 312
g(t)
t
1
1 2 3
This is the integral, g λ λ( )−∞∫ dt
, which, in geometrical terms, is the accumulated area
under the function, g t( ) , from time, −∞ to time, t. For the case of the two back-to-backrectangular pulses, there is no accumulated area until after time, t = 0 , and then in the timeinterval, 0 1< <t , the area accumulates linearly with time up to a maximum area of one attime, t = 1. In the second time interval, 1 2< <t , the area is linearly declining at half the rateat which it increased in the first time interval, 0 1< <t , down to a value of 1/2 where it staysbecause there is no accumulation of area for t > 2.
In the second case of the triangular-shaped function, the area does not accumulatelinearly, but rather non-linearly because the integral of a linear function is a second-degreepolynomial. The rate of accumulation of area is increasing up to time, t = 1, and thendecreasing (but still positive) until time, t = 2 , at which time it stops completely. The finalvalue of the accumulated area must be the total area of the triangle, which, in this case, is one.

M. J. Roberts - 8/16/04
Solutions 2-5
9. Find the even and odd parts of these functions.
(a) g t t t( ) = − +2 3 62
ge tt t t t t
t( ) =− + + −( ) − −( ) +
=+
= +2 3 6 2 3 6
24 12
22 6
2 2 22
go tt t t t t
t( ) =− + − −( ) + −( ) −
=−
= −2 3 6 2 3 6
262
32 2
(b) g cost t( ) = −
20 40
4π π
gcos cos
e tt t
( ) =−
+ − −
20 40
420 40
42
π π π π
Use cos cos cos sin sinz z z z z z1 2 1 2 1 2+( ) = ( ) ( ) − ( ) ( ) to separate even and oddparts.
g
cos cos sin sin
cos cos sin sin
e t
t t
t t
( ) =
( ) −
− ( ) −
+ −( ) −
− −( ) −
20 404
404
20 404
404
2
π π π π
π π π π
which simplifies to
g cose t t( ) = ( )20
240π
Use the same trigonometric identity.
(c) g tt t
t( ) =
− ++
2 3 61
2
(d) g sinct t( ) = ( ) Use the definition of the sinc function.
(e) g t t t t( ) = −( ) +( )2 1 42 2
g t t t( ) = −
odd even even
even
eve
2 12
nn even
even
odd
+
4 2t

M. J. Roberts - 8/16/04
Solutions 2-6
Therefore g t( ) is odd, g ge ot t t t t( ) = ( ) = −( ) +( )0 2 1 42 2and
(f) g t t t t t t t t t( ) = −( ) +( ) = − + +( ) = − +2 1 4 4 7 2 4 72 3 2
odd eeven odd
+ 2t
10.Sketch the even and odd parts of these functions.
t
g(t)
1
1
t
g(t)
21
1
-1
(a) (b)
To sketch the even part of graphically-defined functions like these, first sketchg −( )t . Then add it (graphically, point by point) to g t( ) and (graphically) divide the sum by
two. Then, to sketch the odd part, subtract g −( )t from g t( ) (graphically) and divide thedifference by two.
11.Sketch the indicated product or quotient, g t( ), of these functions.
t1
-1
1
-1
t1-1
1g(t)
Multiplication
t1
-1
1
-1
t1-1
-1
1
g(t)
Multiplication
(a) (b)
t1
1
g(t)
Multiplication
(c)
t-1
1
t1
1
g(t)
Multiplication
(d)
t1
1
M. J. Roberts - 8/16/04
Solutions 2-7
t1-1
1
-1
t1-1
1g(t)
Multiplication
t1
1
-1
t1
-1
1
g(t)
Multiplication
(e) (f)
t1
1
g(t)
Division Division
(g)
t-1 -1 -1 1
1 1
g(t)
(h)
t
1t
π
......
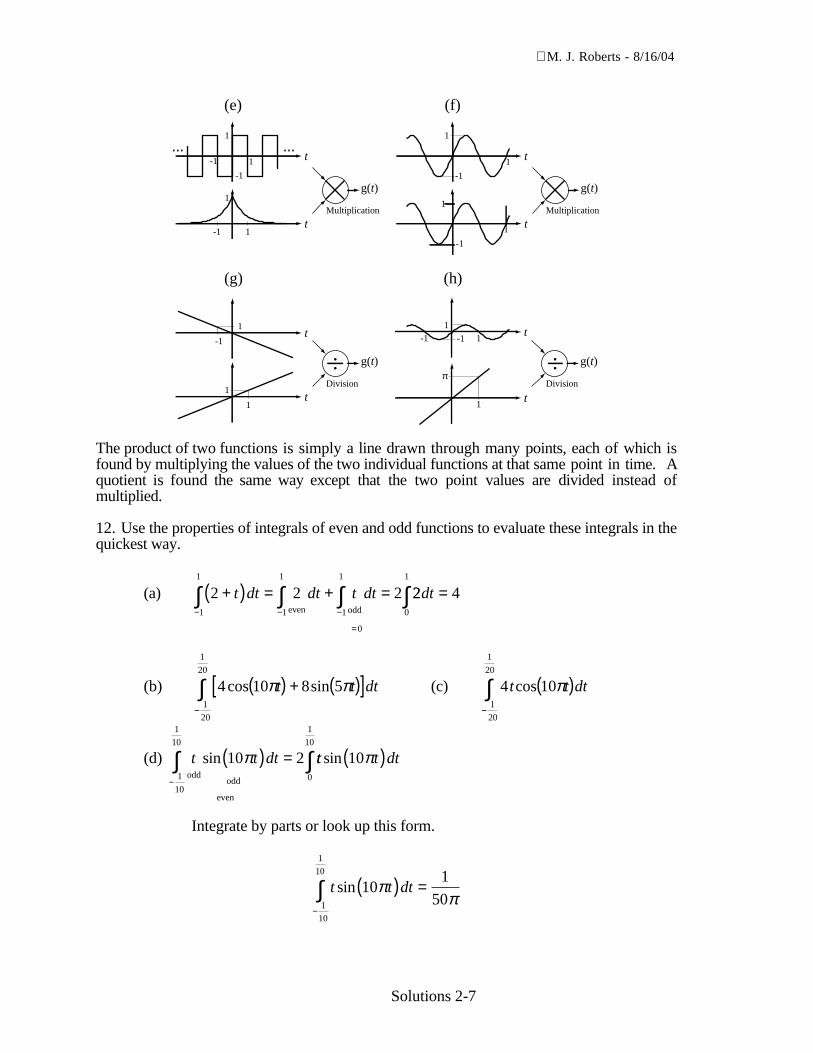
The product of two functions is simply a line drawn through many points, each of which isfound by multiplying the values of the two individual functions at that same point in time. Aquotient is found the same way except that the two point values are divided instead ofmultiplied.
12. Use the properties of integrals of even and odd functions to evaluate these integrals in thequickest way.
(a) 2 2 21
1
1
1
1
1
0
+( ) = + =− − −
=
∫ ∫ ∫t dt dt t dteven odd
22 40
1
dt∫ =
(b) 4 10 8 51
20
1
20
cos sinπ πt t dt( ) + ( )[ ]−
∫ (c) 4 101
20
1
20
t t dtcos π( )−
∫
(d) t t dtodd
odd
even
sin 10 21
10
1
10
π( ) =−
∫ tt t dtsin 100
1
10
π( )∫
Integrate by parts or look up this form.
t t dtsin 101
501
10
1
10
ππ
( ) =−
∫

M. J. Roberts - 8/16/04
Solutions 2-8
(e) e dtt−
−∫1
1
(f) te dtt−
−∫1
1
13.Find the fundamental period and fundamental frequency of each of these functions.
(a) g cost t( ) = ( )10 50π f T0 025125
= =Hz s,
For a simple sinusoid of the form, A f tcos 2 0π θ+( ) or A f tsin 2 0π θ+( ) the
frequency is simply f0 .
(b) g cost t( ) = +
10 50
4π π
(c) g cos sint t t( ) = ( ) + ( )50 15π π
The fundamental period of the sum of two periodic signals is the least commonmultiple (LCM) of their two individual fundamental periods. The fundamental frequency ofthe sum of two periodic signals is the greatest common divisor (GCD) of their two individualfundamental frequencies.
f T0 025152
2 51
2 50 4=
= = =GCD , . ,
..Hz s
OR
T0
1
25
2
15
6
150
20
150
60
1=
=
=LCM , LCM ,550
0 41
0 42 50= = =.
.. , s , Hzf
(d) g cos sin cost t t t( ) = ( ) + ( ) + −
2 3 5
34
π π π π
14. Find the fundamental period and fundamental frequency of g t( ).
g(t)
t......
1
t......
1
g(t)
t......
1
+(a) (b)
t......
1
g(t)
t......
1
+(c)

M. J. Roberts - 8/16/04
Solutions 2-9
(a) Counting periods we see that there are three periods in one second.
Therefore f T0 0313
= =Hz and s
(b) Count periods to find the fundamental frequency of each signal, then find theGCD of those two frequencies.
15.Plot these DT functions.
Use a calculator or MATLAB to plot these functions.
(a) x cos sinnn n[ ] =
−
−( )
4212
32 2
8π π
, − ≤ <24 24n
n = -24:23 ;x = 4*cos(2*pi*n/12) - 3*sin(2*pi*(n-2)/8) ;stem(n,x,'k','filled') ;
(b) x n nen
[ ] =−
3 5 , − ≤ <20 20n
n = -20:19 ;x = 3*n.*exp(-abs(n/5)) ;stem(n,x,'k','filled') ;
(c) x nn
n[ ] =
+212
142
3 , − ≤ <5 5n
16.Let x cos1 52
8n
n[ ] =
π and x2
68
2
n en
[ ] = −−
. Plot the following combinations of those
two signals over the DT range, − ≤ <20 20n . If a signal has some defined and someundefined values, just plot the defined values.
(a) x x xn n n[ ] = [ ] [ ]1 2
Make MATLAB functions for x1 and x2 and save them in files named x1DT.m and
x2DT.m. (DT for discrete time.)
function y = x1DT(n),y = 5*cos(2*pi*n/8) ;I = find(round(n) ~= n) ; y(I) = NaN ;
function y = x2DT(n)y = -8*exp(-(n/6).̂ 2) ;I = find(round(n) ~= n) ; y(I) = NaN ;

M. J. Roberts - 8/16/04
Solutions 2-10
Then use the functions in this way in part (a).
n = -20:19 ; x = x1DT(n).*x2DT(n) ;
(b) x x xn n n[ ] = [ ] + [ ]4 21 2
n = -20:19 ; x = 4*x1DT(n) + 2*x2DT(n) ;
(c) x x xn n n[ ] = [ ] [ ]1 22 3
n = -20:19 ; x = x1DT(2*n).*x2DT(3*n) ;
(d) xxx
nn
n[ ] = [ ]
−[ ]1
2
2
(e) x x xnn n[ ] =
+
22
431 2
n = -20:19 ; x = 2*x1DT(n/2) + 4*x2DT(n/3) ;
17.A function, g n[ ] is defined by
g
,
,
,
n
n
n n
nn
[ ] =− < −
− ≤ <
≤
2 4
4 1
41
.
Sketch g −[ ]n , g 2 −[ ]n , g 2n[ ] and gn
2
.
function y = gDT(n)I = find(round(n) ~= n) ; % Find all non-
% integer "n's"n(I) = NaN ; % Set them all to
% "NaN"y1 = -2 ;y2 = n ;num3 = 4*ones(length(n),1) ; den3 = n ;I = find(den3 == 0) ; num3(I) = 1 ; den3(I) = 1 ;y3 = num3./den3 ;y = y1.*(n<-4) + y2.*(n>=-4 & n<1) + y3.*(n>=1) ;

M. J. Roberts - 8/16/04
Solutions 2-11
18.Sketch the backward differences of these DT functions.
n-4 20
g[n]1
n-4 20
g[n]1
n-4 20
g[n] = (n/10)2
4
(c)
(b)(a)
(a) and (b) can be done easily by hand
(c) is also easy to sketch once you realize what is happening
g g gnn
n nn n[ ] =
⇒ [ ] − −[ ] =
−−
101
10
1
1
2 2
00 100 100 50
1
100
2 1
100
2 2 2
= − + − =−n n n n
19.Sketch the accumulation, g n[ ] , from negative infinity to n of each of these DT functions.
(a) h n n[ ] = [ ]δ
g un mn
nn
m
n
[ ] = [ ] =≥<
==−∞∑ δ
1 0
0
,
0 , [[ ]
(b) h un n[ ] = [ ]The answer is not ramp[n].
(c) h cos unn
n[ ] =
[ ]2
16π
The answer looks a lot like an offset DT sine wave, but not exactly.
(d) h cos unn
n[ ] =
[ ]2
8π
(e) h cos unn
n[ ] =
+[ ]2
168
π
20.Find and sketch the even and odd parts of these functions.
(a) g u un n n[ ] = [ ] − −[ ]4
gu u u u
u ue nn n n n
n[ ] = [ ] − −[ ] + −[ ] − − −[ ] == [ ] + −4 4
2
1
2nn n n
n
[ ] − −[ ] − +[ ]
+ [ ]1
4 4δ
u u

M. J. Roberts - 8/16/04
Solutions 2-12
(b) g un e nn
[ ] = [ ]−4
(c) g cosnn[ ] =
24π
(d) g sin unn
n[ ] =
[ ]2
4π
21.Sketch g n[ ] .
Multiplication Multiplication
Multiplication Multiplication
g [n]1 g [n]
1
g[n]
g[n]
g[n]
g[n]
g [n]2 g [n]
2
g [n]1
g [n]1
g [n]2
n-10 10
-1
1
n-1010
-1
1
n-420
-1
1
n-4 20
-1
1
n-4 20
-1
1
n-4 20
-1
1
n-10 10
-1
1
n-10 10
g[n]
-1
1
(a) (b)
(c) (d)
In each part multiply point-by-point to form the product.
22.Find the fundamental DT period and fundamental DT frequency of these functions.
(a) g cosnn[ ] =
210π
(b) g cosnn[ ] =
π10
(c) g cos cosnn n[ ] =
+
25
27
π π
(d) g n e ej
nj
n
[ ] = +−
2
20
2
20
π π
(e) g n e ej
nj
n
[ ] = +− −
2
3
2
4
π π
These are almost identical to the previous exercises on finding the fundamental period of CTfunctions.

M. J. Roberts - 8/16/04
Solutions 2-13
23.Graph the following functions and determine from the graphs the fundamental period ofeach one (if it is periodic).
(a) g sin cosnn n[ ] =
+
5
24
82
6π π
(b) g sin cosnn n[ ] =
+
5
712
814
8π π
(c) g Ren e ej n jn
[ ] = +
−ππ3
(d) g Ren e ejn jn
[ ] = +
−3
These two exponentials do not have a finite LCM period.
24.Find the signal energy of these signals.
(a) x rectt t( ) = ( )2 E t dt dtx = ( ) = =−∞
∞
−
∫ ∫2 4 42
1
2
1
2
rect
(b) x u ut A t t( ) = ( ) − −( )( )10
(c) x u ut t t( ) = ( ) − −( )10
This function has an infinite duration with a non-zero value. Therefore itsenergy must be infinite.
(d) x rect cost t t( ) = ( ) ( )2π
(e) x rect cost t t( ) = ( ) ( )4π (f) x rect sint t t( ) = ( ) ( )2π
(g) x rectn A nN[ ] = [ ]0
Just looking at this simple function, it obviously has 2 10N + DT impulses,each of strength, A. Squaring each one and then adding the squares theenergy must be 2 10
2N A+( ) .
(h) x n A n[ ] = [ ]δ
(i) x combn nN[ ] = [ ]0
(j) x rampn n[ ] = [ ]
This function takes off at n = 0 and rises linearly for all positive time.Therefore its energy must be infinite.
(k) x ramp ramp rampn n n n[ ] = [ ] − −[ ] + −[ ]2 4 8

M. J. Roberts - 8/16/04
Solutions 2-14
Even though each of these three individual functions has infinite energy, thesum of the three functions does not. This can be seen by drawing a graph ofthe function. This is a dramatic demonstration that the energy of a sum offunctions is not necessarily the sum of the energies of the functions. Forenergy signals which are “uncorrelated” the energy of the sum is the sum ofthe energies. Correlation will be introduced and mathematically defined inChapter 8.
25. Find the signal power of these signals.
(a) x t A( ) = PT
A dtA
Tdt
A
TT Ax
TT
T
TT
T
T= = = =
→∞−
→∞−
→∞∫ ∫lim lim lim1 2
2
2 2
2
2 22
(b) x ut t( ) = ( )
(c) x cost A f t( ) = +( )2 0π θ
The average signal power of a periodic power signal is unaffected if it isshifted in time. Therefore we could find the average signal power ofA f tcos 2 0π( ) instead, which is somewhat easier algebraically. In doing theintegral, use the trigonometric identity for the product of two sinusoids.
(d) x rectt A t nn
( ) = −( )=−∞
∞
∑ 2
It will help to visualize this signal before beginning the analysis. It is a“square” wave with fundamental period, T0 2= , alternating between 0 andA, spending half its time at each level. So the square of the signal alternatesbetween 0 and A2 , spending half its time at each level. Therefore, without
any math, its average signal power is obviously A2
2.
(e) x rectt A t nn
( ) = − + −( )
=−∞
∞
∑212
2
(f) x n A[ ] = (g) x un n[ ] = [ ]
(h) x rectn A n mm
[ ] = −[ ]=−∞
∞
∑ 2 8
Sketch the function and the square of the function first. Then you can findthe average signal power without much work.
(i) x combn nN[ ] = [ ]0
(j) x rampn n[ ] = [ ]
26.Using MATLAB, plot the CT signal, x sint t( ) = ( )2π , over the time range, 0 10< <t , with

M. J. Roberts - 8/16/04
Solutions 2-15
the following choices of the time resolution, ∆t , of the plot. Explain why the plots look theway they do.
(a) ∆t =1
24(b) ∆t =
112
(c) ∆t =14
(d) ∆t =12
This graph is all zero. Why?
(e) ∆t =23
Why do the graphs in (e) and (f) both have different
fundamental periods than the original function?
(f) ∆t =56
(g) ∆t =1 This graph is all zero. Why?
27.Given the function definitions on the left, find the function values on the right.
(a) g sint t( ) = +
100 200
4π π
g . sin . sin .0 001 100 200 0 0014
1005 4
98 77( ) = × +
= +
=π π π π
(b)g t t t( ) = − +13 4 6 2 g(2)
(c)
g t e et j t( ) = − − −5 2 2π g14
28. Sketch these CT exponential and trigonometric functions.
(a) g cost t( ) = ( )10 100π (b) g cos sint t t( ) = ( ) + ( )40 60 20 60π π
(c) g t et
( ) =−
5 10 (d) g cost e tt
( ) = ( )−5 22 π
29. Sketch these CT singularity and related functions.
(a) g ut t( ) = −( )2 4
(b) g ut t( ) = ( )2 Why do the graphs of u 2t( ) and u t( ) look alike?
(c) g sgnt t( ) = −( )5 4 (d) g sgnt t( ) = + −( )1 4
M. J. Roberts - 8/16/04
Solutions 2-16
(e) g rampt t( ) = +( )5 1 (f) g rampt t( ) = − ( )3 2
(g) g t t( ) = +( )2 3δ
(h) g t t( ) = +( )6 3 9δ Remember the scaling property of the impulse. Thisgraph is exactly the same as the graph in part (g).
(i) g t t( ) = − −( )( )4 2 1δ (j) g combt t( ) = −
2
12
(k) g combt t( ) = ( )8 4 Remember the scaling property of the impulse.
(l) g combtt( ) = −+
3
12
(m) g recttt( ) =
2
3(n) g rectt
t( ) =+
4
12
(o) g trit t( ) = ( )4 (p) g tritt( ) = −−
6
12
(q) g sinctt( ) =
5
2(r) g sinct t( ) = − +( )( )2 1
(s) g drcl ,t t( ) = − ( )10 4 (t) g drcl ,tt( ) =
5
47
(u) g rectt t( ) = − −( )3 2 (v) g . recttt( ) =−
0 1
34
(w) g tritt( ) = −
+
4
32
(x) g sinct t( ) = −( )( )4 5 3 (y) g sinct t( ) = −( )4 5 3
The answers in parts (x) and (y) are different.
30. Sketch these CT functions.
(a) g u ut t t( ) = ( ) − −( )1
(b) g rectt t( ) = −
12
The graphs in (a) and (b) are identical.
(c) g ramp ut t t( ) = − ( ) −( )4 2 (d) g sgn sint t t( ) = ( ) ( )2π

M. J. Roberts - 8/16/04
Solutions 2-17
(e) g ut e tt
( ) = ( )−5 4 (f) g rect cost t t( ) = ( ) ( )2π
(g) g rect cost t t( ) = − ( ) ( )6 3π (h) g rect trit t t( ) = ( ) ( )
(i) g rect trit t t( ) = ( ) +
12
(j) g u rampt t t( ) = +
−
12
12
The graphs in (i) and (j) are identical.
(k) g trit t( ) = ( )2 This graph does not look like a triangle.
(l) g sinct t( ) = ( )2 (m) g sinct t( ) = ( )
(n) g tritd
dtt( ) = ( )( ) (o) g rect rectt t t( ) = +
− −
12
12
(p) g t dt
( ) = +( ) − ( ) + −( )
−∞∫ δ λ δ λ δ λ λ1 2 1
The graphs in (n), (o) and(p) are identical.
(q) 323
33
tri rectt t
+
(r) 63 3
tri rectt t
The graphs in (q) and (r) are identical.
(s) 4 2sinc sgnt t( ) −( ) (t) 21
2ramp rectt
t( ) −
(u) 42
22tri u
tt
−
−( ) The graphs in (t) and (u) are identical.
(v) 34
62
rect rectt t
−
(w) g drcl , rectt
t t( ) =
10
45
8
31.Using MATLAB, for each function below plot the original function and the transformed function.
(a)g cos trit t t( ) = ( ) ( )10 20π 5 2g t( ) vs. t
(b)

M. J. Roberts - 8/16/04
Solutions 2-18
g
,
,
,
,
t
t
t t
t t
t
( ) =
− < −− < <
− < <− >
2 1
2 1 1
3 1 3
6 3
2− −( )3 4g t vs. t
(c)
g Re .t e ej t j t( ) = +( )π π1 1 gt
4
vs. t
(d)
G ff j
( ) =− +
52 32 G G10 10 10 10f f−( )( ) + +( )( ) vs. f
% Plotting functions and transformations of those functions
close all ;
% (a) parttmin = -2 ; tmax = 2 ; N = 400 ;dt = (tmax - tmin)/N ; t = tmin + dt*[0:N]' ;g0 = ga(t) ; g1 = 5*ga(2*t) ;subplot(2,1,1) ; p = plot(t,g0,'k') ; set(p,'LineWidth',2) ; grid ;ylabel('g(t)') ;subplot(2,1,2) ; p = plot(t,g1,'k') ; set(p,'LineWidth',2) ; grid ;xlabel('t') ; ylabel('5g(2t)') ;
function y = ga(t)g = (1-abs(t)).*(-1 < t & t < 1) ;y = 10*cos(20*pi*t).*g ;
32.Let two signals be defined by
x, cos
, cos1
1 2 1
0 2 1t
t
t( ) =
( ) ≥( ) <
ππ
and x sin2
210
tt( ) =
π .
Plot these products over the time range, − < <5 5t .
(a) x x1 22t t( ) −( ) (b) x x1 2520
tt
( )
(c) x x1 2520 1
tt
+( )( ) (d) x x1 2
25
20t
t−
( )
33.Given the graphical definition of a function, graph the indicated transformation(s).
(a)

M. J. Roberts - 8/16/04
Solutions 2-19
-2-2 2 3 4 5 61
12
-2
t
g(t)
g g
g g
t t
t t
( ) → ( )( ) → − −( )
2
3
g ,t t t( ) = > < −0 6 2or
The transformation, g gt t( ) → ( )2 , simply compresses the time scale by a factor of 2. The
transformation g gt t( ) → − −( )3 time inverts the signal, amplitude inverts the signal and thenmultiplies the amplitude by 3.
-2-2 2 4 6
12
-2
t
g(2t)
-2-2-4 2 4 6
36
-6
t
-3g(-t)
(b)
-2-2 21 3 4 5 6
12
-2
t
g(t)
g g
g g
t t
tt
( ) → +( )
( ) → −−
4
21
2
34.For each pair of functions graphed below determine what transformation has been doneand write a correct functional expression for the transformed function.
M. J. Roberts - 8/16/04
Solutions 2-20
(a)
-2-2 21 3 4 5 6
2
-1t
g(t)
-1 1 2 3 4-2-3-4
2
-1t
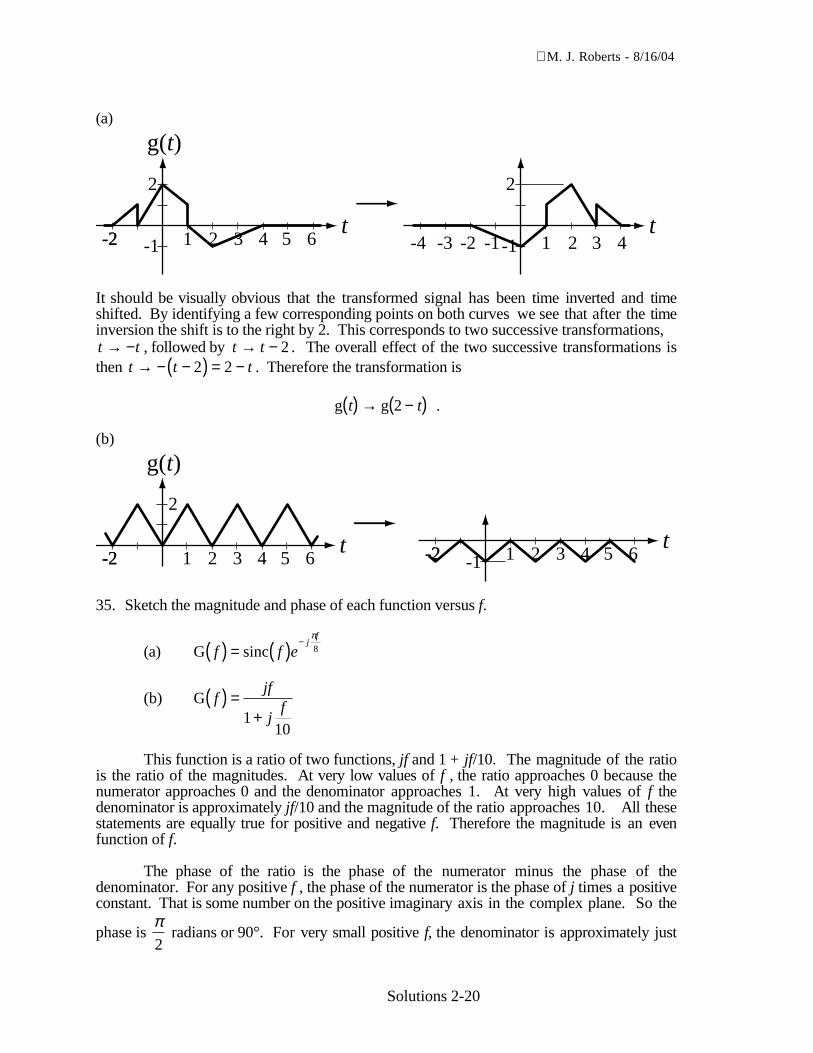
It should be visually obvious that the transformed signal has been time inverted and timeshifted. By identifying a few corresponding points on both curves we see that after the timeinversion the shift is to the right by 2. This corresponds to two successive transformations,t t→ − , followed by t t→ − 2 . The overall effect of the two successive transformations isthen t t t→ − −( ) = −2 2 . Therefore the transformation is
g gt t( ) → −( )2 .
(b)
-2-2 21 3 4 5 6
2
t
g(t)
-2-2 21 3 4 5 6-1t
35. Sketch the magnitude and phase of each function versus f.
(a) G sincf f ej
f
( ) = ( ) −π8
(b) G fjf
jf( ) =
+110
This function is a ratio of two functions, jf and 1 + jf/10. The magnitude of the ratiois the ratio of the magnitudes. At very low values of f , the ratio approaches 0 because thenumerator approaches 0 and the denominator approaches 1. At very high values of f thedenominator is approximately jf/10 and the magnitude of the ratio approaches 10. All thesestatements are equally true for positive and negative f. Therefore the magnitude is an evenfunction of f.
The phase of the ratio is the phase of the numerator minus the phase of thedenominator. For any positive f , the phase of the numerator is the phase of j times a positiveconstant. That is some number on the positive imaginary axis in the complex plane. So the
phase is π2
radians or 90°. For very small positive f, the denominator is approximately just

M. J. Roberts - 8/16/04
Solutions 2-21
the real number, 1, whose phase is 0. Therefore for very small positive f approaching 0 the
phase approaches π2
. For very large positive f , the phase of the denominator approaches π2
also and the difference between the numerator and denominator phases approaches 0. The
behavior for negative f is similar except that the phase of the numerator is now −π2
. So the
phase for negative f is exactly the negative of the phase for the corresponding positive f. Thatis, the phase is an odd function of f.
(c) G rect rectff f
ej
f
( ) =−
+
+
−1000100
1000100
500
π
(d) G ff j f
( ) =− +
1250 32
(e) G comb sincf f f ej
f
( ) = ( ) ( )100 25 50
π
This function has non-zero values only at the impulse locations in the comb function.Therefore the phase is only defined at those same points.
36.Graph versus f , in the range, − < <4 4f , the magnitude and phase of
(a) X sincf f( ) = ( )f
|X( f )|
X( f )1-1-2-3-4 2 3 4
f 1
-1-2-3-42 3 4
π
-π
1
The phase in this plot is the phase of a purely real function. If we only plotted purely realfunctions we would not need to graph magnitude and phase separately. A simple real plot ofthe function would be sufficient and clearer. But most transforms that we will later graph arecomplex functions and magnitude and phase plots are good ways of representing them.Since this function is purely real its value always lies on the real axis of the complex plane.When it is positive the simplest phase answer is 0. When it is negative the simplest phaseanswer is either positive or negative π radians. Later, in the study of transform methodsapplied to systems, we will find that we always have an even magnitude and an odd phase.For that reason, it is consistent and logical to choose phase values so as to make the plot anodd function. Here that is done by making the phase for negative values of sinc f( ) be πfor positive f and −π for negative f.
(b) X sincf f e j f( ) = ( ) −2 4π (c) X rectf f e j f( ) = ( ) +5 2 2π

M. J. Roberts - 8/16/04
Solutions 2-22
(d) X sinf cf( ) =
10
42
(e) X f j f j f( ) = +( ) − −( )5 2 5 2δ δ The phase is undefined except at two points.
(f) X combf f e j f( ) = ( ) −2 4 π The phase is undefined except where the impulsesoccur.
37.Sketch the even and odd parts of these CT signals.
(a) x rectt t( ) = −( )1
(b) x tri trit t t( ) = −
+ +
34
34
This is an even function.
(c) x sinctt( ) = −
4
12
Use the definition of the sinc function to reduce this to
some sine functions in fractions, then use the trigonometric identity,
sin sin cos cos sinx y x y x y+( ) = ( ) ( ) + ( ) ( ) ,
to simplify that expression. This takes about 5 lines of complicated algebra to finish for theeven part. The complexity is about the same for the odd part.
(d) x sin rectt t t( ) = −
( )2 4
4π π
Use the trigonometric identity,
sin sin cos cos sinx y x y x y+( ) = ( ) ( ) + ( ) ( )
to simplify the expression and separate even and odd parts.
38. Let the CT unit impulse function be represented by the limit,
δ xa
x
aa
a( ) =
>
→lim tri ,
0
10 .
The function, 1a
x
atri
has an area of one regardless of the value of a.
(a) What is the area of the function, δ 41 4
0x
a
x
aa( ) =
→
lim tri ?
This is a triangle with the same height as 1a
x
atri
but 1/4 times the base
width.
(b) What is the area of the function, δ −( ) = −
→
61 6
0x
a
x
aalim tri ?
M. J. Roberts - 8/16/04
Solutions 2-23
This is a triangle with the same height as 1a
x
atri
but reversed in time with
1/6 the base width. What is the effect of the reversal in time?
(c) What is the area of the function, δ bxa
bx
aa( ) =
→
lim tri0
1 for b positive and
for b negative ?
39. Using a change of variable and the definition of the unit impulse, prove that
δ δa t ta
t t−( )( ) = −( )0 0
1 .
Start with this definition of the impulse.
δ x x( ) = ≠0 0, , δ x dx( ) =−∞
∞
∫ 1
to establish the time of occurrence of the impulse, δ a t t−( )( )0 . Then, use a change of
variable to make δ a t t−( )( )0 have the same form as the impulse in the integral definitionabove and consider the cases of positive a and negative a separately.
40. Using the results of Exercise 39, show that
(a)
comb axa
xn
an
( ) = −
=−∞
∞
∑1 δ
(b) the average value of comb ax( ) is one, independent of the value of a
The average value of any periodic function is the area under the function overone period, divided by the period.
(c) a comb function of the form, 1a
t
acomb
is a sequence of unit impulses
spaced a units apart.
and (d) even though δ δata
t( ) = ( )1, comb combax
ax( ) ≠ ( )1
41.Sketch the generalized derivative of g sin recttt
t( ) =
( )3
2π
.
The generalized derivative is exactly the same as the derivative at all points ofcontinuity. At points of discontinuity, the generalized derivative is an impulse whosestrength is the size of the discontinuity.
42.Sketch the following CT functions.

M. J. Roberts - 8/16/04
Solutions 2-24
(a) g t t t( ) = ( ) + −( )( )3 3 6 4 2δ δ
(b) g combtt( ) = −
2
5
The impulses in this function all have strength, 10.
(c) g comb rectt tt( ) = ( )
11
(d) g sinc combtt t( ) =
54
12 2
(e) g comb combt dt
( ) =
−
−
−∞
∫12 2
12
λ λ λ
This is a rectangular wave.
43.What is the numerical value of each of the following integrals?
Use the sampling property of the impulse in each case.
(a) δ πt t dt( ) ( )−∞
∞
∫ cos 48 (b) δ πt t dt−( ) ( )−∞
∞
∫ 5 cos
(c) δ tt
dt−( )
∫ 8
320
20
tri
The sampling property of the impulse holds as long as the range of integrationincludes the impulse.
(d) δ tt
dt−( )
∫ 8
160
20
rect
(e) δ t t dt−( ) ( )−∫ 1 52
2
. sinc (f) δ t t dt−( ) ( )−∫ 1 5 42
2
. sinc
44.What is the numerical value of each of the following integrals?
(a) comb cost t dt( ) ( )−∞
∞
∫ 48π (b) comb sint t dt( ) ( )−∞
∞
∫ 2π
(c) comb rectt
t dt−
( )∫ 2
40
20
(d) comb sinct t dt( ) ( )−∫2
2
Only one of the comb impulses hits the sinc function at a

M. J. Roberts - 8/16/04
Solutions 2-25
value other than zero.
45.Sketch the derivatives of these functions.
(a) g sin sgnt t t( ) = ( ) ( )2π (b) g tritt( ) =
−2
21 (c) g cost t( ) = ( )2π
Sketch the functions first and then determine the derivatives with a combination ofgraphical and analytical analysis.
46.Sketch the derivatives of these functions. Compare the average values of the magnitudesof the derivatives.
t
g (t)
......-2 42 6 8 10 12
1
t
g (t)
......-2 42 6 8 10 12
1
t
g (t)
......-2 42 6 8 10 12
1
1
2
3
Average derivative is zero in each case.
47.A function, g t( ), has this description:
It is zero for t < −5. It has a slope of –2 in the range, − < < −5 2t . It has the
shape of a sine wave of unit amplitude and with a frequency of 14
Hz plus a constant in the
range, − < <2 2t . For t > 2 it decays exponentially toward zero with a time constant of 2seconds. It is continuous everywhere.
Write an exact mathematical description of this function.
Specify the functions behavior in each of the 4 regions described above.
(a) Graph g t( ) in the range, − < <10 10t .
(b) Graph g 2t( ) in the range, − < <10 10t .
Compressed in time by a factor of two.
(c) Graph 2 3g −( )t in the range, − < <10 10t .
Time inverted , shifted and amplitude scaled.
(d) Graph −+
2
12
gt
in the range, − < <10 10t .
M. J. Roberts - 8/16/04
Solutions 2-26
Amplitude scale, time scale and then time shift.
48.Find the even and odd parts of each of these CT functions.
(a) g sint t( ) = ( )10 20π
This function is obviously odd.
gsin sin
e tt t( ) =
( ) + −( )=
10 20 10 202
0π π
, xsin sin
sino tt t
t( ) =( ) − −( )
= ( )10 20 10 202
10 20π π π
(g) gcos
tt
t( ) =
( )ππ
An even function divided by an odd function is an odd function. So the evenpart should be zero.
g
cos cos cos cos
e t
t
t
t
t
t
t
t
t( ) =
( )+
−( )− =
( )+
( )− =
ππ
ππ
ππ
ππ
2 20
g
cos cos cos coscos
o t
t
t
t
t
t
t
t
t t
t( ) =
( )−
−( )− =
( )+
( )=
( )π
ππ
ππ
ππ
π ππ2 2
49.Is there a function that is both even and odd simultaneously? Discuss.
Think trivial.
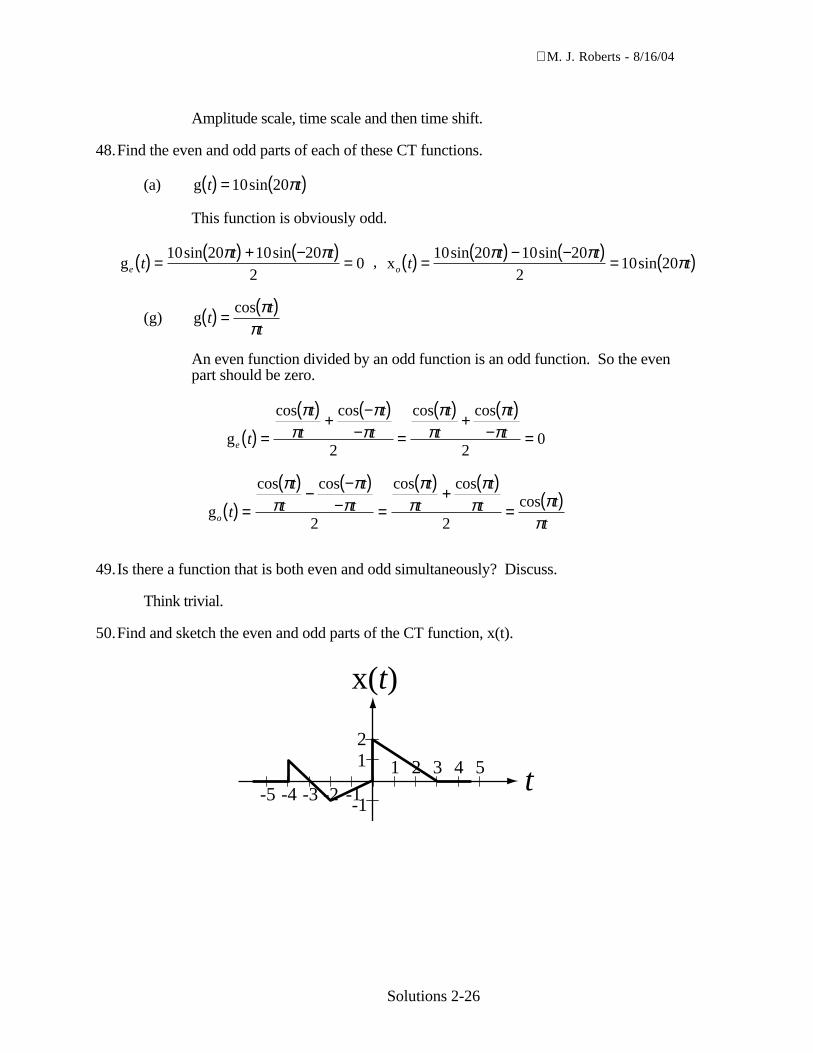
50.Find and sketch the even and odd parts of the CT function, x(t).
t
x(t)
1
-1-1
12
-2-3-4-5
2 3 4 5

M. J. Roberts - 8/16/04
Solutions 2-27
t1
-1 -1
12
-2-3-4-5
2 3 4 5
x (t)e
t1
-1-1
12
-2-3-4-5
2 3 4 5
x (t)o
51.For each of the following signals decide whether it is periodic and, if it is, find the period.
(a) g sint t( ) = ( )28 400π Periodic. Fundamental frequency = 200 Hz, Period = 5 ms.(b) g cost t( ) = + ( )14 40 60π(c) g cost t t( ) = − ( )5 2 5000π Not periodic because 5t is not periodic.(d) g sin cost t t( ) = ( ) + ( )28 400 12 500π π(e) g sin cost t t( ) = ( ) − ( )10 5 4 7
(f) g sin sint t t( ) = ( ) + ( )4 3 3 3 Not periodic because least common multiple is infinite.
52. The voltage illustrated in Figure E52 occurs in an analog-to-digital converter. Write amathematical description of it.
t (ms)-0.1 0.3
x(t)
5
Signal in A/D Converter
Sum of two triangle functions.
53. A signal occurring in a television set is illustrated in Figure E52. Write a mathematicaldescription of it.
t (µs)-10 60
x(t)
-10
Signal in Television
5
One scaled and shifted rectangle function.
54. The signal illustrated in Figure E54 is part of a binary-phase-shift-keyed (BPSK) binarydata transmission. Write a mathematical description of it.

M. J. Roberts - 8/16/04
Solutions 2-28
t (ms)4
x(t)
-1
1
BPSK Signal
Sum of four products of a sine wave with a shifted rectangle function.
55. This signal illustrated in Figure E55 is the response of an RC lowpass filter to a suddenchange in excitation. Write a mathematical description of it.
On a decaying exponential, a tangent line at any point intersects the final value one timeconstant later. Theconstant value before the decaying exponential is -4 V and the slopeof the tangent line at 4 ns is -2.67V/4 ns or -2/3 V/ns.
t (ns)20
x(t)
-6
RC Filter Signal
-1.3333
4
Figure E55 Transient response of an RC filter
x ut e tt
( ) = − − −
−( )−−
4 2 1 44
3
56.Find the signal energy of each of these signals:
(a) 2 rect −( )t , E t dt dt= −( )[ ] = =−∞
∞
−
∫ ∫2 4 42
1
2
1
2
rect
(b) x rectt t( ) = ( )8 (c) x recttt( ) =
3
4
(d) tri 2t( )
Keep in mind that the square of a rectangle function is another rectangle functionbut the square of a triangle function is not another triangle function. Use thedefinition of the triangle function and the fact that a triangle function is even toreduce the work.
(e) x tritt( ) =
3
4
rect . sin rect . sin rect . sin rect .00 0 5 10 8000 1 5 10 8000 2 5 10 8000 3 53 3 3π π π πt t t t t t t t) − ×( ) − ( ) − ×( ) + ( ) − ×( ) − ( ) − ×(− − −
M. J. Roberts - 8/16/04
Solutions 2-29
(f) 2sin 200πt( )
This is a power signal and, as such, has infinite signal energy.
(g) δ t( ) (Hint: First find the signal energy of a signal which approaches animpulse some limit, then take the limit.)
(h) x recttd
dtt( ) = ( )( )
This requires a generalized derivative and therefore contains impulses. Usethe result of part (g).
(i) x rectt dt
( ) = ( )−∞∫ λ λ
The rectangle function has finite energy but its integral does not.
(j) x ut e tj t( ) = ( )− −( )1 8π
Even though this function is complex-valued, the formula still applies.
57.Find the average signal power of each of these signals.
(a) x sint t( ) = ( )2 200π This is a periodic function. Therefore
PT
t dtT
t dtxT
T
T
T
= ( )[ ] = − ( )
− −
∫ ∫12 200
4 12
12
4002
2
2
2
2
sin cosπ π
PT
tt
T
T T T Tx
T
T
= −( )
= −( )
+ +−( )
=−
2 400400
22
200400 2
200400
2
2
2sin sin sinππ
ππ
ππ
For any sinusoid, the average signal power is half the square of the amplitude.
(b) x combt t( ) = ( )
Use the result of 56 (g).
(c) x t e j t( ) = 100π
58. Sketch these DT exponential and trigonometric functions.
(a) g cosnn[ ] = −
4
210π
(b) g cos .n n[ ] = − ( )4 2 2π (c) g cos .n n[ ] = − ( )4 1 8π

M. J. Roberts - 8/16/04
Solutions 2-30
The graphs in (b) and (c) are identical. Why?
(d) g cos sinnn n[ ] =
−
2
26
32
6π π
(e) g nn
[ ] =
34
(f) g . sinnnn[ ] = ( )
2 0 9
24π
59. Sketch these DT singularity functions.
(a) g un n[ ] = +[ ]2 2
(b) g un n[ ] = [ ]5
Why does u u5n n[ ] = [ ] ?
(c) g rampn n[ ] = − −[ ]2
(d) g rampnn[ ] =
102
Don’t plot undefined values.
(e) g n n[ ] = −[ ]7 1δ
(f) g n n[ ] = −( )[ ]7 2 1δ
The DT impulse does not have a scaling property.
(g) g n n[ ] = −
423
δ (h) g n n[ ] = − −
423
1δ
(i) g combn n[ ] = [ ]8 4 (j) g combn n[ ] = [ ]8 24
(k) g rectn n[ ] = [ ]4 (l) g rectnn[ ] =
235
(m) g trinn[ ] =
5
(n) g sincnn[ ] = −
4
(o) g sincnn[ ] =
+
14
(p) g drcl ,nn[ ] =
10
9
60. Sketch these combinations of DT functions.

M. J. Roberts - 8/16/04
Solutions 2-31
(a) g u un n n[ ] = [ ] + −[ ]This function is not a constant for all n.
(b) g u un n n[ ] = [ ] − −[ ]
(c) g cos combnn
n[ ] =
[ ]2
12 3
π
This is a “sampled” DT cosine.
(d) g cos combnn n[ ] =
212 23
π
(e) g sin un en
nn
[ ] =
[ ]−
52
816
π(f) g sin un
nn[ ] =
[ ]2
4π
(g) g comb combn m mm
n
[ ] = [ ] − −[ ]( )=
∑ 4 40
2
This is a DT rectangular wave whose rectangles each have width, 2.
(h) g cos unm
mm
n
[ ] =
[ ]
=∑ 2
120
π
(i) g comb combn m mm
n
[ ] = [ ] − −[ ]( )=
∑ 4 40
2
(j) g comb comb rectn m m mm
n
[ ] = [ ] + [ ]( ) [ ]=
∑ 4 3 40
(k) g comb combn n n[ ] = +[ ] − [ ]2 21
(l) g n m mm
n
m
n
[ ] = [ ] − [ ]=−∞
+
=−∞∑ ∑δ δ
1
The accumulation of a unit DT impulse is a unit sequence and the firstdifference of a unit sequence is an impulse.
61.Sketch the magnitude and phase of each function versus k.
(a) G sinkk
ej
k
[ ] =
−20
28
4π π
(b) G cos sinckk k[ ] =
20
28 40π

M. J. Roberts - 8/16/04
Solutions 2-32
(c) G k k k k k k ej
k
[ ] = +[ ] − +[ ] + [ ] − −[ ] + −[ ]( )δ δ δ δ δπ
8 2 4 2 4 8 8
62.Given the function definitions on the left, find the function values on the right.
(a)
g nn
e n[ ] =+ −3 6
102 g 3[ ]
(b) g Renj
n
[ ] =+
1
2
A complex number of the form, x jy+ , raised to the nth power can be
expressed as re r ej n n jnθ θ( ) = where r is the magnitude of the number,
x y2 2+ , and θ is the angle of the number, tan−
1 y
x.
(c)
g n j n j n[ ] = ( ) + −2 10 42π π g 4[ ]
63.Using MATLAB, for each function below plot the original function and the transformed function.
(a)
g
,
,
,
,
n
n
n n
n n
n
[ ] =
≤− < ≤
− + < ≤>
5 0
5 3 0 4
23 4 8
41 8
2g 3n[ ] vs. n
(b)
g cos cosnn n[ ] =
10
220
24
π π 4 2 1g n +( )[ ] vs. n
(c)
g un e nj
n
[ ] = [ ]82
16
π
gn
2
vs. n
This function has some undefined values.
64.Given the graphical definition of a function, g[n], graph the indicated function(s), h[n]. (a)

M. J. Roberts - 8/16/04
Solutions 2-33
n
g[n]
2 4 6 8-8 -6 -4 -2
2
4
6
-6
-4
-2
h gn n[ ] = −[ ]2 4
g ,n n[ ] = >0 8
n
g[2n - 4]
2 4 6 8-8 -6 -4 -2
2
4
6
-6
-4
-2
(b)
n
g[n]
2 4 6 8-8 -6 -4 -2
2
4
6
-6
-4
-2
h n gn[ ] =
2
g ,n n[ ] = >0 8
(c)
n
g[n]
2 4 6 8-8 -6 -4 -2
2
4
6
-6
-4
-2
h n gn[ ] =
2
g n[ ] is periodic with fundamental period, 8
65.Sketch the accumulation from negative infinity to n of each of these DT functions.
(a) g cos un n n[ ] = ( ) [ ]2π (b) g cos un n n[ ] = ( ) [ ]4π
The answers in (a) and (b) are identical. Why?
66.Find and sketch the magnitude and phase of the even and odd parts of each of this“discrete-k” function.
G kj k
[ ] =−10
1 4

M. J. Roberts - 8/16/04
Solutions 2-34
Ge kj k j k
j k j k k[ ] = −
++ =
−( ) +( ) =+
101 4
101 4
210
1 4 1 410
1 16 2
Go kj k j k j k
j k j k
j k
k[ ] = −
−+ =
−( ) +( ) =+
101 4
101 4
240
1 4 1 440
1 16 2
k-10 10
|Ge[k]|
10
k-10 10
Phase of Ge[k]
- π
π
k-10 10
|Go[k]|
10
k-10 10
Phase of Go[k]
- π
π
67.Find and sketch the even and odd parts of the DT function below.
n
g[n]
2 4 6 8-8 -6 -4 -2
2
4
6
-6
-4
-2
n
g [n]
2 4 6 8-8 -6 -4 -2
2
4
6
-6
-4
-2
n
g [n]
2 4 6 8-8 -6 -4 -2
2
4
6
-6
-4
-2
e o
68.Using MATLAB, plot each of these DT functions. If a function is periodic, find theperiod analytically and verify the period from the plot.
(a) g sinnn[ ] =
32π
M. J. Roberts - 8/16/04
Solutions 2-35
(b) g sin cosnn n[ ] =
+
23
103
π π
g sin cos sin cosnn n n n n[ ] =
+ +
=
+
= =
23
63
43
23
43
π π π π π
Period 3 Period 31 24 34 1 24 34
Period is 3
(c) g cos sinnn n[ ] =
+
5
28
32
5π π
(d) g cosnn[ ] =
10
4Not periodic. Why not?
(e) g cos sinnn n[ ] = −
3
27
26
π π(A trigonometric identity for the product of
two sinusoids will be useful here.)
69.Sketch the following DT functions.
(a) g n n n[ ] = −[ ] + +[ ]5 2 3 1δ δ (b) g n n n[ ] = [ ] + −( )[ ]5 2 3 4 2δ δ
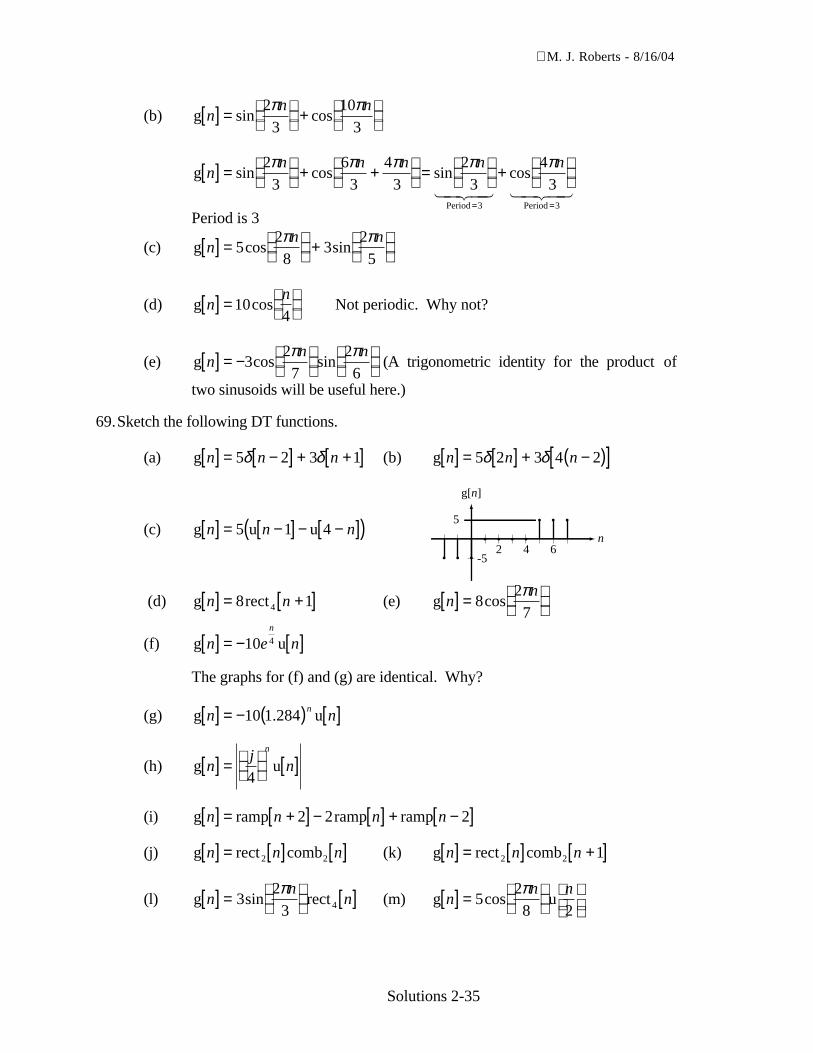
(c) g u un n n[ ] = −[ ] − −[ ]( )5 1 4n
2 4 6
g[n]
5
-5
(d) g rectn n[ ] = +[ ]8 14 (e) g cosnn[ ] =
8
27π
(f) g un e nn
[ ] = − [ ]10 4
The graphs for (f) and (g) are identical. Why?
(g) g . un nn[ ] = − ( ) [ ]10 1 284
(h) g unj
nn
[ ] =
[ ]
4
(i) g ramp ramp rampn n n n[ ] = +[ ] − [ ] + −[ ]2 2 2
(j) g rect combn n n[ ] = [ ] [ ]2 2 (k) g rect combn n n[ ] = [ ] +[ ]2 2 1
(l) g sin rectnn
n[ ] =
[ ]3
23 4
π(m) g cos un
n n[ ] =
52
8 2π

M. J. Roberts - 8/16/04
Solutions 2-36
70.Graph versus k , in the range, − < <10 10k , the magnitude and phase of
(a) X sinckk[ ] =
2
(b) X sinckk
ej
k
[ ] =
−
2
2
4
π
(c) X rectk k ej
k
[ ] = [ ] −
3
2
3
π
Phase is undefined for any k greater than 3.
(d) X kj
k[ ] =+
1
12
(e) X kjk
jk[ ] =
+12
(f) X combk k ej
k
[ ] = [ ] −
2
2
4
π
71.Sketch the even and odd parts of these signals.
(a) x rectn n[ ] = +[ ]5 2
(b) x combn n[ ] = −[ ]3 1
xcomb comb
combe nn n
n[ ] =−[ ] + − −[ ] = −[ ] +3 3
3
1 1
2
1
21 ccomb3 1n +[ ]( )
n-10 10
xe[n]
-1
1
n-10 10
xo[n]
-1
1
(c) x cosnn[ ] = +
15
29 4π π
(d) x sin rectnn
n[ ] =
−[ ]2
415
π
72.What is the numerical value of each of the following accumulations?
(a) ramp nn
[ ]=∑
0
10
(b)12
112
120
6
6nn =∑ = + + +L .

M. J. Roberts - 8/16/04
Solutions 2-37
Using αα
αα
n
n
N
N
N
=
−
∑ ==
−−
0
11
11
,
, otherwise
12
112
112
11
12812
1272560
6
7
nn =∑ =
−
−=
−=
(c)u n
nn
[ ]=−∞
∞
∑ 2(d) comb3
10
10
nn
[ ]=−∑
(e) comb310
10
2nn
[ ]=−∑ (f) sinc n
n
( )=−∞
∞
∑
73.Find the signal energy of each of these signals:
(a) x rectn n[ ] = [ ]5 4 E n nxn n n
= [ ] = [ ] = ( ) ==−∞
∞
=−∞
∞
=−∑ ∑ ∑x rect
2
4
2
4
4
25 25 1 225
(b) x n n n[ ] = [ ] + −[ ]2 5 3δ δ
(c) xu
nn
n[ ] = [ ]
The energy is infinite.
(d) x un nn
[ ] = −
[ ]1
3(e) x cos u un
nn n[ ] =
[ ] − −[ ]( )π
36
74.Find the average signal power of each of these signals:
(a) x un n[ ] = [ ]
PN
nN
nNx
Nn N
N
Nn N
N
Nn
N
= [ ] = [ ] = ( ) =→∞ =−
−
→∞ =−
−
→∞ =
−
∑ ∑ ∑lim x lim u lim1
21
21
21
12
21
21
0
1
(b) x nn[ ] = −( )1
(c) x cosn A F n[ ] = +( )2 0π θ
This is a rather long and involved exercise.
PN
A F nA
NF nx
Nn N
N
Nn N
N
= +( ) = +( )→∞ =−
−
→∞ =−
−
∑ ∑lim cos lim cos1
22
220
21 2
20
1
π θ π θ
Using the trigonometric identity,
M. J. Roberts - 8/16/04
Solutions 2-38
cos cos cos cosx y x y x y( ) ( ) = −( ) + +( )[ ]12
,
PA
NF n
A A
NF nx
Nn N
N
Nn N
N
= + +( )[ ] = + +( )→∞ =−
−
→∞ =−
−
∑ ∑lim cos lim cos2
0
1 2 2
0
1
212
1 4 22 4
4 2π θ π θ
So the average power is a constant, A2
2, plus another term,
lim cosN
n N
NA
NF n
→∞ =−
−
+( )∑2
0
1
44 2π θ ,
whose value depends on the parameters, F0 and θ .
Case 1. 2 0F , an integer.
PA A
N
Ax
Nn N
N
= + ( ) = + ( )[ ]→∞ =−
−
∑2 2 1 2
2 42
21 2lim cos cosθ θ
Case 2. 2 0F , not an integer.
Subcase 1. The signal is periodic. If it is periodic with period, NF0
0
1= .
The square of the function is periodic with period, NF0
0
12
= . For a periodic
signal, PN
nxn k
k N
= [ ]=
+ −
∑1 21
x where “N ” is any integer number of periods of
the signal and where “k” is any integer. Then the average power is
PA A
Nxn k
k N
= + ( )=
+ −
∑2 2 1
2 42cos θ
The summation, A
N n k
k N2 1
42cos θ( )
=
+ −
∑ is zero because the samples are taken at
equal angular intervals over exactly an integer number of periods. Therefore
the average power is PA
x =2
2 .
Subcase 2. The signal is not periodic. This is the hardest case to examine.We cannot use the periodic formula so we must use
PA A
NF nx
Nn N
N
= + +( )→∞ =−
−
∑2 2
0
1
2 44 2lim cos π θ
The summation can be geometrically visualized as the real part of a sum ofvectors in the complex plane, all with unit length and separated from their

M. J. Roberts - 8/16/04
Solutions 2-39
nearest neighbors by the angle, 4 0πF . Since this angle is not any integermultiple of π radians (that case has already been considered), the summation
is of an infinity of vectors at angles which uniformly fill up the full 2πradians of a full circle. We don’t know what that sum is in the limit, but wedo know it cannot grow to infinity because of the cancellation of the vectorsarrayed in the circle and the sum is being divided by N which is going to
infinity. Therefore, in the limit, the average power is PA
x =2
2 , just as in the
periodic case.
PN
n n exn N n
jn
n n
= [ ] = [ ] = = == =
−
= =∑ ∑ ∑ ∑1 1
414
14
1 10
2 2
0
32
2
0
3
0
3
0
x xπ
(d) x
, , , , , , , , , , , , , ,
, , , , , , , , , , , , , ,n
A n
n[ ] =
==
L L
L L
0 1 2 3 8 9 10 1116 17 18 19
0 4 5 6 7 12 1314 15 20 21 22 23
(e) x n ej
n
[ ] =−
π2