chapter 2 patterns of tobacco use, exposure, and health consequences · 2018-06-07 · 24 chapter 2...
TRANSCRIPT

23
Monograph 21: The Economics of Tobacco and Tobacco Control
Section 2 Situation Analysis/Mapping
Chapter 2 Patterns of Tobacco Use,
Exposure, and Health Consequences

24
Chapter 2 Patterns of Tobacco Use,
Exposure, and Health Consequences
Tobacco products, both smoked and smokeless products, are used in a wide variety of forms around the world, and the patterns of use and resulting health and economic burden vary across the globe. Effective tobacco control policies and programs are aimed at reducing the demand for tobacco products and the death, disease, and economic cost of their use. This chapter examines tobacco consumption and prevalence, as well as the impact of tobacco use and secondhand smoke exposure on health and mortality. Specific topics include:
Current patterns of tobacco use across world regions and in selected countries for smoked and smokeless products
Exposure to secondhand smoke, the effects of this exposure on health, and the associated disease burden
Health disparities related to tobacco use
The impact of tobacco use on noncommunicable diseases, communicable diseases, and mortality.
This chapter describes the extent of tobacco use among youths and adults globally by drawing on national or subnational data available for various countries. The chapter also examines the health consequences of tobacco use, including data that is used in planning
and evaluating tobacco control policy and program interventions in many countries.

Monograph 21: The Economics of Tobacco and Tobacco Control
25
Chapter Contents
Introduction ................................................................................................................................................27 Diversity of Tobacco Products Worldwide................................................................................................27 Smoked Tobacco Products .........................................................................................................................29
Prevalence of Tobacco Smoking Among Adults .................................................................................29 Daily and Non-daily Smoking Among Adults.....................................................................................36 Current Cigarette Smoking Among Youth ..........................................................................................42 Global Cigarette Consumption ............................................................................................................45 Global Cigarette Consumption Per Capita ...........................................................................................48
Smokeless Tobacco Products .....................................................................................................................51 Prevalence of Smokeless Tobacco Use Among Adults .......................................................................51 Prevalence of Smokeless Tobacco Use Among Youth........................................................................52
Other Tobacco Products .............................................................................................................................55 Exposure to Secondhand Smoke ................................................................................................................56 Tobacco-Related Health Disparities ..........................................................................................................59 Health Consequences of Tobacco Use .......................................................................................................60
Tobacco Use, Secondhand Smoke Exposure, and Disease..................................................................60 Stages of the Tobacco Epidemic and Global Implications ..................................................................62 Impact of Tobacco on Noncommunicable Diseases ............................................................................63 Impact of Tobacco on Communicable Diseases ..................................................................................64 Impact of Tobacco Mortality, by Region .............................................................................................64 Disease Burden Attributable to Secondhand Smoke Exposure ...........................................................64
Summary ....................................................................................................................................................65 Research Needs ..........................................................................................................................................66
Conclusions ................................................................................................................................................66 References ..................................................................................................................................................67
Figures and Tables
Figure 2.1 Estimated and Projected Prevalence Rates for Tobacco Smoking, by WHO Region,
Males, 2000–2025 ................................................................................................................31 Figure 2.2 Estimated and Projected Prevalence Rates for Tobacco Smoking, by WHO Region,
Females, 2000–2025 .............................................................................................................32
Figure 2.3 Percentage of Global Current Tobacco Smokers Age 15 Years and Over, by Country,
2013 ......................................................................................................................................35 Figure 2.4 Percentage of People Age 15 Years and Over Who Currently Smoke Tobacco Daily
and Non-daily, by WHO Region, 2013 ................................................................................38
Figure 2.5 Percentage of People Age 15 Years and Over Who Currently Smoke Tobacco Daily
and Non-daily, by Country Income Group, 2013 .................................................................39 Figure 2.6 Percentage of Current Smokers Age 15 Years and Over Who are Daily Tobacco
Smokers, by Country, 2008–2014 ........................................................................................41 Figure 2.7 Prevalence of Current Cigarette Smoking Among Youth, by WHO Region,
2007–2014 ............................................................................................................................44 Figure 2.8 Prevalence of Current Cigarette Smoking Among Youth, by Country Income Group,
2007–2014 ............................................................................................................................45 Figure 2.9 Global Consumption of Cigarette Sticks (in Billions), by WHO Region, 2000–2013 ........47

Chapter 2: Patterns of Tobacco Use, Exposure, and Health Consequences
26
Figure 2.10 Global Consumption of Cigarette Sticks (in Billions), by Country Income Group,
2000–2013 ............................................................................................................................48 Figure 2.11 Global Per Capita Cigarette Consumption Among People Age 15 Years and Older,
by WHO Region, 2000–2013 ...............................................................................................50 Figure 2.12 Per Capita Cigarette Consumption Among People Age 15 Years and Older, Globally
and by Country Income Group, 2000–2013 .........................................................................51 Figure 2.13 Prevalence of Smokeless Tobacco Use Among Youth Ages 13–15 Years, by WHO
Region, 2007–2014 ..............................................................................................................54 Figure 2.14 Prevalence of Smokeless Tobacco Use Among Youth Ages 13–15 Years, by Country
Income Group, 2007–2014 ...................................................................................................55 Figure 2.15 Health Consequences Causally Linked to Smoking ............................................................61 Figure 2.16 Health Consequences Causally Linked to Secondhand Smoke Exposure ...........................62
Figure 2.17 Four-Stage Model of the Cigarette Epidemic ......................................................................63
Table 2.1 Estimated and Projected Prevalence Rates (%) for Tobacco Smoking, by WHO
Region, Country Income Group, and Sex, 2000–2025 ....................................................... 29 Table 2.2 Estimated and Projected Number of Tobacco Smokers (in Millions), by WHO
Region, Country Income Group, and Sex, 2000–2025 ....................................................... 33 Table 2.3 Number of Current Tobacco Smokers Age 15 Years and Over (in Millions), by
Country, 2013 ...................................................................................................................... 35 Table 2.4 Percentage of People Age 15 Years and Over Who Currently Smoke Tobacco Daily
and Non-daily, by WHO Region and Country Income Group, 2013 .................................. 36 Table 2.5 Percentage of People Age 15 Years and Over Who Currently Smoke Tobacco Daily,
in Selected Countries, by Sex, 2008–2014 .......................................................................... 40 Table 2.6 Mean Number of Cigarettes Smoked Per Day Per Smoker, 2008–2014 ............................ 42
Table 2.7 Prevalence of Cigarette Smoking Among Youth Ages 13–15 Years, by WHO Region
and Country Income Group, 2007–2014 ............................................................................. 43 Table 2.8 Global Consumption of Cigarette Sticks (in Billions), by WHO Region and Country
Income Group, 2000–2013 .................................................................................................. 46 Table 2.9 Per Capita Consumption of Cigarette Sticks Among People Age 15 Years and Older,
by WHO Region and Country Income Group, 2000–2013 ................................................. 49 Table 2.10 Prevalence of Adult Current Smokeless Tobacco Use, by WHO Region and Country
Income Group, 2010 ............................................................................................................ 52
Table 2.11 Prevalence of Smokeless Tobacco Use Among Youth Ages 13–15 Years, by WHO
Region and Country Income Group, 2007–2014 ................................................................ 53 Table 2.12 Adult Exposure to Secondhand Smoke at Work and at Home in Selected Countries,
2008–2014 ........................................................................................................................... 57
Table 2.13 Percentage of Youth Ages 13–15 Years Exposed to Secondhand Smoke Inside the
Home, by WHO Region and Country Income Group, 2007–2014 ..................................... 58 Table 2.14 Percentage of Youth Ages 13–15 Years Exposed to Secondhand Smoke Outside the
Home, by WHO Region and Country Income Group, 2007–2014 ..................................... 59
Monograph 21: The Economics of Tobacco and Tobacco Control
27
Introduction
Tobacco is the only legal product that kills a large proportion of its consumers when used as intended by
its manufacturers. The World Health Organization (WHO) has estimated that around 6 million people
die each year from tobacco use1 including 600,000 who die from exposure to secondhand smoke (SHS).
2
Unless strong tobacco control measures are put in place, the number of tobacco-related direct and
indirect deaths is projected to increase to 8 million by 2030, with more than 80% of these deaths
expected to occur in low- and middle-income countries (LMICs).3
The patterns of tobacco use and health effects of the tobacco epidemic vary throughout the world. It is
very important to understand current patterns and trends in tobacco use worldwide (both smoking and
smokeless as well as exposure to SHS) in order to address the many complex issues associated with the
economics of tobacco control. The purpose of this chapter is to provide a brief overview of the global
information available on the use of tobacco products worldwide and in selected countries, as well as the
impact of tobacco use on disease and mortality.
The information on tobacco smoking among adults presented in this chapter is drawn from the
WHO Global Report on Trends in Prevalence of Tobacco Smoking, 2015.1 Data on tobacco smoking
among adults in the United States are derived from the National Adult Tobacco Survey (NATS).4 Data
for smoking and smokeless use among youth ages 13–15 years come from the Global Youth Tobacco
Survey (GYTS),5 the Health Behaviour in School-Aged Children Survey (HBSC)
6 (mostly in European
countries), and the National Youth Tobacco Survey (NYTS)7 (in the United States). Information on
smokeless tobacco (ST) is drawn from WHO records as well as the report Smokeless Tobacco and
Public Health: A Global Perspective8 produced by the National Cancer Institute (NCI) of the National
Institutes of Health and by the Centers for Disease Control and Prevention (CDC), both agencies of the
U.S. Department of Health and Human Services. Information on health outcomes from tobacco use is
derived from the WHO Global Report: Mortality Attributable to Tobacco,9 which provides information
on mortality consequences by country and across regions. Data from these sources have been used
extensively by many countries in planning and evaluating their tobacco control policy and program
interventions. (For more information on how the data were used in calculations, please see the Statistical
Annex at the end of this monograph.)
Consistent with the rest of the monograph, the data for this chapter have been analyzed by geographical
area. Countries were organized by WHO Region—the African, Americas, South-East Asia, Eastern
Mediterranean, European, and Western Pacific Regions. One adjustment was made to this organization:
all countries classified as high income by the Organisation for Economic Co-operation and Development
(OECD) were grouped into one category regardless of their WHO Region. These high-income countries
are: Australia, Austria, Belgium, Canada, Chile, Czech Republic, Denmark, Estonia, Finland, France,
Germany, Greece, Iceland, Ireland, Israel, Italy, Japan, Luxembourg, the Netherlands, New Zealand,
Norway, Poland, Portugal, Republic of Korea, Slovakia, Slovenia, Spain, Sweden, Switzerland, the
United Kingdom of Great Britain and Northern Ireland, and the United States. Thus, the tables and
figures in this chapter present information for these countries separately from their WHO Region.
Diversity of Tobacco Products Worldwide
A wide variety of tobacco products, differing in design, ingredients, and modes of consumption, are
used around the world. The use and impact of these diverse tobacco products are complex. Tobacco
products have traditionally been broadly classified into two categories—those that are smoked and those

Chapter 2: Patterns of Tobacco Use, Exposure, and Health Consequences
28
that are chewed or sniffed, that is, ST products. Many tobacco products contain added flavors and other
ingredients in addition to tobacco, and no tobacco product has been shown to be free of harm.10
Smoked products include manufactured and roll-your-own cigarettes, cigars, bidis, kreteks, waterpipe,
and many others. ST products can be premade (sold ready to use) or custom-made (assembled by the
user or a vendor according to user preferences), and may include a variety of non-tobacco ingredients
such as ashes, alkaline agents, areca nut, spices, catechu, or other plant materials.8 A third class of
products has recently emerged, often called electronic nicotine delivery systems (ENDS) (e.g., electronic
cigarettes, e-cigarettes, e-hookah, vape pens, tank systems). ENDS are battery-powered devices
designed to heat a liquid, which typically contains nicotine, into an aerosol for inhalation by the user.
These products are very diverse, encompassing hundreds of products and brands.11
Manufactured cigarettes are the most commonly used form of tobacco, accounting for 92.3% of tobacco
product sales worldwide12
; as a consequence, cigarettes cause most global tobacco-related harm.10
Among some populations, however, ST products predominate (e.g., in the South-East Asia Region).8
Box 2.1: Characteristics of Types of Products
Manufactured cigarettes consist of shredded or reconstituted tobacco along with a variety of additives. They are wrapped in paper, often have a filter, and are mass-produced by machines. Manufactured cigarettes, the predominant form of tobacco used worldwide, accounts for 92.3% of total tobacco sales in the world.12
Kreteks, or clove cigarettes, contain minced, dried clove buds in addition to tobacco and are produced and commonly used in Indonesia.
Bidis are small hand-rolled cigarettes wrapped in a tendu leaf; they are commonly used in India as an inexpensive alternative to conventional cigarettes.
Cigars, which can be hand or machine rolled, consist of a roll of tobacco wrapped in tobacco leaf or tobacco-containing paper. Little cigars (or cigarillos) are approximately the size of a cigarette and may contain added flavorings.
Waterpipe (also known as hookah or shisha) smoking involves inhaling tobacco smoke though a water basin. A waterpipe typically includes a head (in which a brick of flavored tobacco, along with coal, is burned), a large body housing the water bowl, and a hose for inhalation. Waterpipe use is most common in the Middle East but has recently gained popularity in many other regions.
Moist snuff, or dip, is typically made of damp and finely ground or shredded tobacco. A lump of this product is placed between the lip and the gum and held there. Snus is a traditionally Swedish smokeless form of moist, fine tobacco that is typically pasteurized.
Gutka contains betel quid (betel leaf, areca nut, and slaked lime), tobacco, and a variety of flavorings. Gutka is commercially available in foil packets/sachets and tins and is widely used in the Indian subcontinent and throughout the Asian and Pacific regions.
Electronic nicotine delivery systems (ENDS) are battery-powered devices designed to heat a liquid (typically of propylene glycol, glycerin, nicotine, flavors, and sometimes other chemicals) into an aerosol for inhalation by the user.

Monograph 21: The Economics of Tobacco and Tobacco Control
29
Smoked Tobacco Products
Prevalence of Tobacco Smoking Among Adults
The information presented in this section is derived from data generated for the WHO Global Report on
Trends in Prevalence of Tobacco Smoking, 2015.1 This report produced fitted estimates for current and
daily tobacco smoking, as well as current and daily cigarette smoking for the years 2000, 2005, 2010,
2013 and then, based on the trends for these years, projected to 2025. Projections are only shown for the
years 2015, 2020, and 2025. Data for 2013 have been used to understand the currently prevailing status
of tobacco use levels.
As shown in Table 2.1, the results for 2013 indicate that 21.2% of the world’s population age 15 years
and over (both sexes combined) were current smokers, which represents a decrease in prevalence from
an average of 26.5% in 2000, and 22.1% in 2010. Following the High-Level Meeting of the United
Nations General Assembly on the Prevention and Control of Noncommunicable Diseases in 2012, WHO
Member States unanimously agreed in 2013 to a 30% relative reduction target in global prevalence of
tobacco use (both smoking and smokeless) by 2025, using 2010 as baseline.1 Applying this target
reduction to the 2010 baseline of 22.1% results in an expected absolute target of 15.5% in 2025. If
countries continue to apply tobacco control measures with the same intensity as they did during the
period 1990–2010, the WHO projection exercise indicates that, collectively, countries will only achieve
a level of 18.9% in 2025, 3.4% above the reduction target.
Table 2.1 Estimated and Projected Prevalence Rates (%) for Tobacco Smoking, by WHO Region, Country Income Group, and Sex, 2000–2025
Sex WHO Region
Estimated prevalence Projected prevalence 2025
target† Target gap‡ 2000 2005 2010 2013 2015* 2020* 2025*
Male Global 42.7 39.4 36.9 35.8 35.2 34.0 33.2 25.8 7.4
African 20.7 21.6 23.2 24.7 26.0 30.1 34.7 16.2 18.5
Americas 32.9 28.4 24.7 22.8 21.6 18.9 16.7 17.3 -0.6
Eastern Mediterranean 32.0 33.0 35.1 36.8 38.1 41.6 45.2 24.6 20.6
European 59.2 54.7 50.7 48.5 47.2 43.9 40.7 35.5 5.2
South-East Asia 40.6 36.3 33.1 31.7 30.8 29.0 27.5 23.2 4.3
Western Pacific 55.9 52.9 50.4 49.4 48.7 47.1 45.0 35.3 9.7
High-income OECD 39.0 34.6 30.8 28.6 27.5 24.4 21.8 21.6 0.2
Female Global 10.4 8.7 7.3 6.6 6.2 5.4 4.7 5.1 -0.4
African 3.6 3.0 2.5 2.3 2.1 1.8 1.6 1.8 -0.2
Americas 16.8 13.9 11.5 10.4 9.6 8.1 6.8 8.1 -1.3
Eastern Mediterranean 5.2 3.8 3.0 2.8 2.7 2.5 2.4 2.1 0.3
European 18.2 17.2 16.1 15.6 15.2 14.3 13.5 11.3 2.2
South-East Asia 6.0 4.1 2.9 2.4 2.1 1.6 1.2 2.0 -0.8
Western Pacific 3.7 3.1 2.6 2.4 2.3 2.1 1.8 1.8 -0.0
High-income OECD 23.7 21.1 18.8 17.7 16.8 15.1 13.5 13.2 0.3

Chapter 2: Patterns of Tobacco Use, Exposure, and Health Consequences
30
Table 2.1 (continued)
Sex WHO Region
Estimated prevalence Projected prevalence 2025
target† Target gap‡ 2000 2005 2010 2013 2015* 2020* 2025*
Both sexes Global 26.5 24.0 22.1 21.2 20.7 19.7 18.9 15.5 3.4
African 12.1 12.2 12.8 13.4 14.0 15.9 18.1 9.0 9.1
Americas 24.6 20.9 17.9 16.4 15.4 13.3 11.6 12.5 -0.9
Eastern Mediterranean 18.9 18.8 19.6 20.4 21.0 22.7 24.5 13.7 10.8
European 37.4 34.8 32.3 31.0 30.2 28.1 26.2 22.6 3.6
South-East Asia 23.6 20.5 18.2 17.2 16.7 15.5 14.5 12.7 1.8
Western Pacific 30.3 28.5 27.0 26.4 26.0 25.1 23.9 18.9 5.0
High-income OECD 31.1 27.7 24.6 23.0 22.0 19.6 17.6 17.2 0.4
Sex World Bank country income group
Estimated prevalence Projected prevalence 2025
target† Target gap‡ 2000 2005 2010 2013 2015* 2020* 2025*
Male Global 42.7 39.4 36.9 35.8 35.2 34.0 33.2 25.8 7.4
High-income 42.1 37.7 34.1 32.1 31.0 28.4 26.3 23.9 2.4
Upper middle-income 49.3 46.1 43.6 42.4 41.6 40.0 38.2 30.5 7.7
Lower middle-income 36.9 34.3 32.7 32.3 32.1 32.0 32.3 22.9 9.4
Low-income 37.5 33.8 31.2 30.2 29.9 30.0 31.0 21.8 9.2
Female Global 10.4 8.7 7.3 6.6 6.2 5.4 4.7 5.1 -0.4
High-income 22.7 20.6 18.5 17.5 16.8 15.3 13.9 13.0 1.0
Upper middle-income 7.8 6.5 5.5 5.1 4.8 4.2 3.7 3.9 -0.2
Lower middle-income 5.6 4.2 3.2 2.8 2.5 2.0 1.7 2.2 -0.5
Low-income 6.2 4.5 3.4 2.9 2.7 2.2 1.9 2.4 -0.5
Both sexes Global 26.5 24.0 22.1 21.2 20.7 19.7 18.9 15.5 3.4
High-income 32.1 28.9 26.1 24.6 23.7 21.7 20.0 18.3 1.7
Upper middle-income 28.7 26.4 24.6 23.8 23.3 22.2 21.1 17.2 3.9
Lower middle-income 21.5 19.4 18.1 17.7 17.5 17.2 17.2 12.7 4.5
Low-income 21.7 19.0 17.1 16.4 16.1 15.9 16.2 12.0 4.2
*Projections are shown for the years 2015, 2020, and 2025. †The 2025 target was calculated as a 30% relative reduction using the 2010 estimated prevalence rate as the baseline.
‡The target gap was calculated as the absolute difference between the 2025 projected prevalence rate and the 2025 target.
Notes: WHO = World Health Organization. High-income OECD countries = countries defined as high-income by the Organisation for Economic Co-operation and Development. Country income group classification based on World Bank Analytical Classifications for 2013. High-income OECD countries are excluded from their respective regions. Source: Based on data from World Health Organization 2015.1 For more information, see the Statistical Annex.

Monograph 21: The Economics of Tobacco and Tobacco Control
31
In addition to the data for both sexes combined, the WHO prevalence trends analysis was conducted
separately for males and females age 15 years and over. Using the same 30% relative reduction target,
the 2010 global tobacco smoking levels of 36.9% for males and 7.3% for females translate into 2025
target levels of 25.8% for males and 5.1% for females. The projections to 2025 by sex indicate that
globally males will only achieve a level of 33.2% in 2025, or 7.4% above the target. With a projected
level of 4.7%, females are expected to reach the 2025 target of 5.1% (Table 2.1).1
Trends for each region and the high-income OECD countries (Figures 2.1 and 2.2) indicate that
prevalence rates for males and females in all regions are trending downwards, except for male
prevalence rates in the African and Eastern Mediterranean Regions, which are projected to increase
between 2000 and 2025. The countries within the Region of the Americas (excluding Canada and the
United States, which are grouped in the OECD category) are the only group of countries that are
projected to reach the 2025 tobacco reduction target of 30% for both males and females. No other group
is projected to reach the target for males, but the high-income OECD group will be very close to the
2025 target level. Unless strong action is taken in the African and Eastern Mediterranean Regions to
address the tobacco epidemic, the failure to reach the target for males will be particularly marked, at
18.5% and 20.6% above those regions’ respective 2025 targets for males.1
Figure 2.1 Estimated and Projected Prevalence Rates for Tobacco Smoking, by WHO Region, Males, 2000–2025
Notes: WHO = World Health Organization. High-income OECD countries = countries defined as high-income by the Organisation for Economic Co-operation and Development. High-income OECD countries are excluded from their respective regions. Projections are shown for the years 2015, 2020, and 2025. Source: Based on data from World Health Organization 2015.1 For more information, see the Statistical Annex.

Chapter 2: Patterns of Tobacco Use, Exposure, and Health Consequences
32
Figure 2.2 Estimated and Projected Prevalence Rates for Tobacco Smoking, by WHO Region, Females, 2000–2025
Notes: WHO = World Health Organization. High-income OECD countries = countries defined as high-income by the Organisation for Economic Co-operation and Development. High-income OECD countries are excluded from their respective regions. Projections are shown for the years 2015, 2020, and 2025. Source: Based on data from World Health Organization 2015.1 For more information, see the Statistical Annex.
WHO has estimated that the number of smokers age 15 years and older in the world has changed very
little over the past 15 years, remaining at slightly more than 1.11 billion since the year 2000 (Table 2.2).1
This number is not expected to decrease in the near future, and may reach about 1.15 billion in 2025.
Importantly, the global lack of decrease in the number of smokers is due mainly to population growth, as
the prevalence of smoking is decreasing in most regions. In 2013, there were approximately 349 million
smokers in the Western Pacific Region and 228 million smokers in the South-East Asia Region,
accounting for more than 50% of the total number of smokers in the world. Between 2000 and 2013, the
number of smokers in the high-income OECD countries decreased by 45 million people, from 248 to
203 million. This number is projected to decrease further to 163 million smokers by 2025 (Table 2.2).1

Monograph 21: The Economics of Tobacco and Tobacco Control
33
Table 2.2 Estimated and Projected Number of Tobacco Smokers (in Millions), by WHO Region, Country Income Group, and Sex, 2000–2025
Sex WHO Region
Estimated Projected
2000 2005 2010 2013 2015* 2020* 2025*
Male Global 906 917 928 938 946 972 1,006
African 38 46 56 65 73 97 129
Americas 55 52 49 48 47 44 42
Eastern Mediterranean 47 57 69 78 85 102 123
European 89 85 81 78 76 71 66
South-East Asia 215 213 211 213 214 217 220
Western Pacific 311 325 331 333 333 332 327
High-income OECD 151 140 129 123 119 108 99
Female Global 222 202 184 175 168 154 142
African 7 6 6 6 6 6 6
Americas 29 27 24 23 22 20 18
Eastern Mediterranean 7 6 6 6 6 6 6
European 31 31 29 28 28 26 25
South-East Asia 31 23 18 16 14 12 10
Western Pacific 20 18 17 16 15 14 13
High-income OECD 97 91 84 80 77 70 64
Both sexes Global 1,128 1,119 1,112 1,113 1,114 1,126 1,147
African 45 52 63 72 79 103 135
Americas 84 79 74 71 69 64 59
Eastern Mediterranean 54 63 75 84 90 108 129
European 120 116 110 106 104 97 91
South-East Asia 246 236 229 228 228 229 229
Western Pacific 331 343 348 349 348 346 340
High-income OECD 248 230 213 203 196 179 163
Sex World Bank country income group
Estimated Projected
2000 2005 2010 2013 2015* 2020* 2025*
Male Global 906 917 928 938 946 972 1,006
High-income 193 182 172 166 162 151 143
Upper middle-income 392 403 408 409 409 408 405
Lower middle-income 252 261 274 286 295 321 351
Low-income 69 70 73 77 80 92 107

Chapter 2: Patterns of Tobacco Use, Exposure, and Health Consequences
34
Table 2.2 (continued)
Sex World Bank country income group
Estimated Projected
2000 2005 2010 2013 2015* 2020* 2025*
Female Global 222 202 184 175 168 154 142
High-income 112 106 99 95 91 85 78
Upper middle-income 61 56 51 48 46 42 38
Lower middle-income 38 31 26 24 23 20 18
Low-income 12 10 8 8 7 7 7
Both sexes Global 1,128 1,119 1,112 1,113 1,114 1,126 1,147
High-income 305 288 271 260 253 236 221
Upper middle-income 453 459 459 457 455 450 443
Lower middle-income 290 292 301 310 318 341 369
Low-income 80 80 82 85 88 99 114
*Projections are shown for the years 2015, 2020, and 2025. Notes: WHO = World Health Organization. High-income OECD countries = countries defined as high-income by the Organisation for Economic Co-operation and Development. High-income OECD countries are excluded from their respective regions. Country income group classification based on World Bank Analytical Classifications for 2013. Source: Based on data from World Health Organization 2015.1 For more information, see the Statistical Annex.
Analyzing global data for 2013 by sex, there were just over five times as many male smokers
(938 million) as female smokers (175 million) (Table 2.2). The majority of male adult smokers lived in
the WHO Regions of the Western Pacific (333 million) and South-East Asia (213 million), accounting
for 58% of all male smokers in the world. A very different picture emerges for females. Of the
175 million female smokers age 15 years and over in 2013, the large majority (80 million, or 46%) lived
in high-income OECD countries. When using the World Bank country income groups, this proportion is
even higher: 54% of female smokers globally live in high-income countries (HICs).1 The lower
prevalence of cigarette smoking among women in many LMICs and certain world regions results from
many factors including low social acceptability of women’s tobacco use, various sociocultural and
religious factors, women’s limited financial resources, and others.13
However, in many LMICs,
traditional constraints on women’s tobacco use are likely to erode as women’s social, legal, economic,
and political status improves.14
Evidence indicates that the influence of norms and traditions may
already be weakening. For example, data from 14 countries that participated in the Global Adult
Tobacco Survey (GATS)15
show that women are increasingly initiating smoking at an age similar to that
of men.16
Thus, continued vigilance is warranted in order to avert a rise in smoking among women.
Fitted estimates to generate the underlying trends for most countries are also available in the
WHO Global Report on Trends in Prevalence of Tobacco Smoking, 2015.1 The data for 2013 indicate
that nearly two-thirds of the world’s smokers lived in just 13 countries (Bangladesh, Brazil, People’s
Republic of China, Germany, India, Indonesia, Japan, Pakistan, Philippines, Russian Federation, Turkey,
United States, and Viet Nam) (Table 2.3 and Figure 2.3). These 13 countries accounted for a total of
736.3 million smokers (646.2 million males and 90.1 million females), with the remaining countries
accounting for 376.9 million smokers.

Monograph 21: The Economics of Tobacco and Tobacco Control
35
Table 2.3 Number of Current Tobacco Smokers Age 15 Years and Over (in Millions), by Country, 2013
Country Males Females Both sexes
Global 938.5 174.7 1,113.2
Bangladesh 23.1 0.4 23.6
Brazil 15.0 9.5 24.6
China 292.1 11.5 303.5
Germany 10.6 8.7 19.3
India 96.7 8.5 105.2
Indonesia 64.7 3.1 67.8
Japan* 19.5 5.8 25.3
Pakistan 23.9 1.8 25.7
Philippines 14.4 2.6 17.0
Russian Federation 32.6 12.8 45.4
Turkey 11.5 3.8 15.3
United States* 25.7 21.0 46.7
Viet Nam 16.4 0.5 16.9
Other 182 countries 292.3 84.6 376.9
*Data for cigarette smokers only. Source: World Health Organization 2015.1
Figure 2.3 Percentage of Global Current Tobacco Smokers Age 15 Years and Over, by Country, 2013
Note: Data for the United States and Japan only include cigarette smokers. Source: World Health Organization 2015.1

Chapter 2: Patterns of Tobacco Use, Exposure, and Health Consequences
36
The majority of the male smokers of the world, 292.1 million (31.1%), live in China. Although the
prevalence of smoking among women in China is relatively low, the sheer size of its population gives
China the third-largest number of female smokers (11.5 million), after the United States (21.0 million)
and the Russian Federation (12.8 million).1
Daily and Non-daily Smoking Among Adults
Current tobacco smoking includes both daily and non-daily (i.e., occasional) smoking. Differences in
smoking behavior, such as daily versus non-daily smoking, may result from different patterns of tobacco
dependence as well as cultural, social, economic, and environmental influences. As depicted in
Table 2.4 and Figure 2.4, WHO estimated that in 2013, world prevalence of current tobacco smoking
was 21.2% (35.8% for males and 6.6% for females). The large majority of current tobacco smokers
(83.0%) used tobacco daily; 83.9% of male current smokers and 77.8% of female current smokers were
daily smokers.1
Table 2.4 Percentage of People Age 15 Years and Over Who Currently Smoke Tobacco Daily and Non-daily, by WHO Region and Country Income Group, 2013
Sex WHO Region
Prevalence of smoking Proportion of daily
to current Current Daily Non-daily
Male Global 35.8 30.0 5.8 83.9
African 24.7 19.1 5.6 77.4
Americas 22.8 15.9 6.8 70.0
Eastern Mediterranean 36.8 30.9 6.0 83.8
European 48.5 41.3 7.2 85.1
South-East Asia 31.7 27.5 4.2 86.8
Western Pacific 49.4 42.3 7.1 85.6
High-income OECD 28.6 23.7 5.0 82.6
Female Global 6.6 5.2 1.5 77.8
African 2.3 1.6 0.6 71.4
Americas 10.4 7.4 3.0 70.9
Eastern Mediterranean 2.8 2.1 0.8 73.2
European 15.6 12.1 3.5 77.5
South-East Asia 2.4 1.9 0.5 78.0
Western Pacific 2.4 2.0 0.4 82.2
High-income OECD 17.7 14.1 3.6 79.8

Monograph 21: The Economics of Tobacco and Tobacco Control
37
Table 2.4 (continued)
Sex WHO Region
Prevalence of smoking Proportion of daily
to current Current Daily Non-daily
Both sexes Global 21.2 17.6 3.6 83.0
African 13.4 10.3 3.1 76.8
Americas 16.4 11.5 4.9 70.3
Eastern Mediterranean 20.4 16.9 3.4 83.1
European 31.0 25.7 5.3 83.1
South-East Asia 17.2 14.9 2.4 86.2
Western Pacific 26.4 22.6 3.9 85.4
High-income OECD 23.0 18.8 4.3 81.5
Sex World Bank country income group
Prevalence of smoking Proportion of daily
to current Current Daily Non-Daily
Male Global 35.8 30.0 5.8 83.9
High-income 32.1 26.8 5.3 83.5
Upper middle-income 42.4 35.7 6.7 84.3
Lower middle-income 32.3 27.3 5.0 84.5
Low-income 30.2 24.5 5.7 81.0
Female Global 6.6 5.2 1.5 77.8
High-income 17.5 13.9 3.6 79.7
Upper middle-income 5.1 3.9 1.2 76.5
Lower middle-income 2.8 2.1 0.7 75.1
Low-income 2.9 2.1 0.8 71.1
Both sexes Global 21.2 17.6 3.6 83.0
High-income 24.6 20.2 4.4 82.1
Upper middle-income 23.8 19.9 3.9 83.4
Lower middle-income 17.7 14.8 2.9 83.8
Low-income 16.4 13.1 3.3 80.1
Notes: Current smoking is the sum of the prevalences of daily and non-daily smoking. WHO = World Health Organization. High-income OECD countries = countries defined as high-income by the Organisation for Economic Co-operation and Development. High-income OECD countries are excluded from their respective regions. Country income group classification based on World Bank Analytical Classifications for 2013. Source: World Health Organization 2015.1

Chapter 2: Patterns of Tobacco Use, Exposure, and Health Consequences
38
Figure 2.4 Percentage of People Age 15 Years and Over Who Currently Smoke Tobacco Daily and Non-daily, by WHO Region, 2013
Notes: WHO = World Health Organization. High-income OECD countries = countries defined as high-income by the Organisation for Economic Co-operation and Development. High-income OECD countries are excluded from their respective regions. Source: World Health Organization 2015.1
Among males, the proportion of daily to current smokers was higher in the Eastern Mediterranean,
European, South-East Asia, and Western Pacific Regions, with values ranging between 84% and 87%.
In contrast, 70% of male current smokers in the Region of the Americas and 77% in the African Region
were daily smokers. Among females, the proportion of daily to current smokers was higher than
80% in the Western Pacific Region only, whereas the proportion for all other Regions ranged between
71% and 78%.1
The above pattern was essentially replicated when using World Bank country income group
categories (Table 2.4 and Figure 2.5). The proportion of daily to current tobacco smoking was lowest
in low-income countries for both males and females.

Monograph 21: The Economics of Tobacco and Tobacco Control
39
Figure 2.5 Percentage of People Age 15 Years and Over Who Currently Smoke Tobacco Daily and Non-daily, by Country Income Group, 2013
Note: Country income group classification based on World Bank Analytical Classifications for 2013. Source: World Health Organization 2015.1
Table 2.5 and Figure 2.6 show data derived from GATS. For data on adult tobacco use in the United
States, NATS was used. Analysis of data in this figure and table provides a largely consistent picture of
daily versus current tobacco smoking. The proportion of daily to current smoking was about 75% or
greater in 23 of the 27 countries that had undertaken the survey. Exceptions to the overall picture were
the United States and Romania (both at about 61%) and two Central American countries, Mexico and
Panama (below 50%). This means that for most countries included in the analysis, the majority of
smokers are daily smokers.

Chapter 2: Patterns of Tobacco Use, Exposure, and Health Consequences
40
Table 2.5 Percentage of People Age 15 Years and Over Who Currently Smoke Tobacco Daily, in Selected Countries, by Sex, 2008–2014
Both sexes Males Females
Country Current Daily Daily to current Current Daily
Daily to current Current Daily
Daily to current
Argentina 22.1 17.1 77.4 29.4 21.9 74.5 15.6 12.7 81.4
Bangladesh 23.0 20.9 90.9 44.7 40.7 91.1 1.5 1.3 86.7
Brazil 17.2 15.1 87.8 21.6 18.9 87.5 13.1 11.5 87.8
China 28.1 24.1 85.8 52.9 45.4 85.8 2.4 2.0 83.3
Egypt 19.4 18.5 95.4 37.7 35.8 95.0 0.5 0.5 100.0
Greece 38.2 36.6 95.8 51.2 49.7 97.1 25.7 23.9 93.0
India 14.0 10.7 76.4 24.3 18.3 75.3 2.9 2.4 82.8
Indonesia 34.8 29.2 83.9 67.0 56.7 84.6 2.7 1.8 66.7
Kazakhstan 22.4 19.1 85.3 42.4 36.9 87.0 4.5 3.2 71.1
Kenya 7.8 6.0 76.9 15.1 11.6 76.8 0.8 0.6 75.0
Malaysia 23.1 20.9 90.5 43.9 39.9 90.9 1.0 0.7 70.0
Mexico 15.9 7.6 47.8 24.8 11.8 47.6 7.8 3.7 47.4
Nigeria 3.9 2.9 74.4 7.3 5.6 76.7 0.4 0.3 75.0
Pakistan 12.4 11.5 92.7 22.2 20.6 92.8 2.1 2.0 95.2
Panama 6.1 2.8 45.9 9.4 4.4 46.8 2.8 1.2 42.9
Philippines 28.3 22.5 79.5 47.7 38.2 80.1 9.0 6.9 76.7
Poland 30.3 27.0 89.1 36.9 33.5 90.8 24.4 21.0 86.1
Qatar 12.1 9.5 78.5 20.2 16.5 81.7 3.1 1.7 54.8
Romania 26.7 16.5 61.8 37.4 17.6 47.1 16.7 14.1 84.4
Russian Federation
39.1 33.8 86.4 60.2 55.0 91.4 21.7 16.3 75.1
Senegal 5.4 4.9 90.7 10.7 9.7 90.7 0.4 0.3 75.0
Thailand 24.0 21.5 89.6 46.6 42.0 90.1 2.6 2.1 80.8
Turkey 27.1 23.8 87.8 41.5 37.3 89.9 13.1 10.7 81.7
Ukraine 28.8 25.5 88.5 50.0 45.4 90.8 11.2 8.9 79.5
United States* 22.3 13.7 61.4 27.0 15.5 57.4 18.1 12.1 66.9
Uruguay 25.0 20.4 81.6 30.7 24.8 80.8 19.8 16.4 82.8
Viet Nam 23.8 19.5 81.9 47.4 38.7 81.6 1.4 1.2 85.7
*Shows data for smokers age 18 years and older from the U.S. National Adult Tobacco Survey. Note: Current smoking is the sum of the prevalences of daily and non-daily smoking. Sources: Global Adult Tobacco Survey 2008–2014.15 National Adult Tobacco Survey 2013–2014.4
Monograph 21: The Economics of Tobacco and Tobacco Control
41
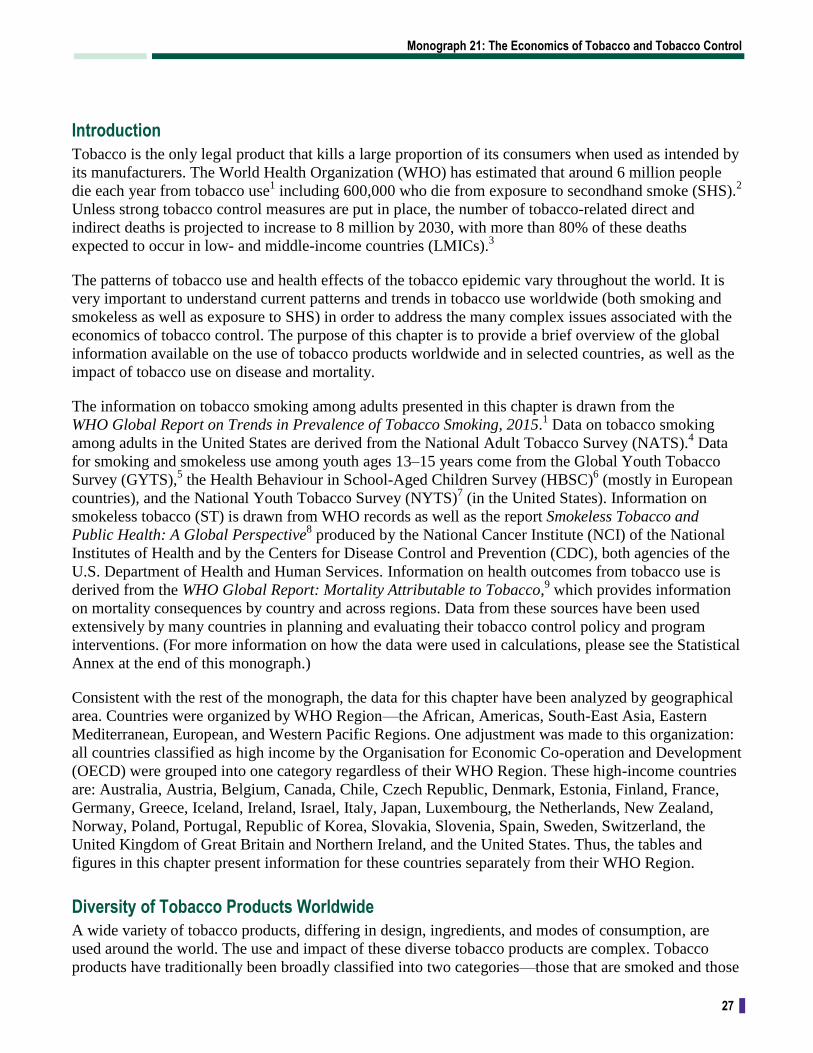
Figure 2.6 Percentage of Current Smokers Age 15 Years and Over Who are Daily Tobacco Smokers, by Country, 2008–2014
Notes: Current smoking is the sum of the prevalences of daily and non-daily smoking. Data presented for the United States is for smokers age 18 and older based on the National Adult Tobacco Survey. Sources: Global Adult Tobacco Survey 2008–2014.15 National Adult Tobacco Survey 2013–2014.4
In addition to daily tobacco smoking, another good indicator of addictiveness and tobacco dependence is
the average number of cigarettes smokers use daily (Table 2.6).
The GATS data suggest that, on average, daily smokers consume 10 or more cigarettes per day.
India reported the lowest average number of cigarettes smoked per day per smoker (6.2 cigarettes per
day), but the population of India is known to use ST heavily. The average number of cigarettes smoked
per day by women in India (7.0) was nominally higher than average use by Indian men (6.1). Although
the reported overall prevalence for women for many of the countries was low, mean cigarettes per day of
those who did smoke was quite high in some countries.15

Chapter 2: Patterns of Tobacco Use, Exposure, and Health Consequences
42
Table 2.6 Mean Number of Cigarettes Smoked Per Day Per Smoker, 2008–2014
Country Males Females Both sexes
Argentina 16.6 13.0 15.2
Bangladesh* 5.2 0.8 5.1
China 14.3 10.6 14.2
Egypt 19.3 — 19.4
Greece 21.3 16.8 19.8
India 6.1 7.0 6.2
Indonesia 13.0 8.1 12.8
Kazakhstan 15.2 11.8 14.9
Malaysia 14.0 — 13.9
Mexico 9.7 8.4 9.4
Nigeria 8.0 — 8.3
Pakistan 13.7 10.3 13.6
Panama 16.3 10.1 14.8
Philippines 11.3 7.0 10.6
Qatar* 17.6 10.9 17.2
Romania 17.7 14.1 16.6
Russian Federation* 18.4 12.6 16.9
Thailand 10.0 9.3 10.0
Turkey 20.3 15.3 19.2
Ukraine 18.2 11.8 16.9
United States 17.0 14.0 15.6
Viet Nam 13.6 10.9 13.5
*Data shown refer to average number of cigarettes smoked by current (daily or non-daily) cigarette smokers. For all other countries, the average number of cigarettes smoked by daily smokers is presented. Sources: Global Adult Tobacco Survey 2008–2014.15 National Adult Tobacco Survey 2013–2014.4
Current Cigarette Smoking Among Youth
Information on use of tobacco products by youth was drawn from the Global Youth Tobacco Surveys5
and the Health Behaviour in School-Aged Children surveys.6 Adjustments were made to account for the
fact that the GYTS captures information on youth ages 13–15 years, and the HBSC surveys youth ages
11, 13, and 15 years. In addition, the GYTS reports information on cigarette smoking and smokeless
tobacco use, and the HBSC captures information on smoked tobacco (including cigarettes). For data on
tobacco use by youth in the United States, the National Youth Tobacco Survey7 was used.

Monograph 21: The Economics of Tobacco and Tobacco Control
43
Using both GYTS and HBSC data for the period 2007–2014 applied to the 2010 population (Table 2.7
and Figure 2.7), an estimated 7.0% of youth ages 13–15 years worldwide smoked cigarettes. The
prevalence of cigarette smoking for boys (9.4%) was over 2 times that for girls (4.5%). Excluding youth
from the high-income OECD countries, youth from the Americas (13.0%) and European (9.8%) Regions
had the highest prevalence of cigarette smoking compared with youth from any other region.
Table 2.7 Prevalence of Cigarette Smoking Among Youth Ages 13–15 Years, by WHO Region and Country Income Group, 2007–2014
WHO Region
Estimated prevalence (%) Number of smokers (in thousands)
Boys Girls Both sexes Boys Girls Both sexes
Global 9.4 4.5 7.0 17,148 7,658 24,806
African 9.3 3.8 6.6 2,788 1,126 3,914
Americas 13.7 12.2 13.0 2,272 1,954 4,226
Eastern Mediterranean 6.7 1.8 4.3 1,255 317 1,572
European 11.3 8.2 9.8 964 675 1,639
South-East Asia 7.1 2.2 6.6 3,847 1,079 4,926
Western Pacific 10.5 2.2 6.6 3,846 713 4,559
High-income OECD 11.5 10.0 7.0 2,175 1,795 3,970
World Bank country income group
Estimated prevalence (%) Number of smokers (in thousands)
Boys Girls Both sexes Boys Girls Both sexes
Global 9.4 4.5 7.0 17,148 7,658 24,806
High-income 11.7 9.9 10.9 2,420 1,940 4,359
Upper middle-income 11.6 5.6 8.7 6,810 3,037 9,846
Lower middle-income 7.5 2.6 5.1 6,340 2,016 8,356
Low-income 8.0 3.4 5.7 1,579 666 2,245
Notes: WHO = World Health Organization. High-income OECD countries = countries defined as high-income by the Organisation for Economic Co-operation and Development. High-income OECD countries are excluded from their respective regions. The number of users was calculated by applying the prevalence rates to the estimates provided for the year 2010 by the United Nations. Country income group classification based on World Bank Analytical Classifications for 2014. Sources: Global Youth Tobacco Survey 2007–2014.5 Health Behaviour in School-Aged Children 2013–2014.6

Chapter 2: Patterns of Tobacco Use, Exposure, and Health Consequences
44
Figure 2.7 Prevalence of Current Cigarette Smoking Among Youth, by WHO Region, 2007–2014
Notes: WHO = World Health Organization. OECD = high-income countries as defined by the Organisation for Economic Co-operation and Development. High-income OECD countries are excluded from their respective regions. The number of users was calculated by applying the prevalence rates to the United Nations–provided population estimates for the year 2010. Sources: Global Youth Tobacco Survey 2007–2014.5 Health Behaviour in School-Aged Children 2013–2014.6
Youth from the Eastern Mediterranean Region had the lowest prevalence of cigarette smoking (4.3%).
However, use of other smoked products—especially waterpipe use—is common in this region. An
analysis of GYTS data since 2006 shows that when all smoked products are included, prevalence of
tobacco smoking in youth of the Eastern Mediterranean Region increases to 8.2%, around double that of
cigarette smoking alone. A similar analysis was also conducted for the South-East Asia Region, where
products such as bidis or kreteks are known to be popular; this analysis found an all-tobacco smoking
prevalence rate of 9.1%, which was almost double the 4.7% rate for cigarette smoking alone.5
As shown in Figure 2.8, the prevalence of current cigarette smoking among boys and girls in HICs was
not only relatively high, the difference between prevalence among boys and girls in HICs was much
smaller than in other country income groups, where boys had a much higher current smoking prevalence
than girls.
The analyses undertaken for this monograph raise further concern about the relative increase in tobacco
use by girls. Although the ratio of the 2013 prevalence rate for smoking by men in the Western Pacific
Region (49.4%) compared to the prevalence of smoking among women in that region (2.4%; Table 2.1)
was 20.6, the corresponding ratio between smoking prevalences for boys and girls in that region was
only about 5.0. Similarly, for the South-East Asia Region, the ratio of smoking prevalences for men and
women was 13.2, while the boys-to-girls ratio was only 4.6. And in the African Region, the men-to-
women smoking ratio was 10.7 compared with a boys-to-girls ratio of 2.6. These results indicate that in
the future, the burden of tobacco use in men and women will be more similar than it is today.

Monograph 21: The Economics of Tobacco and Tobacco Control
45
Figure 2.8 Prevalence of Current Cigarette Smoking Among Youth, by Country Income Group, 2007–2014
Notes: Country income group classification based on World Bank Analytical Classifications for 2014. The number of users was calculated by applying the prevalence rates to the United Nations–provided population estimates for the year 2010. Sources: Global Youth Tobacco Survey 2007–2014.5 Health Behaviour in School-Aged Children 2013–2014.6
Global Cigarette Consumption
Using data from Euromonitor International,12
WHO found that the world’s smokers consumed
more than 5.6 trillion cigarettes in 2013, compared with 5.2 trillion cigarettes in 2000 (Table 2.8,
Figure 2.9)—an increase of 437 billion sticks, or an 8.4% increase in total cigarette consumption since
2000 (though this rising trend may be leveling off). This change is equivalent to an absolute increase of
33.6 billion sticks per year. In 2013, total annual cigarette consumption was highest in the Western
Pacific Region (2.7 trillion), followed by the high-income OECD countries (1.1 trillion) and the
European Region (0.7 trillion) (Table 2.8). Together, countries in these three areas accounted for 80% of
global cigarette consumption.
The global increase in consumption was substantially higher during the period that preceded the
entry into force of the WHO Framework Convention on Tobacco Control (WHO FCTC) on
February 27, 2005. Between 2000 and 2005, the increase was 49.4 billion sticks per year, compared
with an increase of only 23.8 billion per year between 2005 and 2013. In the high-income OECD
countries in the years 2000–2005, average cigarette consumption declined by 37.2 billion sticks per
year (from 1,669 billion sticks in 2000 to 1,483 billion sticks in 2005). In contrast, these countries
experienced an average reduction of 47.0 billion sticks per year in the years 2005 through 2013. In the
Region of the Americas (excluding Canada and the United States, which are high-income OECD
countries) the volume of cigarettes consumed in 2000 was 242 billion sticks, which increased rapidly to
270 billion sticks in 2001, after which the volume remained relatively stable through 2005. Since 2005
the volume of cigarettes consumed in the Americas has declined steadily, reaching 210 billion sticks in

Chapter 2: Patterns of Tobacco Use, Exposure, and Health Consequences
46
2013. In the European Region (again, excluding high-income OECD countries), annual consumption
increased rapidly from 690 billion sticks in 2000 to a high of 856 billion sticks in 2008 and has
consistently declined since then, reaching 706 billion sticks in 2013 (Table 2.8).12
Table 2.8 Global Consumption of Cigarette Sticks (in Billions), by WHO Region and Country Income Group, 2000–2013
WHO Region 2000 2001 2002 2003 2004 2005 2006 2007 2008 2009 2010 2011 2012 2013
Global 5,204 5,284 5,299 5,340 5,389 5,451 5,543 5,645 5,725 5,738 5,721 5,742 5,743 5,641
African 123 122 123 123 121 122 121 121 122 123 124 125 126 126
Americas 242 270 265 267 266 268 267 264 252 244 241 232 221 210
Eastern Mediterranean
293 304 315 316 329 335 354 356 367 377 352 357 342 326
European 690 727 749 756 770 803 822 828 856 834 792 770 758 706
South-East Asia 354 336 326 334 351 365 375 386 396 408 418 438 454 471
Western Pacific 1,834 1,873 1,893 1,939 2,003 2,076 2,142 2,263 2,346 2,432 2,531 2,619 2,681 2,695
High-income OECD
1,669 1,652 1,627 1,607 1,549 1,483 1,461 1,425 1,386 1,320 1,262 1,200 1,162 1,107
World Bank country income group 2000 2001 2002 2003 2004 2005 2006 2007 2008 2009 2010 2011 2012 2013
Global 5,204 5,284 5,299 5,340 5,389 5,451 5,543 5,645 5,725 5,738 5,721 5,742 5,743 5,641
High-income 2,040 2,034 2,016 1,997 1,948 1,906 1,896 1,854 1,837 1,766 1,700 1,633 1,592 1,514
Upper middle-income
2,381 2,454 2,472 2,515 2,588 2,653 2,727 2,833 2,918 2,991 3,041 3,134 3,178 3,165
Lower middle-income
670 688 699 716 741 777 802 836 841 847 843 837 830 820
Low-income 113 108 111 113 113 115 118 123 129 134 137 139 143 143
Notes: WHO = World Health Organization. High-income OECD countries = countries defined as high-income by the Organisation for Economic Co-operation and Development. High-income OECD countries are excluded from their respective regions. Country income group classification based on World Bank Analytical Classifications for 2013. Source: Euromonitor International 2016.12
Monograph 21: The Economics of Tobacco and Tobacco Control
47
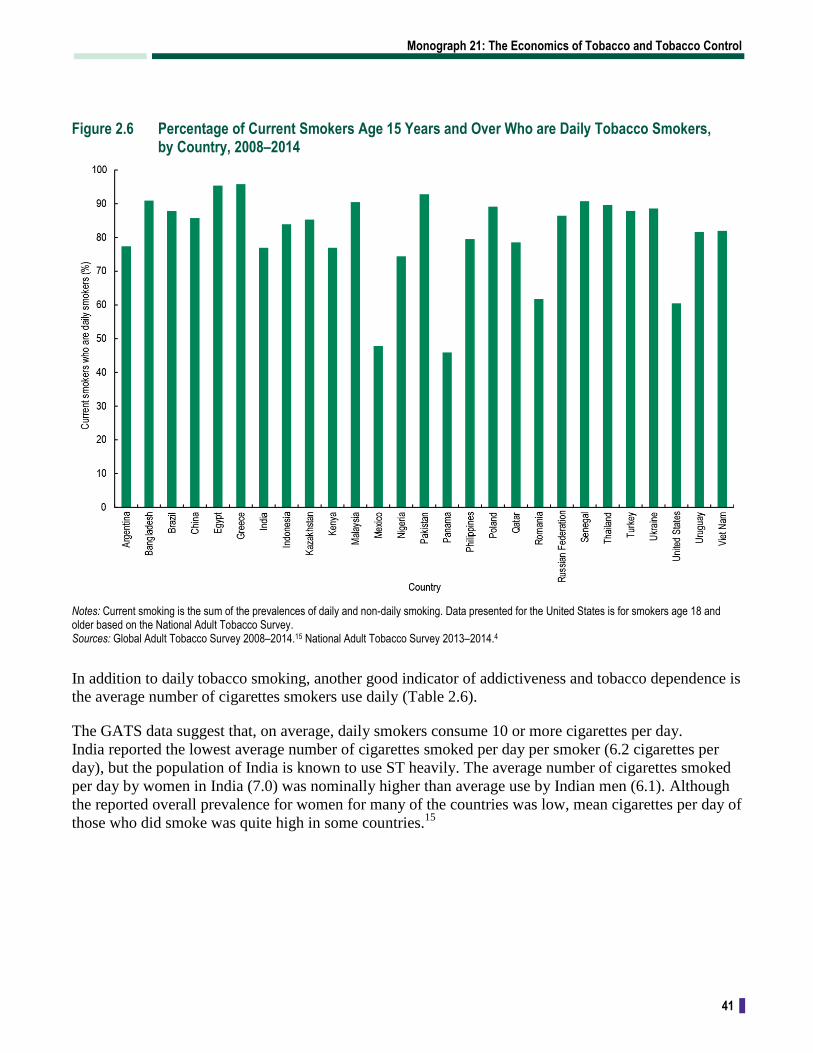
Figure 2.9 Global Consumption of Cigarette Sticks (in Billions), by WHO Region, 2000–2013
Notes: WHO = World Health Organization. High-income OECD countries = countries defined as high-income by the Organisation for Economic Co-operation and Development. High-income OECD countries are excluded from their respective regions. Source: Euromonitor International 2016.12
The African Region has experienced a subtle but visible increase in the recent past. During the period
2000–2009, between 121 and 123 billion sticks were consumed each year. Since 2008, consumption has
increased steadily, reaching 126 billion sticks in 2013. The Eastern Mediterranean Region has also
experienced an interesting change. Between 2000 and 2009, consumption in the Eastern Mediterranean
Region increased steadily from 293 billion sticks to 377 billion sticks, after which consumption declined
to 326 billion sticks in 2013. However, the Eastern Mediterranean Region has been subject to substantial
political turmoil and conflict in the past few years, and the resulting breakdown in law and order in
several Member States appears to have resulted in substantial importation of illicit cigarettes.17
In
addition, use of waterpipes has increased substantially in this region, and large numbers of cigarette
smokers may have switched to waterpipes in the recent past.
The remaining two regions, by far the most populous regions of the world, have experienced substantial
increases in consumption—a 33.1% increase in South-East Asia, from 354 billion sticks consumed in
2000 to 471 billion sticks in 2013, and a 47.0% increase in the Western Pacific (excluding high-income
OECD countries such as Australia, Japan, Republic of Korea, and others), from 1,834 billion sticks
consumed in 2000 to 2,695 billion sticks in 2013.12

Chapter 2: Patterns of Tobacco Use, Exposure, and Health Consequences
48
The trends in cigarette consumption by WHO Region are consistent with trends in consumption by
World Bank country income group (Figure 2.10). Annual cigarette consumption decreased by 25.5% in
HICs, from 2,040 billion sticks consumed in 2000 to 1,514 billion sticks in 2013. In contrast,
consumption increased in all other country income groups. Consumption in low-income countries
increased by 26.3% from 2000 to 2013; most of this increase occurred between 2005 and 2013. From
2000 through 2005, consumption remained relatively unchanged at around 113 billion sticks. In lower
middle-income countries consumption increased rapidly between 2000 and 2009 from 670 billion sticks
to 847 billion sticks. After 2009, consumption declined, reaching 820 billion sticks in 2013. Upper
middle-income countries, which account for 56.1% of global consumption, experienced an 11.4%
increase between 2000 and 2005 compared with a 19.3% increase in the period 2005–2013.12
Figure 2.10 Global Consumption of Cigarette Sticks (in Billions), by Country Income Group, 2000–2013
Note: Country income group classification based on World Bank Analytical Classifications for 2013. Source: Euromonitor International 2016.12
Global Cigarette Consumption Per Capita
As shown in Table 2.9 and Figure 2.11, annual per capita cigarette consumption among people
age 15 and older around the world has declined steadily since 2000. The major driver of that reduction
has been the decline in per capita consumption in high-income OECD countries, from 2,246 cigarettes
per person in 2000 to 1,459 cigarettes per person in 2013. Per capita consumption also declined in the
Region of the Americas (excluding Canada and the United States, which are high-income OECD
countries), from 894 in 2000 to 587 in 2013. In the African Region, despite a small increase in overall

Monograph 21: The Economics of Tobacco and Tobacco Control
49
consumption in the region, per capita consumption fell from 379 cigarettes per person in 2000 to 255 per
person in 2013. On the other hand, two regions experienced large increases: In the European Region,
excluding high-income OECD countries, per capita consumption increased from 1,984 cigarettes per
person in 2000 to 2,322 cigarettes per person in 2013; and in the Western Pacific Region, from 1,661
cigarettes per person in 2000 to 1,965 cigarettes per person in 2013.12
Table 2.9 Per Capita Consumption of Cigarette Sticks Among People Age 15 Years and Older, by WHO Region and Country Income Group, 2000–2013
WHO Region 2000 2001 2002 2003 2004 2005 2006 2007 2008 2009 2010 2011 2012 2013
Global 1,226 1,222 1,203 1,190 1,179 1,171 1,171 1,174 1,172 1,157 1,137 1,125 1,110 1,077
African 379 362 348 333 323 317 306 294 287 279 272 265 260 255
Americas 894 864 816 706 774 745 736 718 710 696 677 634 603 587
Eastern Mediterranean
889 881 887 1,028 1,033 1,036 1,007 1,016 1,004 1,029 1,005 1,008 1,008 918
European 1,984 2,018 2,030 2,147 2,245 2,295 2,299 2,326 2,409 2,453 2,458 2,529 2,454 2,322
South-East Asia 361 339 336 340 316 301 301 311 317 320 324 326 329 332
Western Pacific 1,661 1,653 1,671 1,681 1,685 1,669 1,673 1,695 1,724 1,751 1,823 1,864 1,909 1,965
High-income OECD
2,246 2,213 2,127 2,094 2,055 2,007 1,965 1,879 1,782 1,742 1,686 1,625 1,537 1,459
World Bank country income group 2000 2001 2002 2003 2004 2005 2006 2007 2008 2009 2010 2011 2012 2013
Global 1,226 1,222 1,203 1,190 1,179 1,171 1,171 1,174 1,172 1,157 1,137 1,125 1,110 1,077
High-income 2,142 2,117 2,080 2,041 1,973 1,913 1,886 1,828 1,795 1,712 1,636 1,562 1,514 1,433
Upper middle-income
1,509 1,526 1,507 1,502 1,516 1,526 1,544 1,580 1,606 1,625 1,633 1,665 1,672 1,650
Lower middle-income
498 501 497 499 505 518 524 535 528 522 509 496 483 469
Low-income 305 286 285 283 274 272 273 279 285 288 287 284 284 276
Notes: WHO = World Health Organization. High-income OECD countries = countries defined as high-income by the Organisation for Economic Co-operation and Development. High-income OECD countries are excluded from their respective regions. Country income group classification based on World Bank Analytical Classifications for 2013. Source: Based on data from Euromonitor International 2016.12 For more information, see the Statistical Annex.

Chapter 2: Patterns of Tobacco Use, Exposure, and Health Consequences
50
Figure 2.11 Global Per Capita Cigarette Consumption Among People Age 15 Years and Older, by WHO Region, 2000–2013
Notes: WHO = World Health Organization. High-income OECD countries = countries defined as high-income by the Organisation for Economic Co-operation and Development. High-income OECD countries are excluded from their respective regions. Source: Based on data from Euromonitor International 2016.12 For more information, see the Statistical Annex.
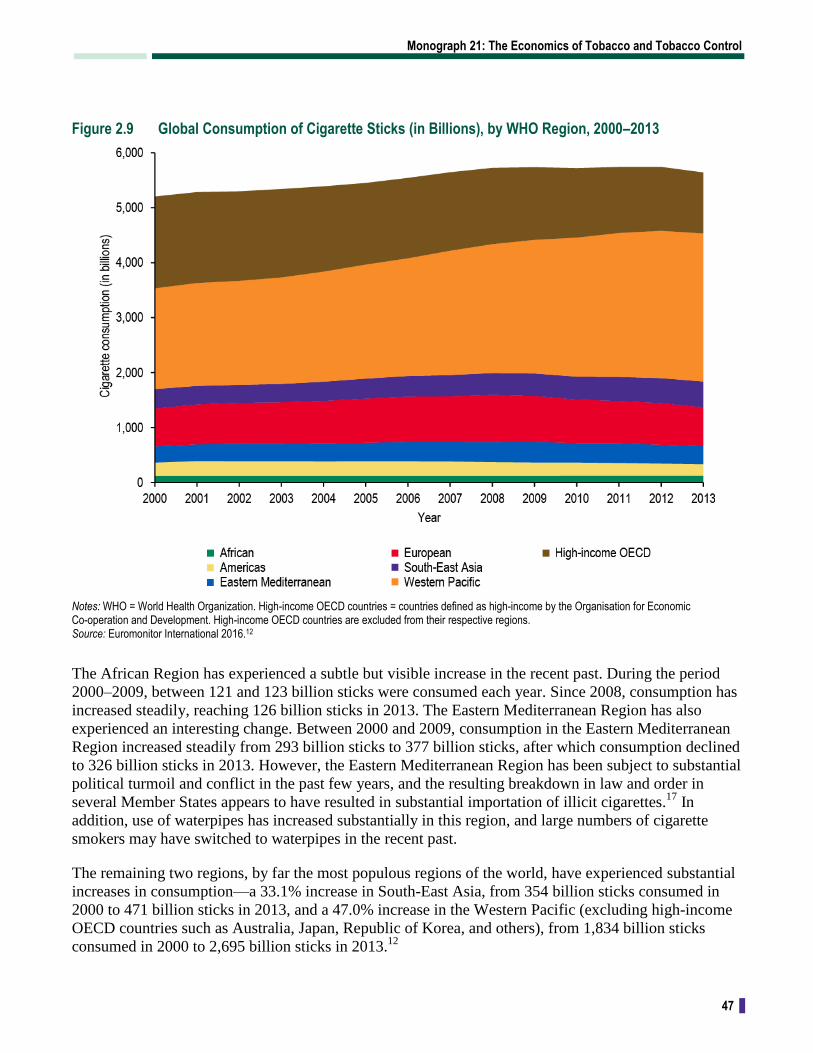
As shown in Table 2.9 and Figure 2.12, data for World Bank country income groups show a similar
picture. HICs experienced a substantial reduction, from 2,142 cigarettes per person in 2000 to 1,433 in
2013. Per capita consumption in lower middle-income countries remained essentially unchanged
between the year 2000 and the years 2010–2013, despite an increase in the mid-2000s. Upper middle-
income countries, however, generally experienced increases between 2000 (1,509 cigarettes per person),
2012 (1,672), and 2013 (1,650).12
Monograph 21: The Economics of Tobacco and Tobacco Control
51
Figure 2.12 Per Capita Cigarette Consumption Among People Age 15 Years and Older, Globally and by Country Income Group, 2000–2013
Note: Country income group classification based on World Bank Analytical Classifications for 2013. Source: Based on data from Euromonitor International 2016.12 For more information, see the Statistical Annex.
Smokeless Tobacco Products
Prevalence of Smokeless Tobacco Use Among Adults
WHO estimates that there are at least 346 million adult ST users worldwide. As shown in Table 2.10,
the South-East Asia Region has by far the largest number of adult ST users, with 296.9 million users
(86% of the total number of ST users worldwide). India has the largest number of ST users of any
country (152.4 million men and 80.8 million women users),18
followed by Bangladesh (16.5 million men
and 18.7 million women users).19
(Note that, as described in the Statistical Annex, many countries lack
adequate surveillance data for ST. Additionally, the NCI–CDC report Smokeless Tobacco and Public
Health: A Global Perspective8 also concluded that in many regions, including some where ST use is
highly prevalent, surveillance of ST use is inadequate.)

Chapter 2: Patterns of Tobacco Use, Exposure, and Health Consequences
52
There is concern that the introduction of new ST products and their marketing to new users may lead to
increased tobacco use in countries or populations where it had previously been low. In some HICs,
cigarette manufacturers have introduced ST products with attractive flavorings, such as mint or fruit
flavors, and new nicotine delivery methods, such as lozenges or small pouches that allow for more
concealed use. For example, sales of moist snuff products (including snus) in the United States increased
65.6% between 2005 and 2011.20
Table 2.10 Prevalence of Adult Current Smokeless Tobacco Use, by WHO Region and Country Income Group, 2010
WHO Region
Estimated prevalence (%) Number of ST users (in millions)
Men Women Both sexes Men Women Both sexes
Global 8.4 4.6 6.5 223.3 122.7 346.0
African 2.8 2.1 2.4 7.6 5.9 13.4
Americas 0.6 0.2 0.4 1.3 0.5 1.8
Eastern Mediterranean 4.1 1.4 2.9 9.0 2.8 11.8
European 2.1 0.1 1.0 3.4 0.2 3.6
South-East Asia 27.4 16.5 22.0 187.3 109.6 296.9
Western Pacific 1.0 0.4 0.7 6.5 2.8 9.2
High-income OECD 1.9 0.2 1.2 8.2 1.0 9.2
World Bank country income group
Estimated prevalence (%) Number of ST users (in millions)
Men Women Both sexes Men Women Both sexes
Global 8.4 4.6 6.5 223.3 122.7 346.0
High-income 1.7 0.2 1.1 8.9 1.2 10.1
Upper middle-income 1.0 0.5 0.7 9.4 4.5 13.8
Lower middle-income 19.0 10.2 14.6 171.7 90.7 262.3
Low-income 12.7 9.8 11.2 33.3 26.4 59.7
Notes: WHO = World Health Organization. ST = smokeless tobacco. High-income OECD countries = countries defined as high-income by the Organisation for Economic Co-operation and Development. High-income OECD countries are excluded from their respective regions. Country income group classification based on World Bank Analytical Classifications for 2014. Source: Based on data from World Health Organization 2015.1 For more information, see the Statistical Annex.
Prevalence of Smokeless Tobacco Use Among Youth
Using data from the Global Youth Tobacco Surveys, WHO has estimated that at least 12.8 million
youth ages 13–15 globally used ST in 2010, a prevalence of 3.6% (Table 2.11). This compares with a
prevalence rate of 7.0% for youth cigarette smoking (24.8 million youth). The number of boys using
ST was 8.6 million compared with 4.2 million girls, for a ratio of 2 boy users for every girl user. These
prevalence rates and absolute numbers of users were derived by applying prevalence data for surveys
carried out between 2007 and 2014 to the 2010 regional and global 13- to 15-year-old populations
(as estimated by the UN Population Division).5

Monograph 21: The Economics of Tobacco and Tobacco Control
53
Table 2.11 Prevalence of Smokeless Tobacco Use Among Youth Ages 13–15 Years, by WHO Region and Country Income Group, 2007–2014
WHO Region
Estimated prevalence (%) Number of ST users (in thousands)
Boys Girls Both sexes Boys Girls Both sexes
Global 4.7 2.5 3.6 8,588 4,242 12,831
African 2.2 1.5 1.8 652 432 1,084
Americas 2.4 1.6 2.0 390 255 645
Eastern Mediterranean 4.7 3.2 3.9 874 568 1,442
European 1.3 1.1 1.2 114 91 205
South-East Asia 9.7 4.9 7.4 5,222 2,458 7,680
Western Pacific 1.8 0.9 1.4 659 309 968
High-income OECD 3.6 0.7 2.2 677 130 807
World Bank country income group
Estimated prevalence (%) Number of ST users (in thousands)
Boys Girls Both sexes Boys Girls Both sexes
Global 4.7 2.5 3.6 8,588 4,242 12,831
High-income 3.6 0.8 2.2 742 161 903
Upper middle-income 2.0 1.2 1.6 1,165 647 1,812
Lower middle-income 7.2 3.8 5.6 6,070 3,004 9,074
Low-income 3.1 2.2 2.6 612 430 1,043
Notes: WHO = World Health Organization. ST = smokeless tobacco. High-income OECD countries = countries defined as high-income by the Organisation for Economic Co-operation and Development. High-income OECD countries are excluded from their respective regions. Country income group classification based on World Bank Analytical Classifications for 2010. The number of users was calculated by applying the prevalence rates to the United Nations–provided population estimates for the year 2010. Source: Based on data from Global Youth Tobacco Survey 2007–2014.5 For more information, see the Statistical Annex.
Youth in the South-East Asia Region had the highest prevalence of ST use in 2010 (7.4%), as well as the
highest ST prevalence among both boys (9.7%) and girls (4.9%) (Table 2.11 and Figure 2.13). Youth ST
users in the South-East Asia Region accounted for 60% of all ST users ages 13–15 years in the world.5

Chapter 2: Patterns of Tobacco Use, Exposure, and Health Consequences
54
Figure 2.13 Prevalence of Smokeless Tobacco Use Among Youth Ages 13–15 Years, by WHO Region, 2007–2014
Notes: WHO = World Health Organization. High-income OECD countries = countries defined as high-income by the Organisation for Economic Co-operation and Development. High-income OECD countries are excluded from their respective regions. The number of users was calculated by applying the prevalence rates to the United Nations–provided population estimates for 2010. Source: Based on data from Global Youth Tobacco Survey 2007–2014.5 For more information, see the Statistical Annex.
The prevalence of ST use is greater in low-income and lower middle-income countries than in high-
income and upper middle-income countries, particularly among youth (Table 2.11 and Figure 2.14). In
contrast, the prevalence of cigarette smoking is greater in high-income and upper middle-income
countries than in lower middle-income and low-income countries (Table 2.1 and Figure 2.1).

Monograph 21: The Economics of Tobacco and Tobacco Control
55
Figure 2.14 Prevalence of Smokeless Tobacco Use Among Youth Ages 13–15 Years, by Country Income Group, 2007–2014
Notes: Country income group classification based on World Bank Analytical Classifications for 2014. The number of users was calculated by applying the prevalence rates to the United Nations–provided population estimates for 2010. Source: Based on data from Global Youth Tobacco Survey 2007–2014.5 For more information. see the Statistical Annex.
Other Tobacco Products
As new products and marketing strategies emerge and globalization, population migration, and tobacco
control policies alter the environment, studying patterns of tobacco consumption becomes more
challenging. Some tobacco control experts warn that the increased marketing of other tobacco products,
such as snus or modified cigarettes, could have an adverse health impact by appealing to young people
or new users, or by assisting smokers to maintain their nicotine dependence.21–23
In the past decade, ENDS, often marketed as an alternative to conventional cigarettes, have been
increasingly promoted and used worldwide. Prevalence of having ever used ENDS was 12.6%
among U.S. adults in 2014,24
and ENDS use rose from 7% to 12% among European Union residents
age 15 years and over between 2012 and 2014.25
ENDS pose new research and regulatory challenges, as the safety of these products and their efficacy for
smoking cessation remain unclear.26–28
Some countries have banned the sale and marketing of these
products (e.g., Panama,29,30
Singapore,31
Thailand,32
and Uruguay33
). The European Union enacted a
revised Tobacco Products Directive that includes regulation of ENDS products, and several U.S. states
and localities have enacted smoke-free policies and/or laws restricting minors’ access to these
products.28,34,35
In November 2015, the United Kingdom’s Medicines and Healthcare Products
Regulatory Agency licensed a British American Tobacco ENDS called ‘e-Voke’ for medical use as a
smoking cessation device.36

Chapter 2: Patterns of Tobacco Use, Exposure, and Health Consequences
56
Globalization and population migration are also contributing to a changing tobacco landscape, leading
to the emergence of non-traditional products within regions and among populations where their use had
previously not been a concern. Examples include use of ST and waterpipes. South Asian emigrants
have brought to their new countries products that are commonly used in their countries of origin
(e.g., smokeless tobacco). ST products are also marketed to the large Asian immigrant labor force in
the Eastern Mediterranean Region.8 Changing social norms and the denormalization of cigarette
smoking might contribute to the increased attractiveness of smokeless products in places where smoking
is declining. Traditionally used among men in the Middle East and North Africa, waterpipe smoking is
increasing in many countries where it was previously unknown.37–40
The introduction of products to new
markets may influence patterns of tobacco use in those countries and, in turn, impact public health.
Exposure to Secondhand Smoke
Secondhand smoke (sometimes referred to as passive smoking, environmental tobacco smoke, or
tobacco smoke pollution) is a mixture of sidestream smoke from the burning tip of cigarettes or other
smoked tobacco products, and mainstream smoke exhaled by the smoker. At least 50 carcinogenic
chemicals have been identified in SHS,41
and scientific evidence indicates that there is no safe level of
exposure to SHS.42
People in low-income countries and of lower educational attainment are less likely to
be aware of the risks of SHS exposure or to take precautions to protect children and other nonsmokers in
the family.41,43
Cross-sectional data collected in 2006 from households in 31 countries (12 countries in Asia, 9 in the
Americas, 3 in the Middle East, and 7 in Europe [not including Western Europe and the United States])
showed that air nicotine concentrations were 17 times higher in households with a smoker than in those
without a smoker, and 12.9 times higher in households that permitted smoking indoors than in those that
prohibited it.44
This study also showed that hair nicotine concentrations collected from women and
children in 1,200 of these households increased with the number of smokers in the household.44
As described further in chapter 6, comprehensive smoke-free policies—those that, by law, completely
prevent smoking in all enclosed indoor workplaces, public places, and transportation—are now in place
in many countries. Article 8 of the WHO FCTC obligates Parties to the treaty to adopt and implement
effective measures to protect people from exposure to SHS in indoor workplaces, public transport,
indoor public places, and, as appropriate, other public places. However, exposure to SHS in the
workplace, in public places, and in the home remains common.
Data on exposure to SHS in the 26 countries that have completed a Global Adult Tobacco Survey as
well as in the United States (Table 2.12) show a very broad range of SHS exposure levels at work (from
5.6% to 69.1%) and at home (from 4.4% to 78.4%). In all 27 countries, men were more likely than
women to be exposed to SHS at work. Exposure at home was often similar between men and women; in
general, women’s greatest exposure occurred at home rather than at work.

Monograph 21: The Economics of Tobacco and Tobacco Control
57
Table 2.12 Adult Exposure to Secondhand Smoke at Work and at Home in Selected Countries, 2008–2014
Country
At work At home
Male (%)
Female (%)
Both sexes (%)
Male–female ratio
Male (%)
Female (%)
Both sexes (%)
Male–female ratio
Argentina 38.5 24.1 31.6 1.6 34.1 31.9 33.0 1.1
Bangladesh 67.8 30.4 63.0 2.2 — — — —
Brazil 28.5 20.4 24.4 1.4 28.9 27.0 27.9 1.1
China 71.1 53.2 63.3 1.3 70.5 63.9 67.3 1.1
Egypt 62.4 54.0 60.7 1.2 68.1 73.6 70.8 0.9
Greece 58.8 41.8 52.3 1.4 68.9 62.5 65.7 1.1
India 32.2 19.4 29.9 1.7 52.2 52.5 52.3 1.0
Indonesia 58.0 41.4 51.3 1.4 81.4 75.4 78.4 1.1
Kazakhstan 24.7 12.9 19.0 1.9 16.7 11.4 13.8 1.5
Kenya 23.0 11.5 17.6 2.0 16.8 12.0 14.3 1.4
Malaysia 46.2 30.1 39.8 1.5 43.3 33.3 38.4 1.3
Mexico 23.3 13.9 19.7 1.7 17.4 18.2 17.8 1.0
Nigeria 21.1 12.0 17.3 1.8 7.7 5.6 6.6 1.4
Pakistan 72.5 37.3 69.1 1.9 50.8 45.7 48.3 1.1
Panama 7.4 3.7 5.6 2.0 5.3 3.5 4.4 1.5
Philippines 43.3 28.8 36.9 1.5 50.9 46.7 48.8 1.1
Poland 41.3 24.9 33.6 1.7 44.9 43.6 44.2 1.0
Qatar 13.7 7.8 12.0 1.8 16.7 17.0 16.8 1.0
Romania 36.8 31.2 34.2 1.2 37.7 33.2 35.4 1.1
Russian Federation
45.7 25.7 34.9 1.8 36.7 33.0 34.7 1.1
Senegal 33.0 25.1 30.4 1.3 24.5 19.0 21.6 1.3
Thailand 39.9 32.3 36.0 1.2 37.1 22.8 30.5 1.6
Turkey 17.8 9.6 15.6 1.9 39.2 37.4 38.3 1.0
Ukraine 44.0 22.9 34.0 1.9 33.6 28.1 30.6 1.2
United States* 27.6 20.1 24.0 1.4 4.7 4.1 4.4 1.1
Uruguay 21.4 11.8 16.5 1.8 32.0 26.7 29.2 1.2
Viet Nam 68.7 41.4 55.9 1.7 77.2 69.2 73.1 1.1
*Data presented for the United States is based on the National Adult Tobacco Survey. Sources: Global Adult Tobacco Survey 2008–2014.15 National Adult Tobacco Survey 2013–2014.4

Chapter 2: Patterns of Tobacco Use, Exposure, and Health Consequences
58
According to a similar analysis using data from the Global Youth Tobacco Surveys (Tables 2.13 and
2.14), a substantial proportion of youth ages 13 to 15 years reported being exposed to SHS, both inside
and outside the home. As many as 116 million youth in this age group reported SHS exposure at home,
and 173 million reported exposure outside the home. The actual number of youth exposed is likely to
be substantially higher, as most of these 13- to 15-year-olds would have siblings who also would have
been exposed.
Table 2.13 Percentage of Youth Ages 13–15 Years Exposed to Secondhand Smoke Inside the Home, by WHO Region and Country Income Group, 2007–2014
WHO Region
Estimated prevalence (%) No. exposed to SHS (in thousands)
Boys Girls Both sexes Boys Girls Both sexes
Global 33.9 31.3 32.6 62,068 53,817 115,885
African 28.8 27.3 28.1 8,606 8,005 16,611
Americas 28.3 27.1 27.7 4,676 4,331 9,007
Eastern Mediterranean 28.5 26.1 27.3 5,336 4,652 9,989
European 51.9 56.2 54.0 4,451 4,612 9,063
South-East Asia 31.0 25.4 28.3 16,728 12,664 29,392
Western Pacific 46.8 43.6 45.3 17,128 14,266 31,394
High-income OECD 27.1 29.4 28.2 62,068 53,817 115,885
World Bank country income group
Estimated prevalence (%) No. exposed to SHS (in thousands)
Boys Girls Both sexes Boys Girls Both sexes
Global 33.9 31.3 32.6 62,068 53,817 115,885
High-income 36.5 39.0 37.7 5,712 5,836 11,548
Upper middle-income 41.0 38.2 39.6 24,214 21,085 45,298
Lower middle-income 30.8 26.7 28.8 26,194 21,525 47,719
Low-income 32.1 27.7 29.9 5,949 5,372 11,320
Notes: WHO = World Health Organization. SHS = secondhand smoke. High-income OECD countries = countries defined as high-income by the Organisation for Economic Co-operation and Development. High-income OECD countries are excluded from their respective regions. The number of youth exposed was calculated by applying the prevalence rates to the United Nations–provided population estimates for 2010. Country income group classification based on World Bank Analytical Classifications for 2014. Source: Based on data from Global Youth Tobacco Survey 2004–2014.5 For more information, see the Statistical Annex.

Monograph 21: The Economics of Tobacco and Tobacco Control
59
Table 2.14 Percentage of Youth Ages 13–15 Years Exposed to Secondhand Smoke Outside the Home, by WHO Region and Country Income Group, 2007–2014
WHO Region
Estimated prevalence (%) No. exposed to SHS (in thousands)
Boys Girls Both sexes Boys Girls Both sexes
Global 50.0 47.7 48.9 91,650 82,010 173,660
African 52.6 49.6 51.1 15,691 14,530 30,221
Americas 45.8 40.8 43.3 7,564 6,514 14,078
Eastern Mediterranean 43.5 37.0 40.3 8,149 6,609 14,758
European 75.4 75.1 75.3 6,462 6,161 12,623
South-East Asia 40.1 34.4 37.4 21,649 17,167 38,815
Western Pacific 62.8 62.2 62.5 23,017 20,354 43,371
High-income OECD 48.0 59.3 53.5 9,117 10,676 19,793
World Bank country income group
Estimated prevalence (%) No. exposed to SHS (in thousands)
Boys Girls Both sexes Boys Girls Both sexes
Global 50.0 47.7 48.9 91,650 82,010 173,660
High-income 56.8 63.7 60.1 9,963 11,374 21,337
Upper middle-income 51.2 47.6 49.4 34,277 30,370 64,647
Lower middle-income 42.9 38.2 40.6 37,091 30,922 68,013
Low-income 57.3 51.3 54.3 10,319 9,343 19,662
Notes: WHO = World Health Organization. SHS = secondhand smoke. High-income OECD countries = countries defined as high-income by the Organisation for Economic Co-operation and Development. High-income OECD countries are excluded from their respective regions. The number of youth exposed was calculated by applying the prevalence rates to the United Nations–provided population estimates for 2010. Country income group classification based on World Bank Analytical Classifications for 2014. Source: Based on data from Global Youth Tobacco Survey 2004–2014.5 For more information, see the Statistical Annex.
Tobacco-Related Health Disparities
WHO has called attention to the “vicious cycle of tobacco and poverty” and recognizes that the death,
disease, loss of income, and loss of productivity due to tobacco all contribute to poverty, along with the
diversion of household funds from necessary resources, such as food, shelter, and education, to tobacco
purchases.45,46
(See chapter 16 for additional information.)
National surveillance data from the United States, Australia, and other HICs have documented an
increasingly disproportionate burden of tobacco use and exposure to SHS, and as a consequence, a
higher level of tobacco-related ill health and death among lower socioeconomic groups within these
countries. In the United States, although tobacco smoking prevalence has declined across all income
categories, smoking has declined less among people living below the poverty line. Socioeconomic
position has been typically defined by family/household income or poverty status, educational
attainment, and occupational category (e.g., working class or blue-collar occupations versus professional
or white-collar occupations).47–53
Tobacco-related health disparities (TRHDs) have also been
documented across other factors, such as gender, ethnicity, neighborhood poverty level, and
geographical region.48,49,54,55

Chapter 2: Patterns of Tobacco Use, Exposure, and Health Consequences
60
Similarly, the Australian Institute of Health and Welfare56
has reported that people of the lowest
socioeconomic status (SES), whether measured by income or by completed level of education, were
almost three times more likely to smoke daily compared with people of the highest SES (19.9% versus
6.7%, respectively). Similar trends are seen in European countries, where overall tobacco smoking
prevalence is gradually yet steadily declining while becoming more concentrated among lower SES
populations than among their more prosperous counterparts.57,58
Until relatively recently, most of the evidence on TRHDs across the globe has come from studies
conducted in HICs. Evidence of a disproportionate burden of tobacco use among the poor and other
less-resourced populations has become increasingly available.50,59
WHO World Health Survey data for
48 LMICs in all WHO Regions were analyzed to examine socioeconomic inequality in smoking among
men and women age 18 years and older.60
These data showed that smoking was more prevalent among
poor men in most countries, and that the poorest men were more than 2.5 times more likely to smoke
than the richest men in many countries. Socioeconomic inequality in women was more varied, showing
higher prevalences of tobacco smoking among the rich in some countries and among the poor in other
countries. In 20 countries, the poorest women had a statistically significant higher prevalence of
smoking compared with the richest women. In contrast, in 9 mostly middle-income Eastern European
countries, the richest women were more likely to smoke than the poorest women.
Health Consequences of Tobacco Use
Tobacco Use, Secondhand Smoke Exposure, and Disease
Decades of research have conclusively established that tobacco use, and in particular cigarette smoking,
causes numerous serious illnesses, including cancer, cardiovascular disease and stroke, and pulmonary
disease. As shown in Figure 2.15, major diseases causally linked to cigarette smoking include diseases
of the circulatory system (e.g., ischemic heart and cerebrovascular diseases); cancers of the trachea,
bronchus and lung, esophagus, oropharynx, larynx, stomach, liver, pancreas, kidney and ureter, cervix,
bladder, colon/rectum, as well as acute myeloid leukemia; chronic respiratory diseases (e.g., asthma,
chronic obstructive pulmonary disease); and metabolic diseases such as diabetes mellitus.61
The U.S.
Surgeon General has stated that “cigarette smoking has been causally linked to diseases of nearly all
organs of the body, to diminished health status, and to harm to the fetus. Even 50 years after the first
Surgeon General’s report, research continues to newly identify diseases caused by smoking.”61,p.7
Such
common diseases as diabetes mellitus, rheumatoid arthritis, and colorectal cancer were causally linked
to smoking by this more recent research.

Monograph 21: The Economics of Tobacco and Tobacco Control
61
Figure 2.15 Health Consequences Causally Linked to Smoking
Source: Centers for Disease Control and Prevention 2014.61
The health hazards of exposure to SHS are also now well established. These include cancer, respiratory
and cardiovascular diseases in adults, as well as disease and death in infants and children (Figure 2.16).
The International Agency for Research on Cancer (IARC) has concluded that SHS is carcinogenic to
humans (Group 1).62
Both tobacco use and SHS exposure during pregnancy have been conclusively linked to harm to the
developing fetus. Active cigarette smoking by the mother increases the risk for ectopic pregnancy,
premature rupture of membranes, abruptio placentae, placenta previa, miscarriage, stillbirth, preterm
birth, low birth weight, small for gestational age, some congenital anomalies, and sudden infant death
syndrome (SIDS). Women who are exposed to SHS while pregnant are also at increased risk for having
babies with low birth weight.63,64

Chapter 2: Patterns of Tobacco Use, Exposure, and Health Consequences
62
Figure 2.16 Health Consequences Causally Linked to Secondhand Smoke Exposure
Source: Centers for Disease Control and Prevention 2014.61
Stages of the Tobacco Epidemic and Global Implications
To understand the evolution of the tobacco epidemic in all countries, regardless of income level, and the
potential impact of tobacco use on morbidity and mortality over time, Lopez and colleagues65
proposed
a descriptive model of smoking prevalence and mortality in 1994. This model was based on a careful
analysis of changes in tobacco use over time and of mortality attributable to tobacco in the United States
and selected HICs. When Lopez and colleagues first proposed this model, many LMICs had been
exposed to tobacco use for only a short time compared with HICs. Many LMICs have now been
subjected to tobacco industry marketing and distribution processes for at least 30 years—long enough
for the health consequences of tobacco use to become apparent (Figure 2.17). Countries with the longest
history of tobacco use and relatively strong tobacco control measures are generally thought to be in
Stage IV of the model; countries with shorter histories of exposure to tobacco are expected to transition
from Stage I to Stage IV. The model indicates that countries in the early stages of the epidemic could
take several decades to see a decrease in tobacco-related mortality. Implementation of strong tobacco
control measures can hasten progression through the stages, possibly leading to lower prevalence and
improved health outcomes sooner. Indeed, strong tobacco control measures may help ensure that
countries in the early stages of the epidemic never progress to the later stages at all.

Monograph 21: The Economics of Tobacco and Tobacco Control
63
Figure 2.17 Four-Stage Model of the Cigarette Epidemic
Source: Lopez et al. 1994.65 Reproduced from “A descriptive model of the cigarette epidemic in developed countries,” Lopez A, Collishaw N, Piha T, volume 3(3), p. 246, with permission from BMJ Publishing Group Ltd.
In 2012, Thun and colleagues66
updated the model to describe the stages of the epidemic separately for
men and women so as to increase the model’s utility for countries (primarily low-income and low- and
middle-income countries) where women’s tobacco use rates remain low.
Impact of Tobacco on Noncommunicable Diseases
According to the WHO Global Report: Mortality Attributable to Tobacco,9 worldwide, 12% of all adult
deaths (>30 years of age and older) are attributed to tobacco (16% among men, 7% among women).
Deaths from noncommunicable diseases (NCDs) currently account for nearly 70% of all deaths
globally.67
Tobacco is widely acknowledged to be one of the major risk factors for NCD deaths; indeed,
worldwide, approximately 14% of adult deaths from NCDs are attributed to tobacco use, including
10% of all adult deaths from cardiovascular diseases (14% among men; 6% among women), and 22% of
all adult deaths from cancer (32% among men, 11% among women). The vast majority (71%) of adult
lung cancer deaths (78% among men, 53% among women) were attributable to tobacco. In addition,
36% of all adult deaths from diseases of the respiratory system were attributable to tobacco (42% among
men, 29% among women). Tobacco smoking is also an important causal factor for chronic obstructive
pulmonary disease (COPD) and is responsible for more than 75% of cases worldwide.68
In 2004 about
49% of COPD deaths among adult men and 34% of COPD deaths among adult women were attributable
to tobacco.9

Chapter 2: Patterns of Tobacco Use, Exposure, and Health Consequences
64
Impact of Tobacco on Communicable Diseases
Approximately 5% of global deaths from communicable diseases are attributed to tobacco, including
7% of all deaths due to tuberculosis (TB) and 12% of deaths due to lower respiratory infections.9 The
vast majority of tobacco-related TB deaths occur in LMICs.69
A systematic review by WHO70
found a
significant positive relationship between exposure (passive or active) to tobacco smoke and TB infection
and disease, independent of various potential confounders including alcohol use and socioeconomic
status. Recurrent TB and mortality resulting from TB were also associated with active smoking.70
Recent research suggests that cigarette smoking doubles the risk of recurrent TB in those previously
treated, complicating disease control efforts.71
Data from India show that tobacco smoking increases the
risk of dying from TB by two to four times, and accounts for about half of TB deaths in men.72–74
Impact of Tobacco Mortality, by Region
Data reported by WHO showed that, in 2004, the number of deaths attributable to tobacco was greatest
in the European Region (1.47 million deaths), followed by the Western Pacific Region (1.41 million
deaths), the South-East Asia Region (1.04 million deaths), and the Americas Region (0.86 million
deaths). In addition, tobacco use caused 0.15 million deaths in the African Region and 0.19 million
deaths in the Eastern Mediterranean Region.75
According to these data, nearly 70% of deaths attributable
to tobacco worldwide occurred in LMICs.75
Death rates for diseases caused by smoking were lower in
low-income countries than in middle-income countries and HICs, reflecting the lower past smoking rates
in low-income countries and the higher past smoking rates in middle-income countries and HICs.
Tobacco use was a leading health risk in HICs, causing 1.5 million deaths, or 17.9% of total mortality,
in those countries. In middle-income countries, 2.6 million deaths, or 10.8% of deaths, were attributable
to tobacco use. In low-income countries, tobacco use caused 1 million deaths, or 3.9% of deaths.75
Because of the lengthy time lags for the development of cancers and chronic respiratory diseases
associated with tobacco smoking, deaths from these illnesses in LMICs—and among women in many
regions—may continue to rise, even if smoking prevalence remains the same or decreases.
Disease Burden Attributable to Secondhand Smoke Exposure
Based on analyses of 2004 data, SHS exposure was estimated to have caused more than 600,000 deaths
worldwide (accounting for 1% of global mortality), including 379,000 deaths from ischemic heart
disease, 166,000 from lower respiratory infections, 35,800 from asthma, and 21,400 from lung cancer.76
Twenty-eight percent of deaths from SHS exposure occurred in children. Of adult deaths attributable to
SHS exposure, about 47% occurred in women. In addition, global data showed that 10.9 million
disability-adjusted life-years (DALYs) were lost in 2004 because of SHS exposure, which accounted for
about 0.7% of the total worldwide burden of diseases in DALYs. Children bear 61% of the burden in
DALYs. The largest disease burdens were from lower respiratory infections in children younger than
5 years old (5.9 million), ischemic heart disease in adults (2.8 million), and asthma in adults
(1.2 million) and children (0.7 million).2 In the United States, nonsmokers’ SHS exposure has been
shown to increase the risk of developing coronary heart disease; to increase the risk of suffering a stroke
(by 20%–30% for those exposed to SHS); to increase the risk of diabetes by 30%–40%; and to increase
the risk of developing cancers, notably lung cancer, by about 25%.61

Monograph 21: The Economics of Tobacco and Tobacco Control
65
Summary
Around the world, the health burden of tobacco use is enormous. At present, about 6 million people die
each year from tobacco use; this figure is projected to grow to 8 million by 2030, with the vast majority
(80%) of deaths anticipated to occur in low- and middle-income countries. A wide variety of tobacco
products—both smoked products (cigarettes, cigars, kreteks, bidis, and waterpipe) and a diverse group
of smokeless tobacco products—are in use worldwide. Manufactured cigarettes, however, account for
92.3% of tobacco sales worldwide; thus they are responsible for by far the most of tobacco-caused
disease and death. Secondhand smoke, a mixture of sidestream smoke from the burning tip of cigarettes
or other smoked tobacco products and mainstream smoke exhaled by the smoker, is a cause of disease
and death in adults and children. Tobacco use and secondhand smoke exposure are now recognized as
important causes of noncommunicable disease, communicable disease, and harm during pregnancy.
Tobacco use is estimated to cause 12% of deaths among persons aged 30 and over worldwide; this
represents about 14% of deaths from noncommunicable diseases (such as cancer, cardiovascular disease,
and lung disease) and 5% of deaths from communicable diseases (such as tuberculosis and lower
respiratory tract infections). Additionally, tobacco use contributes to and exacerbates poverty, which
itself contributes to ill health.
About 21% of the world’s population age 15 and over (about 1.1 billion people) are current smokers—
about 35% of males and 6% of females. Tobacco is a highly addictive substance, and the vast majority
of users smoke on a daily basis. With the exception of the African and Eastern Mediterranean Regions,
smoking prevalence is declining in all world regions; about half of all smokers live in either the South-
East Asia or the Western Pacific Region. Smoking prevalence is also declining when viewed from a
country income group perspective (high-, middle-, and low-income). The fact that the number of adult
tobacco users worldwide is not declining is primarily attributable to population growth. About 7% of
youth ages 13–15 worldwide smoke cigarettes, including about 9% of boys and 4.5% of girls. In many
countries, particularly low-income countries and lower middle-income countries, women’s smoking
prevalence remains low, often because of socio-cultural and economic factors discouraging tobacco use
among women. As these barriers fall, continued efforts will be required to ensure that women’s tobacco
use does not rise.
The number of smokeless tobacco users worldwide is estimated at 346 million, most of whom (86%)
live in the South-East Asia Region. Approximately 4% of youth ages 13–15 worldwide use smokeless
tobacco; as with adults, most 13- to 15-year-old smokeless tobacco users live in the South-East Asia
Region. An estimated 600,000 deaths worldwide in 2004 (1% of global mortality) were attributed to
SHS exposure. Data from countries participating in the GATS show a wide range of SHS exposure at
home and at work for both men and women. Data from the GYTS also show that a substantial
proportion of youth ages 13–15 years are exposed to SHS in the home and in other locations.
Studies from a number of countries document a disproportionate burden of tobacco use and SHS
exposure among disadvantaged groups, which are defined by income, race/ethnicity, geography, and
other factors. In most countries, poor people are more likely to smoke than their more affluent
counterparts, which contributes to a disproportionate burden of disease and death among the poor. The
four-stage model of the cigarette epidemic developed by Lopez and colleagues provides a useful
illustration of the stages of development of the tobacco epidemic. Implementation of strong tobacco
control measures can hasten countries’ progress through the stages of this model, resulting in lower
prevalence of tobacco use and a lower burden of disease.

Chapter 2: Patterns of Tobacco Use, Exposure, and Health Consequences
66
Research Needs
Ongoing surveillance of all forms of tobacco use is critical to understanding the tobacco epidemic and
its shifting global impact, including the burden of disease resulting from tobacco use. It is important that
surveillance systems monitor and adapt to changes in the tobacco product landscape. Information is
especially needed on patterns of use of non-cigarette tobacco products, for which data are more limited.
Although the body of evidence on the health effects of cigarette smoking is extensive, the long-term
health effects of other tobacco products, including use of waterpipe and smokeless tobacco, are not as
well understood. Finally, more information is also needed on the prevalence and patterns of ENDS use,
as well as the short- and long-term health effects of these products, including the effect of ENDS aerosol
exposure on nonusers.
Conclusions
1. There are about 1.1 billion smokers in the world, and about 4 in 5 smokers live in low- and
middle-income countries. Nearly two-thirds of the world’s smokers live in 13 countries.
2. Substantial progress has been made in reducing tobacco smoking in most regions, especially in
high-income countries. Overall smoking prevalence is decreasing at the global level, but the total
number of smokers worldwide is still not declining, largely due to population growth. Unless
stronger action is taken, it is unlikely the world will reach the WHO Member States’ 30% global
reduction target by 2025.
3. Globally, more than 80% of the world’s smokers are men. Differences in prevalence between
male and female smokers are particularly high in the South-East Asia and Western Pacific
Regions and in low- and middle-income countries.
4. Globalization and population migration are contributing to a changing tobacco landscape, and
non-traditional products are beginning to emerge within regions and populations where their use
had not previously been a concern.
5. An estimated 25 million youth currently smoke cigarettes. Although cigarette smoking rates are
higher among boys than girls, the difference in smoking rates between boys and girls is narrower
than that between men and women. Smoking rates among girls approach or even surpass rates
among women in all world regions.
6. Worldwide, an estimated 13 million youth and 346 million adults use smokeless tobacco
products. The large majority of smokeless tobacco users live in the WHO South-East Asia
Region. Smokeless tobacco use may be undercounted globally due to scarcity of data.
7. Secondhand smoke exposure remains a major problem. In most countries, an estimated
15%–50% of the population is exposed to secondhand smoke; in some countries secondhand
smoke exposure affects as much as 70% of the population.
8. Annually, around 6 million people die from diseases caused by tobacco use, including about
600,000 from secondhand smoke exposure. The burden of disease from tobacco is increasingly
concentrated in low- and middle-income countries.

Monograph 21: The Economics of Tobacco and Tobacco Control
67
References 1. World Health Organization. WHO global report on trends in prevalence of tobacco smoking, 2015. Geneva: World
Health Organization; 2015. Available from: http://apps.who.int/iris/bitstream/10665/156262/1/9789241564922_eng.pdf?ua=1.
2. Oberg M, Jaakkola MS, Woodward A, Peruga A, Pruss-Ustun A. Worldwide burden of disease from exposure to
second-hand smoke: a retrospective analysis of data from 192 countries. Lancet. 2011;377(9760):139-46.
doi: 10.1016/S0140-6736(10)61388-8.
3. World Health Organization. WHO report on the global tobacco epidemic, 2008: the MPOWER package. Geneva:
World Health Organization; 2008. Available from: http://whqlibdoc.who.int/publications/2008/9789241596282_eng.pdf.
4. Centers for Disease Control and Prevention. National adult tobacco survey. Atlanta: U.S. Department of Health and
Human Services, Centers for Disease Control and Prevention, National Center for Chronic Disease Prevention and
Health Promotion, Office on Smoking and Health; 2015. Available from: http://www.cdc.gov/tobacco/data_statistics/surveys/nats.
5. World Health Organization. Tobacco Free Initiative (TFI). Global Youth Tobacco Survey [Website]. 2016. Available
from: http://www.who.int/tobacco/surveillance/gyts/en.
6. HBSC International Coordinating Centre. HBSC: Health Behaviour in School-Aged Children: World Health Organization Collaborative Cross-National Survey [Website]; 2016. Available from: http://www.hbsc.org.
7. Center for Disease Control and Prevention. National youth tobacco survey. Atlanta: U.S. Department of Health and
Human Services, Centers for Disease Control and Prevention, National Center for Chronic Disease Prevention and
Health Promotion, Office on Smoking and Health; 2015. Available from: http://www.cdc.gov/tobacco/data_statistics/surveys/nyts.
8. National Cancer Institute and Centers for Disease Control and Prevention. Smokeless tobacco and public health: a
global perspective. NIH publication no. 14-7983. Bethesda, MD: U.S. Department of Health and Human Services,
Centers for Disease Control and Prevention and National Institutes of Health, National Cancer Institute; 2014. Available
from: http://cancercontrol.cancer.gov/brp/tcrb/global-perspective/SmokelessTobaccoAndPublicHealth.pdf.
9. World Health Organization. WHO global report: mortality attributable to tobacco. Geneva: World Health Organization;
2012. Available from: http://apps.who.int/iris/bitstream/10665/44815/1/9789241564434_eng.pdf.
10. Boyle P, Ariyaratne MA, Barrington R, Bartelink H, Bartsch G, Berns A, et al. Tobacco: deadly in any form or disguise.
Lancet. 2006;367(9524):1710-2. doi: 10.1016/S0140-6736(06)68747-3.
11. Zhu S-H, Sun JY, Bonnevie E, Cummins SE, Gamst A, Yin L, et al. Four hundred and sixty brands of e-cigarettes
and counting: implications for product regulation. Tob Control. 2014;23(Suppl 3):iii3-9.
doi: 10.1136/tobaccocontrol-2014-051670.
12. Euromonitor International. Historical retail sales, million sticks, available countries, 2003-2013. [Database]. London:
Euromonitor International. Accessed 20 Feb 2016. Available by subscription from: http://www.euromonitor.com.
13. World Health Organization. Women and tobacco. Geneva: World Health Organization; 1992. Available from:
http://apps.who.int/iris/bitstream/10665/37510/1/9241561475_eng.pdf.
14. Nichter M, Greaves L, Bloch M, Paglia M, Scarinci I, Tolosa JE, et al. Tobacco use and secondhand smoke exposure
during pregnancy in low- and middle-income countries: the need for social and cultural research. Acta Obstet Gynecol
Scand. 2010;89(4):465-77. doi: 10.3109/00016341003592552.
15. World Health Organization. Tobacco Free Initiative (TFI). Global Adult Tobacco Survey [Website]. 2016. Available
from: http://www.who.int/tobacco/surveillance/survey/gats/en.
16. Giovino GA, Mirza SA, Samet JM, Gupta PC, Jarvis MJ, Bhala N, et al., for the GATS Collaborative Group. Tobacco
use in 3 billion individuals from 16 countries: an analysis of nationally representative cross-sectional household
surveys. Lancet. 2012;380(9842):668-79. Available from: http://ac.els-cdn.com/S014067361261085X/1-s2.0-S014067361261085X-
main.pdf?_tid=8819dfb8-bc0b-11e3-9796-00000aab0f6b&acdnat=1396624526_8775938c017d2c43404900a3b012451f. Errata in: Lancet,
2012;380(9857):1908; and Lancet, 2013;13;382(9887):128.
17. Hedley D. Expansion opportunities in the Middle East, North Africa. Gulf News. 2011 Nov 27 [cited 2016 Aug 1].
Available from: http://gulfnews.com/expansion-opportunities-in-the-middle-east-north-africa-1.938366.
18. World Health Organization. Global Adult Tobacco Survey fact sheet: India: 2009-2010. Geneva: World Health
Organization; 2010. Available from: http://www.who.int/tobacco/surveillance/en_tfi_india_gats_fact_sheet.pdf.
19. World Health Organization. Country Office for Bangladesh. Bangladesh NCD risk factor survey 2010. [Fact sheet].
Geneva: World Health Organization; 2010. Available from: http://www.who.int/chp/steps/2010_Bangladesh_FactSheet.pdf.
20. Delnevo CD, Wackowski OA, Giovenco DP, Manderski MT, Hrywna M, Ling PM. Examining market trends in the
United States smokeless tobacco use: 2005–2011. Tob Control. 2014;23(2):107-12.
doi: 10.1136/tobaccocontrol-2012-050739.
21. Kalkhoran S, Glantz SA. E-cigarettes and smoking cessation in real-world and clinical settings: a systematic review and
meta-analysis. Lance Respir Med. 2016;4(2):116-28. doi: 10.1016/S2213-2600(15)00521-4.

Chapter 2: Patterns of Tobacco Use, Exposure, and Health Consequences
68
22. Parascandola M, Augustson E, O’Connell ME, Marcus S. Consumer awareness and attitudes related to new potential
reduced-exposure tobacco product brands. Nicotine Tob Res. 2009;11(7):886-95. doi: 10.1093/ntr/ntp082.
23. Singh T, Marynak K, Arrazola RA, Cox S, Rolle IV, King BA. Vital signs: exposure to electronic cigarette advertising
among middle school and high school students – United States, 2014. MMWR Morb Mortal Wkly Rep.
2016;64(52):1403-8. doi: 10.15585/mmwr.mm6452a3.
24. McMillen RC, Gottlieb MA, Shaefer RM, Winickoff JP, Klein JD. Trends in electronic cigarette use among U.S. adults:
use is increasing in both smokers and nonsmokers. Nicotine Tob Res. 2015;17(10):1195-202. doi: 10.1093/ntr/ntu213.
25. European Commission. Attitudes of Europeans towards tobacco and electronic cigarettes. Special Eurobarometer 429;
2015. Available from: http://ec.europa.eu/public_opinion/archives/ebs/ebs_429_en.pdf.
26. Etter JF. Electronic cigarettes: a survey of users. BMC Public Health. 2010;10:231. doi: 10.1186/1471-2458-10-231.
27. Gartner CE, Hall WD, Borland R. How should we regulate smokeless tobacco products and e-cigarettes? Med J Aust.
2012;197(11):611-2. doi: 10.5694/mja12.10940.
28. World Health Organization Framework Convention on Tobacco Control. Electronic nicotine delivery systems. Report
by WHO. FCTC/COP/6/10. 21 July 2014. Available from: http://apps.who.int/gb/fctc/PDF/cop6/FCTC_COP6_10-en.pdf.
29. Ley no.13 de 24 de enero de 2008, Que adopta medidas para el control del Tabaco y sus efectos nocivos en la salud.
[Law no. 13 of 24 Jan 2008, Measures for control of tobacco and its effects on health.] [Panama]. Available from:
http://www.tobaccocontrollaws.org/files/live/Panama/Panama%20%20-%20Law%2013%20of%202008%20-%20native.pdf. Spanish.
30. Ministerio de Salud (Panama). Decreto Ejecutivo no. 1838 (de viernes 5 de diciembre de 2014). Que prohibe el uso de
los sistemas electrónicos de administración de nicotina, cigarillos electróonicos, vaporizadores u otros dispositivos
similares, con o sin nicotina. Available from: https://www.gacetaoficial.gob.pa/pdfTemp/27678_A/GacetaNo_27678a_20141211.pdf.
Spanish.
31. Health Sciences Authority (Singapore). Prohibition on Certain Products: Prohibition of Imitation Tobacco Products.
[Last updated 4 Aug 2016]. Available from: http://www.hsa.gov.sg/content/hsa/en/Health_Products_Regulation/Tobacco_Control/Overview/Tobacco_Legislation/Prohibition_on_Certain_Produ
cts.html.
32. Notification of the Ministry of Commerce Prohibition of importing hookah and electronic hookah or electronic cigarette
into Thailand. B.E. 2557 (A.D. 2014). Government Gazette, p. 1, vol. 131, special section. December 24, 2014.
Available from: http://tobaccocontrollaws.org/files/live/Thailand/Thailand%20-%20Ban%20on%20Hookah,%20E-Cigs.pdf.
33. El Presidente de la Republica [Uruguay] acuando en Consejo de Ministros, decreta: Prohibese la commercialización,
importación, registro como marca o patente y publicidad de cualquier dispositivo electrónico para fumar [Presidential
decree of 2009 banning the marketing, importation, brand and patent registry and publicity of ENDS with and without
nicotine. Available from: http://archivo.presidencia.gub.uy/_web/decretos/2009/11/871.pdf. Spanish.
34. European Union. Directive 2014/40/EU of the European Parliament and of the Council of 3 April 2014 on the
approximation of the laws, regulations and administrative provisions of the Member States concerning the manufacture,
presentation and sale of tobacco and related products and repealing directive 2001/37/EC. Official Journal of the
European Union. 2014: L 127/1; 29.4.2014 [cited 2015 Mar 23]. Available from:
http://ec.europa.eu/health/tobacco/docs/dir_201440_en.pdf.
35. Lempert LK, Grana R, Glantz SA. The importance of product definitions in U.S. e-cigarette laws and regulations.
Tob Control. 2016;25(e1):344-51. doi: 10.1136/tobaccocontrol-2014-051913.
36. Medicines and Healthcare Products Regulatory Agency. Medicines information: product details. London:
Government of the United Kingdom; 2015. Available from: http://www.mhra.gov.uk/spc-
pil/?IdcService=SS_GET_PAGE&nodeId=%3C%25%3D+nodeId+%25%3E&searchFiled=e-voke&SubmitSearch=Search#retainDisplay.
37. Cobb CO, Khader Y, Nasim A, Eissenberg T. A multi-year survey of waterpipe and cigarette smoking on a U.S.
university campus. J Am Coll Health. 2012;60(7):521-7. doi: 10.1080/07448481.2012.692416.
38. Martinasek MP, McDermott RJ, Martini L. Waterpipe (hookah) tobacco smoking among youth. Curr Probl Pediatr
Adolesc Health Care. 2011;41(2):34-57. doi: 10.1016/j.cppeds.2010.10.001.
39. Maziak W. The global epidemic of waterpipe smoking. Addict Behav. 2011;36(1-2):1-5.
doi: 10.1016/j.addbeh.2010.08.030.
40. Rice VH. Water pipe smoking among the young: the rebirth of an old tradition. Nurs Clin North Am.
2012;47(1):141-8. doi: 10.1016/j.cnur.2011.10.011.
41. International Agency for Research on Cancer. The hazards of smoking and the benefits of stopping: cancer mortality
and overall mortality. In: IARC; Dresler C, Leon M, editors. Reversal of risk after quitting smoking. IARC handbooks
of cancer prevention. Vol. 11. Lyon, France: World Health Organization, International Agency for Research on Cancer;
2007. p. 15-27. Available from: http://www.iarc.fr/en/publications/pdfs-online/prev/handbook11/HB11_Reversal_of_Risk.pdf.

Monograph 21: The Economics of Tobacco and Tobacco Control
69
42. U.S. Department of Health and Human Services. The health consequences of involuntary exposure to tobacco smoke: a
report of the Surgeon General. Atlanta: U.S. Department of Health and Human Services, Centers for Disease Control
and Prevention, Coordinating Center for Health Promotion, National Center for Chronic Disease Prevention and Health
Promotion, Office on Smoking and Health; 2006. Available from: http://www.cdc.gov/tobacco/data_statistics/sgr/2006/index.htm.
43. U.S. Department of Health and Human Services. The health consequences of smoking: a report of the Surgeon General.
Atlanta: U.S. Department of Health and Human Services, Centers for Disease Control and Prevention, National Center
for Chronic Disease Prevention and Health Promotion, Office on Smoking and Health; 2004. Available from:
http://www.cdc.gov/tobacco/data_statistics/sgr/2004/index.htm.
44. Wipfli H, Avila-Tang E, Navas-Acien A, Kim S, Onicescu G, Yuan J, et al. Secondhand smoke exposure among
women and children: evidence from 31 countries. Am J Public Health. 2008;98(4):672-9.
doi: 10.2105/AJPH.2007.126631.
45. World Health Organization. Tobacco and poverty: a vicious circle. Geneva: World Health Organization; 2004.
Available from: http://www.who.int/tobacco/communications/events/wntd/2004/en/wntd2004_brochure_en.pdf.
46. World Health Organization. Systematic review of the link between tobacco and poverty. Geneva: World Health
Organization; 2011. Available from: http://whqlibdoc.who.int/publications/2011/9789241500548_eng.pdf.
47. Barbeau EM, Krieger N, Soobader MJ. Working class matters: socioeconomic disadvantage, race/ethnicity, gender, and
smoking in NHIS 2000. Am J Public Health. 2004;94(2):269-78. doi: 10.2105/AJPH.94.2.269.
48. Chahine T, Subramanian SV, Levy JI. Sociodemographic and geographic variability in smoking in the U.S.:
a multilevel analysis of the 2006-2007 Current Population Survey, Tobacco Use Supplement. Soc Sci Med.
2011;73(5):752-8. doi: 10.1016/j.socscimed.2011.06.032.
49. Fagan P, Moolchan ET, Lawrence D, Fernander A, Ponder PK. Identifying health disparities across the tobacco
continuum. Addiction. 2007;102(Suppl 2):5-29. doi: 10.1111/j.1360-0443.2007.01952.x.
50. Hiscock R, Bauld L, Amos A, Fidler JA, Munafo M. Socioeconomic status and smoking: a review. Ann N Y Acad Sci.
2012;1248:107-23. doi: 10.1111/j.1749-6632.2011.06202.x.
51. Margerison-Zilko C, Cubbin C. Socioeconomic disparities in tobacco-related health outcomes across racial/ethnic
groups in the United States: National Health Interview Survey 2010. Nicotine Tob Res. 2013;15(6):1161-5.
doi: 10.1093/ntr/nts256.
52. Siahpush M, Heller G, Singh G. Lower levels of occupation, income and education are strongly associated with a longer
smoking duration: multivariate results from the 2001 Australian National Drug Strategy Survey. Public Health.
2005;119(12):1105-10. doi: 10.1016/j.puhe.2005.03.004.
53. Siahpush M, Singh GK, Jones PR, Timsina LR. Racial/ethnic and socioeconomic variations in duration of smoking:
results from 2003, 2006 and 2007 Tobacco Use Supplement of the Current Population Survey. J Public Health (Oxf).
2010;32(2):210-8. doi: 10.1093/pubmed/fdp104.
54. Datta GD, Subramanian SV, Colditz GA, Kawachi I, Palmer JR, Rosenberg L. Individual, neighborhood, and state-level
predictors of smoking among US Black women: a multilevel analysis. Soc Sci Med. 2006 Aug;63(4):1034-44. doi:
10.1016/j.socscimed.2006.03.010.
55. U.S. Department of Health and Human Services. Tobacco use among U.S. racial/ethnic minority groups: a report of the
Surgeon General. Atlanta: U.S. Department of Health and Human Services, Centers for Disease Control and Prevention,
National Center for Chronic Disease Prevention and Health Promotion, Office on Smoking and Health; 1998. Available
from: http://www.cdc.gov/tobacco/data_statistics/sgr/1998/complete_report/pdfs/complete_report.pdf.
56. Australian Institute of Health and Welfare. National Drug Strategy Household Survey detailed report 2013. Drug
statistics series no. 28. Cat. no. PHE 183. Canberra: Australian Institute of Health and Welfare; 2014. Available from:
http://www.aihw.gov.au/alcohol-and-other-drugs/ndshs-2013.
57. Giskes K, Kunst AE, Benach J, Borrell C, Costa G, Dahl E, et al. Trends in smoking behaviour between 1985 and
2000 in nine European countries by education. J Epidemiol Community Health. 2005;59(5):395-401.
doi: 10.1136/jech.2004.025684.
58. Janson C, Kunzli N, de Marco R, Chinn S, Jarvis D, Svanes C, et al. Changes in active and passive smoking
in the European Community Respiratory Health Survey. Eur Respir J. 2006;27(3):517-24.
doi: 10.1183/09031936.06.00106605.
59. Pérez-Stable EJ, Viswanath K, Fagan P, Vallone D, Buchting FO. Global tobacco inequalities: a new frontier. Cancer
Causes Control. 2012;23:1-5. doi: 10.1007/s10552-012-9917-x.
60. Hosseinpoor AR, Parker LA, Tursan d’Espaignet E, Chatterji S. Socioeconomic inequality in smoking in low-income
and middle-income countries: results from the World Health Survey. PLoS ONE. 2012;7(8):e42843.
doi: 10.1371/journal.pone.0042843.

Chapter 2: Patterns of Tobacco Use, Exposure, and Health Consequences
70
61. U.S. Department of Health and Human Services. The health consequences of smoking—50 years of progress: a report
of the Surgeon General, 2014. Atlanta: U.S. Department of Health and Human Services, Centers for Disease Control
and Prevention, National Center for Chronic Disease Prevention and Health Promotion, Office on Smoking and Health;
2014. Available from: http://www.surgeongeneral.gov/library/reports/50-years-of-progress.
62. International Agency for Research on Cancer. Tobacco smoke and involuntary smoking. IARC monographs on the
evaluation of carcinogenic risks to humans. Vol. 83. Lyon, France: World Health Organization, International Agency
for Research on Cancer; 2004. Available from: https://monographs.iarc.fr/ENG/Monographs/vol83/mono83.pdf.
63. World Health Organization. WHO recommendations for the prevention and management of tobacco use and
second-hand smoke exposure in pregnancy. Geneva: World Health Organization; 2013. Available from:
http://apps.who.int/iris/bitstream/10665/94555/1/9789241506076_eng.pdf?ua=1.
64. Leonardi-Bee J, Smyth A, Britton J, Coleman T. Environmental tobacco smoke and fetal health: systematic review and
meta-analysis. Arch Dis Child Fetal Neonatal Ed. 2008;93(5):F351-61. doi: 10.1136/adc.2007.133553.
65. Lopez A, Collishaw N, Piha T. A descriptive model of the cigarette epidemic in developed countries. Tob Control.
1994;3(3):242-7. doi: 10.1136/tc.3.3.242.
66. Thun M, Peto R, Boreham J, Lopez AD. Stages of the cigarette epidemic on entering its second century. Tob Control.
2012;21(2):96-101. doi: 10.1136/tobaccocontrol-2011-050294.
67. World Health Organization. Global health estimates: deaths by cause, age, sex, and country, 2000-2012. Geneva: World
Health Organization; 2014 [cited 2016 Dec 13]. Available from: http://www.who.int/healthinfo/global_burden_disease/estimates/en/index1.html.
68. Ait-Khaled N, Enarson D, Bousquet J. Chronic respiratory diseases in developing countries: the burden and strategies
for prevention and management. Bull World Health Organ. 2001;79(10):971-9. Available from:
http://www.ncbi.nlm.nih.gov/pmc/articles/PMC2566677/pdf/11693980.pdf.
69. World Health Organization. Tuberculosis fact sheet. 2016. Available from: http://www.who.int/mediacentre/factsheets/fs104/en.
70. Slama K, Chiang CY, Enarson DA, Hassmiller K, Fanning A, Gupta P, et al. Tobacco and tuberculosis: a qualitative
systematic review and meta-analysis. Int J Tuberc Lung Dis. 2007;11(10):1049-61.
71. International Union Against Tuberculosis and Lung Disease. New study shows smoking tobacco doubles risk of
recurrent tuberculosis [Press release]. 2014 Mar 24 [cited 2014 Jul 7]. Available from: http://www.theunion.org/news-
centre/news/new-study-shows-smoking-tobacco-doubles-risk-of-recurrent-tuberculosis.
72. Gajalakshmi V, Peto R. Smoking, drinking and incident tuberculosis in rural India: population-based case-control study.
Int J Epidemiol. 2009;38(4):1018-25. doi: 10.1093/ije/dyp225.
73. Gajalakshmi V, Peto R, Kanaka TS, Jha P. Smoking and mortality from tuberculosis and other diseases in India:
retrospective study of 43000 adult male deaths and 35000 controls. Lancet. 2003;362(9383):507-15.
doi: 10.1016/S0140-6736(03)14109-8.
74. Jha P, Jacob B, Gajalakshmi V, Gupta PC, Dhingra N, Kumar R, et al. A nationally representative case-control study of
smoking and death in India. N Engl J Med. 2008;358(11):1137-47. doi: 10.1056/NEJMsa0707719.
75. World Health Organization. Global health risks: mortality and burden of disease attributable to selected major risks.
Geneva: World Health Organization; 2009 [cited 2012 Mar 7]. Available from:
http://www.who.int/healthinfo/global_burden_disease/GlobalHealthRisks_report_full.pdf.
76. World Health Organization. Global estimate of the burden of disease from second-hand smoke. Geneva: World Health
Organization; 2011. Available from:
http://www.who.int/tobacco/publications/second_hand/global_estimate_burden_disease/en/index.html.