chapter 22 hypothesis testing1 chapter 22 what is a test of significance?
Post on 18-Dec-2015
222 views
TRANSCRIPT
Chapter 22 Hypothesis Testing
1
Chapter 22
What Is a Test of Significance?
Chapter 22 Hypothesis Testing
2
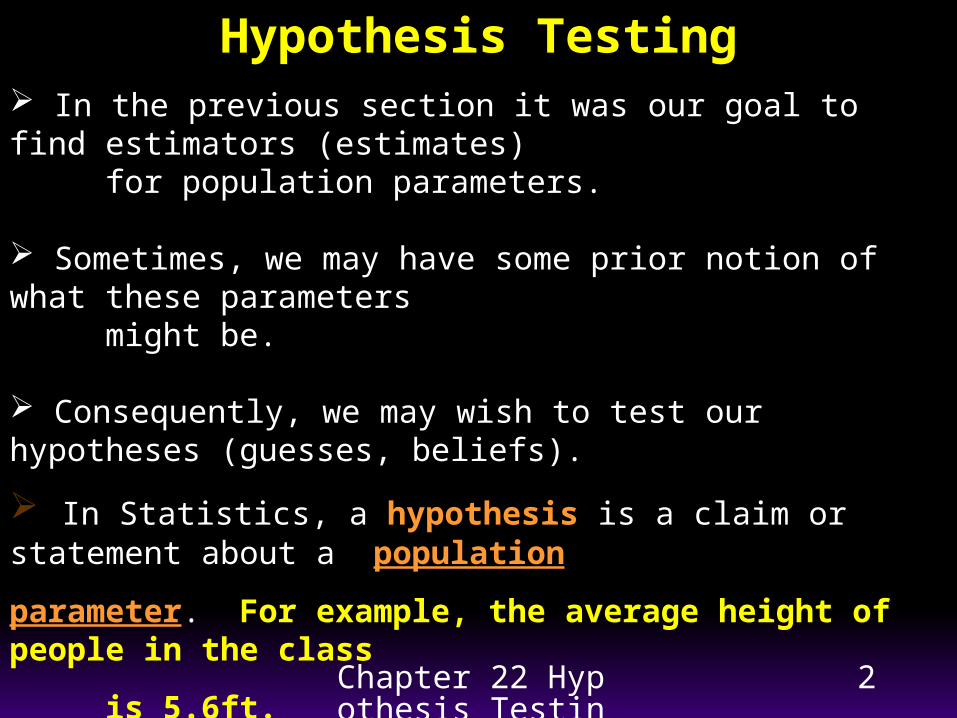
Hypothesis Testing In the previous section it was our goal to find estimators (estimates) for population parameters.
Sometimes, we may have some prior notion of what these parameters might be.
Consequently, we may wish to test our hypotheses (guesses, beliefs).
In Statistics, a hypothesis is a claim or statement about a population
parameter. For example, the average height of people in the class
is 5.6ft.
The goal of hypothesis testing is to use sample data to determine whether the hypothesis is true or not.

Chapter 22 Hypothesis Testing
3
Null and Alternative Hypothesis
Our prior guess is called the null hypothesis and is denoted by H0. It is most often what we believe to be true.
H0 will always be stated as an equality claim. For the mean, the null hypothesis will be stated as:
H0 : μ = μ0 (some value)
By switching to energy saving bulbs, you save at least $500 on hydro bills
in a year !
Chapter 22 Hypothesis Testing
4
Null and Alternative Hypothesis
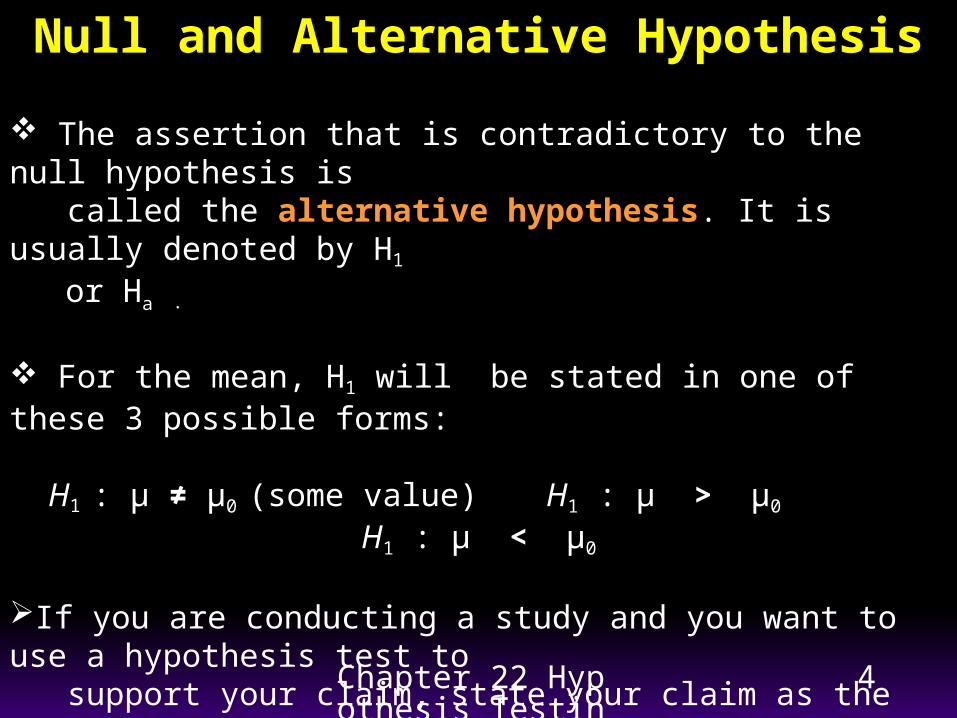
The assertion that is contradictory to the null hypothesis is called the alternative hypothesis. It is usually denoted by H1
or Ha .
For the mean, H1 will be stated in one of these 3 possible forms:
H1 : μ ≠ μ0 (some value) H1 : μ > μ0 H1 : μ < μ0
If you are conducting a study and you want to use a hypothesis test to support your claim, state your claim as the alternative hypothesis.
When trying to support a research claim, the alternative hypothesis is sometimes called the research hypothesis.
Chapter 22 Hypothesis Testing
5
The Null Hypothesis: H0
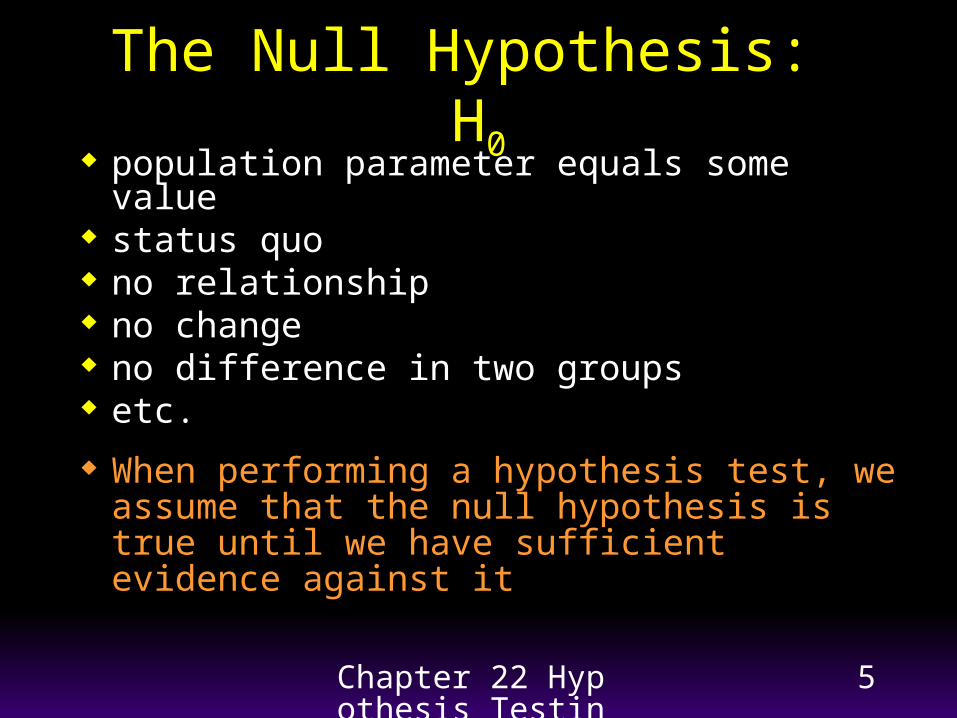
population parameter equals some value status quo no relationship no change no difference in two groups etc.
When performing a hypothesis test, we assume that the null hypothesis is true until we have sufficient evidence against it
Chapter 22 Hypothesis Testing
6
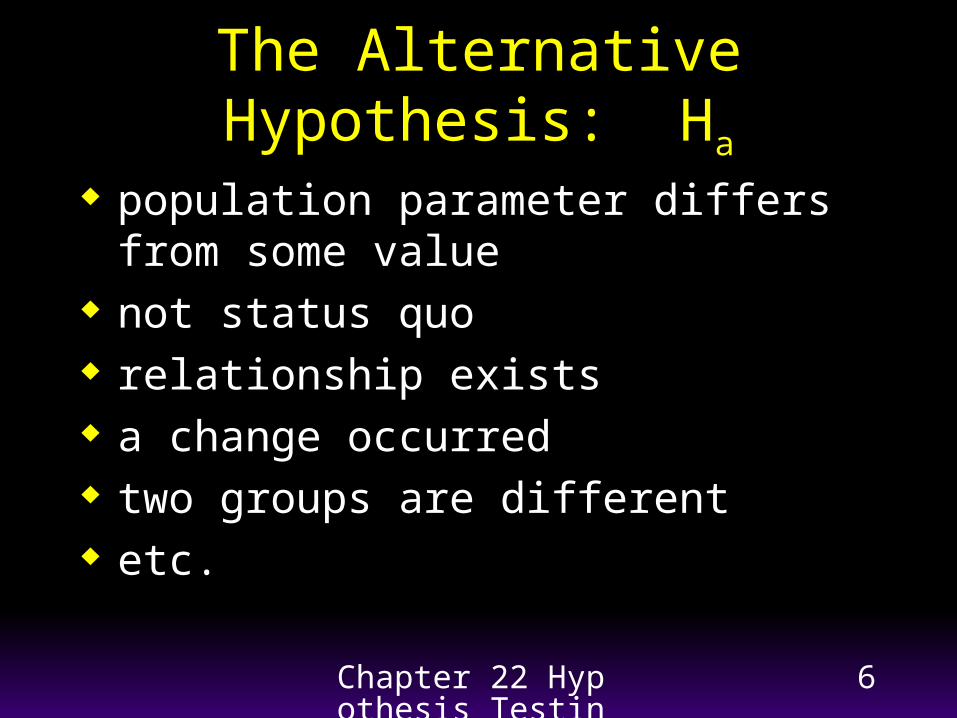
The Alternative Hypothesis: Ha
population parameter differs from some value
not status quo relationship exists a change occurred two groups are different etc.
Chapter 22 Hypothesis Testing
7
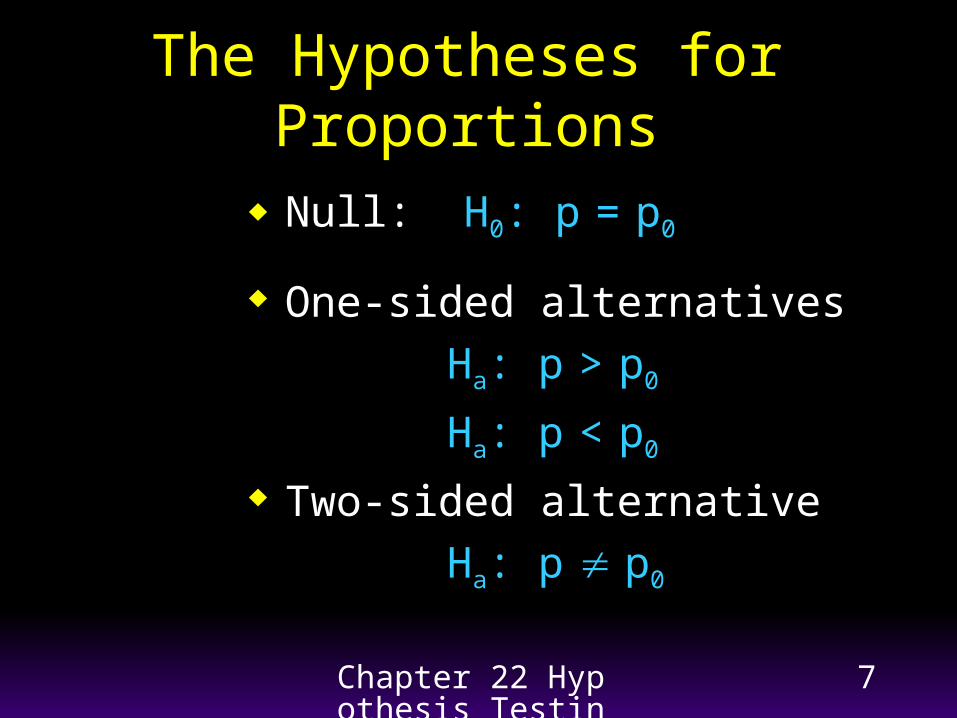
The Hypotheses for Proportions
Null: H0: p = p0
One-sided alternatives
Ha: p > p0
Ha: p < p0
Two-sided alternative
Ha: p p0
Chapter 22 Hypothesis Testing
8
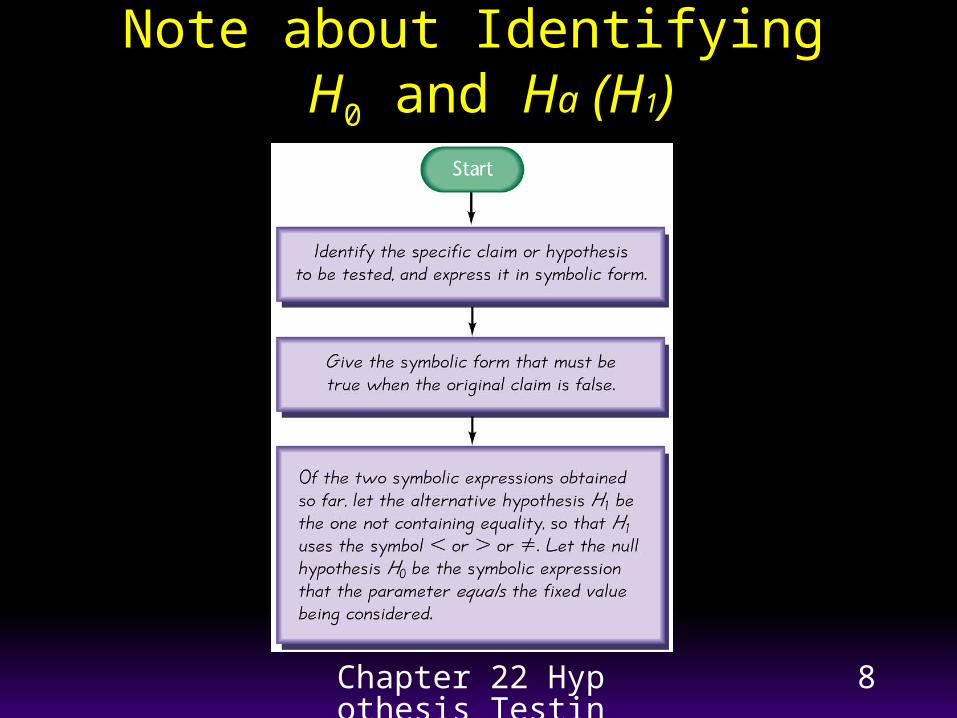
Note about Identifying H0 and Ha (H1)
Chapter 22 Hypothesis Testing
9
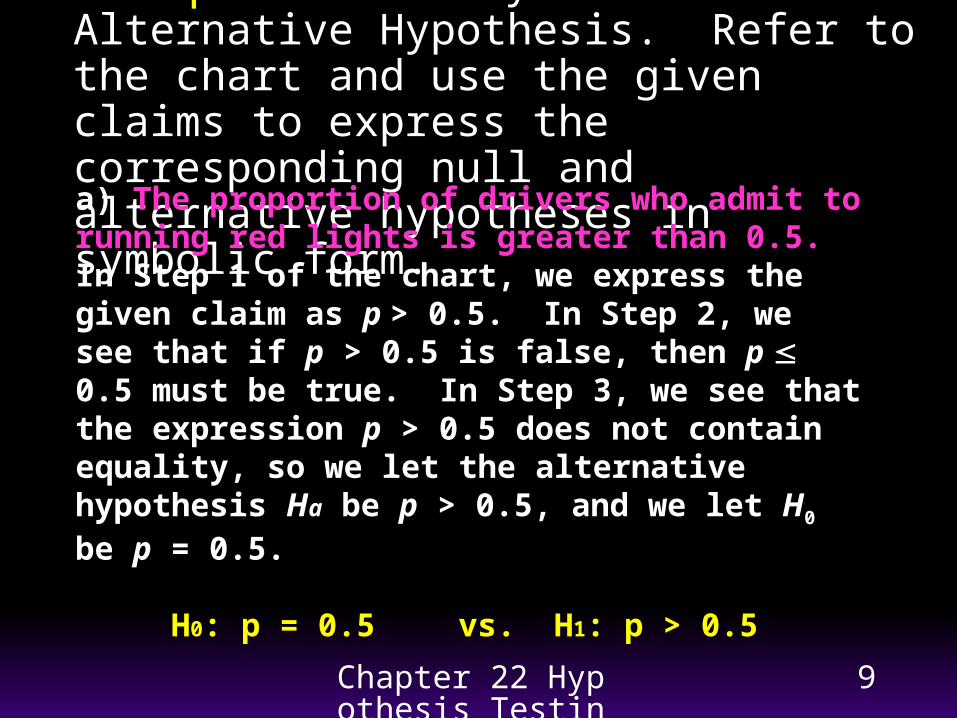
Example: Identify the Null and Alternative Hypothesis. Refer to the chart and use the given claims to express the corresponding null and alternative hypotheses in symbolic form.
a) The proportion of drivers who admit to running red lights is greater than 0.5. In Step 1 of the chart, we express the given claim as p > 0.5. In Step 2, we see that if p > 0.5 is false, then p 0.5 must be true. In Step 3, we see that the expression p > 0.5 does not contain equality, so we let the alternative hypothesis Ha be p > 0.5, and we let H0 be p = 0.5.
H0: p = 0.5 vs. H1: p > 0.5
Chapter 22 Hypothesis Testing
10
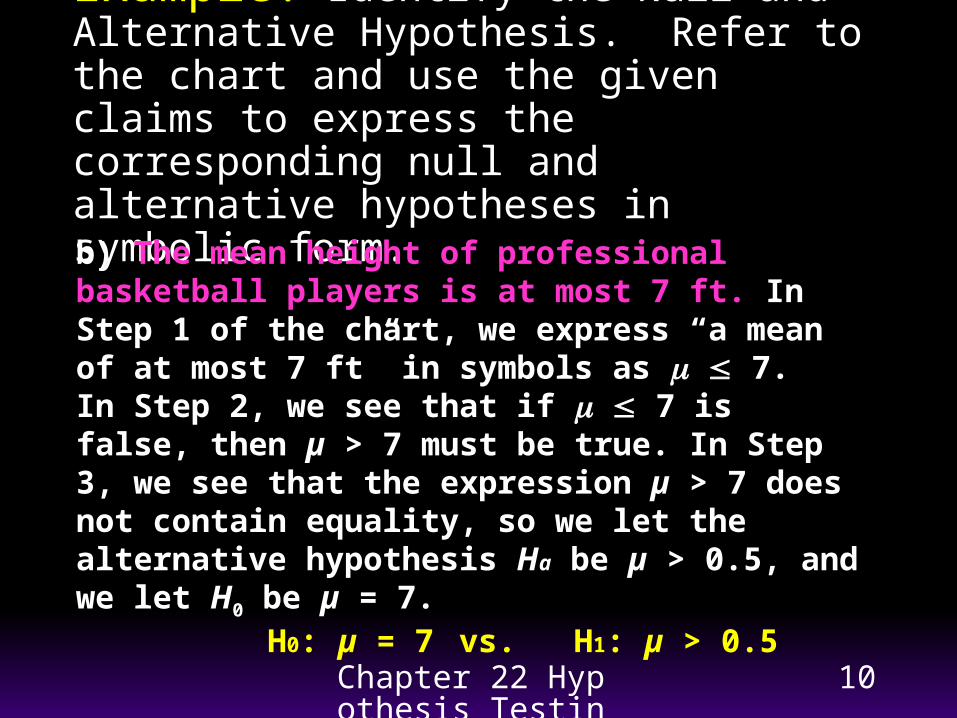
Example: Identify the Null and Alternative Hypothesis. Refer to the chart and use the given claims to express the corresponding null and alternative hypotheses in symbolic form.
b) The mean height of professional basketball players is at most 7 ft. In Step 1 of the chart, we express “a mean of at most 7 ft” in symbols as 7. In Step 2, we see that if 7 is false, then µ > 7 must be true. In Step 3, we see that the expression µ > 7 does not contain equality, so we let the alternative hypothesis Ha be µ > 0.5, and we let H0 be µ = 7.
H0: µ = 7 vs. H1: µ > 0.5
Chapter 22 Hypothesis Testing
11
Hypothesis testing is done under the assumption that the null hypothesis is true, kind of like a trial: "innocent until proven guilty".
On the basis of observed sample information we decide to either reject or not reject the null hypothesis.
- If we do not reject the null hypothesis, it does not mean that we have accepted it. It just means that based on the sample, there is not enough evidence to reject it (a different sample might lead to a different conclusion).
Test Statistic• The test statistic is a value that we calculate from the sample data.
• The decision to reject or not to reject the null hypothesis is based on the test statistic.
• When calculating the test statistic, we assume that the null hypothesis is true.
Chapter 22 Hypothesis Testing
12
The test statistic is a value used in making a decision about the null hypothesis, and is found by converting the sample statistic to a score with the assumption that the null hypothesis is true.
Test Statistic
Chapter 22 Hypothesis Testing
13
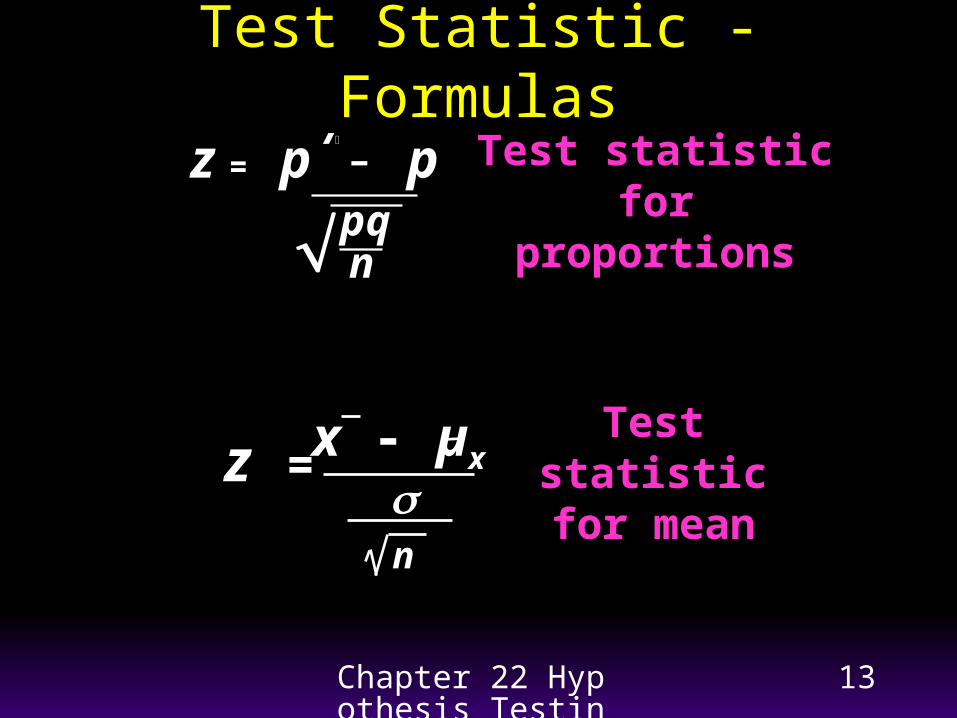
Test Statistic - Formulas
z = x - µx
n
Test statistic for mean
z = p - p
pqn
Test statistic for proportions
Chapter 22 Hypothesis Testing
14
)ˆ( p
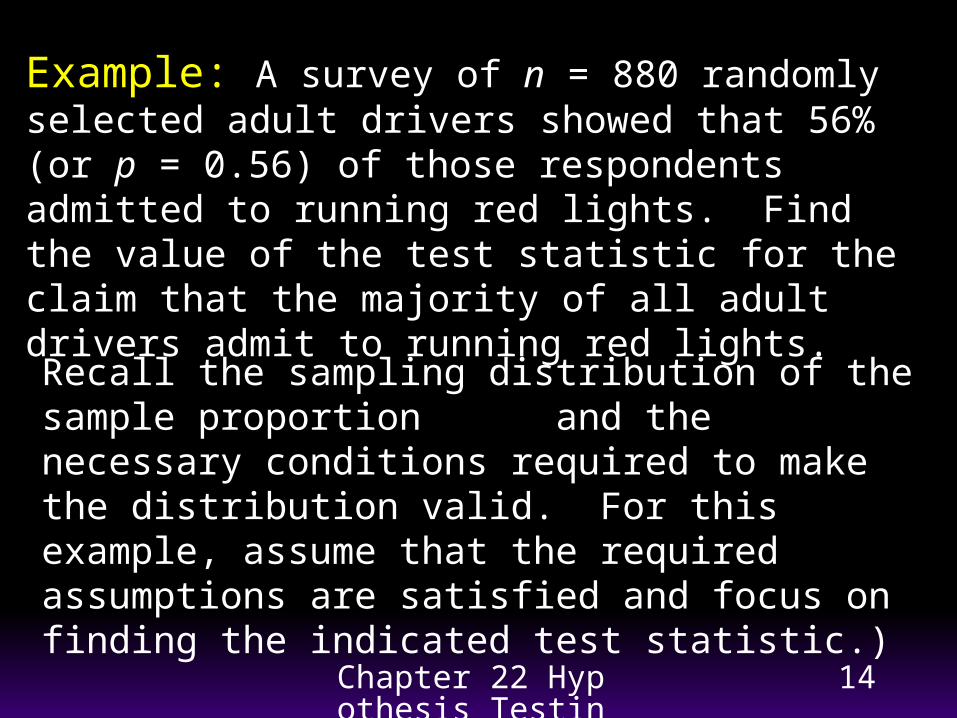
Example: A survey of n = 880 randomly selected adult drivers showed that 56% (or p = 0.56) of those respondents admitted to running red lights. Find the value of the test statistic for the claim that the majority of all adult drivers admit to running red lights.
Recall the sampling distribution of the sample proportion and the necessary conditions required to make the distribution valid. For this example, assume that the required assumptions are satisfied and focus on finding the indicated test statistic.)
Chapter 22 Hypothesis Testing
15
npq
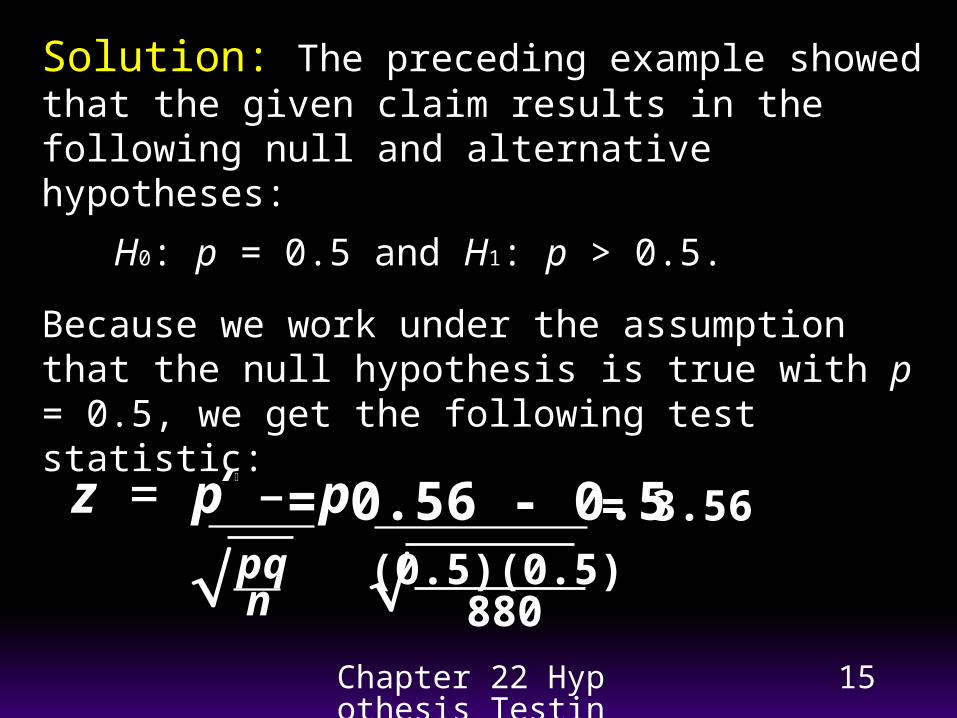
z = p – p
= 0.56 - 0.5
(0.5)(0.5) 880
= 3.56
Solution: The preceding example showed that the given claim results in the following null and alternative hypotheses:
H0: p = 0.5 and H1: p > 0.5.
Because we work under the assumption that the null hypothesis is true with p = 0.5, we get the following test statistic:
Chapter 22 Hypothesis Testing
16
Interpretation: We know from previous chapters that a z score of 3.56 is exceptionally large. It appears that in addition to being “more than half,” the sample result of 56% is significantly more than 50%.
See the following figure:
Chapter 22 Hypothesis Testing
17
Critical Region, Critical Value, Test Statistic
Chapter 22 Hypothesis Testing
18
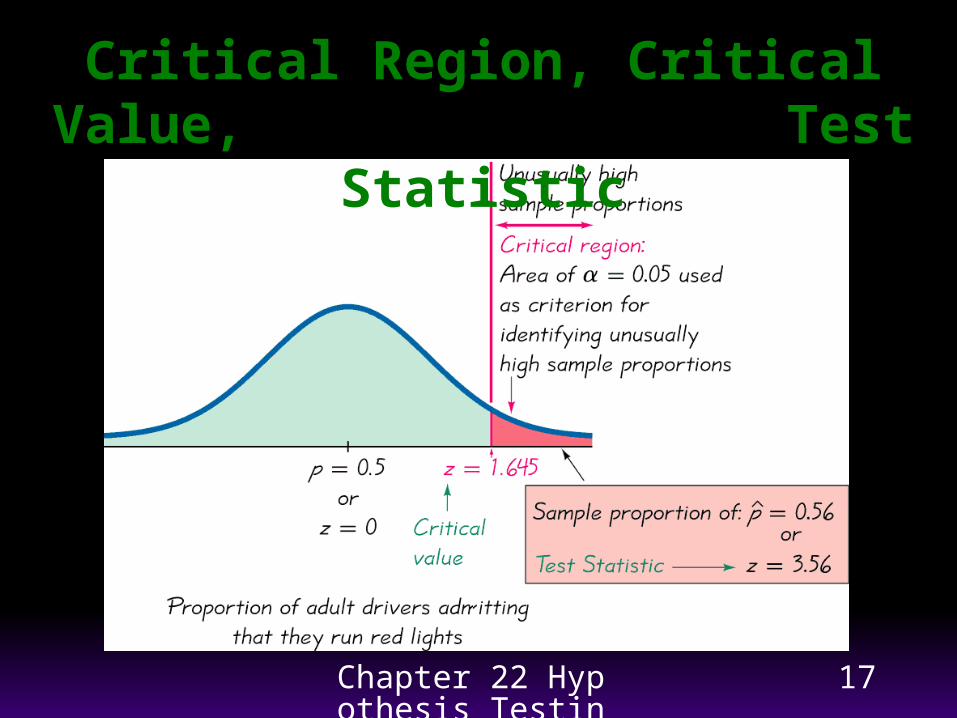
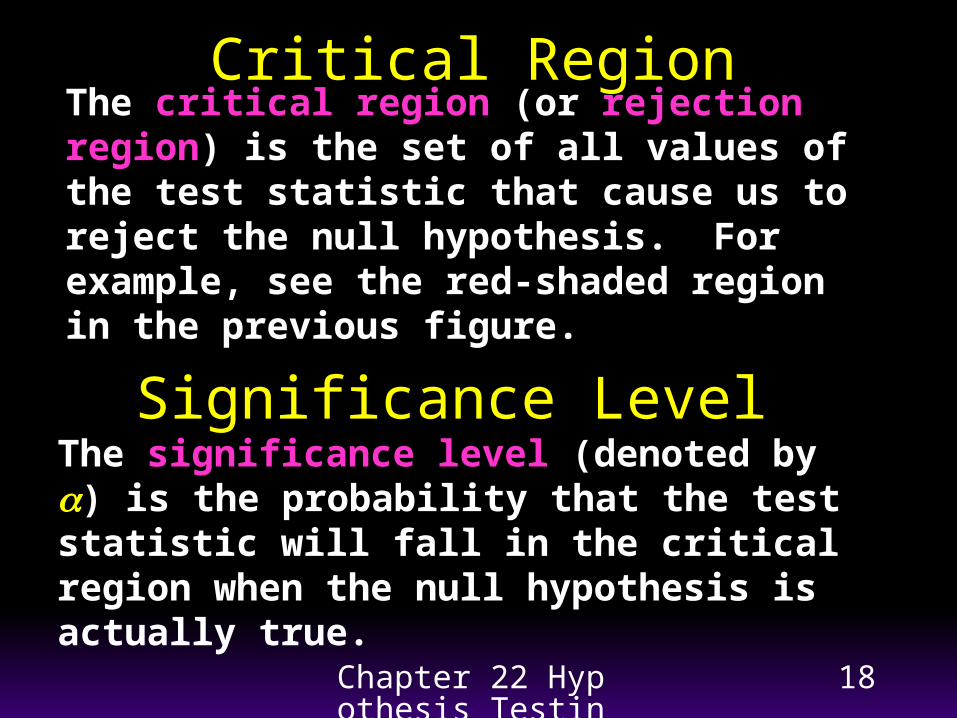
Critical RegionThe critical region (or rejection region) is the set of all values of the test statistic that cause us to reject the null hypothesis. For example, see the red-shaded region in the previous figure.
Significance LevelThe significance level (denoted by ) is the probability that the test statistic will fall in the critical region when the null hypothesis is actually true.
Chapter 22 Hypothesis Testing
19
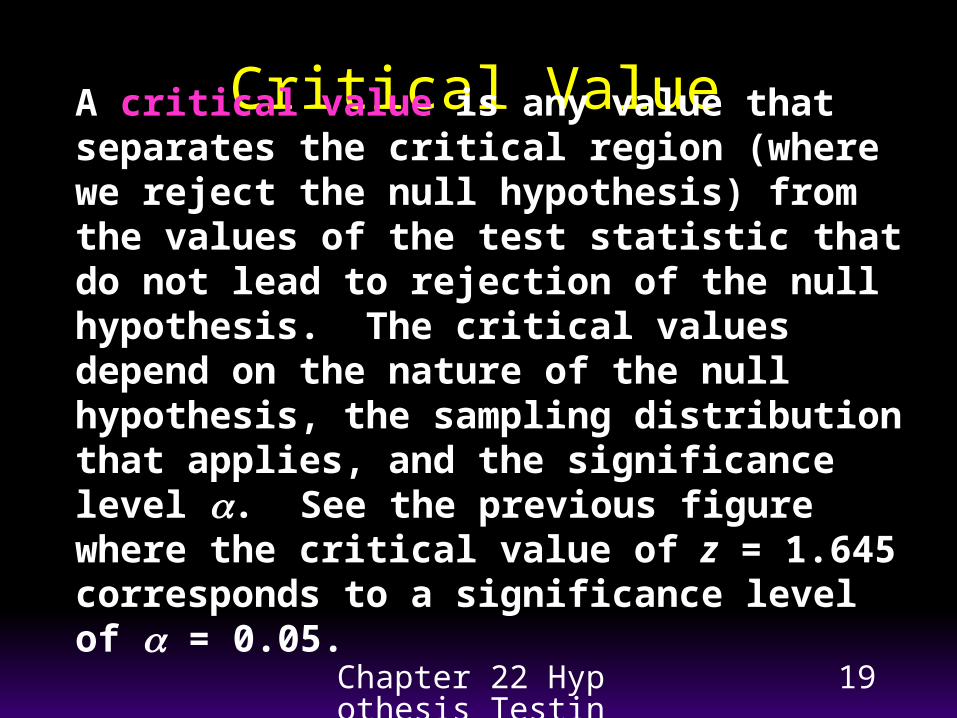
Critical ValueA critical value is any value that separates the critical region (where we reject the null hypothesis) from the values of the test statistic that do not lead to rejection of the null hypothesis. The critical values depend on the nature of the null hypothesis, the sampling distribution that applies, and the significance level . See the previous figure where the critical value of z = 1.645 corresponds to a significance level of = 0.05.

Chapter 22 Hypothesis Testing
20
Two-tailed, Right-tailed,Left-tailed Tests
The tails in a distribution are the extreme regions bounded by critical values.
Chapter 22 Hypothesis Testing
21
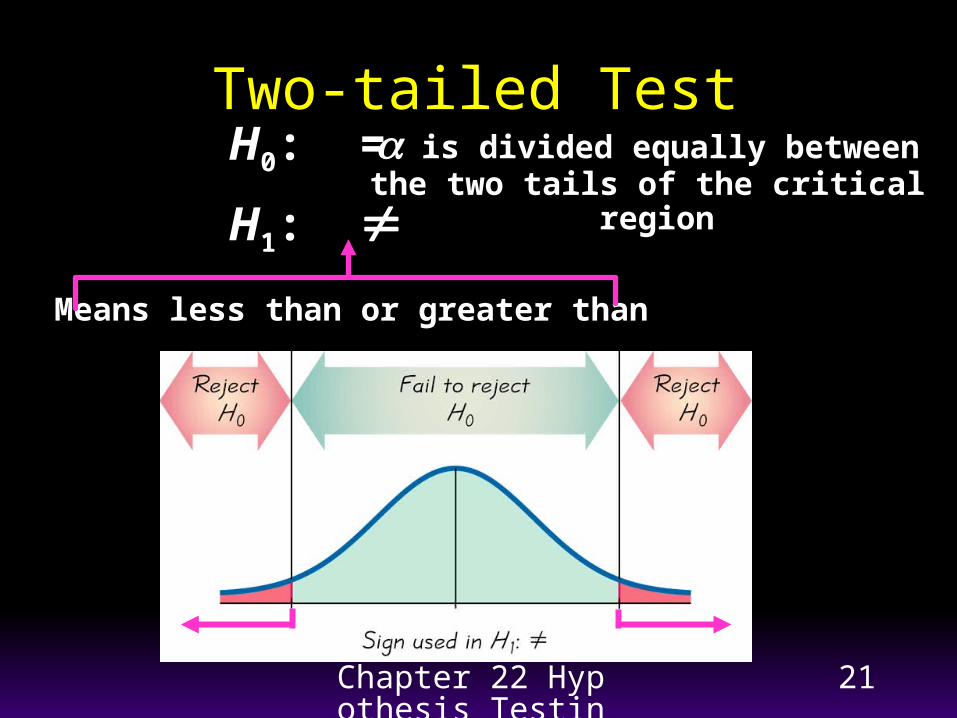
Two-tailed TestH0: =
H1:
is divided equally between the two tails of the critical
region
Means less than or greater than
Chapter 22 Hypothesis Testing
22
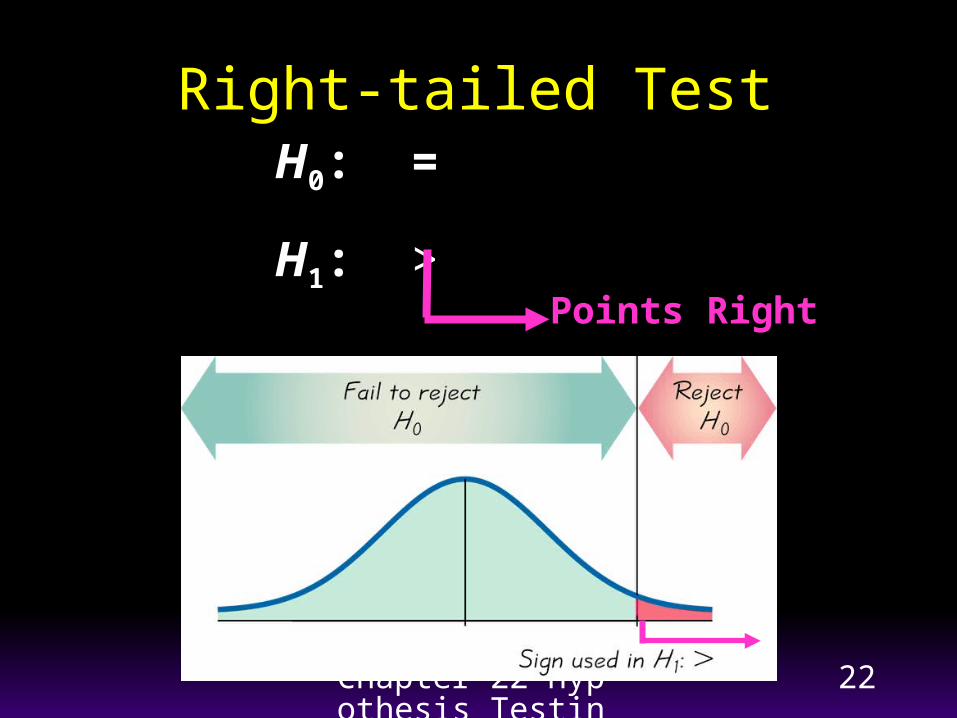
Right-tailed TestH0: =
H1: > Points Right
Chapter 22 Hypothesis Testing
23
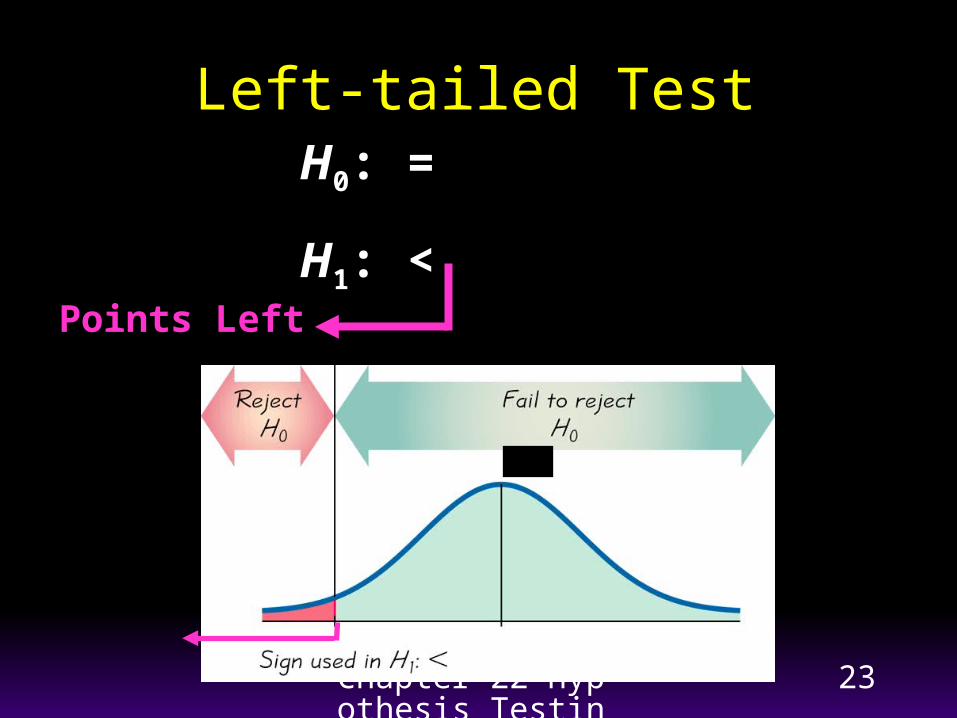
Left-tailed TestH0: =
H1: < Points Left
Chapter 22 Hypothesis Testing
24
P-Value
The P-value (or p-value or probability value) is the probability of getting a value of the test statistic that is at least as extreme as the one representing the sample data, assuming that the null hypothesis is true. The null hypothesis is rejected if the P-value is very small, such as 0.05 or less.
Chapter 22 Hypothesis Testing
25
P-valueA small P-value indicates that the observed
data (or relationship) is unlikely to have occurred if the null hypothesis were actually true
– The P-value tends to be small when there is evidence in the data against the null hypothesis
– The P-value is NOT the probability that the null hypothesis is true
Chapter 22 Hypothesis Testing
26
P-valueWhen the alternative hypothesis includes a greater
than “>” symbol, the P-value is the probability of
getting a value as large or larger than the observed
test statistic (z) value.
look up the percentile for the value of z in the standard normal table (Table B)
the P-value is 1 minus this probability
Chapter 22 Hypothesis Testing
27
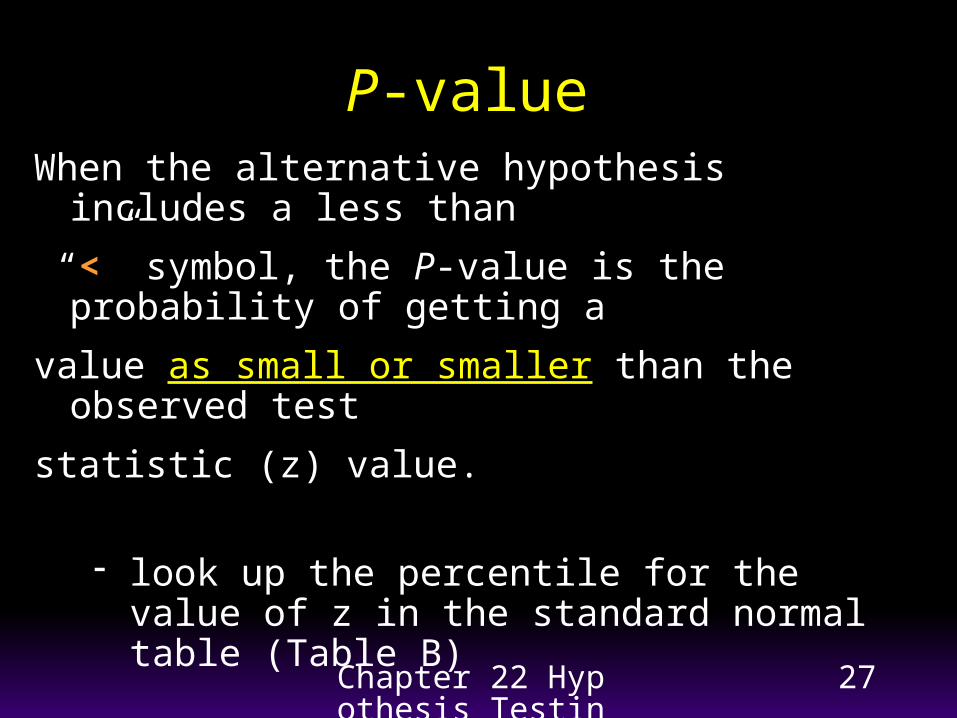
P-valueWhen the alternative hypothesis includes a less than
“<” symbol, the P-value is the probability of getting a
value as small or smaller than the observed test
statistic (z) value.
look up the percentile for the value of z in the standard normal table (Table B)
the P-value is this probability
Chapter 22 Hypothesis Testing
28
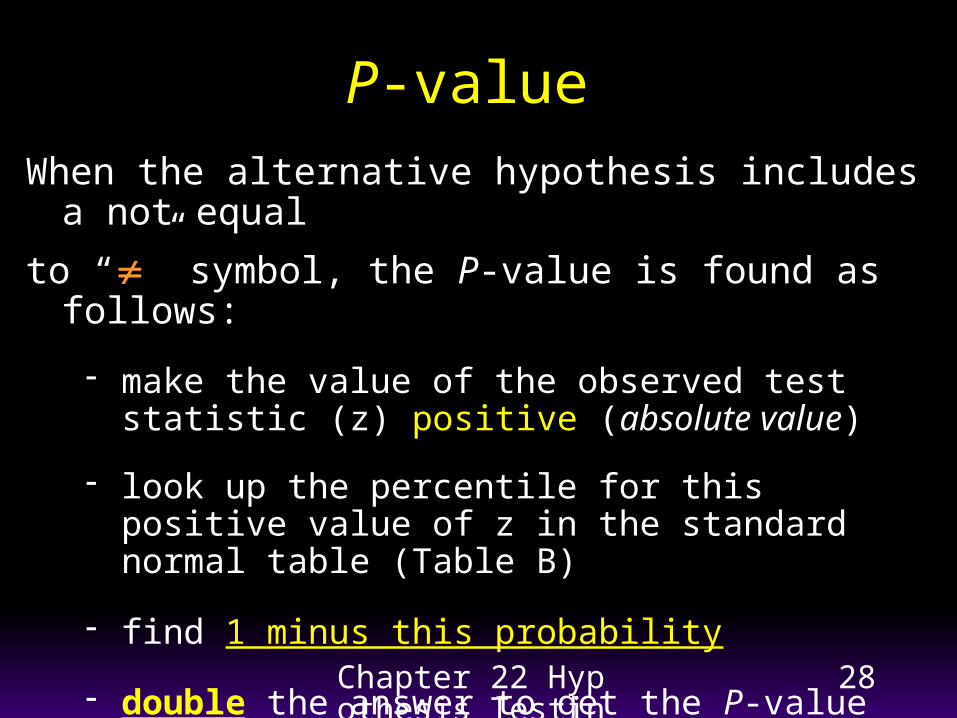
P-value
When the alternative hypothesis includes a not equal
to “” symbol, the P-value is found as follows:
make the value of the observed test statistic (z) positive (absolute value)
look up the percentile for this positive value of z in the standard normal table (Table B)
find 1 minus this probability
double the answer to get the P-value
Chapter 22 Hypothesis Testing
29
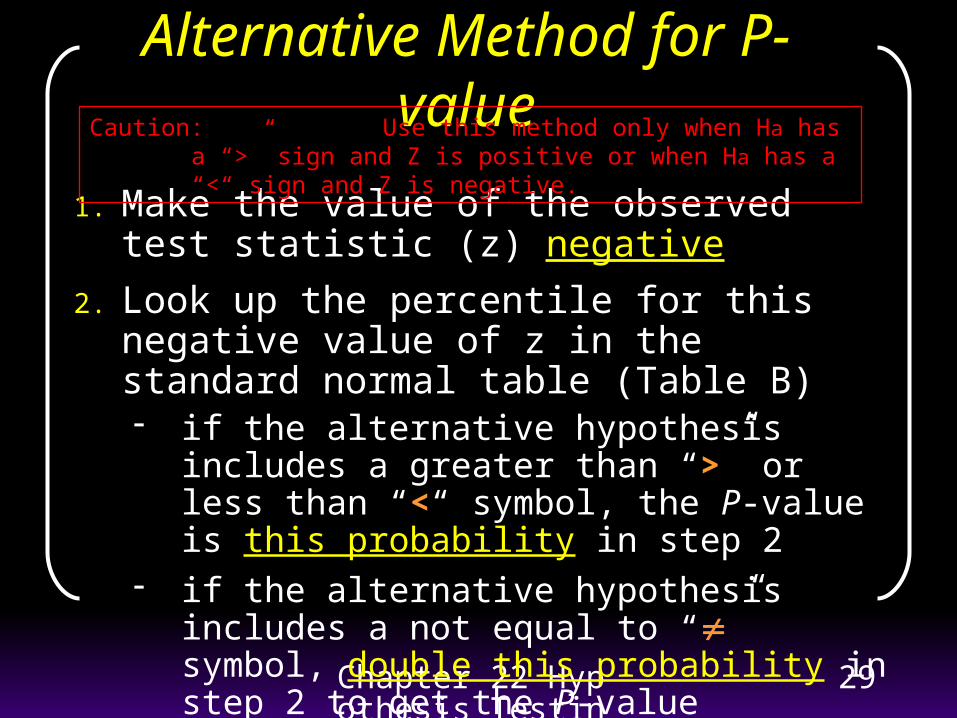
Alternative Method for P-value
1. Make the value of the observed test statistic (z) negative
2. Look up the percentile for this negative value of z in the standard normal table (Table B) if the alternative hypothesis includes a greater
than “>” or less than “<“ symbol, the P-value is this probability in step 2
if the alternative hypothesis includes a not equal to “” symbol, double this probability in step 2 to get the P-value
Caution: Use this method only when Ha has a “>” sign and Z is positive or when Ha has a “<“ sign and Z is negative.
Chapter 22 Hypothesis Testing
30
Conclusions in Hypothesis Testing
We always test the null hypothesis. The initial conclusion will always be one of the following:
1. Reject the null hypothesis.
2. Fail to reject the null hypothesis.
Chapter 22 Hypothesis Testing
31
Traditional method:
Reject H0 if the test statistic falls within the critical region.
Fail to reject H0 if the test statistic does not fall within the critical region.
Decision Criterion
Chapter 22 Hypothesis Testing
32
* Decision * If we think the P-value is too low to believe
the observed test statistic is obtained by chance only, then we would reject chance (reject the null hypothesis) and conclude that a statistically significant relationship exists (the data supports the alternative hypothesis).
Otherwise, we fail to reject chance anddo not reject the null hypothesis of no relationship (result not statistically significant).
Chapter 22 Hypothesis Testing
33
Typical Cut-off for the P-value
Commonly, P-values less than 0.05 are considered to be small enough to reject chance (reject the null hypothesis).
Some researchers use 0.10 or 0.01 as the cut-off instead of 0.05.
This “cut-off” value is typically referred to as the significance level of the test.
Chapter 22 Hypothesis Testing
34
Errors in Hypothesis TestingErrors in Hypothesis Testing
There are two kinds of errors that can be made in testing a hypothesis.
A type I error consists of rejecting the null hypothesis when it is true.
The probability of making a type I error is denoted by (the significance level).
A type II error involves not rejecting the null hypothesis when it is false. The probability of making a type II error is denoted by .
To decrease both and , , increase the sample size.
Chapter 22 Hypothesis Testing
35
Thought Question 1
The defendant in a court case is either guilty or innocent. Which of these is assumed to be true when the case begins? The jury looks at the evidence presented and makes a decision about which of these two options appears more plausible. Depending on this decision, what are the two types of errors that could be made by the jury? Which is more serious?
Chapter 22 Hypothesis Testing
36
Power of a Test This is the probability that the sample
we collect will lead us to reject the null hypothesis when the alternative hypothesis is true.
The power is larger for larger departures of the alternative hypothesis from the null hypothesis (magnitude of difference).
The power may be increased by increasing the sample size.
Chapter 22 Hypothesis Testing
37
The Five Steps of Hypothesis Testing
Determining the Two Hypotheses Determining the Sampling Distribution
of the Test Statistic Collecting and Summarizing the Data
(calculating the observed test statistic value) Determining How Unlikely the Test
Statistic is if the Null Hypothesis is True (calculating the P-value)
Making a Decision/Conclusion(based on the P-value, is the result statistically significant?)
Chapter 22 Hypothesis Testing
38
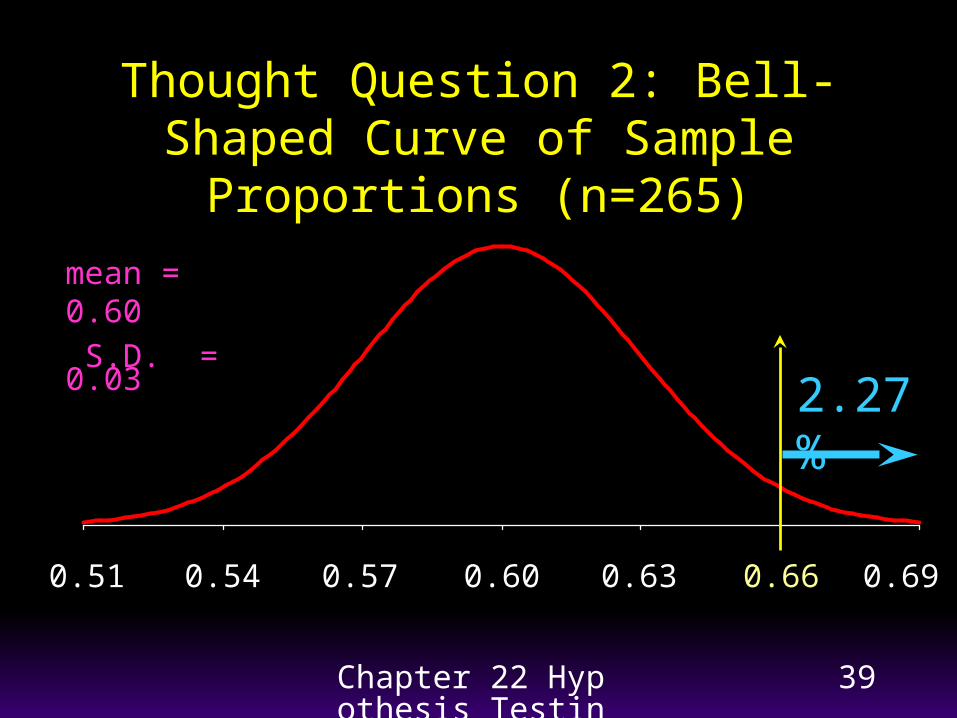
Thought Question 2
Suppose 60% (0.60) of the population are in favor of new tax legislation. A random sample of 265 people results in 175, or 0.66, who are in favor. From the Rule for Sample Proportions, we know the potential sample proportions in this situation follow an approximately normal distribution, with a mean of 0.60 and a standard deviation of 0.03. Find the standardized score for the observed value of 0.66; then find the probability of observing a standardized score at least that large or larger.
Chapter 22 Hypothesis Testing
39
Thought Question 2: Bell-Shaped Curve of Sample Proportions (n=265)
0.60 0.630.57 0.660.54 0.690.51
2.27%
mean = 0.60
S.D. = 0.032.0
0.030.600.66z
Chapter 22 Hypothesis Testing
40
Thought Question 3
Suppose that in the previous question we do not know for sure that the proportion of the population who favor the new tax legislation is 60%. Instead, this is just the claim of a politician. From the data collected, we have discovered that if the claim is true, then the sample proportion observed falls at about the 98th percentile of possible sample proportions for that sample size.
Should we believe the claim and conclude that we just observed strange data, or should we reject the claim?
What if the result fell at the 85th percentile?
At the 99.99th percentile?
Chapter 22 Hypothesis Testing
41
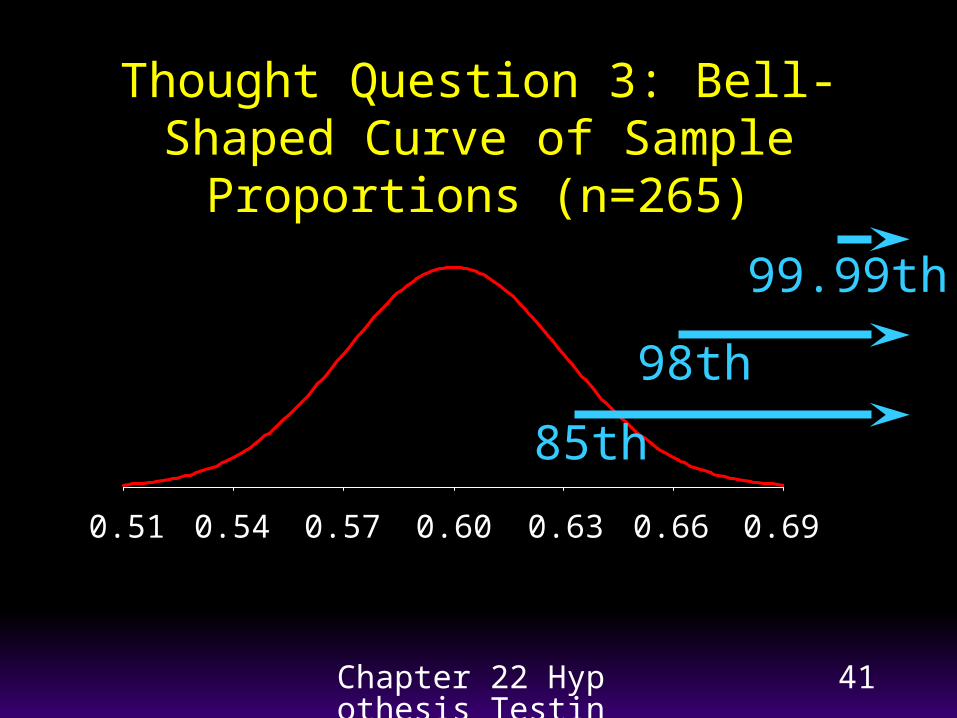
Thought Question 3: Bell-Shaped Curve of Sample Proportions (n=265)
0.60 0.63 0.66 0.690.54 0.570.51
85th
98th
99.99th
Chapter 22 Hypothesis Testing
42
Case Study
Brown, C. S., (1994) “To spank or not to spank.” USA Weekend, April 22-24, pp. 4-7.
Parental Discipline
What are parents’ attitudes and practices on discipline?
Chapter 22 Hypothesis Testing
43
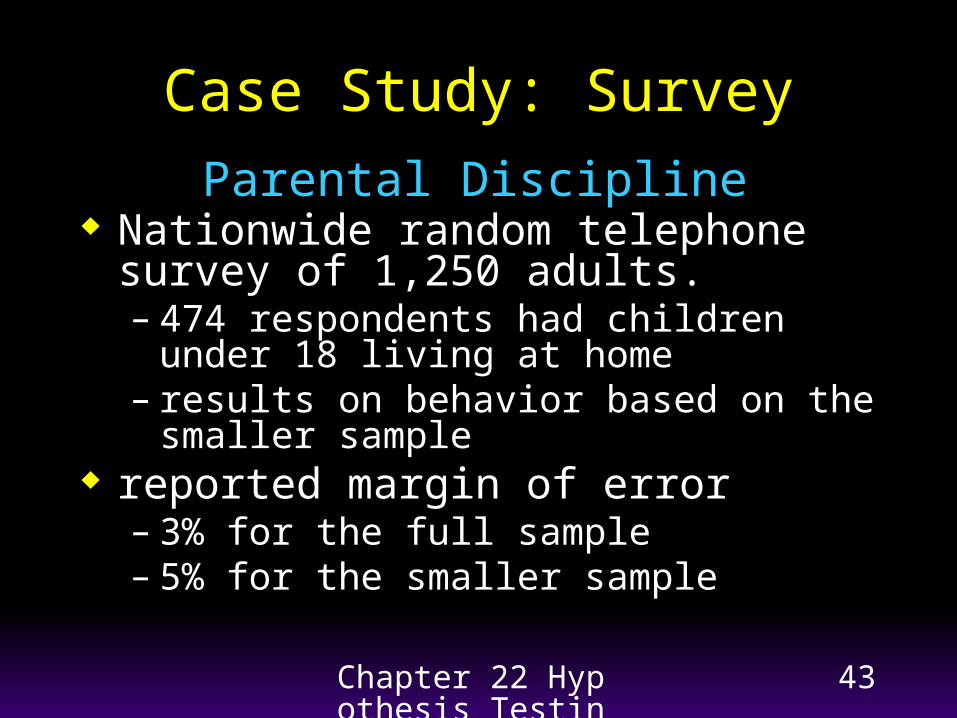
Case Study: Survey
Parental Discipline Nationwide random telephone survey of
1,250 adults.– 474 respondents had children under 18
living at home– results on behavior based on the smaller
sample reported margin of error
– 3% for the full sample– 5% for the smaller sample
Chapter 22 Hypothesis Testing
44
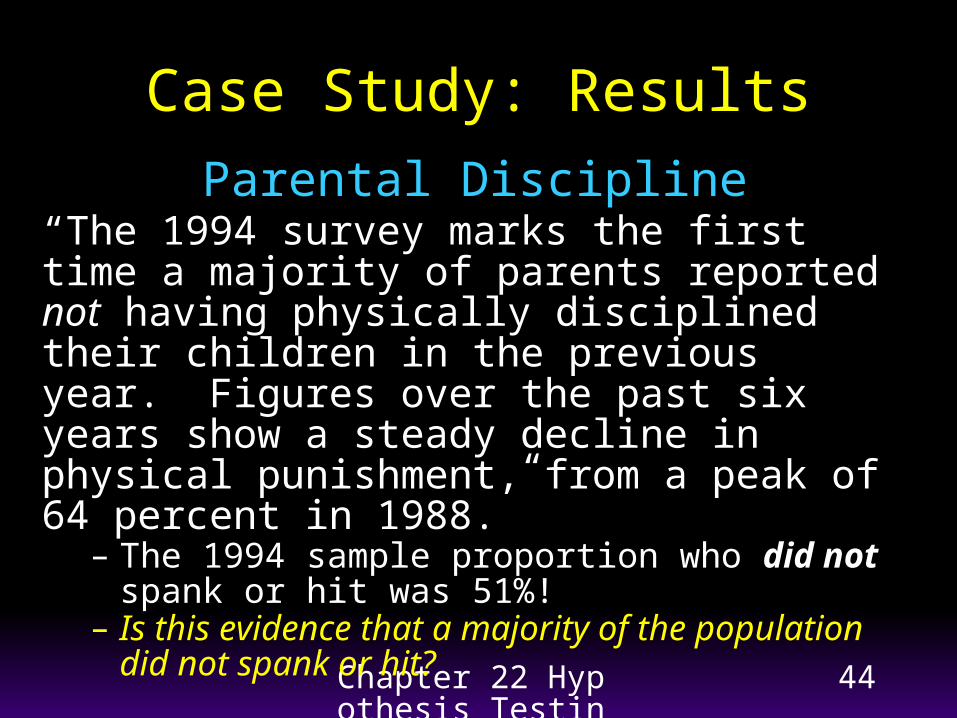
Case Study: Results
Parental Discipline“The 1994 survey marks the first time a majority of parents reported not having physically disciplined their children in the previous year. Figures over the past six years show a steady decline in physical punishment, from a peak of 64 percent in 1988.”
– The 1994 sample proportion who did not spank or hit was 51%!
– Is this evidence that a majority of the population did not spank or hit?
Chapter 22 Hypothesis Testing
45
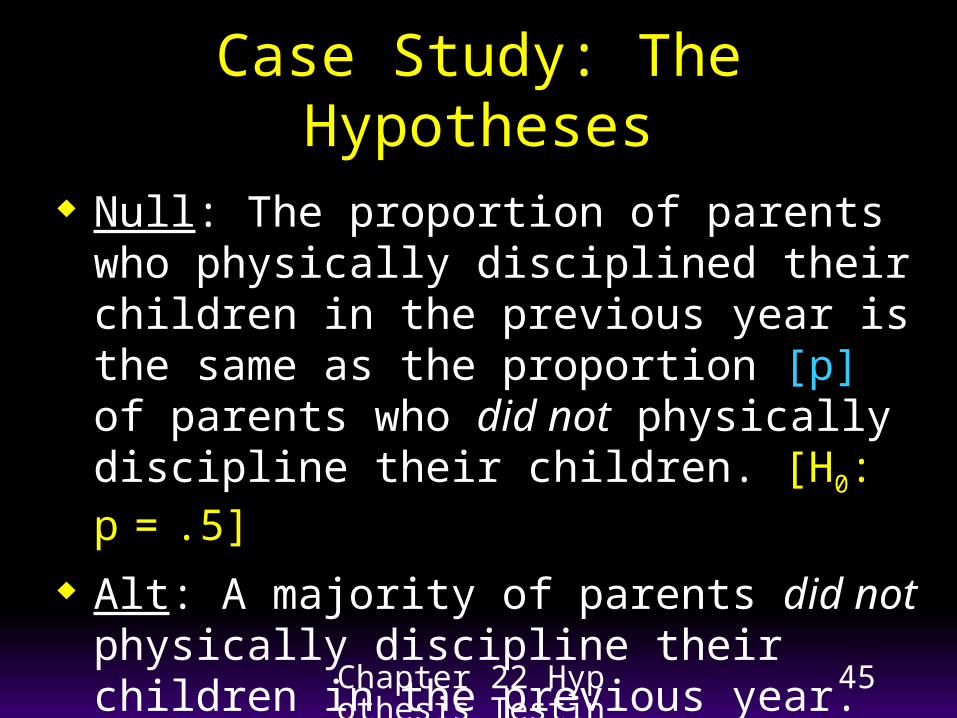
Case Study: The Hypotheses
Null: The proportion of parents who physically disciplined their children in the previous year is the same as the proportion [p] of parents who did not physically discipline their children. [H0: p = .5]
Alt: A majority of parents did not physically discipline their children in the previous year. [Ha: p > .5]
Chapter 22 Hypothesis Testing
46
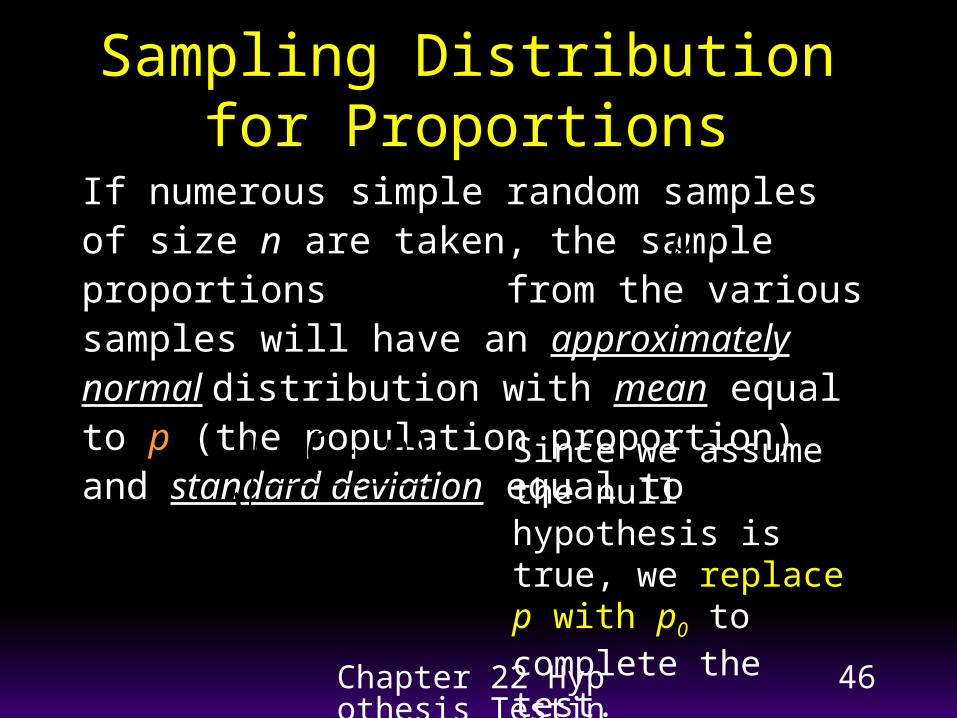
If numerous simple random samples of size n are taken, the sample proportions from the various samples will have an approximately normal distribution with mean equal to p (the population proportion) and standard deviation equal to
n
pp )1(
)ˆ( p
Sampling Distribution for Proportions
Since we assume the null hypothesis is true, we replace p with p0 to complete the test.
Chapter 22 Hypothesis Testing
47
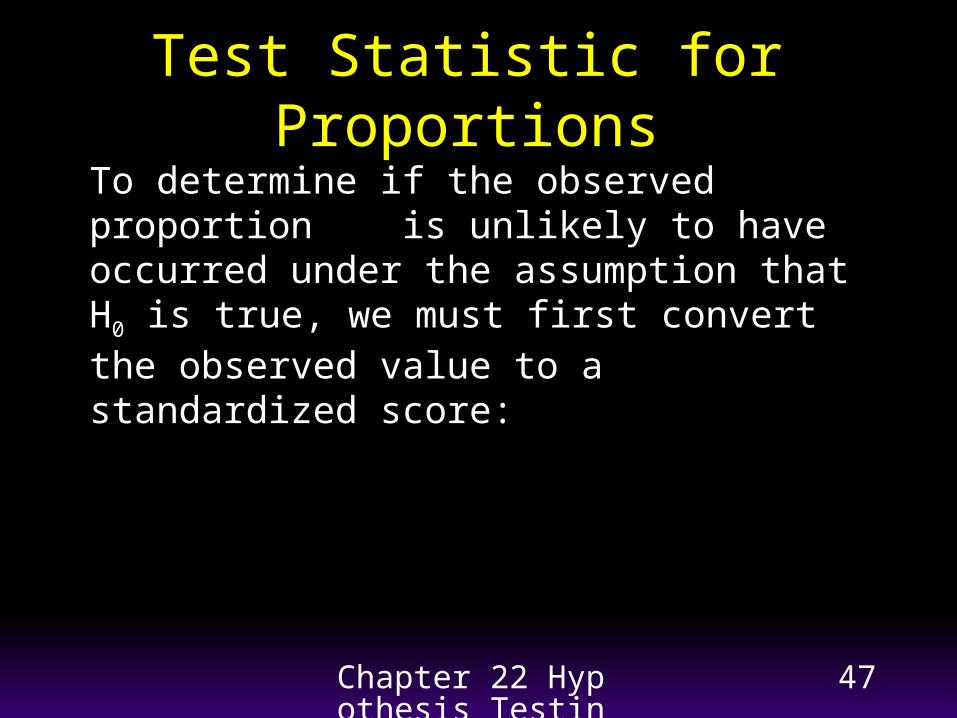
Test Statistic for Proportions
zp p
p pn
( )
0
0 01
To determine if the observed proportion is unlikely to have occurred under the assumption that H0 is true, we must first convert the observed value to a standardized score:
p̂
Chapter 22 Hypothesis Testing
48
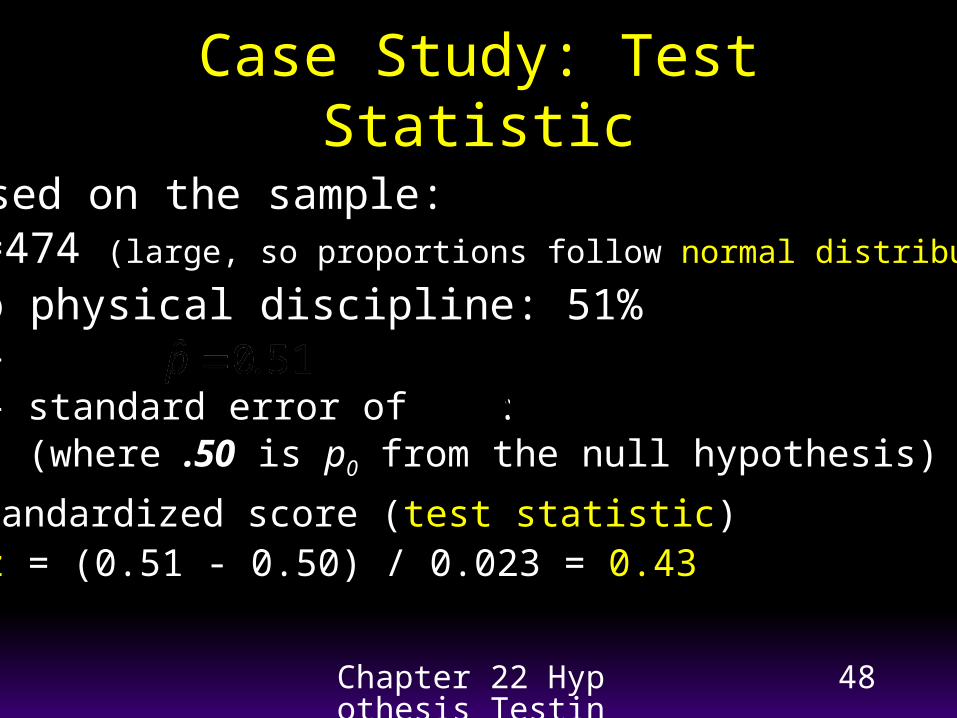
Case Study: Test Statistic
Based on the sample: n=474 (large, so proportions follow normal distribution)
no physical discipline: 51%– – standard error of : (where .50 is p0 from the null hypothesis)
standardized score (test statistic)z = (0.51 - 0.50) / 0.023 = 0.43
0230474)501(50 ...
p̂
Chapter 22 Hypothesis Testing
49
0.51
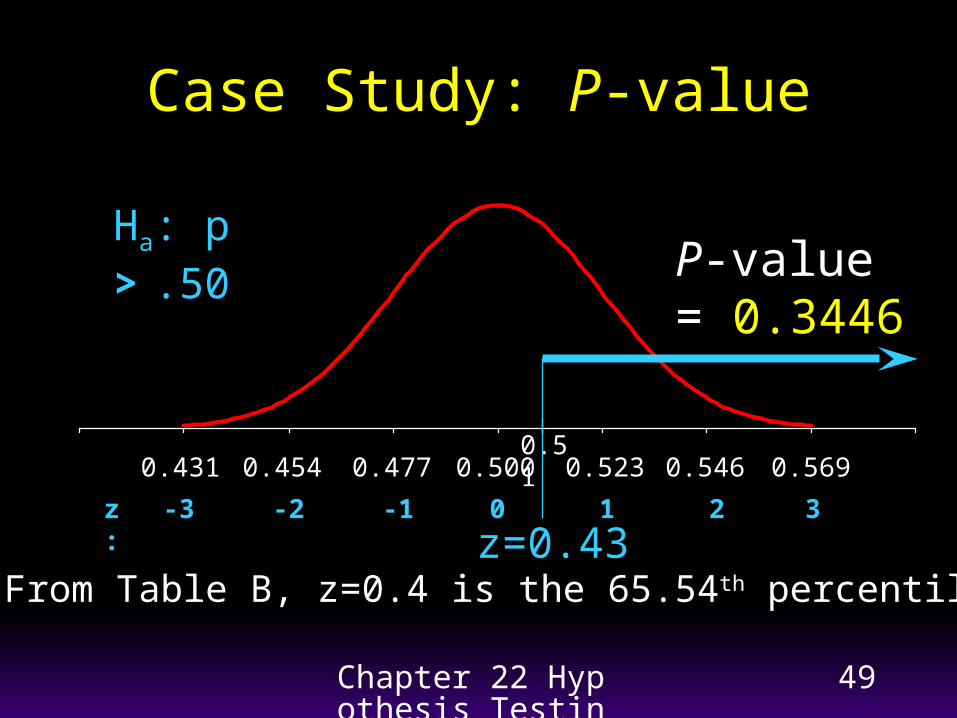
Case Study: P-value
P-value= 0.3446
From Table B, z=0.4 is the 65.54th percentile.z=0.43
0.500 0.5230.477 0.5460.454 0.5690.431:p̂
0 1-1 2-2 3-3z:
Ha: p > .50
Chapter 22 Hypothesis Testing
50
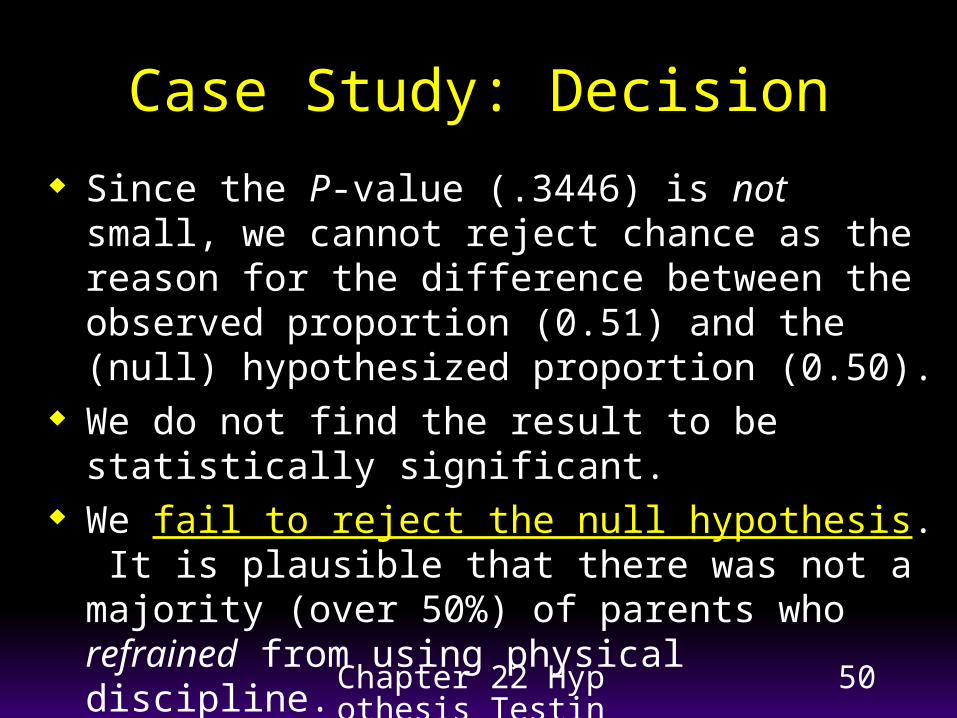
Case Study: Decision
Since the P-value (.3446) is not small, we cannot reject chance as the reason for the difference between the observed proportion (0.51) and the (null) hypothesized proportion (0.50).
We do not find the result to be statistically significant.
We fail to reject the null hypothesis. It is plausible that there was not a majority (over 50%) of parents who refrained from using physical discipline.
Chapter 22 Hypothesis Testing
51
Case Study: Decision Error?
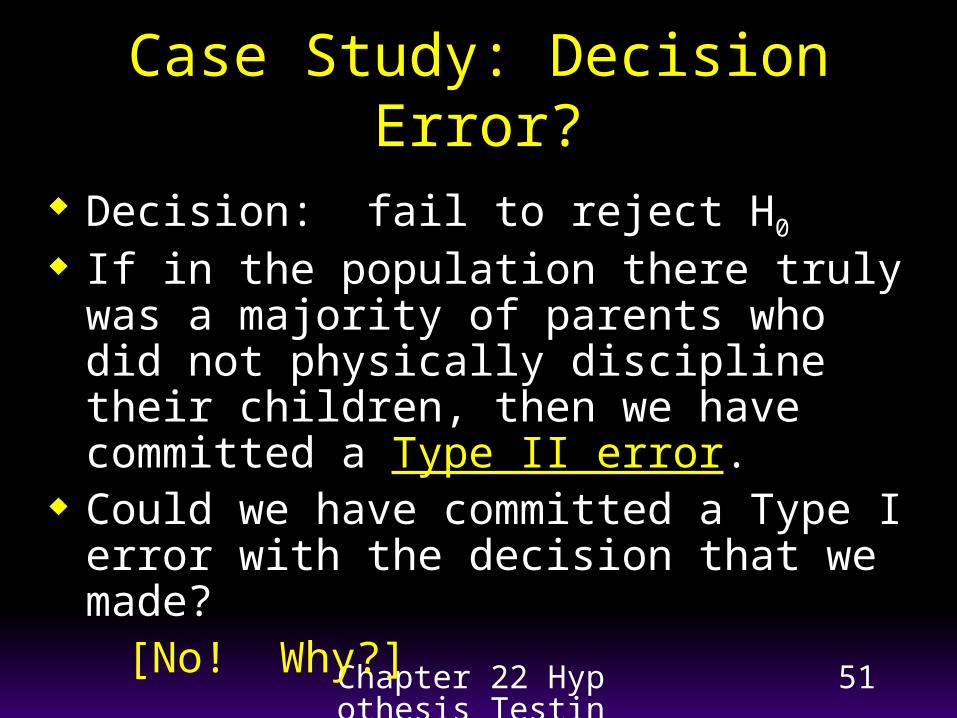
Decision: fail to reject H0
If in the population there truly was a majority of parents who did not physically discipline their children, then we have committed a Type II error.
Could we have committed a Type I error with the decision that we made?
[No! Why?]
Chapter 22 Hypothesis Testing
52
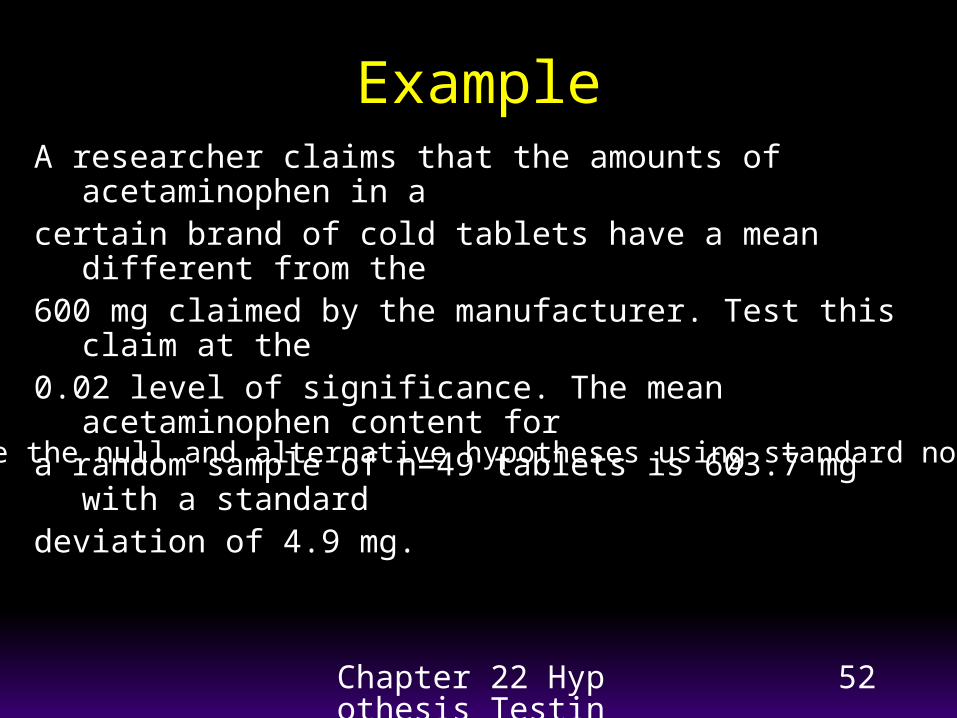
ExampleA researcher claims that the amounts of acetaminophen in acertain brand of cold tablets have a mean different from the 600 mg claimed by the manufacturer. Test this claim at the 0.02 level of significance. The mean acetaminophen content fora random sample of n=49 tablets is 603.7 mg with a standard deviation of 4.9 mg.
a) State the null and alternative hypotheses using standard notation.
Chapter 22 Hypothesis Testing
53
Example Cont.b) State the test statistic and give its distribution.
c) Calculate the test statistic value.

Chapter 22 Hypothesis Testing
54
Example Cont.d) Find the p-value for the test.
e) Would you reject the null hypothesis or not? Explain.

Chapter 22 Hypothesis Testing
55
Example Cont.f) Write your conclusion using non-technical terms.
g) Which type of error (type I or type II) could you have made based on your decision in (e)?
Chapter 22 Hypothesis Testing
56
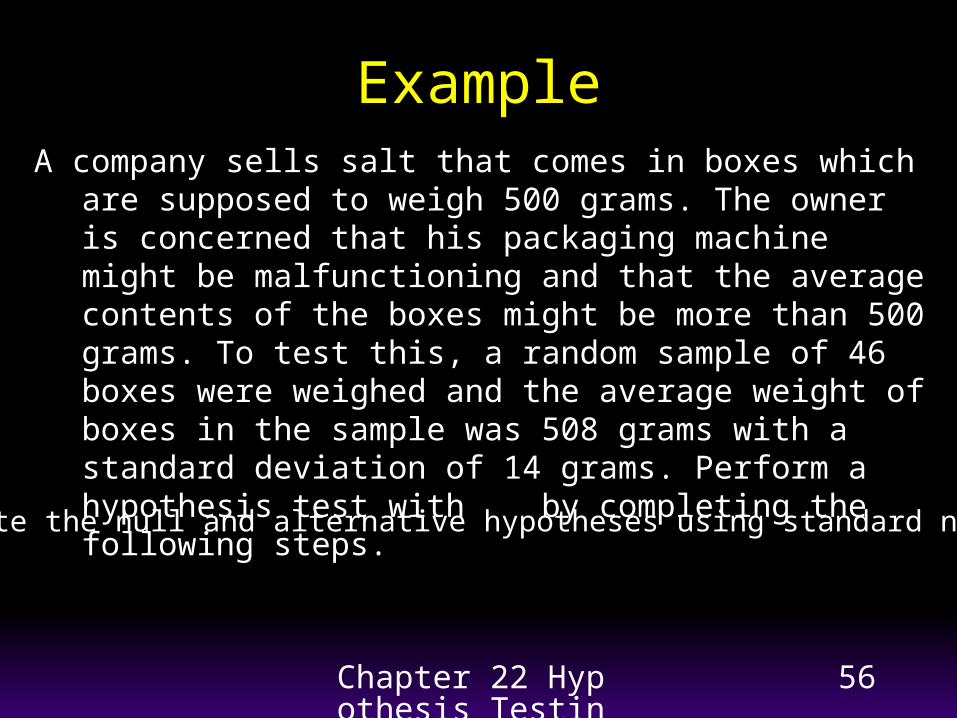
ExampleA company sells salt that comes in boxes which are supposed
to weigh 500 grams. The owner is concerned that his packaging machine might be malfunctioning and that the average contents of the boxes might be more than 500 grams. To test this, a random sample of 46 boxes were weighed and the average weight of boxes in the sample was 508 grams with a standard deviation of 14 grams. Perform a hypothesis test with by completing the following steps.
a) State the null and alternative hypotheses using standard notation.

Chapter 22 Hypothesis Testing
57
Example Cont.b) State the test statistic and give its distribution.
c) Calculate the test statistic value.
Chapter 22 Hypothesis Testing
58
Example Cont.d) Find the p-value for the test.
e) Would you reject the null hypothesis or not? Explain.
Chapter 22 Hypothesis Testing
59
Example Cont.f) Write your conclusion using non-technical terms.
g) Which type of error (type I or type II) could you have made based on your decision in (e)?
Chapter 22 Hypothesis Testing
60
Key Concepts
Decisions are often made on the basis of incomplete information.
Five Steps of Hypothesis Testing P-values and Statistical Significance Decision Errors Power of a Test