chapter 2bear.warrington.ufl.edu/kraft/mli26c653/docs/chapter2.pdf · chapter 2 external analysis ....
TRANSCRIPT

Chapter 2
External Analysis
STRATEGIC MANAGEMENT
Lecture 2
Dr. John Kraft
CopyrighlO HCllIghlnn MiIIlil'l Company.Al! righb ~IVDd.
Opening Case
·:·Boom and Bust in Telecommunications
~orf}eS ~ec~{\o JDS Unlphase
\)lCe{\'<-
Nortel Networks Cisco SYstems
AT&T ,po, ~ c.~o~
Level 3 Communications 0°'0"
CopyrightC Houghton Mimi" Company.AlI tlghtsrosorvcd.
Porter's Five Forces Model
::~i~f~:i'~~~~ : bYpotnnti~I.:: ·CC!mpetlt.o~.::
'~" .... '
Source: Adllpted and n:prinled by pennission or HarvarriBusllIC$SRn'ielt. From "How Competitive ForteS Sbnpe SlrUtegy." by Miehncl E. PortCf.Han'f1rdBus/nt:nRrn~ MIUl:hlApnl19790 by the
3 1
3 3
Opening Case
·:·U.S. Steel Industry
CopyrighlC Houghton Mlmln CompDl'IY.AlI righb~MKI.
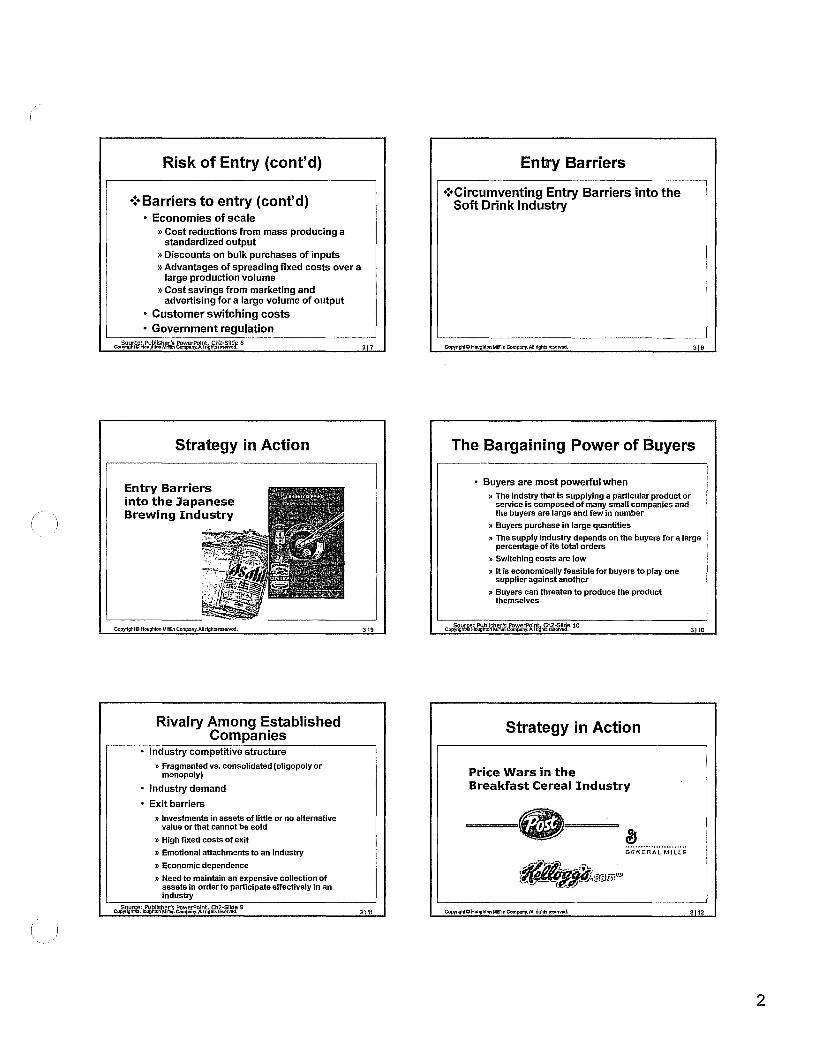
Abell's Framework-Defining the Business
" Whlllisboing )' !;lJlhri'lnd1
CUli10nllunoods .
How ", '\"""~'-customornood, bllingsatlcfiod7
~/
Dirn!nc1\vo J" compalenclas I
--_ .... ,,...-/'
3 2
Source: D, F. Abell, Definl"g theBu.rim:.u:l1u! SfrJrl/lIgPalnt oJStmttglc '--------'PIamJnri'n ....... .Q; ... "''''''ti<><>HoI .... 'sor,''''''-------'
CopyrighlC Houghton MllIlln Company.A1t ItghtsmolVOd. 3 4
Risk of Entry by Potential Competitors
.:. Barriers to entry • Brand loyalty • Absolute cost advantage
» Superior production operations and processes
» Control of particular inputs required for production
» Access to cheaper funds because existing companies represent lower risks than new entrants
co~~Wkfu~Im~'1.r~~ gg~pi~,~~g~~,!}sr 7 316
1
(
Risk of Entry (cont'd)
·:·Sarriers to entry (cont'd) • Economies of scale
» Cost reductions from mass producing a standardized output
» Discounts on bulk purchases of inputs » Advantages of spreading fixed costs over a
large production volume » Cost savings from marketing and
advertising for a large volume of output
• Customer switching costs • Government regulation
Co~lih'ilSfI~~~'1.frf?n~~~~g~hf~~ 8
Strategy in Action
Entry Barriers into the Japanese Brewing Industry
CopyrightC Houghton Mimln Company.AlI rlghbro:lOlVIId,
Rivalry Among Established Companies
· Industry competitive structure » Fragmented vs. consolidated (oligopoly or
monopoly)
· Industry demand
· Exit barriers
» Investments in assets of little or no alternative value or that cannot be sold
» High fixed costs of exit
» Emotional attachments to an industry
» Economic dependence
» Need to maintain an expensive collection of assets in order to participate effectively in an industry
Co~ik'l\'iIo':.~lmm.I'J.:~ ~~,,'lr&~,ir,ib~,~.tJ:!i; 9
3 7
39
3 11
Entry Barriers
+:+Circumventing Entry Barriers into the Soft Drink Industry
Copyr\9hIC HaughtonMi!Illn CompMt)'.All righb nI$OlVIId. 3 •
The Bargaining Power of Buyers
. Buyers are most powerful when » The indstry that is supplying a particular product or
service is composed of many small companies and the buyers are large and few in number
» Buyers purchase in large quantities
» The supply industry depends on the buyers for a large percentage of its total orders
» Switching costs are low
» It is economically feasible for buyers to play one supplier against another
» Buyers can threaten to produce the product themselves
Co~~r~'ii,e.'l\'.lW~iMi~&\'..~~rJ;"\;~~ 10 3 10
Strategy in Action
Price Wars in the Breakfast Cereal Industry
(8 aJ .... ~ ................... GENERAL MILLS ".jf'-; ~ '::-; r;'1~ '."'''' __ ~ ~'~'l;J,,,
""--"
CopyrightC Houghton Mimln Company.AIl rlghb ro:IOrvod. 3112
2

The Bargaining Power of Suppliers Running Case
·:·Suppliers are most powerful when • There are few substitute products
·:·Wal-mart's Bargaining Power over Suppliers.
• The industry is not an important customer to the supplier
• Switching costs are high for companies switching to a different supplier
• Suppliers can threaten to compete directly with buyers by entering their industry
• Buyers cannot threaten to enter the suppliers' industry
Co~hf8l.!~o'h\!;"n'\j~rn~~~Ml~~f~~. 11 3 13 CopyrillhtC HOUllhlnn MlfIlln Compjlny.AlI rights rosorvod. 3 14
Substitute Products A Sixth Force: Complementors
·:·Many substitute products ·:·When complementors are important and • Are a threat and limit the price that their number is increasing
companies in one industry can charge for their product, and thus industry profitability
• Demand and profits in the industry are boosted
·:·Few or weak close substitutes ·:·When complementors are weak • Gives the industry the opportunity to raise
prices and earn additional profits • Industry growth can slow and profits can be
limited
Co,J,\1,~fJlU!,i&liiIMir.:'b".l1~':'ill'~if,b~~e 12 3 15 Co~mi.ioe~4WUnfuff&g,~/;f.~m6h~~~~~ 13 3 16
Course Pack Stages in the Industry Life Cycle
·:·Alpha Chip
Copyrlgh\C HoughlnnMlIIlln ComPllny.AlI rillhlsJllS(lrvod. 3 17 CopyrillhtC Houghton MHmn ComPllnY. All rltthts /lI!l(Irvod, 3 1.
(
3

(
Shakeout: Growth in Demand and Capacity
CopyrightO HoughtonMimin Company.AIl rlght:uC$Orwd. 3 '9
Strategic Groups (continued)
· Formed within an industry when some companies follow the same basic product positioning strategy, which is different from that of other companies in other groups
· Companies can position their products in terms of distribution channels, market segments, product quality, technological leadership, customer service, pricing policy, advertising policy, promotions
::>ource; u~lIsner S t'Owe 'YOl.n I _V1"~::>IIU~ .10 CopyrightCl Houghton MlI!lin Comp:iny.AlI right:! RI"',.c"v~.
The Role of the Macroenvironment
Changes in the forces in the macro~ environment can directly Impact: • The Five Forces • . Relative Strengths • Industry
Attractiveness
CopyrightC Houghton Mimin ComPllfl)'.A/1 tighl$flItI(Irvod,
312'
323
Strategic Groups Within Industries
Strategic Groups are groups of companies that follow a business model similar to other companies within their strategic group - but are different from that of other companies in other strategic groups. The basic differences between business models in different strategiC groups can be captured by a relatively small number of strategic factors .
• :. Implications of Strategic Groups-1. The closest competitors are within the same Strategic Group
and may be viewed by customers as substitutes for each other. 2. Each Strategic Group can have different competitive forces
and may face a different set of opportunities and threats • • :. Mobility Barriers - factors within an Industry that inhibit the
movement of companies between strategic groups . Include barriers to enter another group or exit existing group
CopyrightCl Houghton Mlmln Company.AlI rlght:s n:!$Orvod. 3120
The Role of Mobility Barriers
·:·A company may decide to move from one strategic group to another where the five forces are weaker and higher profits are possible
·:·Mobility barriers are similar to industry entry and exit barriers and must be weighed carefully
~ih~S'Ai.f,~g)jll'.nr.:~,l'jiir~III.'k.~~e 17 3122
Closing Case
·:·U.S. Beer Industry
CopyrightCHouglrtonMlmln ComPllny.Allrlghl$f~. 3124
4

Closing Case Film
·:·How the Internet Revolutionized the Stockbrokerage Industry
CopyrighlO Houghton MlllUn Company. All rlghhl roscrvod. 3 25 CopyrighlO Houghton M!I!IIn Company.Alt rlghb rC$OMld, 3 26
Real World: Course Pack Items
·:·"FedEx to Buy Kinko's for $2.2 Billion" ·:·China's Bicycle Makers Shift to Exports
(
CopyrightO HoughtonMllllln Compu.ny.AlI rlghls rMOrvod. 37:1 CopyrighlO HoughlonMiIIIln Company. All rlghb IMOrvod. 326
Course Pack Items End of Lecture 2
·:·The Importance of Sex
UFIFLOiUDA ~.,rn",m,...,
CopyrIghtCl Houghlon Mlft'I!n Company.AIl rlghb 1'O$OI'YDd, 329 Cc:IpyrighlC Houghlon Mll!lln Company.AlI rlghb rnorvod. 3J~30
5
: '. . . .>,',:
commodity-type input could easily switch demand from company to company, and they used this leverage to further bargain down prices. To make matters worse, established steelmakers were typically unionized. A combination of high wage rates and inflexible work rules raised labor costs, making it even more difficult to make a profit in this brutally competitive industry. Strong unions, together with the costs of closing a plant, were also impediments to reducing excess capacity in the industry. . .
It is not surprising, then, that the steel industry as a whole rarely made money. Many of the old integrated steelmaking companies ultimately went bankrupt, including Bethlehem Steel and Wheeling Pittsburgh. Then, in the early 2000s, things started to change. There was a surge in. demand for steel from the rapidly developing economies of China, India, Russia, and Brazil. • By 2004, China alone was consuming almost one-third of all steel produced worldwide, and demand there was growing by more than 20% per year. Moreover, two decades of bankruptcies and consolidation had finally removed much of the excess capacity from the industry, not just in the United States but also worldwide. In the United States, the producers that
survived the decades of restructuring were efficient . enterprises with productive workforces and new technology. Finally competitive, for
.. the first time they were able to hold their own against foreign imports. What helped was a decline in the value of the United States dollar afte~ 2001 that made steel imports relatively more ·expensive and helped to create demand for steel exports from the United States. .
As a result of this, competitive environment prices and profits surged. Hot rolled steel plate,
. for example, was priced at $260 per ton inJlUle 2003. By June 2008, it had increased to $1,225 per ton. In 2003, U.S. Steel, the country's largest steel producer, lost $406 million. In 2008, it made $2 billion in net profit. Nucor Steel, long regarded as the most efficient steelmaker in the. country, saw its profits increase from $63 mil-. lion to $1.8 billion over the same period. How sustainable is this profit turnaround giveri the global economic slowdown that occurred in 2008? It is difficult to know for sure, but with governments around the world increasing state spending on infrastructure to try and jump-start their troubled economies, demand for steel may remain relatively strong, even in the face of a deep economic pullback.1
Opening Case
Boom and Bust in Telecommunications In the mid-1990s, the telecommunications services industry was beset by three significant changes. The first of these was the arrival of the World \'Vide Web as a prime-time phenomenon. As the volume of Web traffic grew at an exponential pace, so too did demand for the capacity to transmit the digital data on which the Web was based. In 1996, in an effort to foster greater competition among telecommunications service providers, the U.S. government deregulated the U.S. telecommunication service industry. Local and long-distance phone companies and cable TV companies were allowed to enter each other's markets. In addition, deregulation ma~e it much easier for new entrants to get into the telecommunications service business. Similar moves to deregulate telecommunications services took place in other countries. Finally, wireless services made inroads in many developed nations, with market penetration rates for wireless phones reaching as high as 70 percent in Finland and 30 percent in the United States, where
PART I Introduction to Strategic Management
demand was growing rapidly. By decade's end, the wireless industry was beginning to embrace the Web, 'INith 'wireless companies planning to 'offer their customers Internet access through wireless phones.
Many analysts believed that demand for telecommunications services would expand exponentially for years to come. In the near future, some argued, vast amounts of data will flow around the world through fiber-optic cable as ever more companies, individuals, and organizations connect to the Internet by high-speed wire line and wireless networks, and as they used the Internet for a vast array of high-bandwidth services, including videoconferencing and the transmitting of music files. The possibilities seemed limitless. A host of companies were established to compete with incumbent telecommunications service providers and to exploit the expected bandwidth boom. They included PSINet, 360 Networks, Covad Communications, Global Crossing, Level 3 Communications, ICG Communications, RCN Corporation, XO Communications, and \VinStar.
Driven by a desire to share in the coming boom for telecommunications services, these new entrants raised billions of dollars in equity and some $650 billion in debt from the capital markets. They used the funds to build out fiber-optic networks within cities, between cities, and between countries. They invested in optical technology that increased by a hundred-fold the amount of data that could be sent down a single strand of glass fiber. And they built out wireless networks. Telecom sm'ice prm'iders in the United States alone boosted their capital spending by 25 percent each year from ) 996 to 2000, when they invested S) 24 billion. Worldwide, a staggering S).2 trillion was spent on telecommunications equipment in 2000.
Producers of telecommunications equipment such as switches, routers, fiber-optic cables, and optical gear were beneficiaries of this hoom. Lucent, Cisco, Nortel Networks, JDS Uniphase, Corning, and other companies saw their sales and profits surge. Cisco, founded only in the mid-1980s, made an after-tax profit of $2.7 billion in 2000 on sales of S19 billion. To grab even more sales, these equipment companies started making loans to the telecom service start-ups to help them buy the equipment. It seemed like a sure thing, a perfect bet on a glittering future. But the glittering future didn't arrive as expected.
By 2000, it became clear that although the volume of data traffic was doubling every year, the capacity to transmit data along fiber-optic networks was increasing much faster than that as dozens of service providers rushed to grab a share of the projected boom in demand. The result was huge excess capacity and plummeting prices for data transmission services using fiber-optic networks. By 2001, it was estimated that there was ten times more fiber-
optic capacity than needed. Suddenly the telecommunications service providers were in trouble, particularly the new ones that had borrowed heavily to finance their growth. They could not generate enough revenues to cover the interest payments on their debt. As 2000 turned into 2001, many started to go bankrupt. PSINet, 360 Networks, Covad Communications, ICG Communications, and WinStar are among the many that filed for bankruptcy protection. By early 2002, others such as Level 3 and Global Crossing were teetering on the brink. In the space of a year, shares in Level 3 fell from $132 a share to under $3. Global Crossing saw its shares fall from a high of $64 a share in 1999 to $0.50 by the end of 2001. And in 2002, it too went bankrupt.
As telecommunications service providers started to go bankrupt, demand for telecommunications equipment imploded. Lucent saw its sales drop by 30 percent and was forced to take some $15 billion in charges to write off the value of loans given to service providers that no longer existed and to close down excess capacity. Lucent's stock price fell from a high of $70 a share in May 2000 to under $2 a share by mid-2002. Cisco, long the darling of the industry, lost over $) billion on falling sales, and its share price slumped from a high of S80 in May 2000 to around $16 by early 2002. JDS Uniphase took a record S50 billion charge against earnings in 2001 to write down the value of companies it had acquired during the boom.
In retrospect, what happened can be analyzed quite easily. Although demand for telecommunications capacity did increase markedly, demand projections got way ahead of reality. Moreover, each service company raised capital and made investments on the assumption that they would be the ones to capture a significant proportion of those inflated demand projections, while failing to appreciate that given the number of other competitors making similar investments, there would not be enough demand to go around. The result of this myopic behavior was excess capacity in the services business. This triggered a price war and ruined any hope that many new sen'ice providers had of becoming profitable. As the service providers started to lose money, they slashed their capital investment budgets, which caused the slump in the equipment market. \Vhat had been an extraordinary profitable sector turned into an economic disaster zone; an unprecedented boom and been replaced by an unprecedented bust.
Sources: J. Shinal, "Dead Dot.Coms Can Still Cause Havoc:' Bus;IlCSS Wcek, March 12,2001, p. 50; S. Rosenbush and P. Elstrom, "Eight Lessons from the Telecom Mess," BIiSillcss Wcek, August 13, 2001, pp. 60-67; S. Rosenbush and B. Einhorn, "Those Wires Sure Are Cold," Bllsiness Weck, September 17,2001, pp. 104-105; "Drowning in Glass," EcorlOmist, March 24, 200 I, p. 76.
19
CHAPTER 2 External Analysis: The Identification of Opportunities and Threats
Strategy in Action 2.l Circumventing Entry Barriers into the Soft Drink Industry
':'."
The soft drink industry has long beendorninated by tWci .' ....... cotild Significantly lindercut. the price of Coke and Pepsi. companies, Coca-Cola and PepsiCo. Bysperlding large "'colas and still make better profit margins on private-label' sums of money on advertising and prorriotion, bbthcom- ·,:.:hrands thari on branded colas.'. . .. panies have created significant brand loyaltyruld madeit ..• , DespitethiscompelliI1g value proposition, few. retail~' very difficult for new competitors to' enter the industry' , .. ' 'erswerewilling to sell private-label colas fodearofalien-' .. and talce market share away from these two' giants~. When.'· ating Coca-Cola and Pepsi, whose produCts werea:lllajor . new competitors do try to enter, both corripanieshavere~._. draw of grocery storetraffic. Cott's breakthrough came.in .. ' sponded by cutting prices and thus. forcingthe.:hew.en-d992when it signed a dealwithWal:-Mart.t9 supply the .•. trantto curtail expansion plans, . '.' c,' '. .·:retail,ing'gialltwith.a"private-Iabel ~ola;ca~ed:«SaI11's ':\ .
However, in the early 1990s the CottCorporatiOll,: ." Choice" ;{riam.ed after ·Wal-Martfounder:Sam 'walton);>: .... then a. small Canadian bottling company,worked·ortta". ". Wal~ ¥artprov:ed. to be the perfectdistri}:nitionchanhel,: .•
. strategy for entering the soft drink market. Cott~s .~trategy,:.f?r,~o~~r~eretailerwas just startillg to .getinto~hegro~,;,: '. was deceptively simple. The ~ompany initially focused 011 .,~ery.Q1J.siriess,and ·consutnersWent.toWal~Mart notta' the cola segment of the soft dr~ markeLCottsigned a.". b~ybrandedmercharidisebut to ·getlowpri~es ......• ". ' .. :" ;';'., deal with Royal Crown COlafor exchi~lve global fights to' . AsWal-Mart's grocerybusmessgrew, so clid'Cotes . its cola con~entrate; RC Coia was {small player in ilie . s.ale~,Cottsoori added o~er flavorstoitsoffering;:8uch as .' u.s. cola market. Its products were recognized as haviIig a' .' lerl10n lime soda,·whichw.oulcl compete With Seven Up" high qualitY, hut RC Colahadnever been able to. effec,. and Sprite. Moreover, pressUred by Wal-Mart, by the late , tively challenge Coke or Pepsi. Next, Cott signed adeal' 19905 other U.S. grocers .had also started to 'introduce with a Canadian grocery retailer, Loblaw;to pro'vide'the pilvate~label sodas, often turning toCott to" supply their ..... retailer with its own private-label brand of cola.' Priced needs. '. . . . '. low, the Loblaw private-label brand, known as President's ... , ". By 2003, Cott had grown to become a $lAbilli6n ." Choice, was very successful and took share from both·· •.. ' conipany;Its 2003 volume' growth in anotherwisestag~, .•.. Coke and Pepsi. .. nant :u~S. market for sodas was 12.6 percent.Private~label •. ·
Emboldened by this' success, Cott decidedio' try to 'companies, of w~chGottwas~yfat the largest; captUred '" convince other retailers to carry private-label cola. To te- . 7:9,perceI).tof tl1eUS:soda market ill 2003,up fromcU~., tailers, the value proposition was simple because;Utillke . mostnbtiiinga decade earlier. The losers in this process ; '. its major rivals, Cott spent almost nothing on advertising .. '. Were Coca-Cola and PepsiCo, who were nowfaci:ngthe .. ' and promotion. This constituted a majorsoutceofcost .' . steady erosion of their brand loyalty and market share as . savings, which Cott passed on to retailers in the form of '.' 'consumers increasingly came to recognize the high qual- .' lower prices. For their part, the retailers found that they ity and low price of private-label sodas.a
~ PART I Introduction to Strategic Management
Strategy in Action 2.1 Entry Barriers into the Japanese Brewing Industry
In 1565, an English visitor to Japan noted that the Japanese "feed moderately but drink largely:' This is still the case today: the Japanese have one of the highest l~vels of beer consumption per capita in the world. In 1998, for example, 50 liters of beer were sold for every man, woman, and child in the country, making Japan's level of beer consumption per capita similar to that of big beer drinking nations such as Australia, Britain, and Germany.
The Japanese market is dominated by Kirin, Asahi, Sapporo, and Suntory, which have a combined market share of around 97 percent. Collectively, these companies enjoy one of the highest profit rates of any industry in Japan. Despite this high level of profitability, there has been very little entry into this industry over the last three decades. Sun tory is the only successful new entrant in the past thirty years, and its market share stands at no more than 6 percent.
Normally, a lack of new entry into a profitable industry indicates the presence of high entry barriers, and that is certainly the case here. Like other large brewing companies all over the world, Japan's big four spend heavily on ad\'ertising and promotions. Moreover, Japan's big brewers have been aggressive in the area of product development. During the 1990s, Asahi gained significant share from its competitors by pushing its "Super Dry" beer. The resulting brand identification certainly helped to limit the potential for new entry. But some argue that there is more to it than this, and in fact Japan's brewing companies have also been the beneficiaries of significant regulatory barriers to entry. Brewers in Japan must have a license from the Ministry of Finance (MOF), and until 1994 the MOF would not issue a license to any brewer producing less than 2 million liters annually. This restriction represented an imposing hurdle to any potential new entrant: because a new company could not enter at a small scale of output, it would have to invest in very expensive brewing facilities. ""hy this regulation? BureaucratiC convenience. It is easier to collect tax from 4 companies than from 400.
Another significant barrier to entry has been Japan's distribution system. Roughly half the beer consumed in Japan is distributed and sold in bars and restaurants
whose owners are loyal to the big brewers and are often reluctant to distribute competing brands that might alienate their main supplier. Small liquor stores are another main distribution oudet for beer, and they too were unwilling to sell the products of new entrants for fear that the big brewers might "punish" them by denying them access to adequate supplies.
It appears that some of the barriers to entering Japan's brewing industry are declining, however. As part of an economic liberalization plan, in 1994 the MOF reduced the production threshold required to gain a license from 2 million liters to 60,000 liters, low enough to allow for the entry of microbreweries using the same technology that is now found in many brew pubs in the United States and Britain. Moreover, regulatory changes also allowed for the establishment of large new discount stores in Japan. (Until 1994, small retailers could effectively block the opening of a large discount store in their region by appealing to the local authorities.) Unlike traditional small retailers, large discount retailers are motivated more by price and profit than by loyalties to an established supplier and are eager to sell the beer of foreign companies and microbreweries, in addition to that of Japan's big four.
Given the decline in barriers to entry associated with regulation and distribution channels, many observers thought that Japan's big four brewers would have to face up to new competitors after 1994. So far, however, this has not been the case. Japan's big four brewing companies continue to dominate the domestic market, a testament perhaps to the significance of advertising, promotions, and product differentiation as barriers to entry. However, Japan's brewers are facing indirect competition from an alternative alcoholic beverage, wine, which is starting to become fashionable among younger people.
Sources: "Only Here for 'he Biru:' Economist, May 14, 1994, pp. 69-71; T. Craig, "The Japanese Beer Industry," in C. W. L. Hill and G. R. Jones, Strategic Management: An Integratt:d Approach (Boston: Houghton Mimin, 1995); "Japan's Beer Wars:' EcolJomist, February 28, 1998, p. 68; A. Harney, "Japan's Favorite Becr Could Face Losing Its Sparkle:' Financial Times, March 24, 1999, p. 27.
(
PART 1 Introduction to Strategic Management
2.2
" .... :, .. ':., .. ' .
• :F~;'de~ades,th~ lm~ilcfasf~~reaJindustry was one of the 'soon followed with a 19 percent price cut on tWo-thirds, i',: ll1osfprofitcible intheUriited states. The' industry has a ' ofits brands, and General Mills quickly did the same. The "i, consolidated structuredomimited 'by, Kellogg; General ,,' decades of tacit prke collusion were officially over:
Mills,: and Kraft Foods With its Post brand. Strong brand' ' ,'If, the brealcfast' cereal companies were' hoping that , 10yal~cbupled withcbntrblover the allocation of super- the price cuts woUld stimulate demand, they were wrong. , market shelf space, helped to limit the potential for new Instead, ,demand remained flat while revenues and mar-
eritry. Meanwhile, steadr demand growth of around '3 gins followed prices down and Kellogg's operating mar- ' , , percent, per annum kept industry revenues,expaiiding.gins dropped from 18 percent in 1995'10 10.2 percent in ' : For years, Kellogg, which accounted fo(over40 percent of 1996, a trend experienced by the other brand cereal , 'the market share, acted as the price leader in the industry. manufacturers. , Every year Kellogg increased cereal prices, its rivals fol- By 2000, conditions had only worsened. Private-label
, ,lowed, and industry profitsremained high. ;, sales continued to make inroads, gaining over 10 percent " "', This favorable mdustry structure started to change in, of the market. Moreover, sales of breakfast cereals started, 'the early 1990s when growth in demand slowed and then to contract at 1 percent per annum. To cap it off, an ag-stagnated as a latteandb;:tgelq;t"UJuffin replaced cereal as gressive General Mills continued to launch expensive the morl1ing, fare for many Amei1can adults .. Then came price and, promotion campaigns in an attempt to take
, the rise of powerful discounters .such as Wal-Mart, which share away from the marke~ leader. Kellogg saw its market , , entered the grocery industry in the early 1990sand began' share slip to just over 30 percent in 2001; behind the 31
, " topromoie aggressively its own brand ·of cereal, priced' percent now held by General Mills. For the first time , significantly below the brand-name cereals. Asthe decade since 1906, Kellogg no longerled the market. Moreover,
".progressed, other grocery chains such as, Kroger's staited ' profits at all three major producers remained weak in the , toJollow suit, and brand loyalty in the industry began to "face of contiriuedprice discounting. " " decline as 'customers realized that a $2:50 bag of wheat In mid-2001, General Mills finally blinked and raised "flakes from Wal-Mart tasted aboutthe same, as a $3.50 prices a modest 2 percent in response to its own rising , boX of Cornflakes from Kellogg. As sales of cheaper store-costs. Competitors followed, signaling perhaps that after
brand cereals began to takeoff, supermarkets, no longer a decade of costly price warfare, pricing discipline might, as' dependerit on brarid names, to bring traffic into their ' once more emerge in,the industrY. Both Kellogg and General stOres;' began to demand lower prices from the branded ' Mills tried to move further away from price competition
"', 'cereal mamifacturers. '-'by focusing on brand extensions, such as Special K con-For several years, the ni~nufacturers of bnmdcereals ' taining berries and new varieties of Cheerios. Kellogg's ef-
"'tried to holdout against these adverse trends, but in the forts with Special K helped the company recapture market , inid-1990sthe dam broke; In 1996, Kiaft (then owned by leadership from General Mills. More importantly, the ,Philip Morris) aggressively cut prices by 20 percentfor its renewed emphasis on nonpricetompetition halted years Post brand in an attempt to gain market share. Kellogg of damaging price warfare, at least for the time being.b
I i l ; :.
PART 1 Introduction to Strategic Management
I-Mart's Bargaining Power over Suppliers
. Wal-Mart and other discount retailers began in the 1960s, they were small operations with little purchasing power. To generate store traffic, they depended in large part on stocking nationally branded merchandise from well-known companies such as Procter & Gamble and Rubbermaid. Since the discounters did not have high sales volume, the nationally branded companies set the price. This meant that the discounters had to look for other ways to cut costs, which they typically did by emphasizing self-service in stripped-down stores located in the suburbs where land was cheaper (in the 1960s the main competitors for discounters were full-service department stores like Sears that were often located in downtown shopping areas).
Discounters such as Kmart purchased their merchandise through wholesalers, who';~in turned bought from manufacturers. The wholesaler would come into a store and write an order, and when the merchandise arrived, the wholesaler would come in and stock the shelves, saving the retailer labor costs. However, Wal-Mart was located in Arkansas and placed its stores in small towns. Wholesalers were not particularly interested in serving a company that built its stores in such out-of-the-way places. They would do it only if Wal-Mart paid higher prices.
Wal-Mart's Sam Walton refused to pay higher prices. Instead he took his fledgling company public and used the capital raised to build a distribution center to stock merchandise. The distribution center would serve all stores within a 300-mile radius, with trucks leaving the distribution center daily to restock the stores. Because the distribution center was serving a collection of stores and
thus buying in larger volumes, Walton found that he was able to cut the wholesalers out of the equation and order directly from manufacturers. The cost savings generated by not having to pay profits to wholesalers were then passed on to consumers in the form of lower prices, which helped Wal-Mart continue growing. This growth increased its buying power and thus its ability to demand deeper discounts from manufacturers.
Today Wal-Mart has turned its buying process into an art form. Since 8 percent of all retail sales in the United States are made in a Wal-Mart store, the company has enormous bargaining power over its suppliers. Suppliers of nationally branded products, such as Procter & Gamble, are no longer in a position to demand high prices. Instead, Wal-Mart is now so important to Procter & Gamble that it is able to demand deep discounts from them. Moreover, Wal-Mart has itself become a brand that is more powerful than the brands of manufacturers. People don't go to Wal-Mart to buy branded goods; they go to Wal-Mart for the low prices. This simple fact has enabled Wal-Mart to bargain down the prices it pays, always passing on cost savings to consumers in the form of lower prices.
Since 1991 Wal-Mart has provided suppliers with real-time information on store sales through the use of individual Stock Keeping Units (SKUs). These have allowed suppliers to optimize their own production processes, matching output to Wal-Mart's demands and avoiding under- or overproduction and the need to store inventory. The efficiencies that manufacturers gain from such information are passed on to Wal-Mart in the form oflower prices, which then passes on those cost savings to consumers. C
Ul!\I' J 1:.1<:i txlem(l/ fl1la!J'SIS: IIJI' Idelltijicati(J/1 oj II/dustry OjJjJortullities (lilt! Tbrl'a{s 107
Tbe Failure ojDigital'sAlpha Chip
I n February 1992, Digital Equipment Corporation introduced the world's fastest microprocessor, the Alpha chip. Microprocessors are the brains of personal computers, work
stations, and servers. The Alpha chip operated at more than twice the speed of Intel's best-selling microprocessors. Many at Digital had great hopes for the product, belie\ing that it could ultimately grab a significant share of the booming market for microprocessors. By 1997, howe\'er. after Digital had spent $2.5 billion to develop the Alpha, the chip ranked dead last in market share, with an estimated 1 percent of the $18 billion microprocessor markl'l. Intel's share stood at 92 percent.
The failure of the Alpha to gain market share despite it.~ apparent performance admntage O\'er existing microprocessors c:m he explained easily enou~h: there was ne\'er enough software to run on the Alpha. lIence. potential customers stayed away from inresting in computers based on the Alpha chip. Digital W:1S nl'rer ahle to get a posit.ire fecdhack cycle going in which an increase in the supply of software configured to ,run on Alpha-hased systems would ha\'e drircn demand for ;\lpha-h:L<;ed computers. which would hm e Illl':mt Ihat dl'\'eloper~ \\'Ould hare supplied more software for the ;\lpha. which would har!.' funhl'r incre;L~cd the demand for Alpha-h:L<;l'd cOll1pull'rs. and so Oil.
To he fair, Digital sl'l'll1l'd to stan off on the correct fool. III 1992. \1icro:;oft agn'l'd (() adapt it~ next-generation operating sysll'm for cOlvorate cOlllpull'rs. \\'indows ~T. so that it \\'ould run on the Alpha chip. in addition to Intel microprocessors, In return for this commitment from Microsoft. Digital agn'l'd to make ~T a central part of iL<; own computer husiness. (Digital sold wor!,$tations, servers, :md person:d computers.) FolI()\\ing the agreement. Digit:d engineers deroted tremendous effort to fine- . tuning the Alpha so that it would work \\;th t\T. Boweyer, when Digital engineers loaded tested "ersions of ~T into
their computers, it became clear that h'1 needed far too much computer memory to run on a typical PC, putting Alpha beyond the reach of the mass market Digital had been hoping for.
In the spring of 1995, Digital tried again to kick start demand for the Alpha. Under the terms of a revised agreement \\ith Microsoft, Digital agreed to provide nehvork installation services for Microsoft. For its part. Microsoft agreed to continue to write a version of KT for the Alpha chip and to pay Digital up to $ 100 million to help train Digital NT technicians. Moreover, in Octoher of that year, Microsoft stopped writing versions of !\T for the IBM Power PC chip and Motorola's MIPS microprocessor, leaving the Alpha and Intel's Pentium series as the only chips that could run Windows !XI.
Despite these de\'elopmenLc;. sales of the AJpha chip were still slow to take off. The Intel-based system now had such a huge lead in the Windows ~T business that few derelopers wcre \\illing to take the risk and customize their software applications to run on the Alpha \'ersion of \rindows \T. :LC; opposed 10 Intel-h:L~ed machines. To make mailers worse. Digital hun its own prospects hy continuing 10 allach a premium price to Alpha machines. which slowed demand gn)\\1h, By late }994. Digital en!!inl'er~ had found a way to delirer Alpha workstations for $-:1.(9).
IIO\\'l'n~r. some of Digital·s senior management relOed the more hecause they feared that it would damage the ::;0 percent gross margins that Digital enjoyed in thl' high-end computer markets. which at the time W:L<; one of the f(·\\' hright spots in Digital's husiness. In the cnd. when Digital did introduce its Alpha-based workstations for Windows \T. they were priced at $7,995. signific:mtly ahore the price of high-end intel-b:L<;ed machines. For corporate customers. this made the decision to go \\~th Intel machines for Windows 1\7 oh\;ous-they were cheaper and more software applications were a\'ailahle for the Intel versions.3~

I
Part 1 Introduction to Strategic Management
The United States Beer Industry
Over the last few decades, the United States beer industry has been characterized by a very clear trend toward an increase in the concentration of the market. Today, some 80% of all beer consumed in the United States is produced by just three companiesAnheuser-Busch (which is now owned by InBevof Belgium), SAB-Miller, and Molson Coors-up from 57% of the market in 1980. Anheuser-Busch had almost 50% of the market in 2008, up from just 28.2 % in 1980. SAB-Miller (formed in 2002 when South African Breweries merged with Miller Beer) had around 19 % of the market, and Molson Coors (formed in 2005 when Canada's Molson merged with Coors) had 11 % of the market.
Anheuser Busch, SAB-Miller, and Molson Coors dominate the mass market segment of the industry, where competition revolves around aggressive pricing, brand loyalty, distribution channels, and national advertising spending. In contrast, there is another segment in the industry, the premium beer segment, which is served by a large number of micro brewers and importers, the majority of which have a market share of less than 1 %. The premium segment focuses on discerning buyers. Producers are engaged in the art of craft brewing. They build their brands around taste and cover higher product costs by charging much higher prices-roughly twice as much for a six pack as the mass market brewers. The micro brewers and importers have been gaining share and currently account for about 11 % of the total market.
Over the last two decades, the industry has changed in a number of ways. First, consumption of beer in the United States has been gradually declining (even though consumption of premium beer has been increasing). Per capita consumption of beer peaked at 30 gallons in 1980 and fell to a low of 21.8 gallons in 2007. The decline in consumption was partly due to the growing popularity of substitutes, particularly wine and spirits. In 1994, Americans consumed 1. 75 gallons of wine per capita. By 2006, that at figure
had risen 2.16 gallons. Consumption of spmts increased from 1.27 gallons per capita in 1994 to 1.34 gallons per capita over the same period.
Second, advertising spending has steadily increased, putting smaller brewers at a disadvantage. In 1975, the industry was spending $0.18 per case on advertising; by 2002 it was spending $0.40 per case. (These figures are in inflation adjusted or constant dollars.) Smaller mass-market brewers could not afford the expensive national TV advertising campaigns required to match the spending of the largest firms in the industry, and they saw their market share shrink as a result.
Third, due to a combination of technological change in canning and distribution and increased advertising expenditures, the size that a mass-market brewer has to attain to reap all economies of scalecalled the minimum efficient scale of production-has steadily increased. In 1970, the minimum efficient scale of production was estimated to be 8 million barrels of beer a year, suggesting that a market share of 6.4% was required to reap significant economies of scale. By the early 2000s, the minimum efficient scale had increased to 23 million barrels, implying that a market share of 13.06% was required to reap significant economies of scale.
By the early 2000s, only 24 mass-market brewers were left in the United States, down from 82 in 1970: Among the remaining mass-market brewers, Anheuser Busch is the most consistent
. performer due to its superior economies of scale. The company's ROlC has been high, fluctuating in the 17% to 23 % range between 1996 and 2008, while net profits grew from $1.1 billion in 1996 to $2 billion in 2008. In contrast, both Coors and· Miller, along with most other mass market brewers, have had mediocre financial performance at best. Coors and Miller merged with Molson and SAB, respectively, in an attempt to gain economies of scale. 30

Closing Case
How the Internet Revolutionized the Stockbrokerage Industry
For years, only professional stockbrokers with expensive computer hardware could trade online. An individual investor who wanted to buy or sell a stock had to call a stockbroker and place an order, for which the stockbroker would charge a commission. At full-serviCe stockbrokers such as Merrill Lynch, which offer clients detailed research reports, stock recommendations, and financial planning services, these commissions could run to 2.5 percent of the value of the order. Thus, an order worth $)0,000 could generate $250 in commissions.
The situation began to change in 1994 when a small discount broker, K. Aufhauser & Co., took advantage of new technology to become the first to offer its clients the ability to trade online over the Internet, effectively bypassing stockbrokers. The offering allowed Aufhauser to operate with fewer personnel, and the cost saving was passed on to customers in the form of lower commissions. At first, online trading was nothing more than a curiosity, but several things changed this. First, the Internet started to make rapid inroads into the homes of individual Americans. Second, within a short space of time, a vast amount of investment information was being offered on the Internet. Individual investors soon found that they could go to sites such as the Motley Fool at America Online or Yahoo's finance site and get much of the information that they needed to make informed investment decisions. No longer did they have to call their stockbrokers to ask for information. Third, a number of small companies quickly followed Aufhauser's lead and took advantage of the Internet to offer their clients online trading for commissions that were significantly below those offered by full-service stockbrokers in the physical world. Finally, America's long bull market drew ever more individuals into the stock market, particularly among America's large baby boom generation, who were drawn to_
investing in order to build up funds for retirement. Increasingly, these n.ewcomers set up online trading accounts.
The effects of these trends were dramatic. By mid-2000, 150 firms were offering online trading over the Internet. Many of these companies did not even exist six years before. The arrival of the Internet had lowered barriers to entry and allowed these companies to enter the stockbrokerage industry and compete against established brokers. As the competition for the business of online investors started to heat up, commissions started to fall. By early 1999, online brokerages such as PTrade were charging deep discount fees of $14.95 per market order for trades of up to 5,000 shares. Thus, whereas an order for 1,000 shares of a stock trading at $20 a share could cost the client of a full-service broker as much as $500 in commission, the same trade could be executed over PTrade for $14.95! Attracted by such low prices, from little more than a trickle in 1994, the volume of online trades grew to account for 40 percent of all stock trades by individuals as of mid-2000. Discount broker Charles Schwab emerged as the leader of this new segment, with eight out of ten online trades in 2000 being executed by Schwab.
At first, full-service brokers derided online trading as dangerous and justified their high commissions by claiming that they offered their clients sound financial advice and proprietary research reports. However, with as many as 40 percent of all stockbrokers lacking much in the way of experience and with the rapid increase in the amount of investment information that could be accessed online, such arguments sounded increasingly shrill and self-serving. By early 1999, it was becoming apparent that full-service brokers needed to adapt to the new technology or risk seeing their client base evaporate.

CHAPTER 2 External Analysis: The Identification of Industry Opportunities and Threats
The landmark event occurred in June 1999 when Merrill Lynch, the world's largest full-service broker, bowed to the inevitable and announced that it too would soon offer its clients the ability to trade online for a fee of $29.95 for trades of up to 1,000 shares. In addition, Merrill Lynch changed its pricing structure for many individual clients, replacing a fee structure that was based on the number of trades with a new flat fee that allowed unlimited numbers of trades. An internal Merrill report estimated that as a result, its army of 14,800 well-paid stockbrokers, who were paid chiefly in commissions, might initially see their incomes decline by 18 percent as a result of this move. Merrill knew that it faced a potential rebellion from its stockbrokers, but it also knew that it had no choice: forecasts suggested that more than 50 percent of stock trades by individuals would be online by 2001. The early results suggest that Merrill did the right thing. Soon after the introduction of Merrill's online trading service, account transfers to rival firms dried.
• Many of Merrill's clients realized that the combination of its research and online trading made it a better value proposition than discount online trading houses, such as £>tTrade, which could not offer the same depth and breadth of research.
In late :!OOO, the online trading revolution appeared to stall when the NASDAQ stock market began what would prove to be a 60 percent decline in value over the next twelve months. As the stock market imploded, the volume of online trading dried up. Schwab saw online trading volumes drop over 50 percent in the first six months of 200 I, which decimated the company's bottom line, leading to a 60 percent fall in net income. The same happened at other former high-flying Internet stockbro-
kers, including E*Trade, which lost money in 2001 on a 40 percent decline in online trading volume and declining revenues. It remains to be seen whether this represents nothing more than a temporary setback in the rise of online trading, or the end of the boom.
Sources: c. Gasparino and R. Buckman, "Homing In: Facing Internet Threat Merrill to Offer Trading Online for Low Fee; WaU Street Journal, June 1, 1999, p. AI. "Bears or Bulls, More and More People Are Trading Shares Online," Economist, October 17, 1998. LN. Spiro and E. C. Baig, ""''ho Needs a Broker?" Business Week, February 22, 1999, p. 113. "A Reluctant Success," Economist, June 9, 2001, pp. 79-80. M. J. Ybarra, "The Brokerage Blues," Upside (August 2001): 46-51. .
Discussion Questions 1. How did the rise of the Internet alter competitive
forces in the brokerage industry?
2. How does the rise of online brokers change the likely long-term profitability of the stockbrokerage industry?
3. How did the change in competitive forces in the brokerage industry change the strategies required for success in that industry?
4. Do you think the decline in online trading volumes observed in 2001 represents the highwater market for the rise of online trading, or is it simply a temporary setback?
5. What was Merrill Lynch's strategy for gaining the business of individual investors in the pre-Internet era? \%at is the strategy today? \%at should be the strategy in the future?
By rucK BROOKS
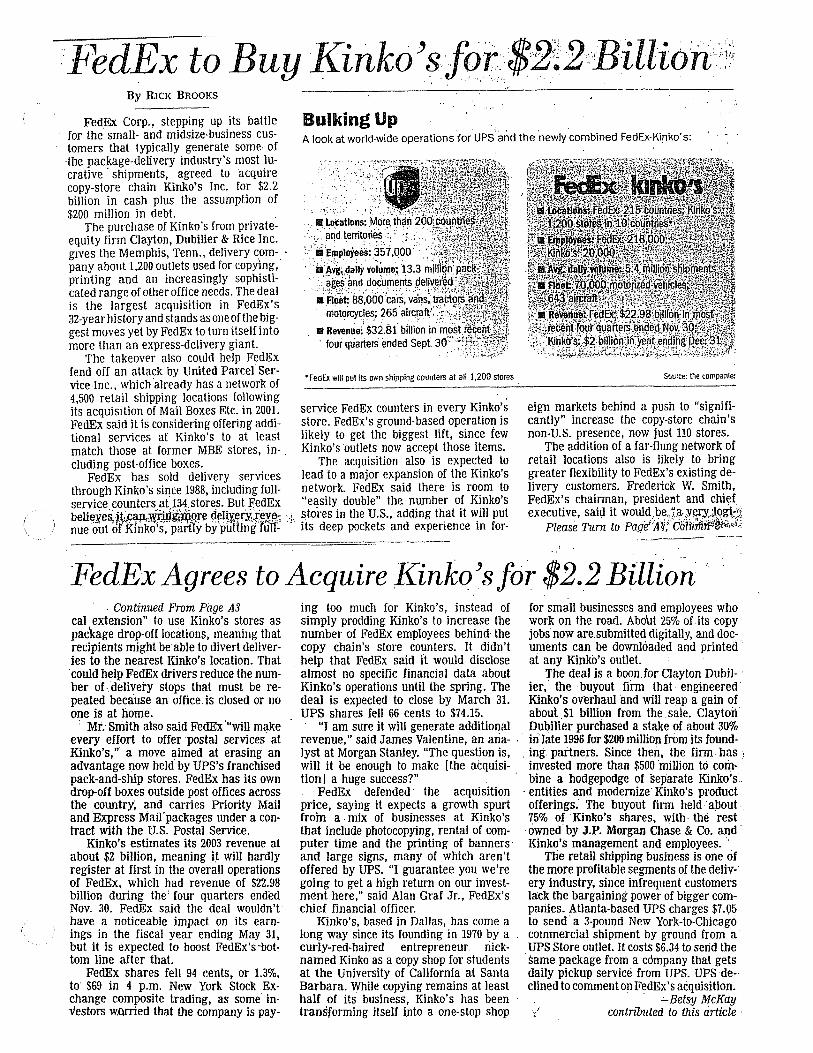
Fe~ COrp., stepping up its battle for the small- and midsize-business customers that typically generate some of ·the package-delivery industry's most lucrative . shipments, agreed to 'acquire copy-store chain Kinko's Inc. for $2.2 billion in cash plus the assumption of $200 million in debt.
The purchase of Kinko's from privateequity firm Clayton, Dubiller & Rice Inc. gIves the Memphis, Tenn., delivery c:om- . pany about 1.200 outlets used for copying, printing and an increasingly sophisticated range of other office needs. The deal is the largest acquisition in FedEx's 32-year history and stands as. one of the biggest moves yet by FedEx to turn itself into more than an express-delivery giant.
Bulking Up .. ' i. .
A look at world-wide operations for UPS and the newly combined Fed~-Kinko's:
'. . , '.
.... ~,<,'
.... ~'~tlons:Mo~ .' ,. "., and tenito'ries .:,: "'.~·~~p~~:~5-j,DOO ! , .•• }~g;~ajly volu",~"i3.3
'. .., ageS'imd documents fle1i'v!\~cl: . ~'~~B8:o6o'~~:~: ."
motorcycles; :265 .
. IB Revenue:; $32.81 billion - four quarters ended Sept:
'FedEl< will put its own shipping counters at all 1.200 stores Source: the companie:
The takeover also could help FedEx fend off an attack bv United Parcel Service Inc .. which 'already has a network of 4,500 retail shipping locations following its acquisition of Mail Boxes Etc. in 2001. service FedEx counters in every Kinko's FedEx said it is considering offering addi- store. FedEx's ground-based operation is
eign markets behind a push to "significanily" increase the copy~store chain's non-U.S. presence, now just 110 stores. tional services at Kinko's to at least likely to get the biggest lift, since few
match those at former MBE stores, in-, Kinko'soutlets now accept those items. The addition of a far-flung network of retail locations also is likely to bring greater flexibility to FedEx's existing delivery customers. Frederick W. Smith, FedEx's chairman, president and chi~[ executive, said it wouldbe,;!.a.;v~)Qgi~d
cluding post-office boxes. The acquisition also is expected to FedEx has sold delivery services lead to a major expansion of the Kinko's
through Kinko's since 1988, including full- network. FedEx said there is room to service counters at,134.stores. But EedEx "easily double" the number of Kinko's belieYe~it.I'Jm-Mirit'riiore deliveryieve-: . stores in the U.S., adding that it will put nueout 'o(IDnkois',"paril'Yby'puHingl{lii~'-its deep pockets and experience in for- Please Turn to Pa,q(lA~;:c61ti.m~~!/.1
.. _--FedEx Agrees to Acquire Kinkq)sfor $2.2 Billion'
. Continued From Page A3 cal extension" to use Kinko's stores as package drop-off locations, meaning that recipients might be' able to divert deliver-
. ies to the nearest Kinko's location. That could help FedEx drivers reduce the number of . delivery stops that must be repeated because an office.is closed or no one is at home.
. Mr; Sniith also said FedEx '''will make every effort to offer postal services' at Rinko's,'" a move aimed at erasing an advantage now held' by UPS's franchised pack-and-ship stores. FedEx has its own drop-off boxes outside post offices across the country; and carries Priority Mail and EXpress MaiJ'packages under a contract with the U.S. Postal Service.
Kinko's estimates its 2003 revenue at about $2 billion, meaning it will hardly register at first in the overall operations of FedEx, which had revenue of $22.98 billion during the' four quarters ended Nov. 30. FedEx said the deal wouldn't have a noticeable impact on its earnings in the fiscal year ending May 31, but it is expected to boost FedEx's-bottom line after that
FedEx shares fell 94 cents, or 1.3%, to $69 in 4 p.m. New. York Stock Exchange composite trading, as some'investors w.orried that the company is pay-
ing too much for Kinko's, instead of for small businesses and employees who simply prodding Kinko's to increase the work on the road. About 25% of its copy number of FedEx employees behind the jobs now are. submitted digitally, and doc-copy chain's store counters. It didn't uments can be downloaded and printed'
. help that FedEx said ft would disclose at any Kinko's outlet. almost no specific financial data about The deal is a boon for Clayton Dubil- . Kinko's operations until the spring. The ier, the buyout firm that engineered deal is expected to close by March 31. Kinko's overhaul and will reap a gain of UPS shares fell 66 cents to $74.15. about $1 billion from the saie. Clayton , "1 am sure it will generate additional Dubilier purChased a stake of about 30%
revenue," said James Valentine, an aria-· irilate 1996 for $200 milliop frOm its found" Iyst at Morgan Stanley. "The question is, .. ing. partners. Since then, the firm. has.! will it be enough to make [the acquisi- invested more than $500 'million t6 com-tion] a huge success?" bine a hodgepodge of separate Kinko's.
. FedEx defended the acquisition . entities and modernize' Kinko's product price, saying it expects a growth spurt offerings. The buyout firm held about. from a· mix of businesses at Kinko's 75% of Kinko's shares, With the rest that include photocopying, rental of com- owned' by J.P. Morgan Chase & Co. and' puter time and the printing of banners' Kinko's management and employees.' and large signs, many of which aren't The retail shipping business is one of offered by UPS. "1 guarantee you we're the more profitable segments of the deJiv-going to get a high return on our invest- ery industry, since infrequent customers ment here," said Alan Graf Jr., FedEx's lack the barg;lining power of bigger com-chief financial officer. panies. Atlanta-based UPS charges $7.05
Kinko's, based in Dallas. has come a to send' a 3-pound New York-to-Chicago long way since its founding in 1970 by a commercial shipment by ground from a curly-red-haired entrepreneur. riick- UPS Store ouUet. It costs $6.34 to selid the named Kinko as a copy shop for students . same package from a company that gets at the University of California at Santa daily pickup service from UPS. UPS de-Barbara. While copying remains at least clined to comment on FedEx's acquisition. half of its business, Kinko's has been . .:..Betsy McKay transforming itself i.nto a one-stop shop contributed to this article·
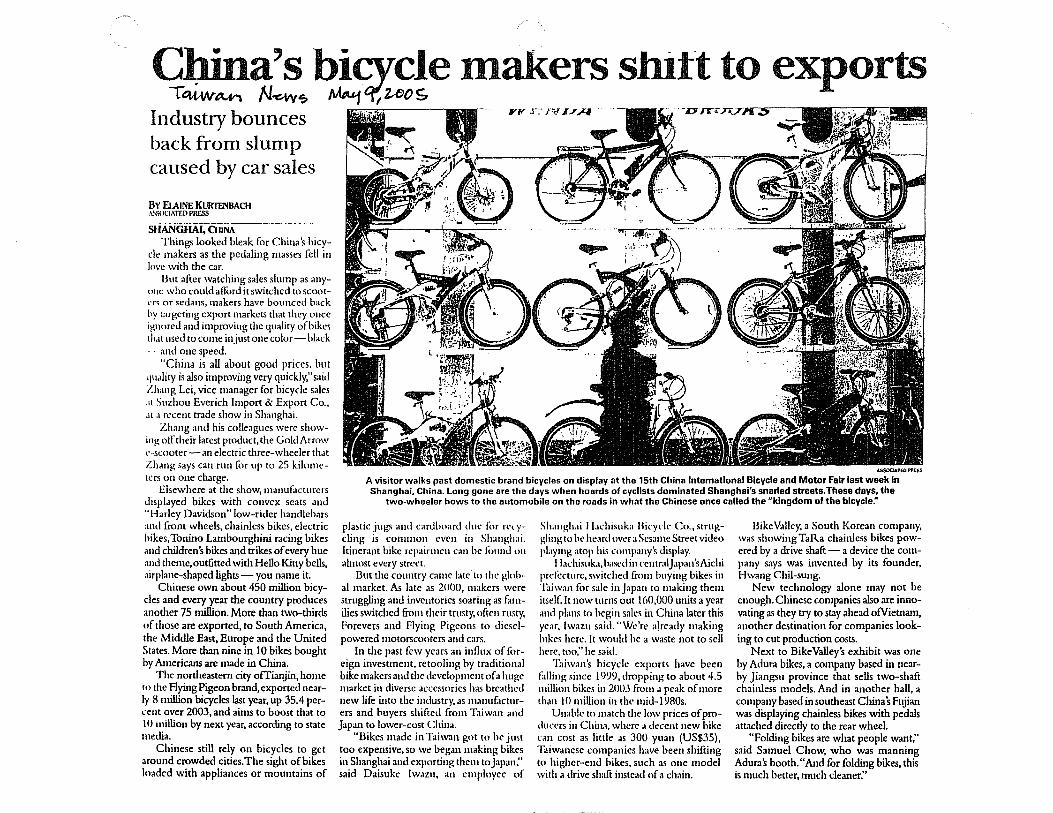
Cbina's bicvcle makers shitt to exports TGttW~ N-c.w$ ~~t{uos.
Industry bounces back from slump caused by car sales
By ElAINE KURTENBACH A5S0UATfD PRESS
SHANGHAi;6iiNA--'-"- --.... Things looked bleak for China's bicy
cle makers as the pedaling masses fell in love with the car.
But after watching sales slump as anyone who could afford it switched to s(ootIT' or sedans, makers have bounced back hy targeting export markets that they once i!Qlored and improving the quality of bikes Ih,lt used to come in just one colur - black - and one speed.
"China is all about good prices. but qll'llity is also improving very quickly," said Zhan g Lei, vice manager for bicycle sales ,ll Suzhou Everich Import & Export Cu .. • ll .1 recent trade show in Shanghai.
Zh;ll1g and his colleagues were showing off their latest product, the Gold Arrow l'-.Icooter- an electric three-wheeler that Zh,mg says can run for up to 25 kilometers on one charge.
Elsewhere at the show, manufacturers displayed bikes with convex seats and "Harley Davidson"low-rider handlebars and front wheels, chainless bikes, electric bikes, Tonino Lambourghini racing bikes and children's bikes and trikes of every hue and theme, outfitted with Hello Kitty bells, airplane-shaped lights - you name it.
Chinese own about 450 million bicycles and every year the country produces another 75 million. More than two-thirds of those are exported, to South America, the Middle East, Europe and the United States. More than nine in 10 bikes bought by Americans are made in China.
The northeastern city ofTiatYin, home to the Flying Pigeon brand, exported nearly H million bicycles last year, up 35.4 perl'ent over 2003, and aims to boost that to 10 million by next year, according to state media.
Chinese still rely on bicycles to get around crowded cities.The sight of bikes loaded with appliances or mountains of
;e" ry.r:- r<T II,;q
ASSOOATED PflE5S
A visitor walks past domestic brand bicycles on display at the 15th China International Bicycle and Motor Fair last week In Shanghai, China. Long gone are the days when hoards of cyclists dominated Shanghai's snarled streets. These days, the
two·wheeler bows to the automobile on the roads in what the Chinese once called the "kingdom of the bicycle.ft
plastic jUb'S ami cardboard dm' for rl',ycling is COlllmon even in Shanghai. Itinerant bike repairmell can be fi>llml 011
almost every street. Dut the country came late' to the glob
al market. As late as 20{)O, makers were struggling and inventories soaring as families switched frOI11 their trusty, (Jftrl! rusty. forevers and Flying Pigeons to dieselpowered motorscooters and cars.
In the past few years an influx of foreign investment, retooling by tradition;11 bike makers and the development of a huge market in diverse accessories has breathed new life into the industry. as manufacturers and buyers shifted fmm Taiwan and Japan to luwer-cost China.
"Dikes made in Taiwan got to he just too expensive, so we began milking bikes in Shanghai and exporting them to Japan." said Daisuke I waZll. an employee of
Sh.lIlgh.li I I.lChisuka lIil'yde Co .• struggling to he heard ovcr a Sesame Street video playing atop his wmpany's display.
) IachislIka. based in centralJapan'sAichi prefec:ture. switched from buying bikes in '!aiwan filr sale in Japan to making them itself. It now turns out t c.o,OUO units a year and plans to begin sales ill China later this year. Iwazu said. "We're already making hikes here. It would he a waste not to sell here. too," he said.
T:liwall's bicycle exports have been f:llIing since 1999, dropping to about 4.5 million bikes in 200J from a peak of more than 10 million in tht' lIIid-1980s.
Unable to match the low prices of product'rs in China, where a decent new bike can cost as little as 300 yuan (US$35), Taiwanese companies have been shifting to higher-end hikes. such as one model with a drive shaft instead of a ch'lin.
BikeValley. a South Korean company, was showing TaRa chainless bikes powered by a drive shaft - a device the company says was invented by its founder, Hwang Chil-sullg.
New technology alone may not be enough. Chinese companies also are innovating as they try to stay ahead ofViemam, another destination for companies looking to cut production costs.
Next to BikeValley's exhibit was one by Adura bikes, a company based in nearby Jiangsu province that sells two-shaft chainless models. And in another haIl, a company based in southeast China '5 fujian was displaying chainless bikes with pedals attached direcdy to the rear wheel.
"Folding bikes are what people want," said Samuel Chow, who was manning Adura's booth. "And for folding bikes, this is much better, much cleaner."
The importance of sex
Forget China. India and the internet: economic gro"vth is driven by women
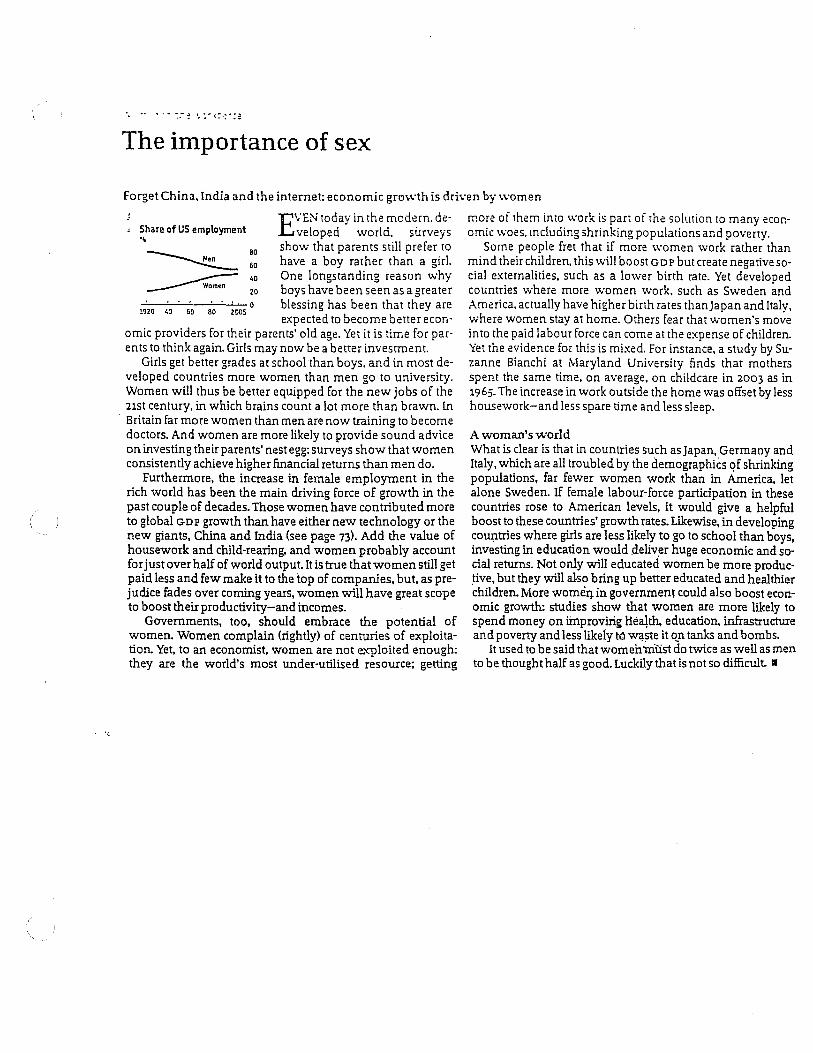
EVEN today in the modern. de' more oi them into work is pan of the solution to many econ-~hare of US employment veloped world. surveys omie \voes. mcluding shrinking populations and poverty.
80 show that parents still prefer to Some people fret that if more women work rather than ~ 60 have a boy rather than a girl. mind their children. this will boost GDP but create negative so-
_____ ~o One longstanding reason why cial externalities. such as a lower birth rate. Yet developed ~ Women 20 boys have been seen as agreater countries where more women work. such as Sweden and
-'---'--'-.!...--'-"':""';L..- a blessing has been that they are America. actually have higher birth rates thanJapan and Italv,'. 1920 40 60 80 2005
expected to become better econ- where women stay at home. Others fear that women's move omic providers for their parents' old age. Yet it is time for par· into the paid labour force can come at the expense of children. ents to think again. Girls may now be a better investment. Yet the evidence for this is mixed. For instance, a study by Su-
Girls get better grades at school than boys. and in most de- zanne Bianchi at Maryland University finds that mothers veloped countries more women than men go to university. spent the same time, on average, on childcare in 2003 as in Women will thus be better equipped for the new jobs of the 1965. The increase in work outside the home was offset by less 21st century, in which brains count a lot more than brawn. In housework-and less spare time and less sleep .
. Britain far more women than men are now training to become doctors. And women are more likely to provide sound advice on investing their parents' nest egg: surveys show that women consistently achieve higher financial returns than men do.
Furthermore, the increase in female employment in the rich world has been the main driving force of growth in the past couple of decades. Those women have contributed more to global GDP growth than have either new technology or the new giants, China and India (see page 73). Add the value of housework and child-rearing, and women probably account forjust over half of world output. It is true that women still get paid less and few make it to the top of companies, but, as prejudice fades over coming years, women will have great scope to boost their productivity-and incomes.
Governments, too, should embrace the potential of women. Women complain (rightly) of centuries of exploitation. Yet, to an economist, women are not e."<ploited enough: they are the world's most under-utilised resource; getting
A woman's world What is clear is that in countries such as Japan, Germany and Italy. which are all troubled by the demographiCs qf shrinking populations, far fewer women work than in America, let alone Sweden. If female labour-force participation in these countries rose to American levels, it would give a helpful boost to these countries' growth rates. Likewise, in developing cou~tries where girls are less likely to go to school than boys, investing in education would ,deliv,er huge economic and social returns. Not only will educated women be more produc,tive, but they will a1so bring up better educated and healthier children. More womeIJ. in government could also boost economic growth: studies show that women are more likely to spend money on iInprovirig Health, education, infrastructure and poverty and less likeiy t6 wll!5te it q,n tanks and bombs.
It used to be said that women must do twice as well as men to be thought half as good. Luckily that is not so difficult. \I