chapter 3 cont’d. adjacency, histograms, & thresholding
TRANSCRIPT
Chapter 3 cont’d.Chapter 3 cont’d.
Adjacency, Histograms, & Adjacency, Histograms, & ThresholdingThresholding

RAGsRAGs(Region Adjacency Graphs)(Region Adjacency Graphs)
RAGs (Region Adjacency Graphs)RAGs (Region Adjacency Graphs)
Steps:Steps:1.1. label imagelabel image
2.2. scan and enter adjacencies in graphscan and enter adjacencies in graph
(includes containment)(includes containment)

But how do we obtain But how do we obtain binary images?binary images?
Histograms & ThresholdingHistograms & Thresholding
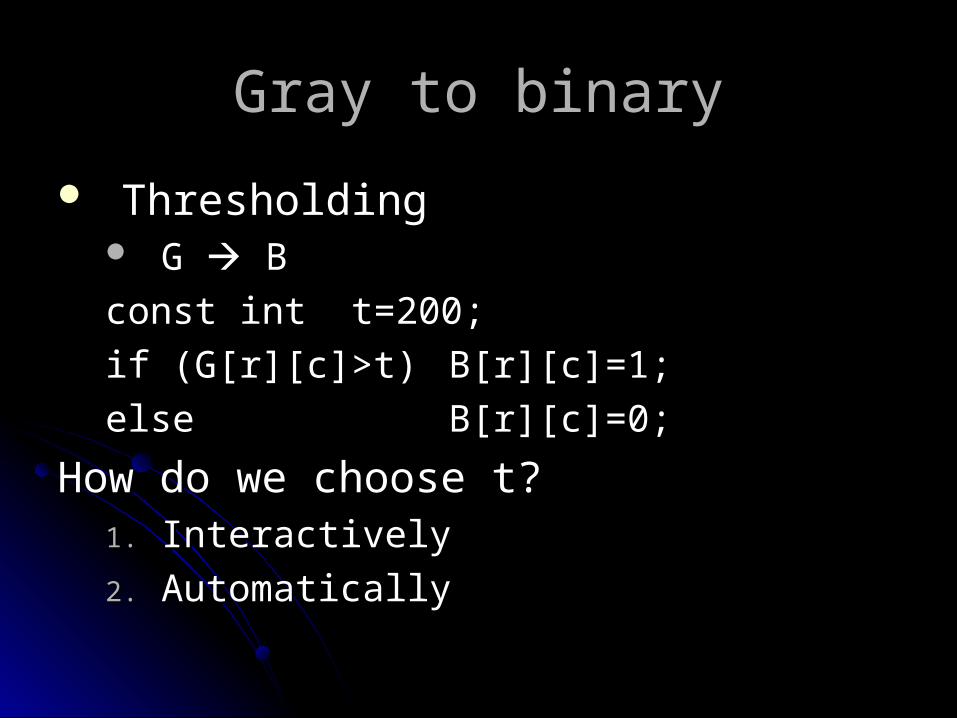
Gray to binaryGray to binary
ThresholdingThresholding G G B B
const int t=200;const int t=200;
if (G[r][c]>t)if (G[r][c]>t) B[r][c]=1;B[r][c]=1;
elseelse B[r][c]=0;B[r][c]=0;
How do we choose t?How do we choose t?1.1. InteractivelyInteractively
2.2. AutomaticallyAutomatically
Gray to binaryGray to binary
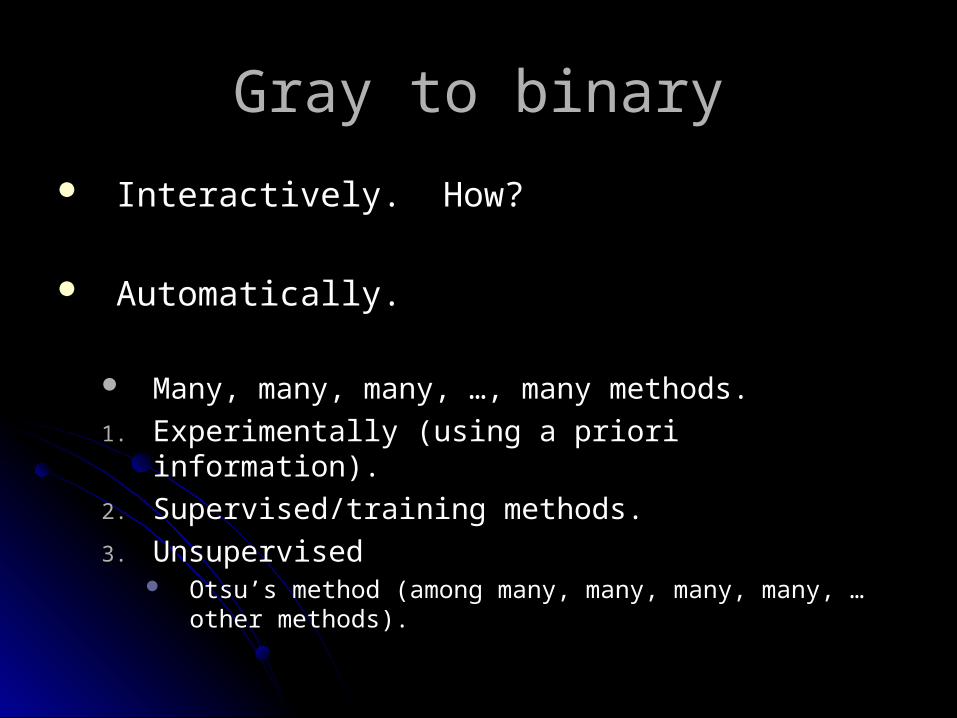
Interactively. How?Interactively. How?
Automatically.Automatically.
Many, many, many, …, many methods.Many, many, many, …, many methods.
1.1. Experimentally (using a priori information).Experimentally (using a priori information).
2.2. Supervised/training methods.Supervised/training methods.
3.3. UnsupervisedUnsupervised Otsu’s method (among many, many, many, many, … other Otsu’s method (among many, many, many, many, … other
methods).methods).
HistogramHistogram
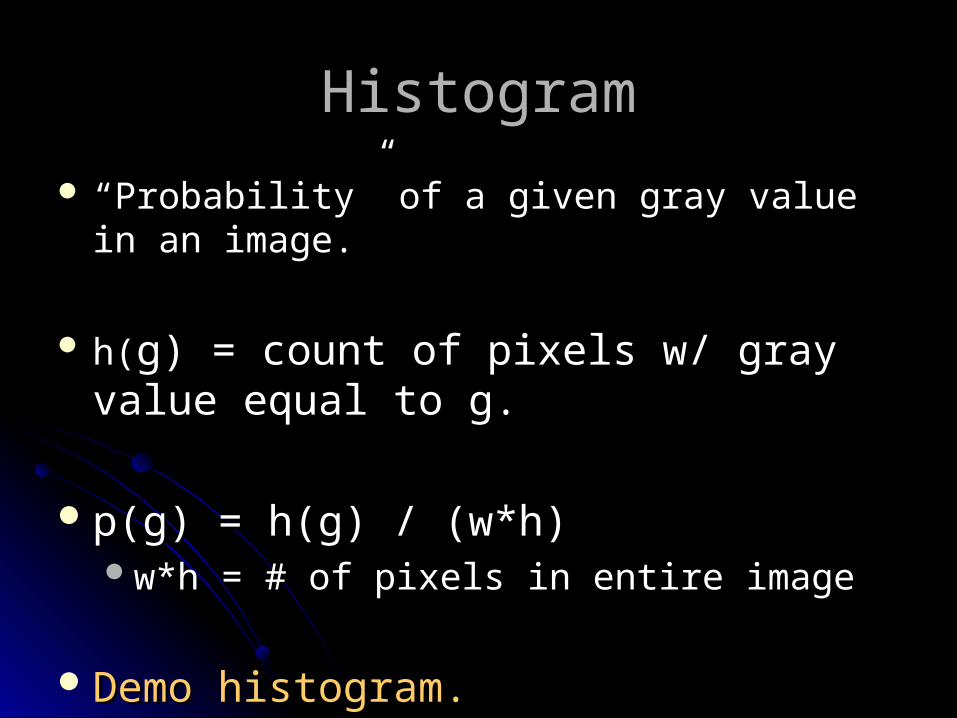
““Probability” of a given gray value in an image.Probability” of a given gray value in an image.
h(h(g) = count of pixels w/ gray value equal g) = count of pixels w/ gray value equal to g.to g.
p(g) = h(g) / (w*h)p(g) = h(g) / (w*h)w*h = # of pixels in entire imagew*h = # of pixels in entire image
Demo histogram.Demo histogram.

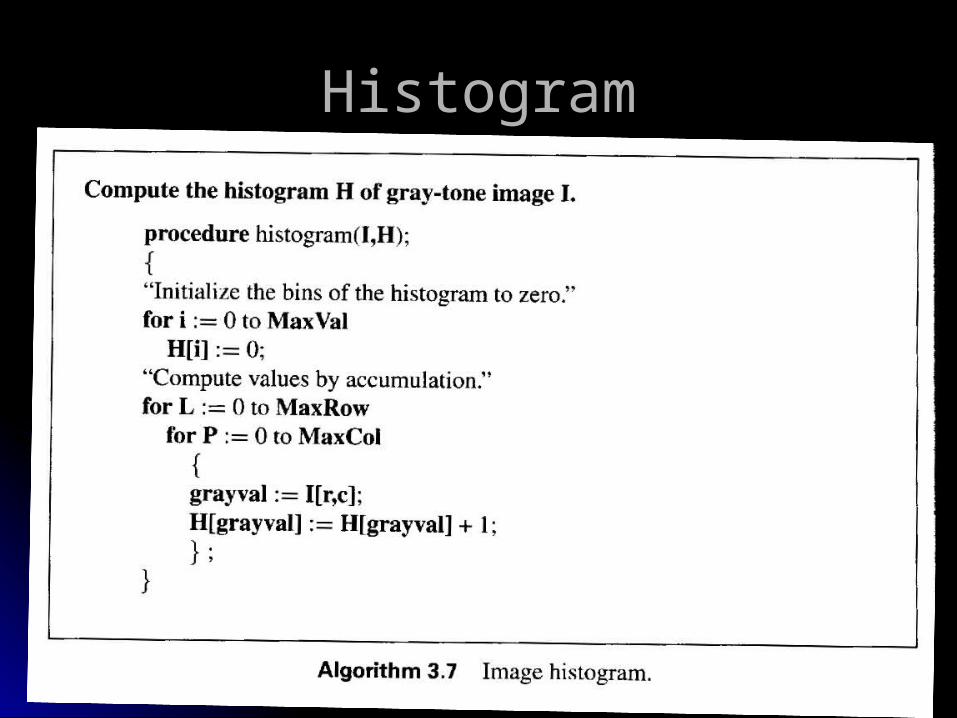
HistogramHistogram
Note: Sometimes we need to group gray Note: Sometimes we need to group gray values together in our histogram into “bins” values together in our histogram into “bins” or “buckets.”or “buckets.”
E.g., we have 10 bins in our histogram and E.g., we have 10 bins in our histogram and 100 possible different gray values. So we 100 possible different gray values. So we put 0..9 into bin 0, 10..19 into bin 1, …put 0..9 into bin 0, 10..19 into bin 1, …
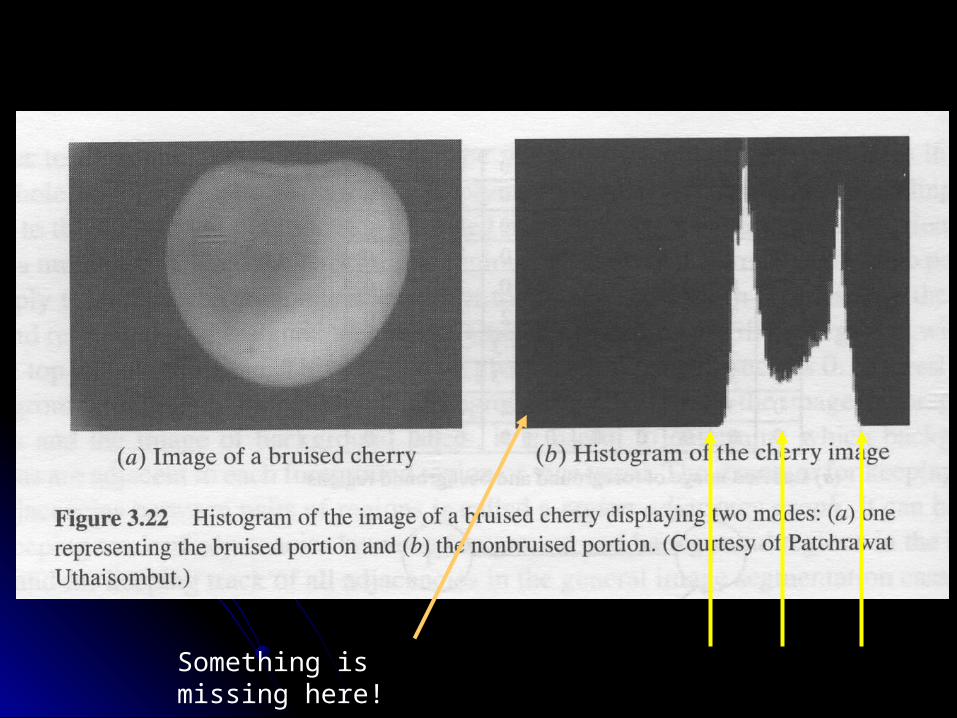
HistogramHistogram
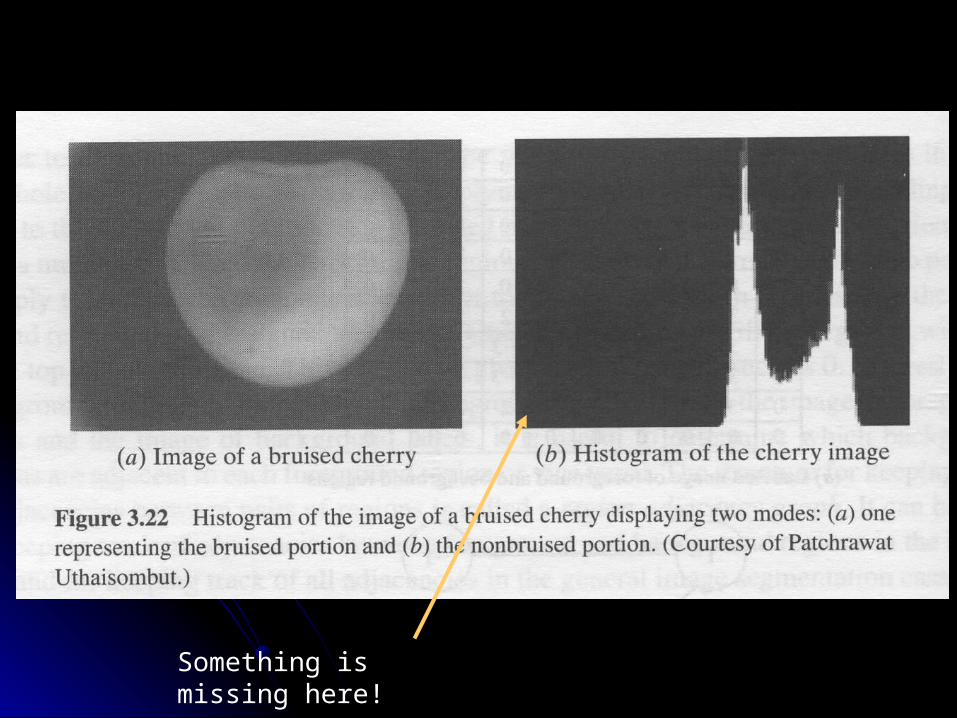
Something is missing here!

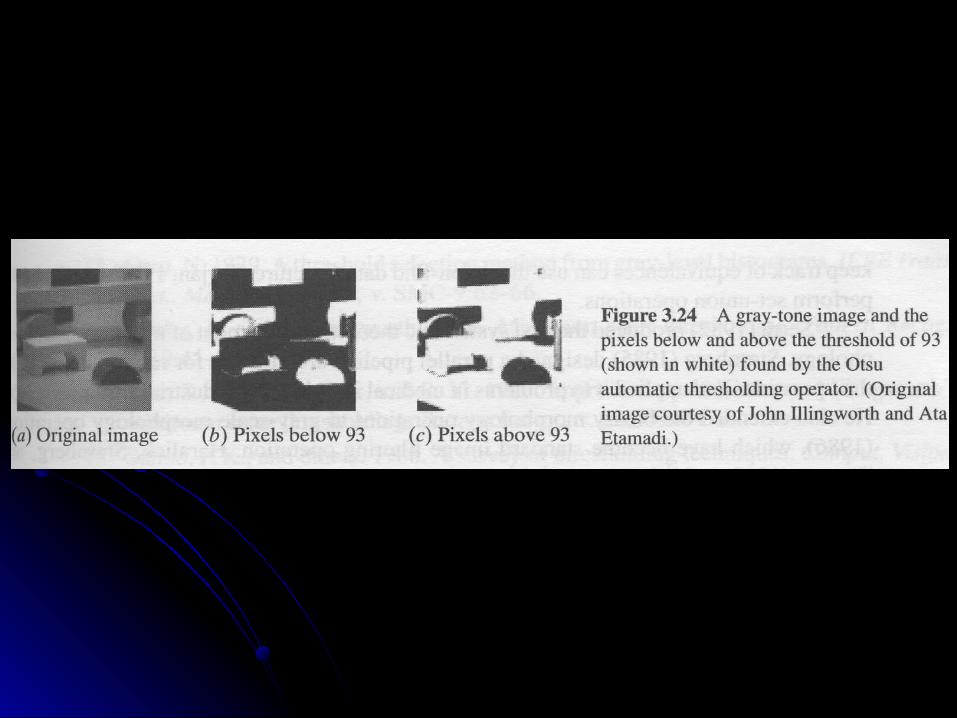
Otsu’s methodOtsu’s method
Automatic thresholding methodAutomatic thresholding method automatically picks t given an image automatically picks t given an image
histogramhistogram Assume 2 groups are present in the Assume 2 groups are present in the
image:image:1.1. Those that are <=tThose that are <=t
2.2. Those that are >tThose that are >t
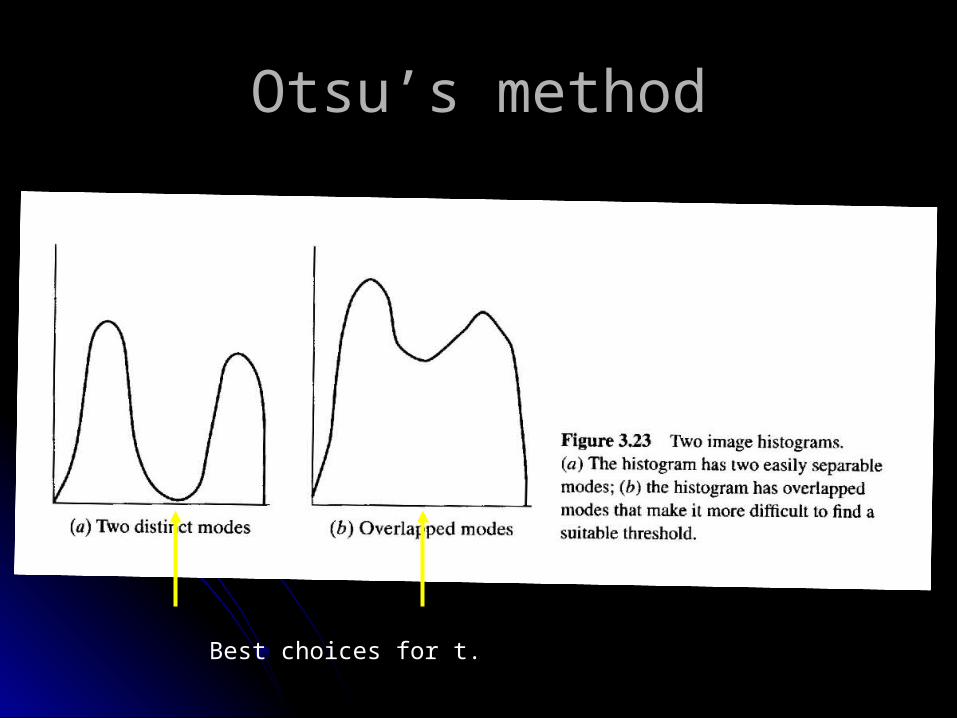
Best choices for t.
Otsu’s methodOtsu’s method
Otsu’s methodOtsu’s method
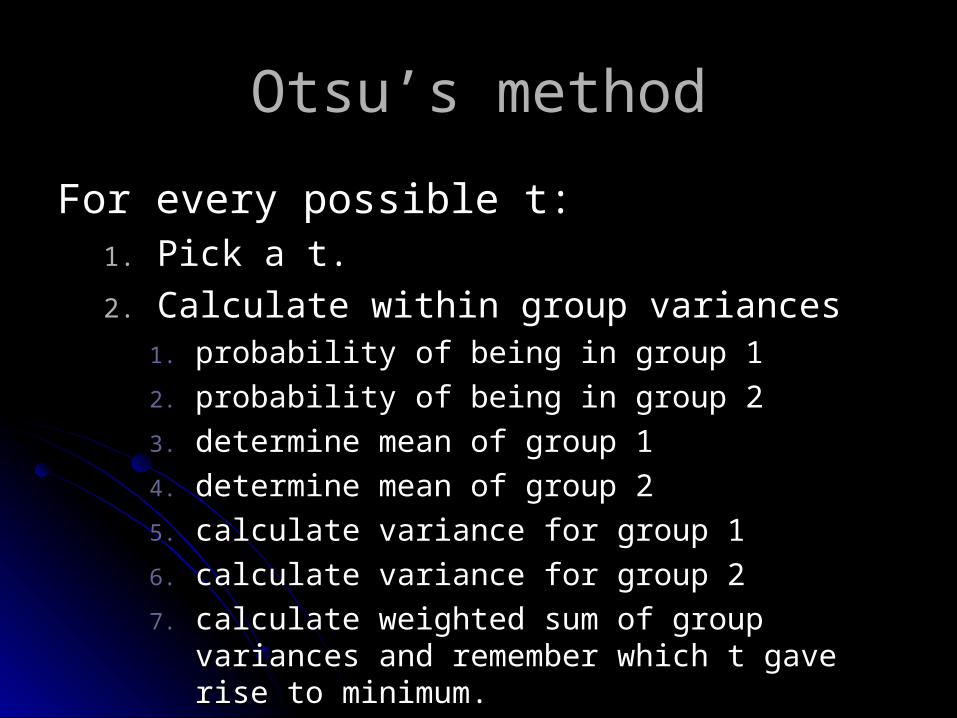
For every possible t:For every possible t:1.1. Pick a t.Pick a t.
2.2. Calculate within group variancesCalculate within group variances1.1. probability of being in group 1probability of being in group 1
2.2. probability of being in group 2probability of being in group 2
3.3. determine mean of group 1determine mean of group 1
4.4. determine mean of group 2determine mean of group 2
5.5. calculate variance for group 1calculate variance for group 1
6.6. calculate variance for group 2calculate variance for group 2
7.7. calculate weighted sum of group variances and calculate weighted sum of group variances and remember which t gave rise to minimum.remember which t gave rise to minimum.

Otsu’s method:Otsu’s method:probability of being in each groupprobability of being in each group
max
12
01
ti
t
i
iptq
iptq
Otsu’s method:Otsu’s method:mean of individual groupsmean of individual groups
max
122
011
/
/
ti
t
i
tqipit
tqipit

Otsu’s method:Otsu’s method:variance of individual groupsvariance of individual groups
max
12
22
22
01
21
21
/
/
ti
t
i
tqiptit
tqiptit

Otsu’s method:Otsu’s method:weighted sum of group variancesweighted sum of group variances
Calculate for all t’s and minimize.Calculate for all t’s and minimize.
Demo Otsu.Demo Otsu.
ttqttqtW222
211
2
max0|min 2 ttW

Generalized thresholdingGeneralized thresholding
Single range of gray valuesSingle range of gray values
const int t1=200;const int t1=200;
const int t2=500;const int t2=500;
if (G[r][c]>t1 && G[r][c]<t2)if (G[r][c]>t1 && G[r][c]<t2) B[r][c]=1;B[r][c]=1;
elseelse B[r][c]=0;B[r][c]=0;

Even more general thresholdingEven more general thresholding
Union of ranges of gray values.Union of ranges of gray values.
const int t1=200, t2=500;const int t1=200, t2=500;
const int t3=1200, t4=1500;const int t3=1200, t4=1500;
if (G[r][c]>t1 && G[r][c]<t2)if (G[r][c]>t1 && G[r][c]<t2) B[r][c]=1;B[r][c]=1;
else if (G[r][c]>t3 && G[r][c]<t4)else if (G[r][c]>t3 && G[r][c]<t4) B[r][c]=1;B[r][c]=1;
elseelse B[r]B[r][c]=0;[c]=0;
Something is missing here!
K-Means ClusteringK-Means Clustering
Clustering = the process of partitioning a Clustering = the process of partitioning a set of pattern vectors into subsets called set of pattern vectors into subsets called clusters.clusters.
K = number of clusters (known in K = number of clusters (known in advance).advance).
Not an exhaustive search so it may Not an exhaustive search so it may notnot find the globally optimal solution.find the globally optimal solution.
(see section 10.1.1)(see section 10.1.1)
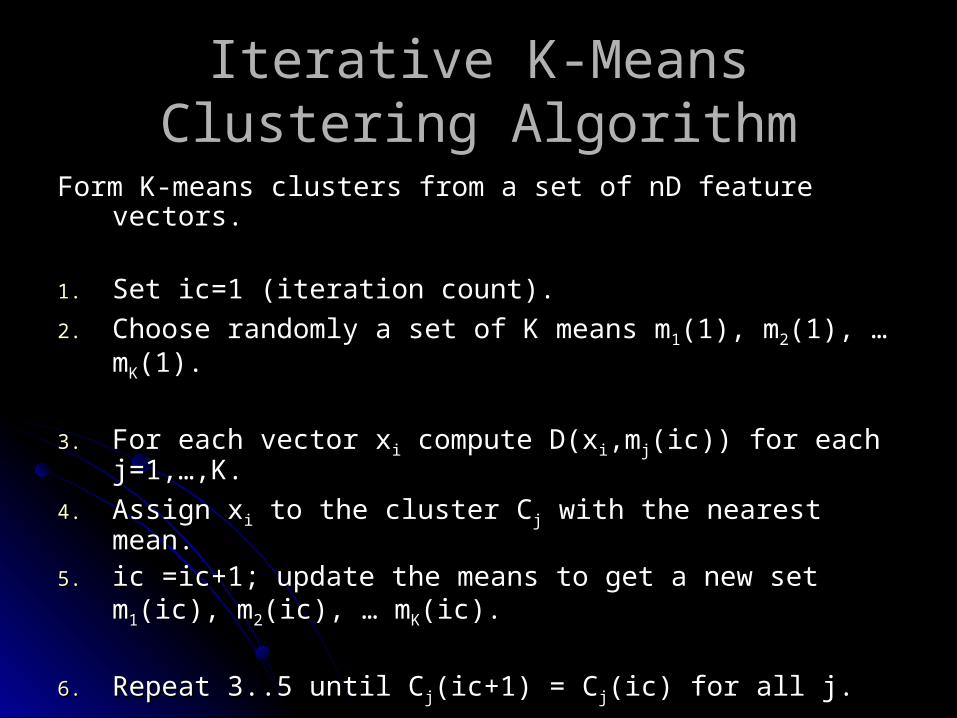
Iterative K-Means Clustering Iterative K-Means Clustering AlgorithmAlgorithm
Form K-means clusters from a set of nD feature vectors.Form K-means clusters from a set of nD feature vectors.
1.1. Set ic=1 (iteration count).Set ic=1 (iteration count).
2.2. Choose randomly a set of K means mChoose randomly a set of K means m11(1), m(1), m22(1), … (1), … mmKK(1).(1).
3.3. For each vector xFor each vector xii compute D(x compute D(xii,m,mjj(ic)) for each j=1,(ic)) for each j=1,…,K.…,K.
4.4. Assign xAssign xii to the cluster C to the cluster Cjj with the nearest mean. with the nearest mean.
5.5. ic =ic+1; update the means to get a new set mic =ic+1; update the means to get a new set m11(ic), (ic), mm22(ic), … m(ic), … mKK(ic).(ic).
6.6. Repeat 3..5 until CRepeat 3..5 until Cjj(ic+1) = C(ic+1) = Cjj(ic) for all j.(ic) for all j.
K-Means for Optimal ThresholdingK-Means for Optimal Thresholding
What are the features?What are the features?
K-Means for Optimal ThresholdingK-Means for Optimal Thresholding
What are the features?What are the features? Individual pixel gray valuesIndividual pixel gray values

K-Means for Optimal ThresholdingK-Means for Optimal Thresholding
What value for K should be used?What value for K should be used?
K-Means for Optimal ThresholdingK-Means for Optimal Thresholding
What value for K should be used?What value for K should be used?K=2 to be like Otsu’s method.K=2 to be like Otsu’s method.
Iterative K-Means Clustering Iterative K-Means Clustering AlgorithmAlgorithm
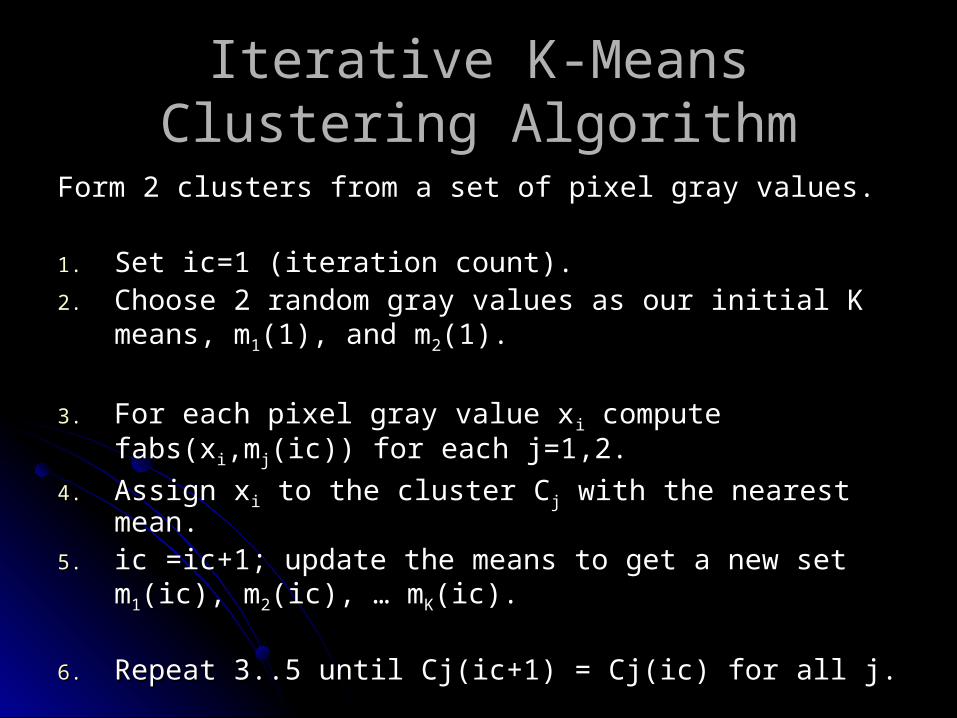
Form 2 clusters from a set of pixel gray values.Form 2 clusters from a set of pixel gray values.
1.1. Set ic=1 (iteration count).Set ic=1 (iteration count).2.2. Choose 2 random gray values as our initial K means, Choose 2 random gray values as our initial K means,
mm11(1), and m(1), and m22(1).(1).
3.3. For each pixel gray value xFor each pixel gray value xii compute fabs(x compute fabs(xii,m,mjj(ic)) for (ic)) for each j=1,2.each j=1,2.
4.4. Assign xAssign xii to the cluster C to the cluster Cjj with the nearest mean. with the nearest mean.
5.5. ic =ic+1; update the means to get a new set mic =ic+1; update the means to get a new set m11(ic), (ic), mm22(ic), … m(ic), … mKK(ic).(ic).
6.6. Repeat 3..5 until Cj(ic+1) = Cj(ic) for all j.Repeat 3..5 until Cj(ic+1) = Cj(ic) for all j.
Iterative K-Means Clustering Iterative K-Means Clustering AlgorithmAlgorithm
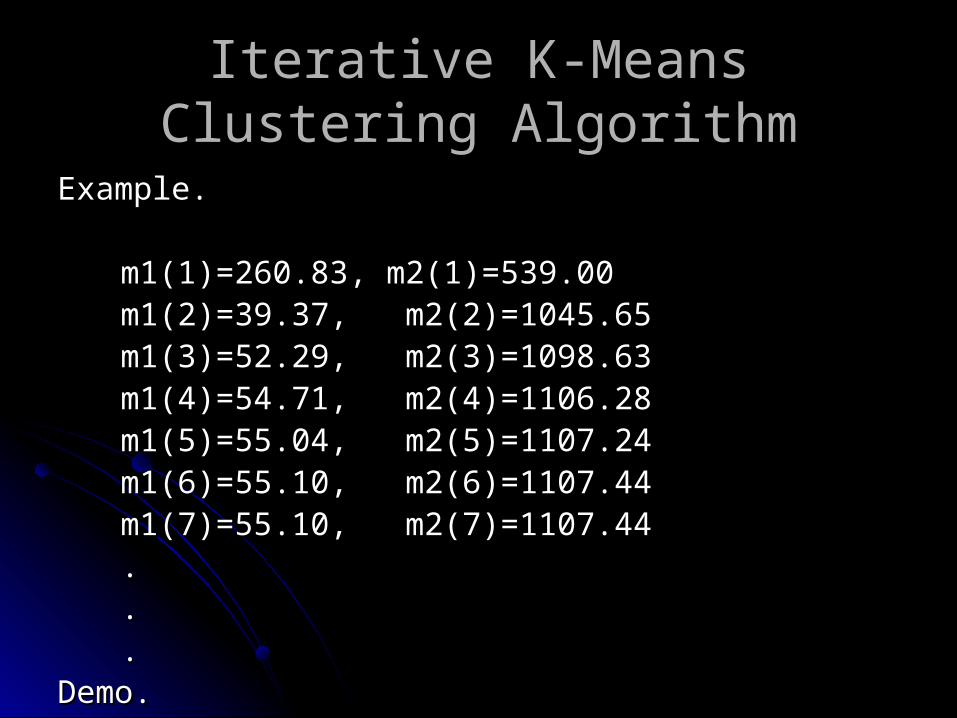
Example.Example.
m1(1)=m1(1)=260.83, m2(1)=539.00260.83, m2(1)=539.00m1(2)=39.37, m2(2)=1045.65m1(2)=39.37, m2(2)=1045.65m1(3)=52.29, m2(3)=1098.63m1(3)=52.29, m2(3)=1098.63m1(4)=54.71, m2(4)=1106.28m1(4)=54.71, m2(4)=1106.28m1(5)=55.04, m2(5)=1107.24m1(5)=55.04, m2(5)=1107.24m1(6)=m1(6)=55.10, m2(6)=1107.4455.10, m2(6)=1107.44m1(7)=55.10, m2(7)=1107.44m1(7)=55.10, m2(7)=1107.44......
Demo.Demo.