chapter 3: online mapping tools - vermont center for...
TRANSCRIPT

Chapter 3 Page 16 Intro to GIS, VT Geo. Data, and QGIS (2017)
Chapter 3: Online Mapping Tools
• Understanding Online Mapping Applications
• The VT Interactive Map Viewer
• ArcGIS Online
• Google Maps
What is an online mapping application?
An online mapping application allows users to view geographic information interactively
with functionality typical of most GIS software. Functions include, but are not limited to,
the ability to zoom, pan, search for features / addresses, and print a map while allowing
the user to set the extent of the area displayed and to decide which data layers are visible
on the map.
If you would also like to SAVE a project that you can return to later (or share with a
collaborator), please note that you should read the section on “Saving a Project” on page
26 BEFORE actually creating the map or project you wish to save! You can only save a
project if you are already logged into a separate system called ArcGIS Online.
How do online mapping applications work?
Online mapping applications use the internet to send requests (e.g. zoom in to this area,
turn off this map layer) which are then interpreted by the software residing on a server
(map will be redrawn to this extent with that layer no longer visible) which then sends a
new map image back out to the browser interface (what the user is looking at and
interacting with).
The Vermont Interactive Map Viewer (IMV)
http://maps.vermont.gov/vcgi/html5viewer/?viewer=vtmapviewer
The interface for The IMV is
typical of that found with most
GIS software packages, as it
includes a Map View area, a
list of data layers, and an area
of menus, tabs, and tools.

Chapter 3 Page 17 Intro to GIS, VT Geo. Data, and QGIS (2017)
Elements of the interface include:
The MAP VIEW is the window where the map is displayed. The map image will change
(redraw) depending on options selected.
The "Base Maps" menu is found in the upper right area of the map image,
When you click on it, you will see a list of base map choices that can appear
behind the map layers listed in the information panel. Choose a different
background by clicking on it. Keep in mind that the level of detail may change
quite a bit as you zoom in.
The blue “Quick Tools" drop down
menu should appear in the upper
left area of the map image. Click on
it to see what your options are. This
menu serves as a quick link to
popular functionality (i.e. all of this
functionality is found in various
other tools and buttons).:
Chapter 3 Page 18 Intro to GIS, VT Geo. Data, and QGIS (2017)
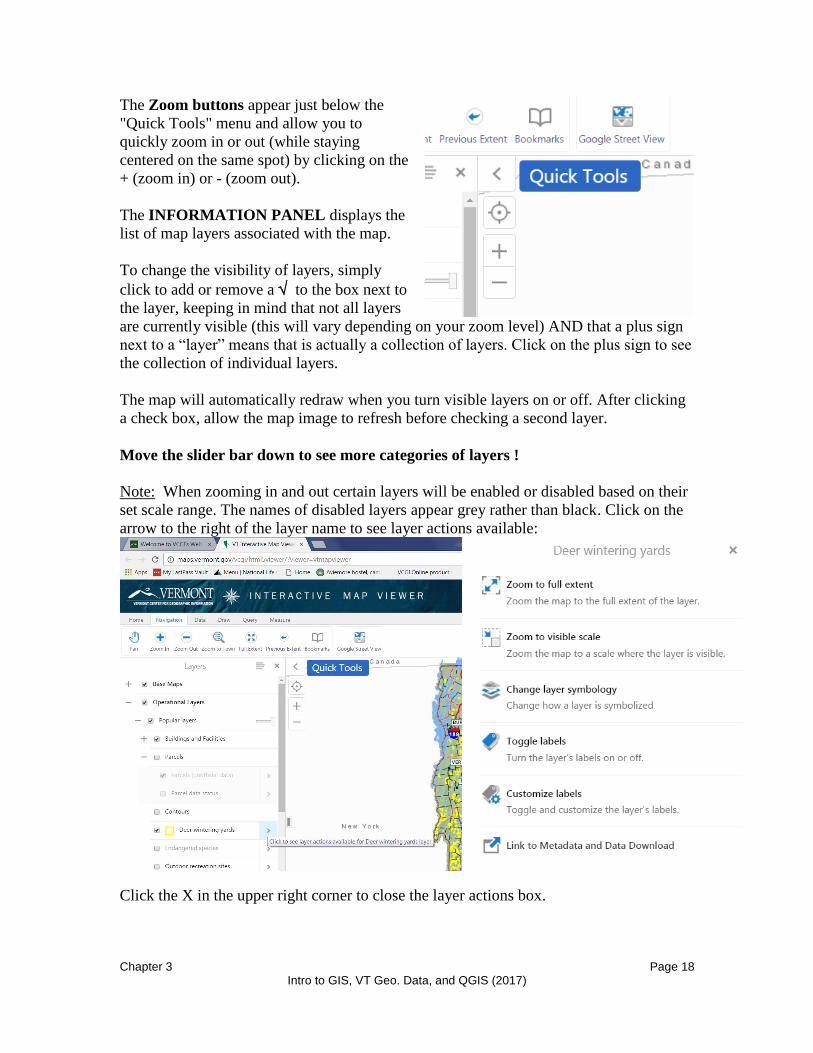
The Zoom buttons appear just below the
"Quick Tools" menu and allow you to
quickly zoom in or out (while staying
centered on the same spot) by clicking on the
+ (zoom in) or - (zoom out).
The INFORMATION PANEL displays the
list of map layers associated with the map.
To change the visibility of layers, simply
click to add or remove a to the box next to
the layer, keeping in mind that not all layers
are currently visible (this will vary depending on your zoom level) AND that a plus sign
next to a “layer” means that is actually a collection of layers. Click on the plus sign to see
the collection of individual layers.
The map will automatically redraw when you turn visible layers on or off. After clicking
a check box, allow the map image to refresh before checking a second layer.
Move the slider bar down to see more categories of layers !
Note: When zooming in and out certain layers will be enabled or disabled based on their
set scale range. The names of disabled layers appear grey rather than black. Click on the
arrow to the right of the layer name to see layer actions available:
Click the X in the upper right corner to close the layer actions box.

Chapter 3 Page 19 Intro to GIS, VT Geo. Data, and QGIS (2017)
The TABS AND TOOLS above the Map View and Information Panel enable the user
to do many things. Notice that there are 6 different TABS (Home, Navigation, Data,
Draw, Query, and Measure) with a variety of tools available within each tab. If you
hold your cursor over each tool icon a brief explanation of that tool will appear. We
will explore these tabs and tools in the next section.
If you are wondering what a symbol on
the map is you can click on the icon that
looks like three horizontal lines just to
the right of the word “layers” above the
Information Panel and then choose
Show Legend in order to see the listing
of symbology for visible layers. Click
that same icon to choose Show Layers
to return to the listing of map layers.
Mapping Exercise: locate your home or office
a) Open the IMV in a web browser making sure the browser is large enough to
see all interface features.
b) Click on the Quick Tools button and choose Zoom To Town (you can also
access this function right from the tool bar – it is in the Navigation section,
which is open by default when you first open the IMV).
c) As you begin to type the name of the town, you should be given one or more
options to choose from. Click on the name of the town you are looking for,
then click OK.

Chapter 3 Page 20 Intro to GIS, VT Geo. Data, and QGIS (2017)
d) Change the background of the map by clicking on the Basemaps icon in the
upper right corner of the Map View. Choose one of the “color imagery”
options, which means aerial photos.
e) Find the map layer group called “Buildings and Facilities,” click the plus
sign to the left to open up the group, find the map layer called “Buildings”
and click to place a check in the visibility box. Do the same to the
“Buildings Address Labels” layer.
f) Click on the arrow to the right of the Buildings Address Layers title and
choose “Zoom to Visible Scale,” then click the X in the upper right corner
of that dialog box to go back to the layers list.
g) Pan around your map by holding down the left button on your mouse and
dragging your cursor on the map until you see the address you are seeking!
Tools Within the Navigation Tab
The tool buttons in the Getting Around tab allow you to (from left to right):
• Pan – click on this icon to turn your cursor into a pan tool. Left click on the
map and drag it around, changing extent but not zoom level.
• Zoom in - click on this icon to turn your cursor into a zoom in tool. Zoom in by
drawing a box to indicate the area of interest (or clicking to zoom in a preset
amount)
• Zoom out – click on this icon to turn your cursor into a zoom out tool. Click on
map to zoom out a preset amount
• Zoom to town – click on this icon and then start to type in the name of a town.
When you see the right name being offered, click on that to actually zoom to the
town.
• Zoom to full extent - see the whole state
• Zoom to the previous extent – last extent you were at.
• Bookmarks – Opens “bookmarks view” and allows you to save a particular
extent via bookmark. For example, you might want to zoom in on your town or
Chapter 3 Page 21 Intro to GIS, VT Geo. Data, and QGIS (2017)
your property and save that extent via bookmark so you can quickly get back to
that extent.
• Google Street View – Opens a Google Street View window at the bottom of the
Map View.
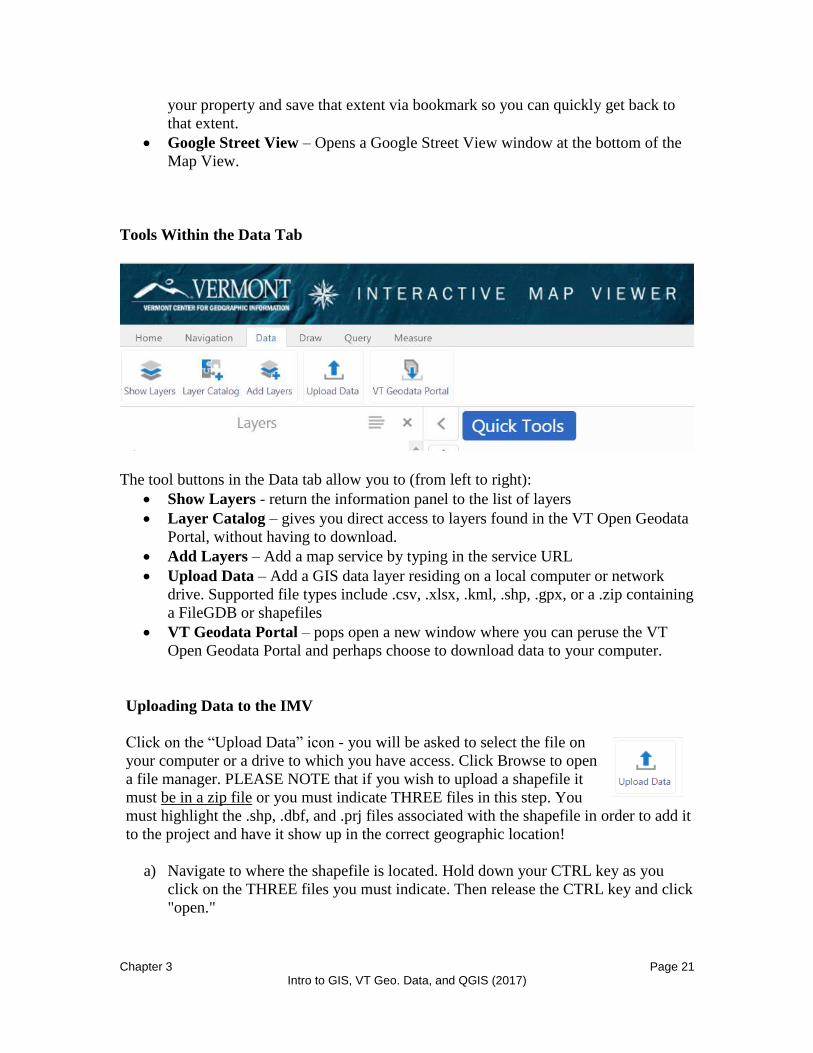
Tools Within the Data Tab
The tool buttons in the Data tab allow you to (from left to right):
• Show Layers - return the information panel to the list of layers
• Layer Catalog – gives you direct access to layers found in the VT Open Geodata
Portal, without having to download.
• Add Layers – Add a map service by typing in the service URL
• Upload Data – Add a GIS data layer residing on a local computer or network
drive. Supported file types include .csv, .xlsx, .kml, .shp, .gpx, or a .zip containing
a FileGDB or shapefiles
• VT Geodata Portal – pops open a new window where you can peruse the VT
Open Geodata Portal and perhaps choose to download data to your computer.
Uploading Data to the IMV
Click on the “Upload Data” icon - you will be asked to select the file on
your computer or a drive to which you have access. Click Browse to open
a file manager. PLEASE NOTE that if you wish to upload a shapefile it
must be in a zip file or you must indicate THREE files in this step. You
must highlight the .shp, .dbf, and .prj files associated with the shapefile in order to add it
to the project and have it show up in the correct geographic location!
a) Navigate to where the shapefile is located. Hold down your CTRL key as you
click on the THREE files you must indicate. Then release the CTRL key and click
"open."

Chapter 3 Page 22 Intro to GIS, VT Geo. Data, and QGIS (2017)
b) Click Upload in the Add Data To Map
window. Depending on the type of file you
are uploading, you will be asked to change or
confirm the name of the layer, choose or
confirm the symbology and then finally the
data layer should show up on your map!
c) The data is temporarily uploaded to the
application so that it can be viewed along
with the rest of the map. It is listed at the top
of the layer list and you can click on the
arrow to the right of the layer name to access
options like:

Chapter 3 Page 23 Intro to GIS, VT Geo. Data, and QGIS (2017)
Tools Within the Draw Tab:
a) Clicking on the Draw tab will reveal a set of drawing tools. Each tool’s
functionality can be displayed by placing your cursor over it and waiting a
moment for a descriptive label to appear. Common sense will guide your use of
most of the tools, though you will find a few tips below.
b) Click on the “Polygon” tool. Set the “Style” before you start to draw!
c) Create a polygon by clicking to set the locations of the vertices. Double click to
indicate your polygon is done (and to stop adding vertices)
d) Click on the “Erase Drawing ” tool and then click on your polygon to erase it, or
click on "Clear All Drawings."
e) Edit the drawing to change its size, move its vertices, change its style, etc.
f) Note that you can Export your drawings as a shapefile (all drawings will be
lumped into one shapefile).
Exploring the Query Tab
The Query tools allow us to specify a geographic area of interest (or particular feature) in
order to look at the attribute (tabular) data for features in that area. There are several
different ways to access the attribute data for a feature on the map.

Chapter 3 Page 24 Intro to GIS, VT Geo. Data, and QGIS (2017)
The example below involves drawing a polygon and then exploring the attribute data of
various features of the Protected Lands Layers that are contained within the area drawn.
You can use the point or line identify to choose features that intersect with the point or
line you draw. Note that you can click on any of the identify results to zoom to a
particular feature.
The next example involves simply left clicking on a particular feature (a parcel of
conserved land), which results in an information box popping up on the map.

Chapter 3 Page 25 Intro to GIS, VT Geo. Data, and QGIS (2017)
Exploring the Measurement Tab
Measurement Tools:
You can measure distance or area, and you can set
the units for those measurements. In order to
"finish" measuring, you double-click on the map.
What you have drawn plus the measurement
information will be added to the map as a drawing.
You can remove it using drawing tools.
Coordinate Tools:
If you know the coordinates of a location on the map in and wish to change your extent
to show that location, use the Plot Coordinates tool in the Measure Tab. Make sure to set
your coordinate system first!
You can also find out the coordinates of a spot on the map (and label it) by choosing Plot
Coordinates and then moving your cursor about the map or clicking on the map.

Chapter 3 Page 26 Intro to GIS, VT Geo. Data, and QGIS (2017)
What’s in the Home Tab?
You will see several options in the Home section for creating an external version of your
map:
• Print – allows you to compose a map with title, legend, notes, locator map, and
save it as a PDF or image file of a chosen size and resolution.
• Share – allows you to share a link to the IMV via social media that will call it up
for anyone who clicks on it and it will have the same extent as your map.
• Export – allows you to take a snapshot of the map view (no legend, title, etc.).
Handy for creating a simply image to insert into a document or email to someone.
The Home section also provides links to ArcGIS Online (AGO), your solution for saving
a project and coming back to it to work on it later (or to share it with a collaborator).
Saving a Project
Creating an ArcGIS Online Account
If you do not already have an organizational or public AGO account, you will need to
create one. Click on the icon that says “create account” and then click on your method of
creating the account – we recommend Enter Your Information:

Chapter 3 Page 27 Intro to GIS, VT Geo. Data, and QGIS (2017)
Once you create the account, you will re-load the Interactive Map Viewer (thereby losing
any work you have done up to that point!).
Signing In to an Existing ArcGIS Online Account
If you already have an AGO account, you can click on “sign in” in the Home section of
the IMV tools and tabs, choose ArcGIS Online, sign in (IMV will automatically re-load),
and then get started.
Saving and Opening Projects
Now that you are signed in to AGO, you can save your project or open another project
you created previously.
Clicking on Save will allow you to type a title and description for your project.
Information about your project (extent, layers turned on or off, drawings, etc.) will be
saved in your AGO account so that you can access it later, or direct others to it. (???)
Clicking on Open will allow you to choose from any previously saved IMV projects.
They will be listed in the information panel.

Chapter 3 Page 28 Intro to GIS, VT Geo. Data, and QGIS (2017)
ArcGIS Online
You can also use ArcGIS Online (AGO) as a stand-alone online mapping application.
AGO is designed to allow you to create and share custom, dynamic, online maps.
ArcGIS is a mapping software product created by ESRI. It is an expensive software
package, but ESRI’s online product, ArcGIS Online, is also available, with limited
functionality, via a free “public” account.
1. Create a public account –then sign in.
2. Click on Map
3. Follow the steps provide in the information panel!

Chapter 3 Page 29 Intro to GIS, VT Geo. Data, and QGIS (2017)
4. Decide what additional data you wish to show on your map
a. Map Notes – adding points, lines, or areas free-hand, similar to Google
Earth or Google Maps
b. Upload data – CSV, zipped shapefile, GPX
c. Search for ArcGIS Online published data

Chapter 3 Page 30 Intro to GIS, VT Geo. Data, and QGIS (2017)
d. Map Services
5. Save the map in Your Content
6. Share (embed and/or create map application)
a. Make it public if you want to embed in a web site or make an application
or story map.

Chapter 3 Page 31 Intro to GIS, VT Geo. Data, and QGIS (2017)
b. Embed: Copy and paste HTML text provided into a website, or provide it
to your webmaster.
c. Create a Web App: Many Options! Click on the template of your choice
and then Choose “Create App” if your goal is to create an App in the
cloud. “Download” is for people who want to download and customize
code that they will then insert onto their web site (a more complicated
version of embedding).

Chapter 3 Page 32 Intro to GIS, VT Geo. Data, and QGIS (2017)

Chapter 3 Page 33 Intro to GIS, VT Geo. Data, and QGIS (2017)
Google Maps
1. Use or create a Google account
2. Click on Menu to go into Your Places, Go to MAPS and click on Create Map
3. Zoom into your area of interest and either add features to the map interactively…

Chapter 3 Page 34 Intro to GIS, VT Geo. Data, and QGIS (2017)
4. …Or import KML, CSV, GPX or spreadsheet.
5. You can also change your base map!
\
Chapter 3 Page 35 Intro to GIS, VT Geo. Data, and QGIS (2017)
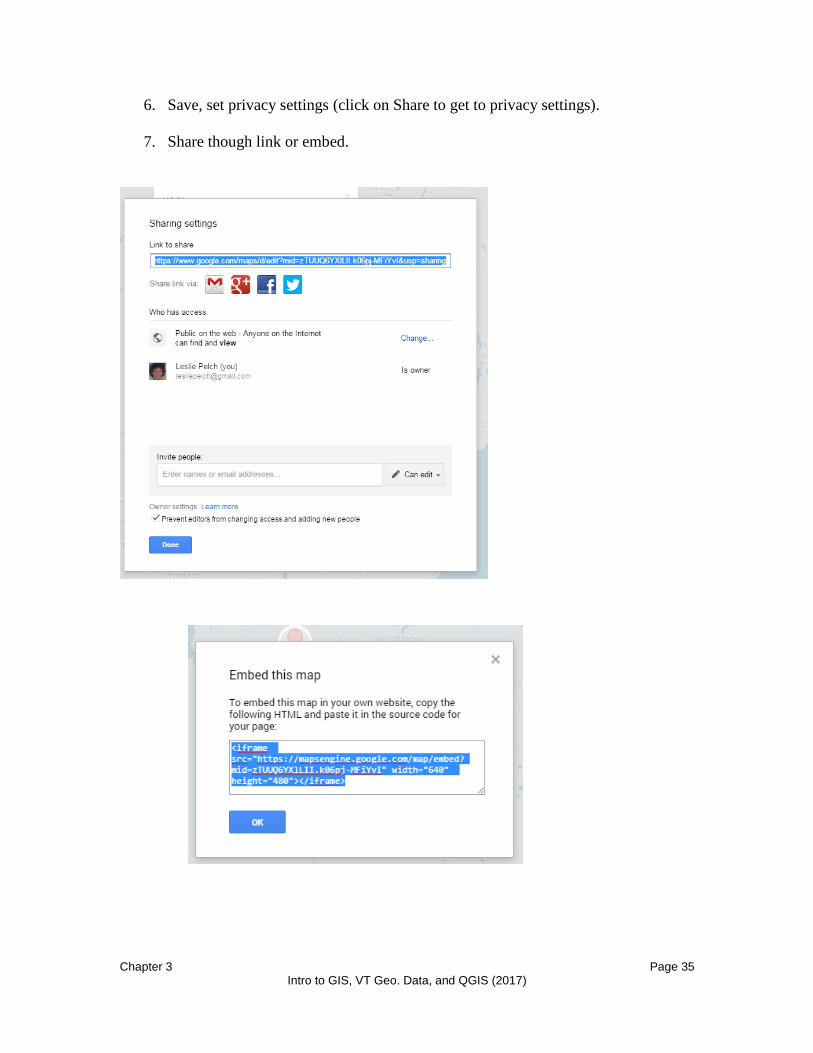
6. Save, set privacy settings (click on Share to get to privacy settings).
7. Share though link or embed.
Chapter 3 Page 36 Intro to GIS, VT Geo. Data, and QGIS (2017)
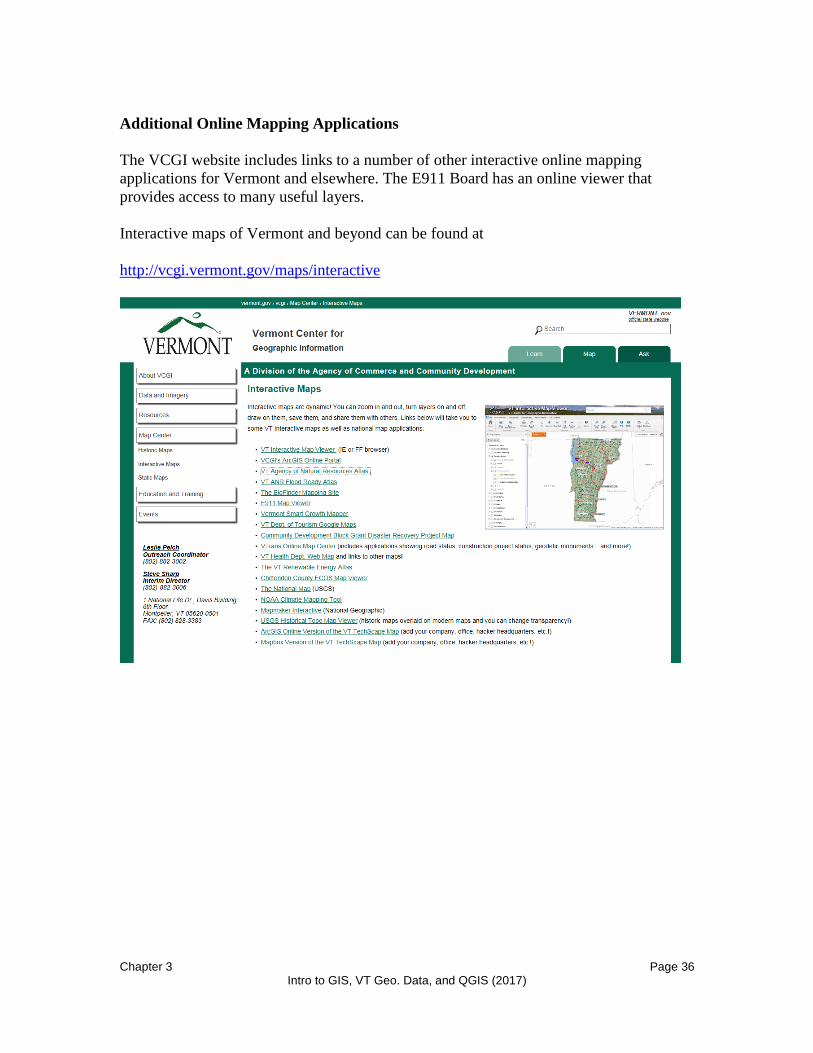
Additional Online Mapping Applications
The VCGI website includes links to a number of other interactive online mapping
applications for Vermont and elsewhere. The E911 Board has an online viewer that
provides access to many useful layers.
Interactive maps of Vermont and beyond can be found at
http://vcgi.vermont.gov/maps/interactive