chapter 4 – physical transformations of pure substances.snorthrup/chem3520/notes/chapter...
TRANSCRIPT

1
CHAPTER 4 – Physical Transformations of Pure Substances. I. Generalities.
A. Definitions:
1. A phase of a substance is a form of matter that is uniform throughout in chemical composition and physical state.
e.g., gas phase, liquid phase, and various solid phases of different atomic structure.
2. Phase transition is the spontaneous conversion of one phase into another, occurring at a characteristic temperature for given pressure.
e.g. At 1 atm, ice is the most stable phase below 0° C, but liquid is most stable above 0°C. That means ice has a lower Gibbs energy per mole than the liquid at temperatures below 0°C, etc.
3. Transition temperature Ttr is temperature at which the two phases are in equilibrium and each have the same molar Gibbs energy.
4. This chapter will concern itself with thermodynamics of phase behavior, not kinetics.
E.g., one can lower a liquid below its freezing point and yet not see the onset of the phase transition because of the slowness of the molecules in getting reorganized into an ordered phase. This would be called supercooling in this case.
5. A persistent phase which is thermodynamically not the most stable phase at the prevailing conditions is called a metastable state.
e.g. diamond is an allotrope of carbon that is thermally less stable than graphite at normal pressures, but kinetically the phase transformation is too slow to perceive.
6. The central themodynamic quantity for treating phase behavior is the chemical potential µ:
µ = (∂G/∂n)p,T
Useful for open systems, where amount n of substance is changing.
Tells how G changes with n (moles) in each phase.
7. µ of perfect gas:
Now since G(p2) = G(p1) + nRT ln p2/p1
if p1 = 1 bar (standard pressure) = pθ
and p2 = our working pressure p
then G(p) = G° + nRT ln p/pθ
2
Therefore: µ = µ° + RT ln p/pθ
Shows variation of chemical potential with pressure.
8. Chemical potential of a real gas (the fugacity):
ideal gas: µ = µ° + RT ln p/pθ
real gas: replace pressure p with the fugacity f.
f = γp (γ is the fugacity coefficient, γ ≈ 1 in most cases)
f can be viewed as the "effective pressure".
µ = µ° + RT ln f/pθ
= µ°+ RT ln p/pθ + RT ln γ where RT ln γ term is the effect of intermolecular forces and, hence,
deviations from ideality
γ ! 1 as p ! 0
γ is a measure of non-ideality and can be directly related to: - Z (compression factor) - VdW coefficients - virial coefficients
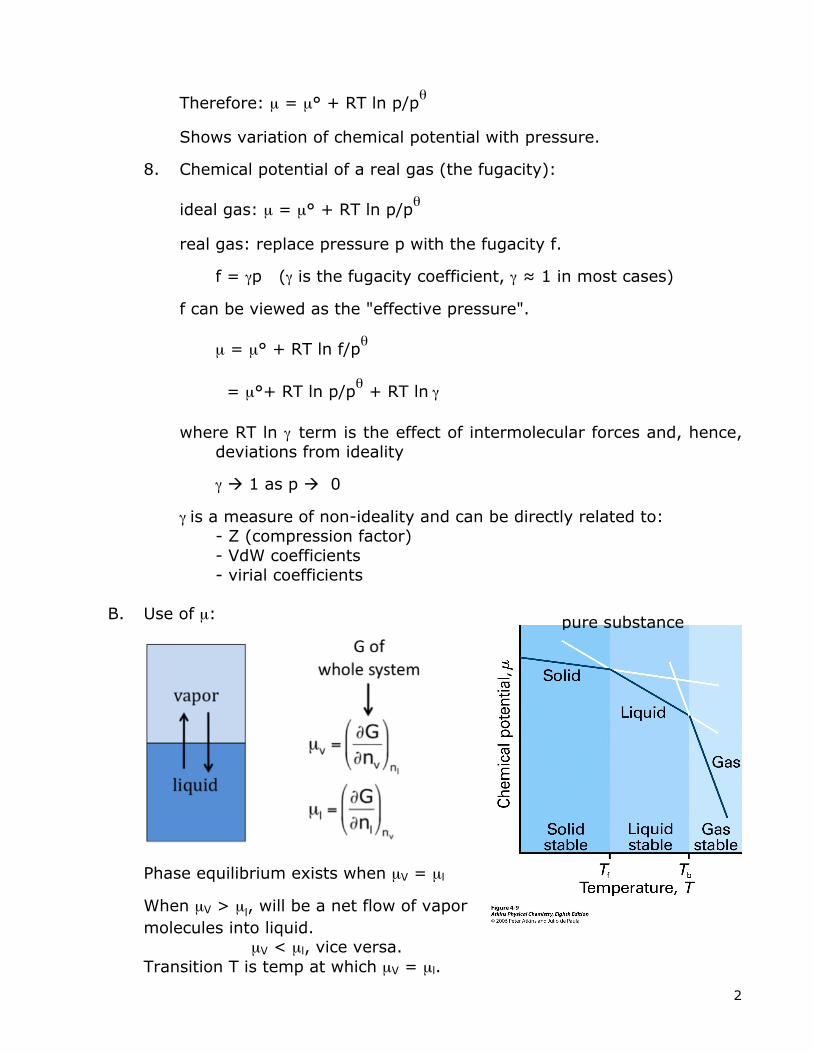
B. Use of µ:
Phase equilibrium exists when µV = µl
When µV > µl, will be a net flow of vapor molecules into liquid. µV < µl, vice versa. Transition T is temp at which µV = µl.
pure substance
3
II. Phase diagrams for pure substances.
A. General features:
1. Phase boundaries = lines on phase diagram where two phases coexist in equilibrium.
2. Triple Point = unique point where solid, liquid and vapor can coexist simultaneously in equilibrium.
µs = µl = µV
e.g., H2O T3 = 273.16K, @ p = 4.58 Torr
Also T3 is the lowest p at which liquid phase can exist.
3. Critical Point: critical temperature Tc + pc point. Tc is temperature above which cannot form a liquid at any pressure.
Figure 4-4

4
4. Vapor pressure = the pressure of the vapor phase in equilibrium with its corresponding liquid.
e.g., the liquid-vapor phase boundary from triple point to critical point thus shows how vapor pressure varies with T (governed by Clausius-Clapeyron equation)
e.g., the solid-vapor phase boundary thus shows how sublimation vapor pressure varies with T.
I2(s) "! I2(g)
5. Boiling Temperature = T at which vapor pressure of liquid equals the surrounding pressure.
Tb = normal boiling point = boiling temperature when p = 1 atm.
Line from T3 to Tc shows the boiling point of the pure substance as function of pressure above the liquid.
6. Melting (or freezing) temperature = temp at which solid and liquid coexist in equilibrium.
Tf = normal melting pt. = melting temp when pressure = 1 atm.
III. Examples of phase diagrams of pure substances. A. CO2 - a typical substance CO2 cannot exist as liquid at room pressure, since 1 atm is well below the triple point pressure of 5.11 atm Thus solid CO2 sublimes (so-called “dry ice”).

5
B. Pure H2O phase diagram Special feature of pure H2O phase diagram:
Negative slope is unorthodox. Shows that:
Melting temp↓ as p↑.
Density of solid less than liquid phase. (H2O expands as it freezes)
H-bonding network (see right)
Figure 4A.9
Figure 4A.10
6
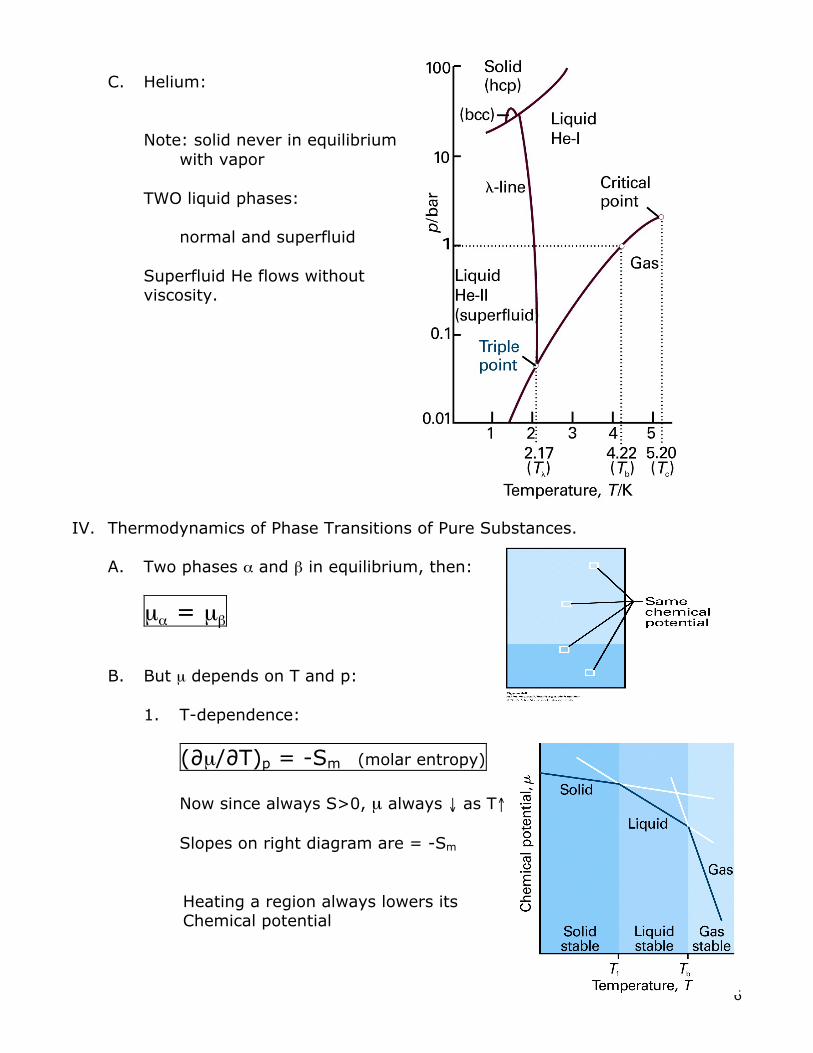
C. Helium: Note: solid never in equilibrium with vapor TWO liquid phases: normal and superfluid Superfluid He flows without viscosity.
IV. Thermodynamics of Phase Transitions of Pure Substances. A. Two phases α and β in equilibrium, then:
µα = µβ B. But µ depends on T and p:
1. T-dependence:
(∂µ/∂T)p = -Sm (molar entropy) Now since always S>0, µ always ↓ as T↑ Slopes on right diagram are = -Sm Heating a region always lowers its Chemical potential
7
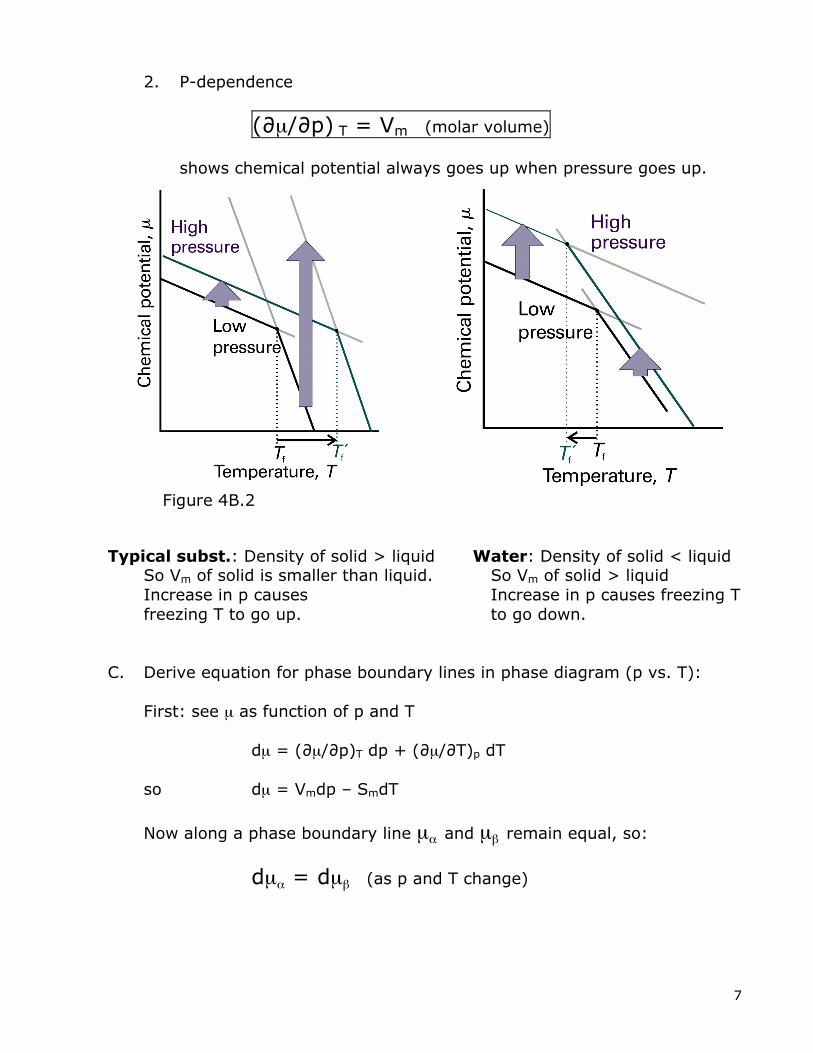
2. P-dependence
(∂µ/∂p) T = Vm (molar volume)
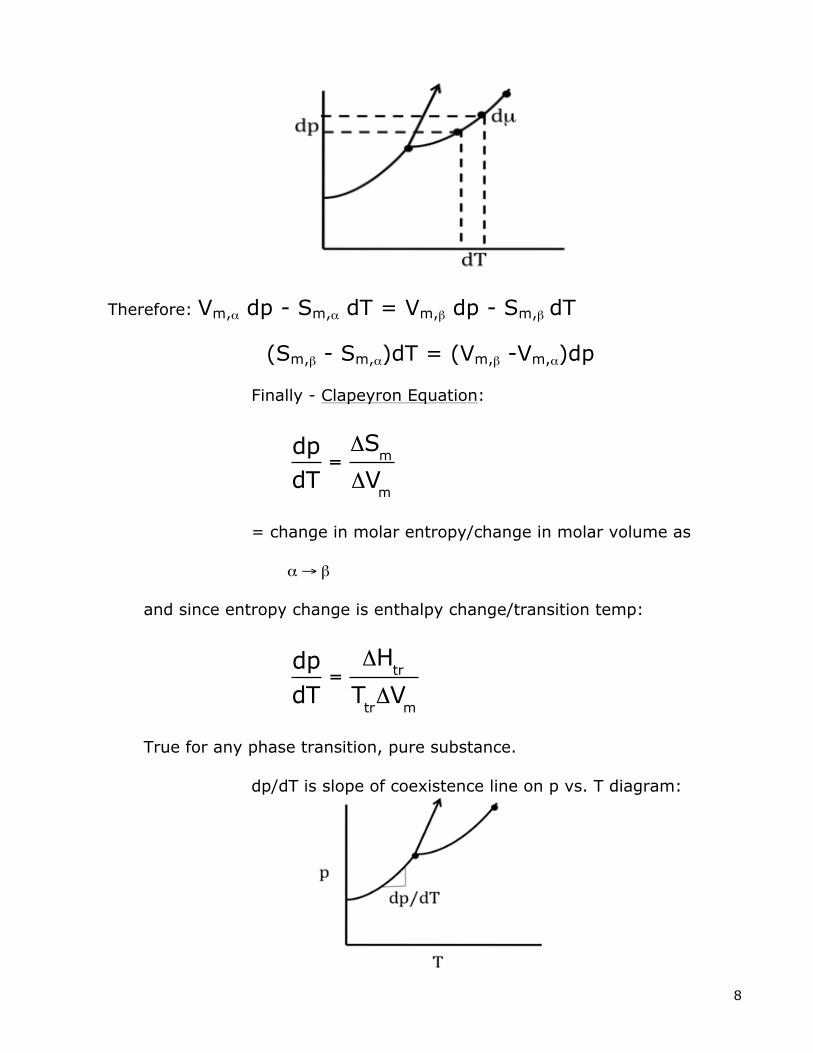
shows chemical potential always goes up when pressure goes up. Typical subst.: Density of solid > liquid Water: Density of solid < liquid So Vm of solid is smaller than liquid. So Vm of solid > liquid Increase in p causes Increase in p causes freezing T freezing T to go up. to go down. C. Derive equation for phase boundary lines in phase diagram (p vs. T): First: see µ as function of p and T dµ = (∂µ/∂p)T dp + (∂µ/∂T)p dT so dµ = Vmdp – SmdT
Now along a phase boundary line µα and µβ remain equal, so:
dµα = dµβ (as p and T change)
Figure 4B.2
8
Therefore: Vm,α dp - Sm,α dT = Vm,β dp - Sm,β dT
(Sm,β - Sm,α)dT = (Vm,β -Vm,α)dp
Finally - Clapeyron Equation:
dpdT
=ΔS
m
ΔVm
= change in molar entropy/change in molar volume as α → β and since entropy change is enthalpy change/transition temp:
dpdT
=ΔH
tr
TtrΔV
m
True for any phase transition, pure substance. dp/dT is slope of coexistence line on p vs. T diagram:

9
D. The solid-liquid line: Replace ΔSm with ΔHfus/T.
dpdT
=ΔH
fus
TfΔV
m
typical behavior on right ΔHfus > 0 melting requires energy (endothermic) ΔVfus > 0 for most substances (liquid less dense and occupies larger volume than solid) Now we understand H2O slope: For H2O, ΔVfus < 0 solid occupies larger volume than liquid dp/dT = +/- = (-)
negative slope exaggerated here
Figure 4-16
10
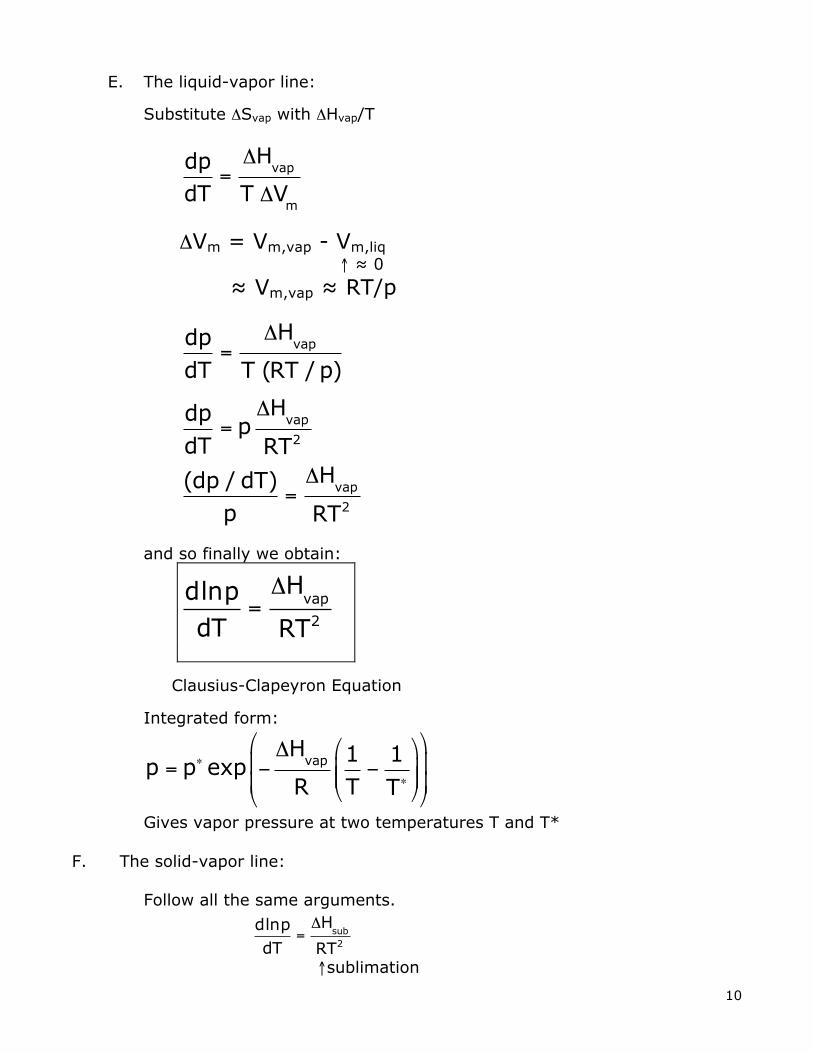
E. The liquid-vapor line:
Substitute ΔSvap with ΔHvap/T
dpdT
=ΔH
vap
T ΔVm
ΔVm = Vm,vap - Vm,liq ↑ ≈ 0
≈ Vm,vap ≈ RT/p
dpdT
=ΔH
vap
T (RT / p)
dpdT
= pΔH
vap
RT2
(dp / dT)p
=ΔH
vap
RT2
and so finally we obtain:
dlnpdT
=ΔH
vap
RT2
Clausius-Clapeyron Equation
Integrated form:
p = p∗ exp −
ΔHvap
R1T−1T∗
$
%&&
'
())
$
%
&&
'
(
))
Gives vapor pressure at two temperatures T and T*
F. The solid-vapor line: Follow all the same arguments.
dlnpdT
=ΔH
sub
RT2
↑sublimation

11
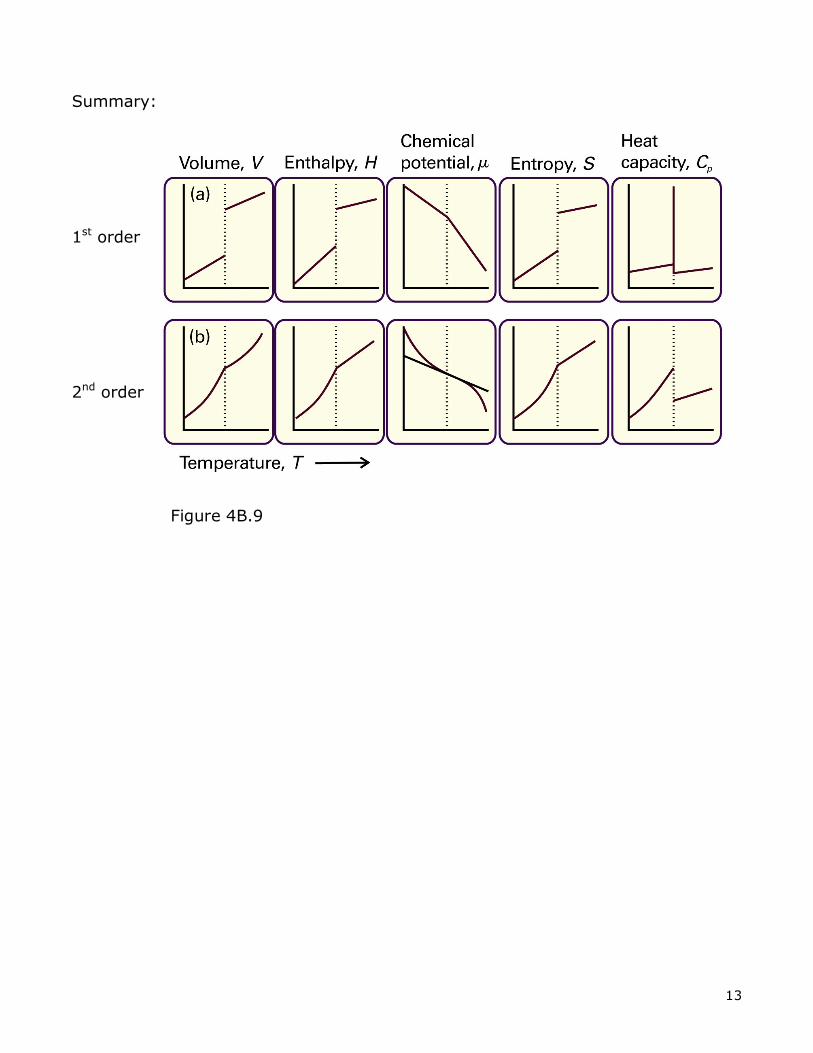
V. Types of Phase Transitions (Ehrenfest’s classification)
A. First order - most melting, vaporization are examples. 1st derivative of µ vs T are discontinuous at transition. Slope changes!
e.g. Volume:
Similarly H:
T
µ

12
B. Second-order - order-disorder transitions, ferromagnetism. 1st derivative of µ vs T is continuous. 2nd derivative is discontinuous.
ΔV = 0 at transition:
gel → liquid crystal in lipid bilayers.
T
µ
T
V
T
Cp
Τλ
grows before trans
Figure 4B.10
13
Summary: 1st order 2nd order
Figure 4B.9

14
Notes: