chapter 4 chapter 4 the lithosphere copyright © 2013 elsevier inc. all rights reserved
TRANSCRIPT

Chapter 4Chapter 4
The Lithosphere
Copyright © 2013 Elsevier Inc. All rights reserved.

Copyright © 2013 Elsevier Inc. All rights reserved.
FIGURE 4.1 Silicate minerals are divided into two classes, the ferromagnesian series and the felsic series, based on the presence of Mg or Al in the crystal structure. Among the ferromagnesian series, minerals that exist as isolated crystal units (e.g., olivine) are most susceptible to weathering, while those showing linkage of crystal units and a lower ratio of oxygen to silicon are more resistant. Among the felsic series, Ca-feldspar (plagioclase) is more susceptible to weathering than Na-feldspar (albite) and K-feldspar (orthoclase). Quartz is the most resistant of all. This weathering series is the reverse of the order in which these minerals are precipitated during the cooling of magma.
2

Copyright © 2013 Elsevier Inc. All rights reserved.
FIGURE 4.2 Loss of silicon (SiO2) in runoff as a function of mean annual temperature and precipitation in
various areas of the world. Source: Modified from White and Blum (1995).
3

Copyright © 2013 Elsevier Inc. All rights reserved.
FIGURE 4.3 The relationship between the mean concentration of CO2 in the soil pore space and the actual
evapotranspiration of the site for various ecosystems of the world. Source: From Brook et al. (1983).
4

Copyright © 2013 Elsevier Inc. All rights reserved.
FIGURE 4.4 Dissolution of Ca-feldspar (plagioclase) as a function of soil CO2 concentrations in watersheds of
the Sierra Nevada (California), subject to differential hydrothermal activity. Source: From Navarre-Sitchler and Thyne (2007).
5

Copyright © 2013 Elsevier Inc. All rights reserved.
FIGURE 4.5 Soil temperature and pore-space CO2 concentration (mean ±S.E.) as a function of depth in control
and experimentally heated (+ 5oC) plots in a hardwood forest in Massachusetts. Source: From unpublished work of Megonigal.
6
Copyright © 2013 Elsevier Inc. All rights reserved.
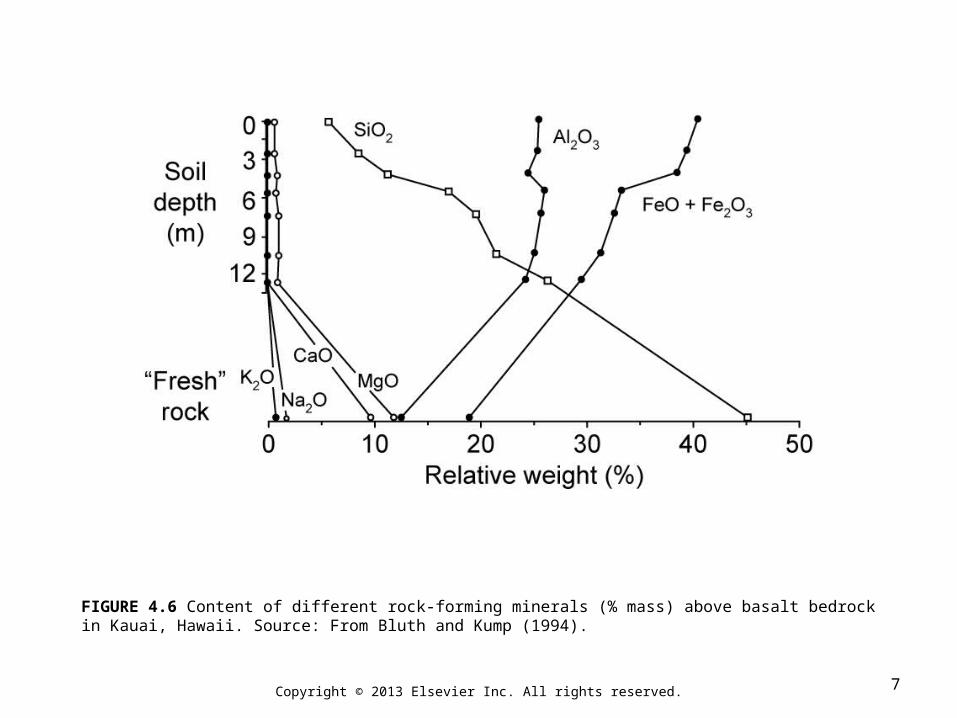
FIGURE 4.6 Content of different rock-forming minerals (% mass) above basalt bedrock in Kauai, Hawaii. Source: From Bluth and Kump (1994).
7

Copyright © 2013 Elsevier Inc. All rights reserved.
FIGURE 4.7 The solubility of aluminum as a function of pH. For pH in the neutral range, gibbsite [Al(OH)3]
controls aluminum solubility, and there is little Al+ 3 in solution. Al+ 3 becomes more soluble at pH < 4.7. Source: From Lindsay (1979).
8

Copyright © 2013 Elsevier Inc. All rights reserved.
FIGURE 4.8 Variation in surface charge on iron and aluminum hydroxides as a function of pH of the soil solution. Source: From Johnson and Cole (1980).
9
Copyright © 2013 Elsevier Inc. All rights reserved.
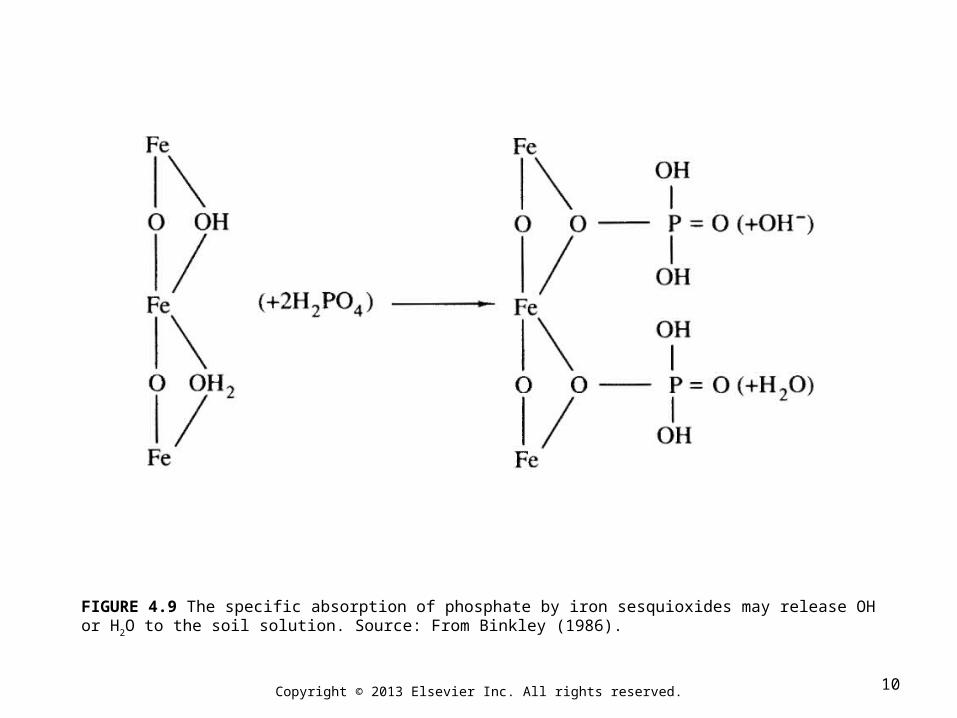
FIGURE 4.9 The specific absorption of phosphate by iron sesquioxides may release OH or H2O to the soil
solution. Source: From Binkley (1986).
10

Copyright © 2013 Elsevier Inc. All rights reserved.
FIGURE 4.10 The solubility of phosphorus in the soil solution as a function of pH. Precipitation with Al sets the upper limit on dissolved phosphate at low pH (bold line); precipitation with Ca sets a similar limit at high pH. Phosphorus is most available at a pH of about 7.0. Modified from Lindsay and Vlek (1977).
11

Copyright © 2013 Elsevier Inc. All rights reserved.
FIGURE 4.11 Changes in the forms of phosphorus found during soil development on sand dunes in New Zealand. Source: Modified from Walker and Syers (1976).
12
Copyright © 2013 Elsevier Inc. All rights reserved.
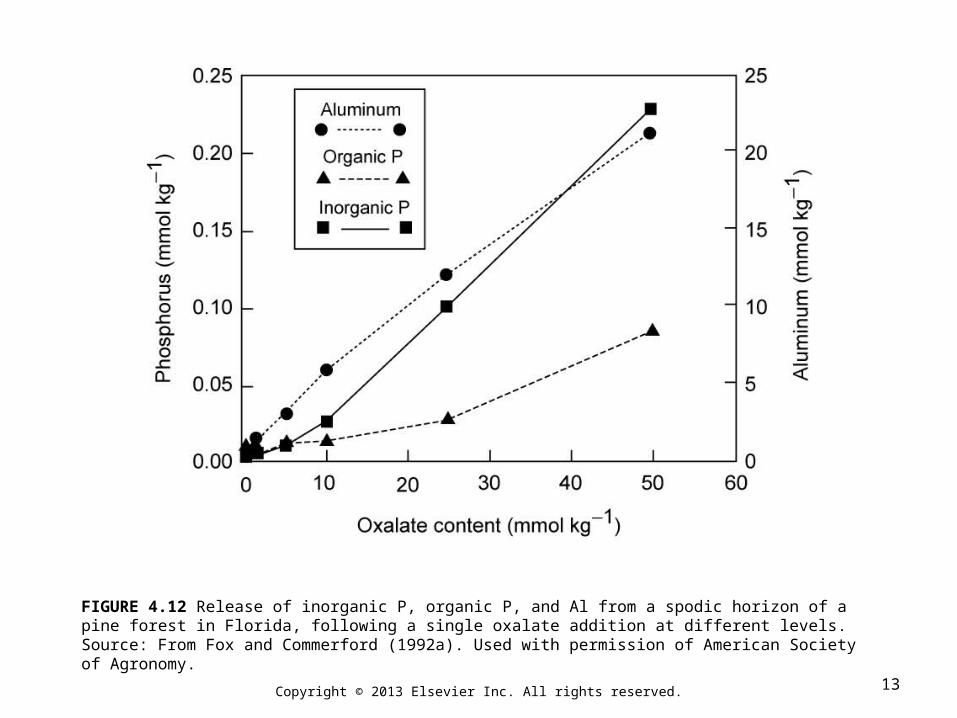
FIGURE 4.12 Release of inorganic P, organic P, and Al from a spodic horizon of a pine forest in Florida, following a single oxalate addition at different levels. Source: From Fox and Commerford (1992a). Used with permission of American Society of Agronomy.
13

Copyright © 2013 Elsevier Inc. All rights reserved.
FIGURE 4.13 Soil profile, Nyanget, Svartberget Forest Research Station, north Sweden, showing the E- (whitish) and B-horizons. The scale is in decimeters. The role of biology in the process of podzolization is exemplified by the removal of Al and Fe minerals from the E-horizon in complexes with organic acids and their precipitation as oxides in the B-horizon. Source: From Lundström et al. (2000b).
14

Copyright © 2013 Elsevier Inc. All rights reserved.
FIGURE 4.14 Changes in Si-to-sesquioxide ratio during the long-term development of soils in the southeastern United States (Markewitz and Pavich 1991). The data are recalculated from Markewitz et al. (1989)
15

Copyright © 2013 Elsevier Inc. All rights reserved.
FIGURE 4.15 Depth-to-peak content of clay in the soil profile, an index of weathering and soil development, decreases from east to west across the Great Plains of the United States as a function of the decrease in mean annual precipitation. Source: From Honeycutt et al. (1990). Used with permission of American Society of Agronomy.
16

Copyright © 2013 Elsevier Inc. All rights reserved.
FIGURE 4.16 Depth to CaCO3 in desert soils of Arizona, as a function of mean annual precipitation. The dashed
line shows the prediction from the CALDEP model using current precipitation regimes. The solid line shows the best fit to actual data reported from the field. The dotted line shows the predictions when the model is run with postulated climatic data from the latest Pleistocene pluvial period. Source: Modified from Marion et al. (1985).
17

Copyright © 2013 Elsevier Inc. All rights reserved.
FIGURE 4.17 Annual stream water loss of major cations as a function of the stream discharge in different years in the Hubbard Brook Experimental Forest in New Hampshire. Source: From Likens and Bormann 1995a).
18

Copyright © 2013 Elsevier Inc. All rights reserved.
FIGURE 4.18 Variation in the concentration of total dissolved solids (solid line) and the total annual transport of dissolved substances (dashed line, shown without data) for various streams in Kenya as a function of mean annual runoff. Source: From Dunne and Leopold (1978). Used with permission of Springer-Verlag.
19

Copyright © 2013 Elsevier Inc. All rights reserved.
FIGURE 4.19 Variations in the total dissolved solids in rivers and lakes as a function of the ratio of Cl/(Cl + HCO3) in their waters. Source: From Gibbs (1970). Used with permission of the American Association for the
Advancement of Science.
20
Copyright © 2013 Elsevier Inc. All rights reserved.
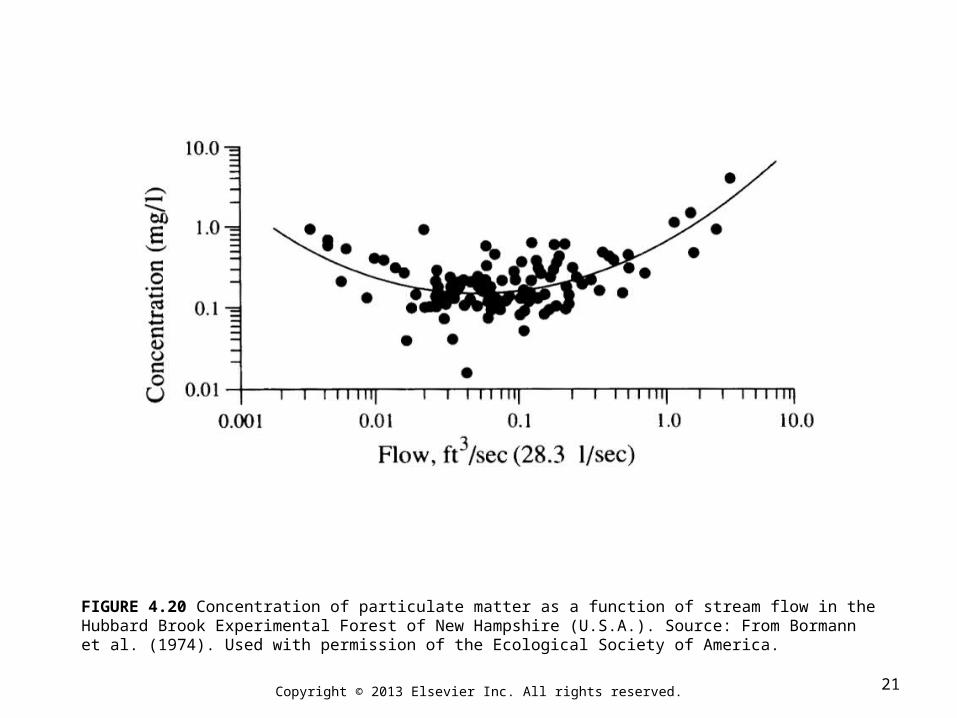
FIGURE 4.20 Concentration of particulate matter as a function of stream flow in the Hubbard Brook Experimental Forest of New Hampshire (U.S.A.). Source: From Bormann et al. (1974). Used with permission of the Ecological Society of America.
21

Copyright © 2013 Elsevier Inc. All rights reserved.
FIGURE 4.21 Rate at which surficial materials are mobilized from the Earth's crust (Gt/yr = 1015 g/yr) in grid cells measuring 1 × 1° latitude and longitude by humans (A) and rivers (B). The massive mobilization of crustal materials in the eastern United States is largely the result of surface mining for coal (Hooke 1999).
22

Copyright © 2013 Elsevier Inc. All rights reserved.
TABLE 4.1 Approximate Mean Composition of Earth’s Continental Crust
23

Copyright © 2013 Elsevier Inc. All rights reserved.
TABLE 4.2 Chemical Composition of Precipitation, Soil Solutions, and Groundwater in a 175-year-old Abiesamabilis Stand in Northern Wastington
24

Copyright © 2013 Elsevier Inc. All rights reserved.
TABLE 4.3 Silicon/Sesquioxide (Al 2O3 þ Fe2O3) Ratios for the A- and B-Horizons of Some Soils in Different
Climatic Regions
25

Copyright © 2013 Elsevier Inc. All rights reserved.
TABLE 4.4 Calculation of the Rate of Primary Mineral Weathering, Using the Stream Water Losses and Mineral Concentrations of Cationic Elements
26

Copyright © 2013 Elsevier Inc. All rights reserved.
TABLE 4.5 Input and Outputs of Elements from Hubbard Brook Experimental Forest
27

Copyright © 2013 Elsevier Inc. All rights reserved.
TABLE 4.6 Net Transport (export minus atmospheric decposition) of Major Ions, Soluble Silica, and Suspended Solids from Various Watersheds of Forested Ecosyterms
28

Copyright © 2013 Elsevier Inc. All rights reserved.
TABLE 4.7 Mean Composition of Dissolved Ions in River Waters of the World
29

Copyright © 2013 Elsevier Inc. All rights reserved.
TABLE 4.8 Chemical and Mechanical Denudation of the Continents
30

Copyright © 2013 Elsevier Inc. All rights reserved.
TABLE 4.9 Sources of Major Elements in World River Waters (in percent of actual concentrations)
31

Copyright © 2013 Elsevier Inc. All rights reserved.
TABLE 4.10 Loss or Gain of major Elements during Chemical Weathering
32
Copyright © 2013 Elsevier Inc. All rights reserved.
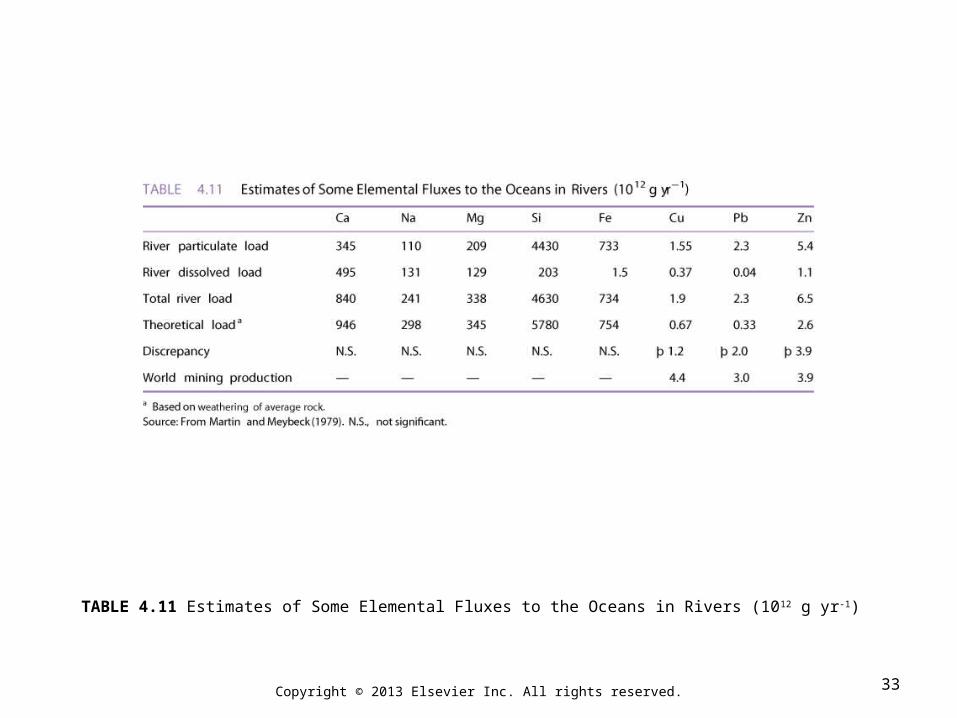
TABLE 4.11 Estimates of Some Elemental Fluxes to the Oceans in Rivers (1012 g yr-1)
33