chapter 4 common stocks - its.caltech.edurosentha/courses/bem103/readings/jwch04.pdf · fall 2006 c...
TRANSCRIPT

Chapter 4
Common Stocks
Road Map
Part A Introduction to finance.
Part B Valuation of assets, given discount rates.
• Fixed-Income securities.
• Stocks.
• Real asset (capital budgeting).
Part C Determination of risk-adjusted discount rates.
Part D Introduction to derivatives.
Main Issues
• Introduction to Stock Markets
• Discounted Cash Flow Model (DCF)
• Modelling Cash Flows
• EPS, P/E and Growth Opportunities
Chapter 4 Common Stocks 4-1
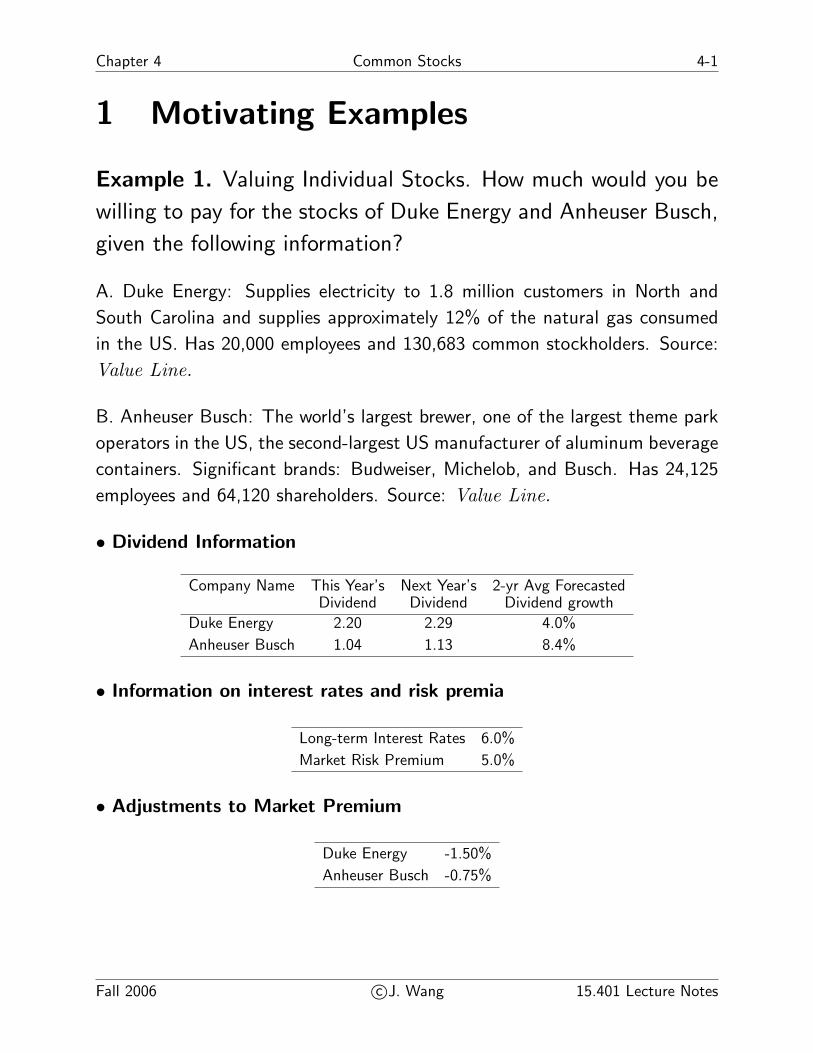
1 Motivating Examples
Example 1. Valuing Individual Stocks. How much would you be
willing to pay for the stocks of Duke Energy and Anheuser Busch,
given the following information?
A. Duke Energy: Supplies electricity to 1.8 million customers in North and
South Carolina and supplies approximately 12% of the natural gas consumed
in the US. Has 20,000 employees and 130,683 common stockholders. Source:
Value Line.
B. Anheuser Busch: The world’s largest brewer, one of the largest theme park
operators in the US, the second-largest US manufacturer of aluminum beverage
containers. Significant brands: Budweiser, Michelob, and Busch. Has 24,125
employees and 64,120 shareholders. Source: Value Line.
• Dividend Information
Company Name This Year’s Next Year’s 2-yr Avg ForecastedDividend Dividend Dividend growth
Duke Energy 2.20 2.29 4.0%
Anheuser Busch 1.04 1.13 8.4%
• Information on interest rates and risk premia
Long-term Interest Rates 6.0%
Market Risk Premium 5.0%
• Adjustments to Market Premium
Duke Energy -1.50%
Anheuser Busch -0.75%
Fall 2006 c©J. Wang 15.401 Lecture Notes
4-2 Common Stocks Chapter 4
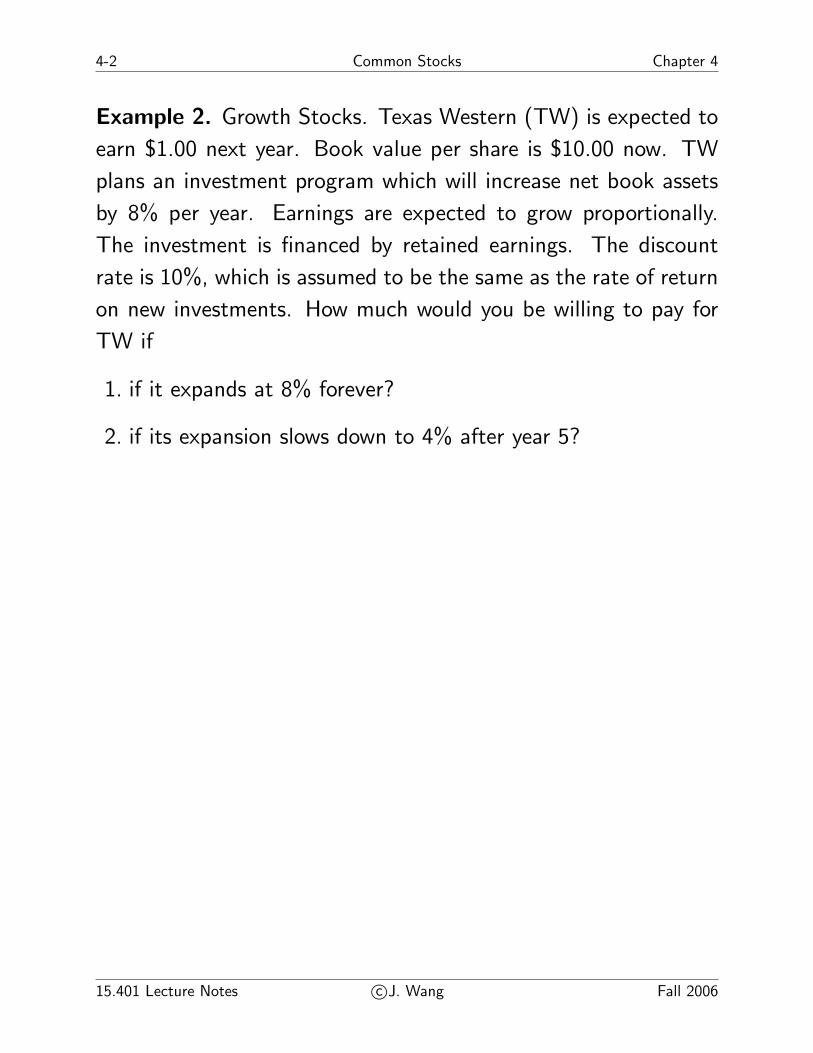
Example 2. Growth Stocks. Texas Western (TW) is expected to
earn $1.00 next year. Book value per share is $10.00 now. TW
plans an investment program which will increase net book assets
by 8% per year. Earnings are expected to grow proportionally.
The investment is financed by retained earnings. The discount
rate is 10%, which is assumed to be the same as the rate of return
on new investments. How much would you be willing to pay for
TW if
1. if it expands at 8% forever?
2. if its expansion slows down to 4% after year 5?
15.401 Lecture Notes c©J. Wang Fall 2006

Chapter 4 Common Stocks 4-3
2 Introduction to Stock Markets
Definition: Common stock represents equity, an ownership posi-
tion, in a corporation.
• Payments to common stock are dividends:
– Cash dividend.
– Stock dividend.
• Contrary to payments to bondholders, payments to stockhold-
ers are uncertain in both magnitude and timing.
• Important characteristics of common stock:
1. Residual claim - stockholders have claim to firm’s cash
flows/assets after all obligations to creditors are met.
2. Limited liability - stockholders may lose their investments,
but no more.
3. Voting rights - Stockholders are entitled to vote for the
board of directors and on other matters.
Fall 2006 c©J. Wang 15.401 Lecture Notes
4-4 Common Stocks Chapter 4
Organization of Stock Markets
1. Primary market - underwriting
• Venture capital: A company issues shares to investment
partnerships, investment institutions and wealthy individu-
als.
• Initial public offering (IPO): A company issues shares to
general public for the first time (i.e., going public).
• Secondary offerings: A public company issues additional
shares.
Stock issuing to the public is usually organized by investment
bank who act an underwriters.
2. Secondary market (resale market) - Exchanges and OTC.
• Exchanges: NYSE, AMEX, ECNs, . . .
- Specialist.
- Electronic.
• OTC: NASDAQ.
3. Trading in secondary market.
• Trading costs: commission, bid-ask spread, price impact.
• Buy on margin.
• Long and short.
15.401 Lecture Notes c©J. Wang Fall 2006
Chapter 4 Common Stocks 4-5
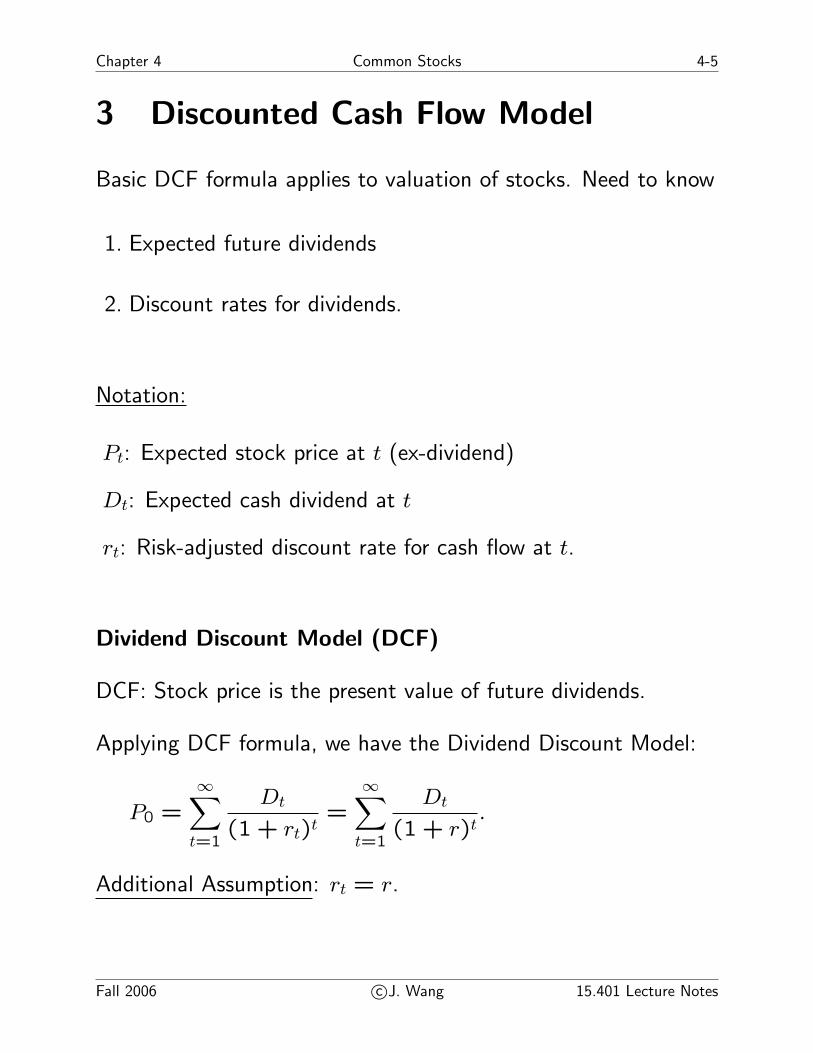
3 Discounted Cash Flow Model
Basic DCF formula applies to valuation of stocks. Need to know
1. Expected future dividends
2. Discount rates for dividends.
Notation:
Pt: Expected stock price at t (ex-dividend)
Dt: Expected cash dividend at t
rt: Risk-adjusted discount rate for cash flow at t.
Dividend Discount Model (DCF)
DCF: Stock price is the present value of future dividends.
Applying DCF formula, we have the Dividend Discount Model:
P0 =∞∑
t=1
Dt
(1 + rt)t=
∞∑t=1
Dt
(1 + r)t.
Additional Assumption: rt = r.
Fall 2006 c©J. Wang 15.401 Lecture Notes

4-6 Common Stocks Chapter 4
Valuation Based on Finite Holding Period
1. Stock price at t = 0:
P0 =D1
1 + r+
P1
1 + r.
2. What determines P1?
P1 =D2
1 + r+
P2
1 + r.
3. Thus,
P0 =D1
1 + r+
1
1 + r
(D2 + P2
1 + r
)
=D1
1 + r+
D2
(1 + r)2+
P2
(1 + r)2
=∞∑
t=1
Dt
(1 + r)t.
Observation: DCF does not require holding the stock forever.
Applications of DCF involve further information on
1. Future dividends
2. Discount rates.
We focus on (1) first and return to (2) later (in Part C).
15.401 Lecture Notes c©J. Wang Fall 2006

Chapter 4 Common Stocks 4-7
4 Modelling Cash Flows
4.1 DCF with Constant Growth
Suppose that dividends are expected to grow at a constant rate g
in perpetuity. That is
Dt+1 = (1 + g) × Dt.
Then
P0 =∞∑
t=1
Dt
(1 + r)t=
∞∑t=1
(1 + g)t−1
(1 + r)tD1
=D1
r − gif r > g.
This is the Gordon Model:
P0 =D1
r − g=
1 + g
r − gD0.
Example 1. Dividends are expected to grow at 6% per year and
the current dividend is $1 per share. The expected rate of return
is 20%. The current stock price should be
P0 =1.06
0.20 − 0.06× 1 = $7.57.
Fall 2006 c©J. Wang 15.401 Lecture Notes

4-8 Common Stocks Chapter 4
� DCF with constant growth gives a relation between current
stock price, current dividend, dividend growth rate and the
expected return. Knowing three of the variables, we can
determine the fourth.
Example. Determine cost of equity (the discount rate). In
09/92, the dividend yield for Duke Power was D0/P0 = 0.052.
Estimates of long-run growth:
Info Source Value Line (VL) I/B/E/S
Growth g 0.049 0.041
The cost of capital is given by
r = (1+g)(D0/P0) + g.
Thus,
Cost of Capital
VL r = (0.052)(1.049) + 0.049 = 10.35%
IBES r = (0.052)(1.041) + 0.041 = 9.51%
15.401 Lecture Notes c©J. Wang Fall 2006
Chapter 4 Common Stocks 4-9
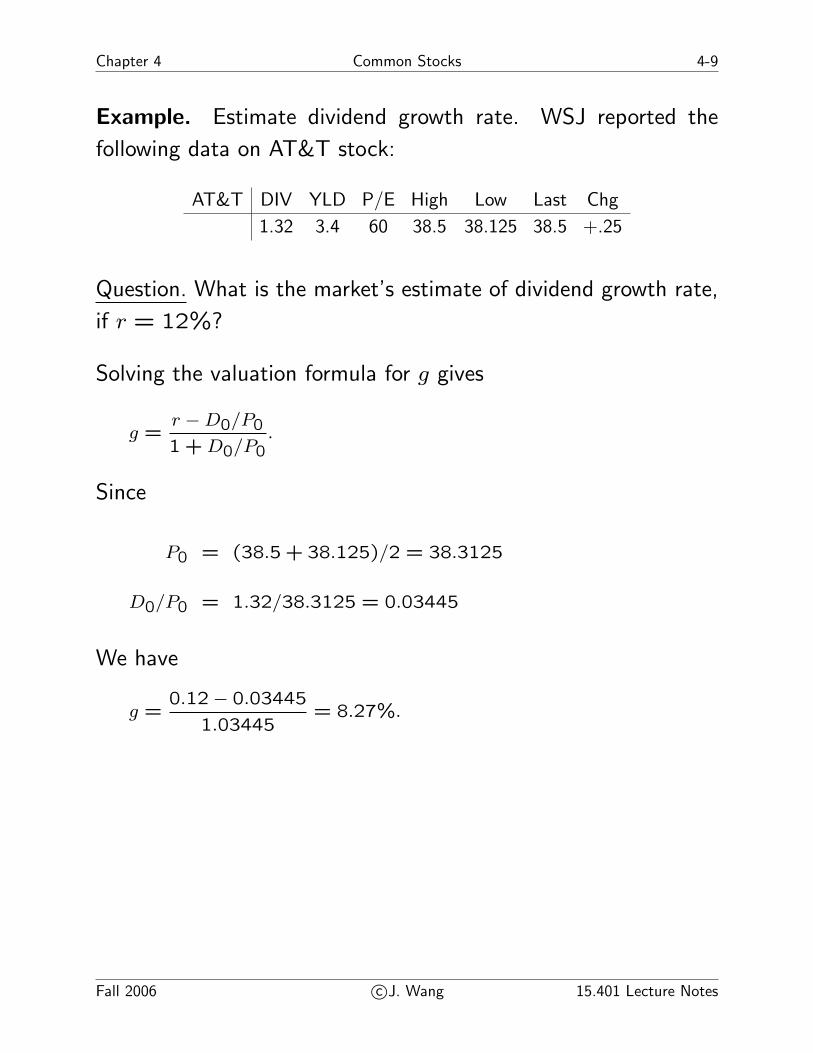
Example. Estimate dividend growth rate. WSJ reported the
following data on AT&T stock:
AT&T DIV YLD P/E High Low Last Chg
1.32 3.4 60 38.5 38.125 38.5 +.25
Question. What is the market’s estimate of dividend growth rate,
if r = 12%?
Solving the valuation formula for g gives
g =r − D0/P0
1 + D0/P0.
Since
P0 = (38.5 + 38.125)/2 = 38.3125
D0/P0 = 1.32/38.3125 = 0.03445
We have
g =0.12 − 0.03445
1.03445= 8.27%.
Fall 2006 c©J. Wang 15.401 Lecture Notes

4-10 Common Stocks Chapter 4
4.2 DCF with Multiple-Stage Growth
Firms often evolve through different stages in their growth. For
example, some may have three stages during their lifetime:
1. Growth stage - rapidly expanding sales, high profit margins,
and abnormally high growth in earnings per share, many new
investment opportunities, low dividend payout ratio.
2. Transition stage - growth rate and profit margin reduced by
competition, fewer new investment opportunities, high payout
ratio.
3. Maturity stage - earnings growth, payout ratio and average
return on equity stabilizes for the remaining life of the firm.
Example. In Example 1 (D0 = $1 and r = 20%), suppose that
the growth rate is 6% for the first 7 years and then drops to zero
thereafter.
P0 = $6.49.
15.401 Lecture Notes c©J. Wang Fall 2006
Chapter 4 Common Stocks 4-11
4.3 EPS AND P/E
Actual forecast of dividends often involves many practical issues.
Terminology:
• Earnings: total profit net of depreciation and taxes.
• Payout ratio: dividend/earnings = DPS/EPS = p.
• Retained earnings: (earnings - dividends).
• Plowback ratio: retained earnings/total earnings = b.
• Book value (BV): cumulative retained earnings.
• Return on book equity (ROE): earnings/BV.
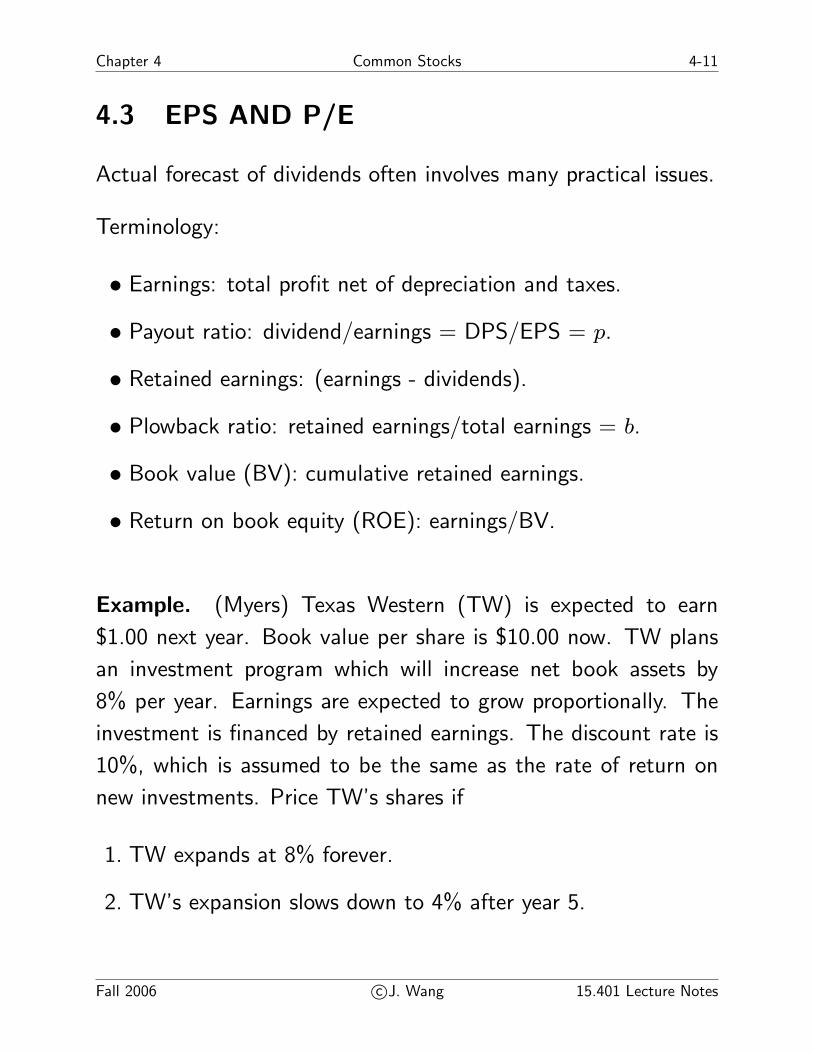
Example. (Myers) Texas Western (TW) is expected to earn
$1.00 next year. Book value per share is $10.00 now. TW plans
an investment program which will increase net book assets by
8% per year. Earnings are expected to grow proportionally. The
investment is financed by retained earnings. The discount rate is
10%, which is assumed to be the same as the rate of return on
new investments. Price TW’s shares if
1. TW expands at 8% forever.
2. TW’s expansion slows down to 4% after year 5.
Fall 2006 c©J. Wang 15.401 Lecture Notes
4-12 Common Stocks Chapter 4
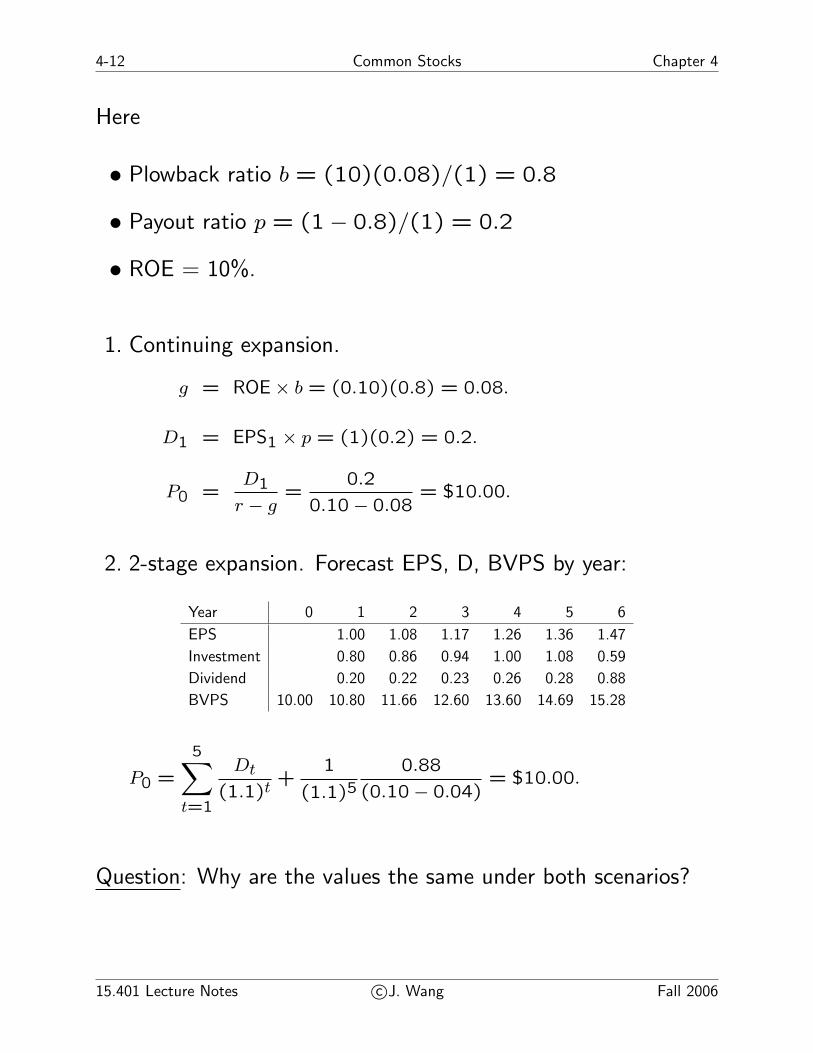
Here
• Plowback ratio b = (10)(0.08)/(1) = 0.8
• Payout ratio p = (1 − 0.8)/(1) = 0.2
• ROE = 10%.
1. Continuing expansion.
g = ROE × b = (0.10)(0.8) = 0.08.
D1 = EPS1 × p = (1)(0.2) = 0.2.
P0 =D1
r − g=
0.2
0.10 − 0.08= $10.00.
2. 2-stage expansion. Forecast EPS, D, BVPS by year:
Year 0 1 2 3 4 5 6
EPS 1.00 1.08 1.17 1.26 1.36 1.47
Investment 0.80 0.86 0.94 1.00 1.08 0.59
Dividend 0.20 0.22 0.23 0.26 0.28 0.88
BVPS 10.00 10.80 11.66 12.60 13.60 14.69 15.28
P0 =
5∑t=1
Dt
(1.1)t+
1
(1.1)50.88
(0.10 − 0.04)= $10.00.
Question: Why are the values the same under both scenarios?
15.401 Lecture Notes c©J. Wang Fall 2006
Chapter 4 Common Stocks 4-13
4.4 Growth Opportunities and Growth Stocks
Definition: Growth opportunities are investment opportunities
that earn expected returns higher than the required rate of return
on capital.
Definition: Stocks of companies that have access to growth
opportunities are considered growth stocks.
• The following may not be growth stocks
- A stock with growing EPS
- A stock with growing dividends
- A stock with growing assets.
• The following may be growth stocks
- A stock with EPS growing slower than required rate of
return.
- A stock with DPS growing slower than required rate of
return.
Fall 2006 c©J. Wang 15.401 Lecture Notes
4-14 Common Stocks Chapter 4
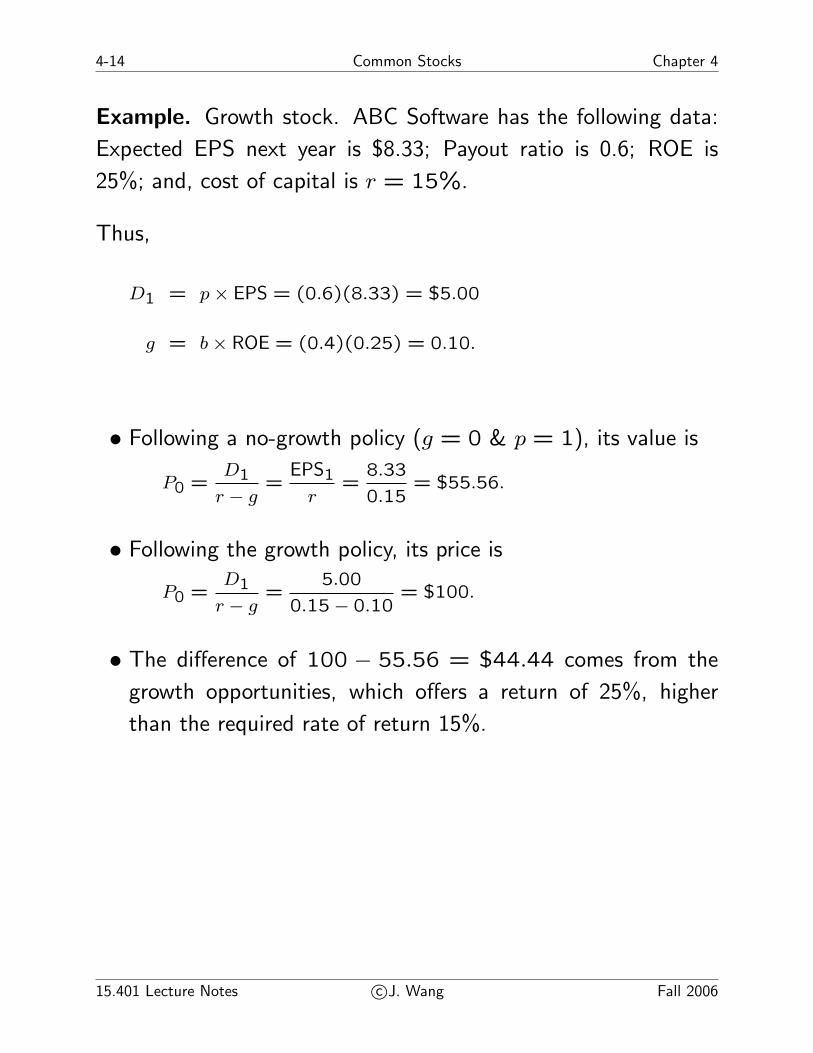
Example. Growth stock. ABC Software has the following data:
Expected EPS next year is $8.33; Payout ratio is 0.6; ROE is
25%; and, cost of capital is r = 15%.
Thus,
D1 = p × EPS = (0.6)(8.33) = $5.00
g = b × ROE = (0.4)(0.25) = 0.10.
• Following a no-growth policy (g = 0 & p = 1), its value is
P0 =D1
r − g=
EPS1
r=
8.33
0.15= $55.56.
• Following the growth policy, its price is
P0 =D1
r − g=
5.00
0.15 − 0.10= $100.
• The difference of 100 − 55.56 = $44.44 comes from the
growth opportunities, which offers a return of 25%, higher
than the required rate of return 15%.
15.401 Lecture Notes c©J. Wang Fall 2006
Chapter 4 Common Stocks 4-15
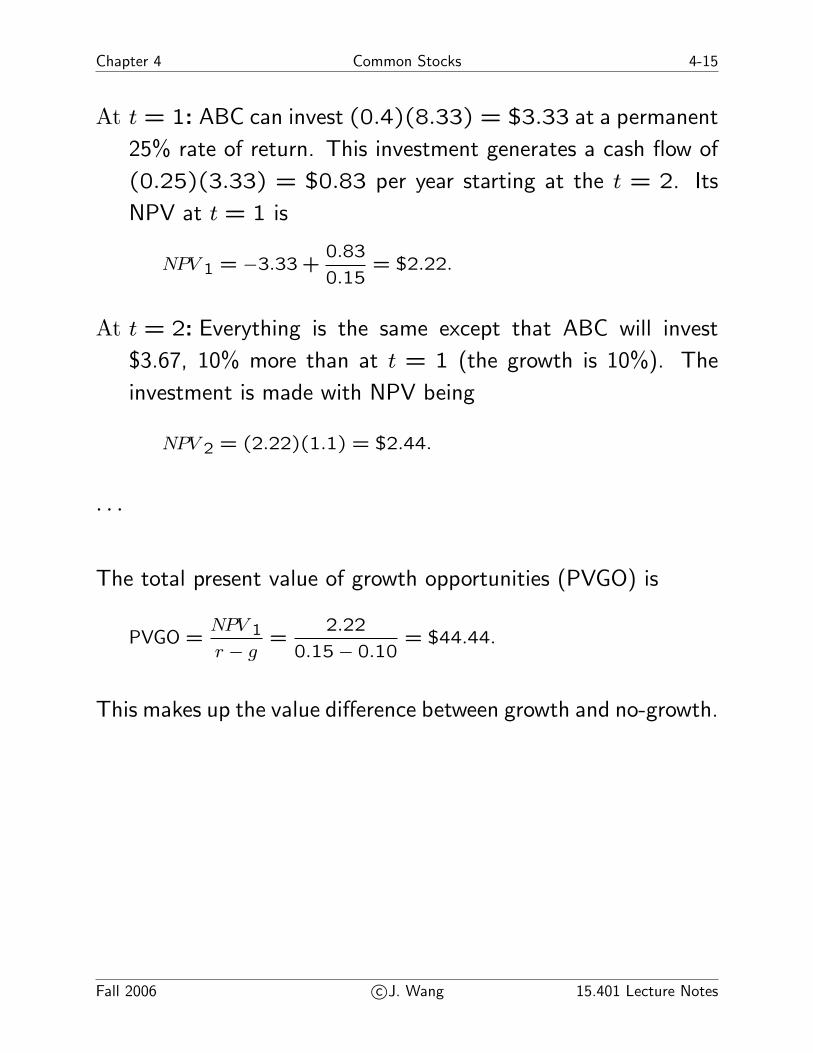
At t = 1: ABC can invest (0.4)(8.33) = $3.33 at a permanent
25% rate of return. This investment generates a cash flow of
(0.25)(3.33) = $0.83 per year starting at the t = 2. Its
NPV at t = 1 is
NPV 1 = −3.33 +0.83
0.15= $2.22.
At t = 2: Everything is the same except that ABC will invest
$3.67, 10% more than at t = 1 (the growth is 10%). The
investment is made with NPV being
NPV 2 = (2.22)(1.1) = $2.44.
· · ·
The total present value of growth opportunities (PVGO) is
PVGO =NPV 1
r − g=
2.22
0.15 − 0.10= $44.44.
This makes up the value difference between growth and no-growth.
Fall 2006 c©J. Wang 15.401 Lecture Notes

4-16 Common Stocks Chapter 4
Stock price has two components:
1. Present value of earnings under a no-growth policy
2. Present value of growth opportunities
P0 =EPS1
r+ PVGO.
Terminology:
• Earnings yield: E/P = EPS1/P0
• P/E ratio: P/E = P0/EPS1
Note: In newspapers, P/E ratios are often given using most recent earnings. But investors are
more concerned with price relative to future earnings.
Thus,
• If PVGO = 0, P/E ratio equals inverse of cost of capital
E/P =1
r.
• If PVGO > 0, P/E ratio becomes higher:
P/E =1
r+
PVGO
EPS1>
1
r.
• PVGO is positive only if firm earns more than cost of capital.
15.401 Lecture Notes c©J. Wang Fall 2006

Chapter 4 Common Stocks 4-17
5 Valuation of Operating Business
From DCF formula, we have
PV =T∑
t=1
FCFt
(1 + r)t+
PVT
(1 + r)T
where 1 to T is the growth period and
FCFt ≡ Free Cash Flow (Earnings - Net Investment)
(Net investment = Capital expenditure - Depreciation.)
Calculation of PVT :
1. Perpetual-growth DCF
2. P/E multiplier
3. P/BVPS multiplier
4. Choose T to be when PVGO goes to zero. Then
PVT =FCFT+1(No Growth)
r.
Fall 2006 c©J. Wang 15.401 Lecture Notes
4-18 Common Stocks Chapter 4
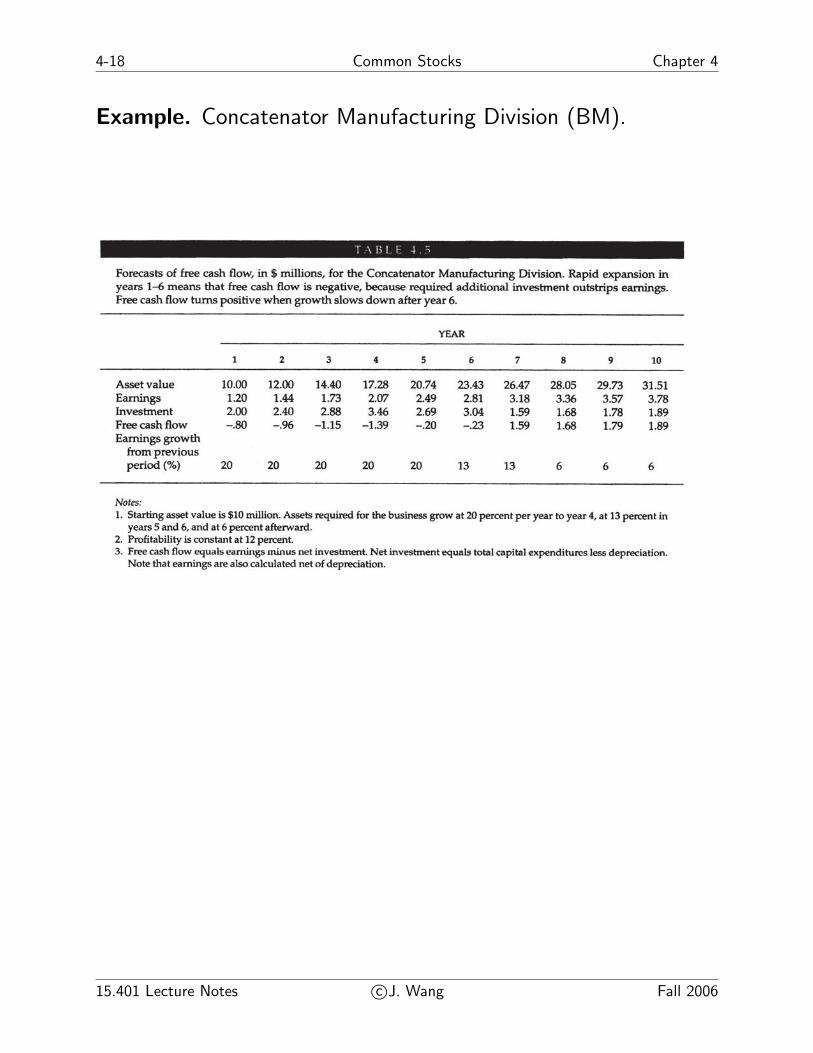
Example. Concatenator Manufacturing Division (BM).
15.401 Lecture Notes c©J. Wang Fall 2006
Chapter 4 Common Stocks 4-19
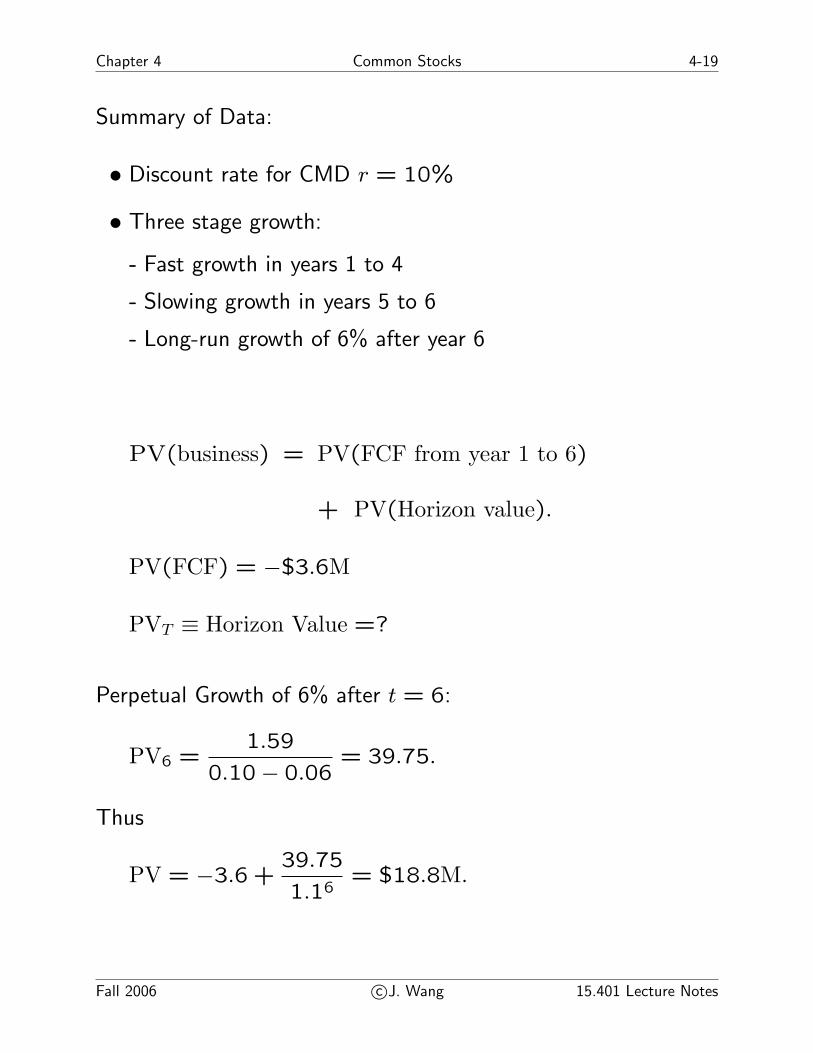
Summary of Data:
• Discount rate for CMD r = 10%
• Three stage growth:
- Fast growth in years 1 to 4
- Slowing growth in years 5 to 6
- Long-run growth of 6% after year 6
PV(business) = PV(FCF from year 1 to 6)
+ PV(Horizon value).
PV(FCF) = −$3.6M
PVT ≡ Horizon Value =?
Perpetual Growth of 6% after t = 6:
PV6 =1.59
0.10 − 0.06= 39.75.
Thus
PV = −3.6 +39.75
1.16= $18.8M.
Fall 2006 c©J. Wang 15.401 Lecture Notes

4-20 Common Stocks Chapter 4
Other Approaches to PVT :
• Normal P/E of 11 at t = 6:
PV6 = (11)(3.18) = 34.98.
Thus
PV = −3.6 +34.98
1.16= $16.1M.
• Normal P/BVPS of 1.4 at t = 6:
PV6 = (1.4)(23.43) = 32.80.
(Alternatively, PVT = (1.4)(26.47)/1.1 = 33.69.)
Thus
PV = −3.6 +32.80
1.16= $14.9M
(most conservative number).
15.401 Lecture Notes c©J. Wang Fall 2006

Chapter 4 Common Stocks 4-21
6 Summary
• Risky CFs should be discounted using a risk-adjusted rate.
• Cash flows, typically, do not grow at a constant rate.
• Growh opportunities earn higher return than cost of capital.
Fall 2006 c©J. Wang 15.401 Lecture Notes

4-22 Common Stocks Chapter 4
7 Homework
Readings:
• BMA Chapter 4.
• BKM Chapter 18.
Assignment:
• Problem Set 3.
15.401 Lecture Notes c©J. Wang Fall 2006