chapter 4 insider threat analysis using information ... · chapter 4 insider threat analysis using...
TRANSCRIPT
Chapter 4
INSIDER THREAT ANALYSIS USING INFORMATION-CENTRIC MODELING
D. Ha, S. Upadhyaya, H. Ngo, S. Pramanik, R. Chinchani and S. Mat hew
Abstract Capability acquisition graphs (CAGs) provide a powerful framework for modeling insider threats, network attacks and system vulnerabilities. However, CAG-based security modeling systems have yet to be deployed in practice. This paper demonstrates the feasibility of applying CAGs to insider threat analysis. In particular, it describes the design and operation of an information-centric, graphics-oriented tool called ICMAP. ICMAP enables an analyst without any theoretical background to apply CAGs to answer security questions about vulnerabilities and likely attack scenarios, as well as to monitor network nodes. This functionality makes the tool very useful for attack attribution and forensics.
Keyv^ords: Insider threats, capability acquisition graphs, key challenge graphs
1. Introduction A comprehensive model is required for understanding, reducing and
preventing enterprise network attacks, and for identifying and combating system vulnerabihties and insider threats. Attacks on enterprise networks are often complex, involving multiple sites, multiple stages and the exploitation of various vulnerabilities. As a consequence, security analysts must consider massive amounts of information about network topology, system configurations, software vulnerabilities, and even social information. Integrating and analyzing all this information is an overwhelming task.
A security analyst has to determine how best to represent individual components and interactions when developing a model of a computing environment. Depending on the environment and task at hand, the analyst may deal with network traffic data [15], routing data [14], network
Please use the following format when citing this chapter:
Ha, D., Upadhyaya, S., Ngo, H., Pramanik, S., Chinchani, R., Mathew, S., 2007, in IFIP International Federation for Information Processing, Volume 242, Advances in Digital Forensics III; eds. P. Craiger and S Shenoi; (Boston: Springer), pp. 55-73.

56 ADVANCES IN DIGITAL FORENSICS III
connections [2], and, in the case of static analysis, network configurations [13]. Visualization is an effective method for integrating and analyzing diverse information, mostly because humans can process large amounts of data through images, maps and graphs.
For this reason, attack graphs have received considerable attention by the research community [6, 8, 10, 11]. Attack graphs provide a powerful visual framework for understanding the effects of the interactions of local vulnerabilities and for identifying global, less visible vulnerabilities that are combinations of local vulnerabilities.
However, attack graphs have several limitations. The manual construction of attack graphs for real network configurations is labor intensive, tedious and error-prone; this means that automating the construction of attack graphs is critical. Several attack graph methods employ model checking, which often produces an internal state explosion. This is because model checking may examine all possible states although only a fraction of states are eventually analyzed. Large state spaces require significant processing time; for example, the NuSMV tool may take two hours to analyze a network with a handful of hosts [12]. Even when they are available, attack graph tools lack automation features and support for interpreting results. For example, initial configuration data is usually required as input, but its format is unnatural for humans, e.g.. Boolean tables for network connectivity or binary relations for capturing all relationships [12]. Furthermore, due to their size and notational differences, it can be difficult to relate attack graphs to the original physical context; this is a task often left to the user.
Capability acquisition graphs (CAGs) (formerly known as key challenge graphs (KCGs)) have been proposed as a modeling technique for insider threat analysis [4, 5]. From the user's point of view, CAGs are more intuitive than attack graphs because they closely resemble the input network topology [5]. Although originally developed for insider threat modeling, CAGs are capable of modeling vulnerability-exploited privilege escalation, similar to attack graphs.
This paper describes a novel CAG-based tool, which we call ICMAP (Information-Centric Modeler and Auditor Program). ICMAP has several useful features:
• Users may import information in a convenient, systematic manner. The initial input to ICMAP is a physical graph, which is easy to construct as it is similar to a network configuration.
• ICMAP automatically converts the physical graph to a logical graph (CAG). Users may adjust the CAG and add new relationships before performing further analysis.
Ha, et al. 57
• System analysts may use ICMAP to answer questions about the security of network setups, likely attack strategies and vulnerable points. ICMAP helps in identifying locations for positioning monitoring systems. The results are also mapped to the original network context, making the display easy to comprehend.
• Streaming alerts from IDS sensors and network monitoring tools can be correlated to generate attack tracks. These attack tracks can be compared with projected tracks during off-line analysis to narrow probable attack paths and facilitate forensic analysis.
The next section presents an overview of CAGs and their applications to threat assessment. Section 3 describes the architecture of ICMAP, a CAG-based information-centric modeling and analysis tool. Sections 4 and 5 discuss cost assignment techniques, scalability issues, and a scenario involving a corporate network. Section 6 examines the forensic applications of CAGs and CAG-based tools. The final section, Section 7, presents our conclusions and discusses avenues for future research.
2. Capability Acquisition Graphs
This section describes capability acquisition graphs (CAGs), which were formerly known as key challenge graphs (KCGs) [5].
DEFINITION 1 A capability acquisition graph is a tuple represented by:
CAG={y,E,K,Vo,Vs.T^,5) (1)
F is a set of nodes; each entity in the physical network (hosts, firewalls, user accounts) has a node in the graph. E isa set of edges; two nodes are connected by an edge if it is possible to reach one node from the other. K is a set of tokens; a token can represent system information or individual information (e.g., password, date-of-birth or mother's maiden name). VQ is the set of start nodes from where an attack can be launched; the skill set of an attacker can be modeled by adjusting the set VQ. VS is the set of target nodes in the logical graph that an attacker intends to compromise. The function TT -.V ^ K assigns tokens to nodes, e.g., a database node may have records as tokens. The function 5: E-^KxNxN represents the edge attributes, consisting of token challenges and transition costs.
A CAG can be viewed as an abstract representation of a user's walk in a network. The user starts from a particular node in the graph with certain tokens (knowledge). From the starting node, the user chooses an edge, e{u,v) — {token, min, max), to move to an adjacent node. If the token is already present in his set of knowledge, he incurs a cost of min otherwise he incurs a cost of max. If V is the set of visited vertices,
58 ADVANCES IN DIGITAL FORENSICS III
then the cost of visiting a new vertex v ^V \s the minimum cost edge (u,v) for all u G V. The cost of an attack sequence or attack trail (t'l, i ;2 , . . . , i n) is the sum of the costs of visiting a new vertex from the set of already-visited vertices. An attacker might try to minimize his cost of reaching a target node by choosing edges with simple token challenges. The goal of a systems administrator is to maximize the cost of attacks by assigning proper token challenges to the edges. By enumerating the paths of least resistance it is possible to identify the most likely attack paths and either remove them from the network or place sensors along the path to detect the attacks.
Model specification begins by identifying the scope of the threat; it could be a small portion of the organization or the entire organization. The size of the resulting model is a polynomial function of the input information. However, the problem of determining the cost of least resistance in a CAG is NP-Hard [4]. In fact, the problem is not even approximable to within 2^^^^^^ where 5 =^ 1— ^ }c^ for any c < 1/2. Therefore, finding a least cost attack in an efficient manner is not possible unless P = NP.
A greedy heuristic approach involving a one-step lookahead may be used to identify an optimal walk [4, 5]. Note that even if a shorter path to a goal exists, an attacker might avoid it believing that sensors might be placed along the path. Therefore, the greedy heuristic approach has to be run multiple times to identify the k best paths instead of one optimal path. CAGs can also represent social engineering channels (e.g., telephone lines when identifying insider abuse paths). Due to the lack of tools for measuring security weaknesses in organizations, which is a primary concern for assessing insider threats, the majority of the tasks related to modeling and analyzing social engineering links fall on the security analyst.
3. I C M A P Architecture
This section describes ICMAP (Information-Centric Modeler and Auditor Program), a CAG-based information-centric modeling and analysis tool.
3.1 I C M A P Framework The ICMAP framework is presented in Figure 1. The ICMAP engine
is the core of the CAG generation process. It takes the physical network topology and information about vulnerabilities in network services as external inputs, and combines them with network translation rules (Section 3.3) and cost rules (Section 4.1) to obtain the CAG. Once the

Ha, et al. 59
1. ICMAP framework.
CAG is constructed, various heuristics, e.g., 1-step, /c-step (constant k) and n-step lookahead techniques, can be used to find an optimal path from a source to a destination without having to enumerate all possible paths. Also, using combinations of source and destination pairs, it is possible to identify the best locations to position network sensors.
Two separate analyses can be performed on a CAG to refine a threat assessment. The first is sensitivity analysis where different cost assignments are used to identify the optimal cost assignment that results in attack paths that are similar to known attacks. The second is to perform a defense-centric analysis where sensors are placed along the paths of least resistance to help prevent network assets from being compromised. The cost assignment is refined based on these two analyses.
The ICMAP engine is written in Java. It incorporates a GUI that closely models real-world network components. Network topology information such as connectivity and services are imported using drop-down and pop-up menus. ICMAP also engages an underlying database of common entities such as vulnerabilities and services, which users may add to or modify using ICMAP's local menu. To promote interoperability, ICMAP uses the MySQL database management system, and its outputs are in XML format.

60 ADVANCES IN DIGITAL FORENSICS III
3.2 Physical Graph Construction
Entering network configuration data is arguably the most tedious, error-prone and labor intensive work for any security analyst. Unfortunately, this is the part that is usually ignored by current graph generation tools. The data is either not mentioned [1] or imphcitly assumed to be provided [12, 13]. Even when data is provided, it is usually in a format that is difficult for humans to comprehend. For example, network connectivity is represented as a Boolean table where the columns and rows are network hosts, and all trust relationships are represented as binary relations. Needless to say, while these formats may simplify computer processing, they are a burden for human analysts.
In contrast, ICMAP assists users in importing data in a most natural way using visualization. Figure 2 illustrates the process of constructing a physical graph based on input information about accounts and services for a host (the topology is shown later in Figure 3). Two types of network entities are depicted: normal hosts and a firewall. Each component serves a different role; therefore, it is associated with a different set of menus for further configuration (e.g., account and service information for hosts and filter rules represented as token/key for firewalls). The component type determines the conversion to a CAG. ICMAP supports several types of components: hosts, firewalls, LANs, database servers, hubs/bridges and switches; additional component types are currently being implemented.
3.3 Logical Graph Construction ICMAP automates the construction of a logical graph (CAG) from a
physical graph. This section describes the process, including the basic rules used to identify the nodes, edges and tokens in a CAG.
As discussed in the context of a physical graph, a network consists of hosts, physical boundary creators such as routers and firewalls, network services such as ssh, f t p , h t t p and nf s, and databases. A host contains the host id, user accounts, network services, vulnerabilities and critical files (henceforth called "jewels"). In order to build the CAG, for each host, it is necessary to draw the user account nodes, service nodes, vulnerability nodes and jewel nodes. A user (or a malicious insider) either connects to a service remotely or logs in from the console. Once the user gains access to a host he uses the network resource and connects to another host, uses the file system resource and edits files, exploits vulnerabilities to escalate his privileges, or uses the cpu resource on the host to execute programs, check mails, browse, etc. To represent the above activities, edges (with their token challenges) are drawn entering

Ha, et al. 61
Figure 2. Constructing a physical graph.
the user accounts. The token challenges are marked on the edges. If the token is known, then traversing the edge incurs a cost of LOW, otherwise a cost of HIGH is incurred. Edges marked "0" do not have a token challenge, so they always incur a cost of LOW. From the user accounts there exist zero-cost transitions to the host service, and from the host there exist transitions to other accounts in the network. We also add zero-cost transitions from the root account to other accounts in the same host to express the fact that the root can become any user. Once a user gets to the host, vulnerabilities in the services can be exploited; thus edges are drawn from the services to their vulnerabilities. The tokens in the vulnerability node can be used to escalate privileges (e.g., become root). Finally, edges exist from the user accounts and network services (e.g., ssh and ftp) to the file system (e.g., nf s) of the host and from the file system to the jewels.
It is important to mention that the automatic graph conversion is intended to reduce the work of analysts, not to limit it. After the conversion, an analyst can still perform various adjustments to the logical graph (e.g., add/remove relationships, tokens and change the costs). Adjustments to the physical graph at this step are also automatically updated to the CAG. Because a GAG does not incorporate icons as in a
62 ADVANCES IN DIGITAL FORENSICS III
physical graph, it employs various colors and shapes to differentiate component types and status. These features promote visual comprehension, especially when dealing with large networks.
3.4 CAG Example A physical graph of a subnet consisting of an ssh server, f t p server
and a firewall is presented in Figure 3. Figure 4 shows the corresponding logical graph (CAG) whose nodes correspond to the various network entities.
Suppose it is necessary to determine if an external user, x -user , can become an internal user in the presence of a firewall that allows only incoming ssh traflSc. To become roo t on the ssh server, x -use r must traverse the node sequence (x-user, hos t , f i r e w a l l , roo t ) and have the root_pd token to make the transition from the f i r e w a l l node to the roo t node. If x -use r does not have the rootjpd token but only the user_pd token, then he can traverse the sequence (x-user , hos t , f i r e w a l l , user , sshd, ssh-vuln , sshd, roo t ) , where he exploits the ssh vulnerability to become roo t . Similar steps can be followed for the f t p service, but for this x -use r will also have to become roo t on the firewall by changing the firewall rules.
3.5 System Analysis
A major goal of any graph-based security analysis is to identify likely attack scenarios based on system configuration and settings, attacker's knowledge and potential targets. This task can be done quite easily using ICMAP. All the nodes corresponding to the initial states of the attacker are marked as compromised. The nodes corresponding to entities that must be protected (e.g., root account on a host) are marked as targets.
Next, the CAG is analyzed using brute force or a heuristic Dijkstra-like algorithm. In our experience, a brute force approach is not practical for graphs with more than 20 nodes. Readers are referred to [4] for a discussion of the brute force and heuristic algorithms. The final top k attack scenarios (based on minimum total cost), where /c is a configurable parameter, are returned in a separate file; only the top scenario is displayed by ICMAP. Note that because the CAG nodes do not represent network states as in attack graphs, each scenario is not necessarily a path, but a walk (or a trail) with some nodes visited multiple times. Presenting a walk using directed edges on top of a logical graph is visually complicated, so ICMAP only shows the induced spanning tree of a walk. However, it is still possible to visualize the complete attack sequence using ICMAP's animation feature.

Ha, et al. 63
Figure 3. Physical graph of a subnet.
Figure 4. Logical graph of a subnet.
An attacker does not necessarily follow the shortest path when attempting to compromise a computer system or network. Critical points are points in a graph that the attacker has to pass through no matter what attack trail is chosen. These points suggest critical weaknesses in the system such as certain service vulnerabilities. They are also ideal locations for system administrators to deploy IDS sensors or security controls.
ICMAP is able to identify the critical points in a graph. ICMAP recommends these points based on the top k walks returned from the
64 AD VANCES IN DIGITAL FORENSICS III
analysis (see Section 5). Note that finding the set of critical points is an NP-Hard problem [9].
4, Practical Issues This section discusses practical issues related to CAGs, including cost
assignment, scalability and abstraction.
4.1 Cost Assignment
After identifying the nodes, edges and tokens in a GAG, the next step is to assign costs to the edges. The costs are determined based on attack templates, CERT vulnerability reports (www.cert.org), attacker privileges, and the assets that must be protected. They are divided into three categories: LOW, MEDIUM and HIGH; however, the number of cost categories can be adjusted as desired.
The cost of a transaction depends on certain categories, e.g., authentication mechanism, system patching rate, knowledge of vulnerability, etc. We begin by describing the cost values determined by each category and then present a technique for combining the cost values. Note that attack graphs either assign probabilities for transitions based on the transition profile [12] or implicitly consider zero costs for atomic attacks.
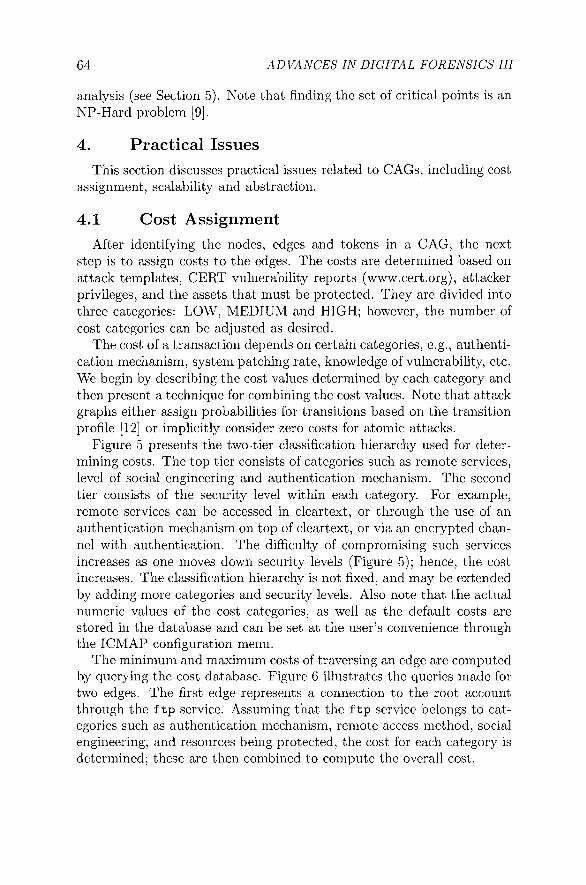
Figure 5 presents the two-tier classification hierarchy used for determining costs. The top tier consists of categories such as remote services, level of social engineering and authentication mechanism. The second tier consists of the security level within each category. For example, remote services can be accessed in cleartext, or through the use of an authentication mechanism on top of cleartext, or via an encrypted channel with authentication. The difficulty of compromising such services increases as one moves down security levels (Figure 5); hence, the cost increases. The classification hierarchy is not fixed, and may be extended by adding more categories and security levels. Also note that the actual numeric values of the cost categories, as well as the default costs are stored in the database and can be set at the user's convenience through the ICMAP configuration menu.
The minimum and maximum costs of traversing an edge are computed by querying the cost database. Figure 6 illustrates the queries made for two edges. The first edge represents a connection to the root account through the f t p service. Assuming that the f t p service belongs to categories such as authentication mechanism, remote access method, social engineering, and resources being protected, the cost for each category is determined; these are then combined to compute the overall cost.

Ha, et al. 65
Figure 5. Cost tree.
Figure 6. Cost computation.
The second edge is the cost of exploiting a vulnerabihty in the f t p server. Queries are made for the knowledge of vulnerability and the system patching rate to find the cost of this edge. The cost is computed by taking the average of the values returned by the queries and using the average as an exponent so that the cost increases exponentially as the difhculty of making the transition increases. Thus, if ni, n2, • • • ,nk are the responses of the k queries made to the cost database, then the
cost of the edge is 2 fe . For flexibility, the actual numeric value
66 ADVANCES IN DIGITAL FORENSICS III
corresponding to each category is also stored in the database and can be adjusted via the configuration menu.
4.2 Scalability and Abstraction
A major hmitation of attack graphs is their inabihty to deal with the large numbers of states involved in real-world applications. This issue becomes critical for visualization-based tools - when the graph is too large, it is extremely difficult for security analysts to assimilate the presentation and manipulate the graph, significantly impeding the analysis. Consequently, it is important to reduce the size of an attack graph without hindering the accuracy of the representation.
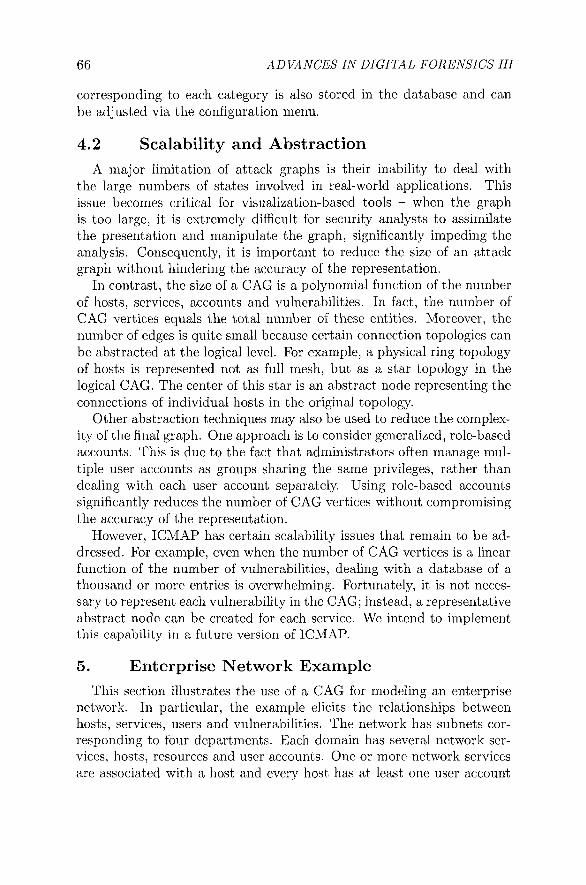
In contrast, the size of a CAG is a polynomial function of the number of hosts, services, accounts and vulnerabilities. In fact, the number of CAG vertices equals the total number of these entities. Moreover, the number of edges is quite small because certain connection topologies can be abstracted at the logical level. For example, a physical ring topology of hosts is represented not as full mesh, but as a star topology in the logical CAG. The center of this star is an abstract node representing the connections of individual hosts in the original topology.
Other abstraction techniques may also be used to reduce the complexity of the final graph. One approach is to consider generalized, role-based accounts. This is due to the fact that administrators often manage multiple user accounts as groups sharing the same privileges, rather than dealing with each user account separately. Using role-based accounts significantly reduces the number of CAG vertices without compromising the accuracy of the representation.
However, ICMAP has certain scalability issues that remain to be addressed. For example, even when the number of CAG vertices is a linear function of the number of vulnerabilities, dealing with a database of a thousand or more entries is overwhelming. Fortunately, it is not necessary to represent each vulnerability in the CAG; instead, a representative abstract node can be created for each service. We intend to implement this capability in a future version of ICMAP.
5. Enterprise Network Example This section illustrates the use of a CAG for modeling an enterprise
network. In particular, the example elicits the relationships between hosts, services, users and vulnerabilities. The network has subnets corresponding to four departments. Each domain has several network services, hosts, resources and user accounts. One or more network services are associated with a host and every host has at least one user account

Ha, et al. 67
and one root account. Moreover, every service has at least one vulnerability, which can be exploited to obtain root access.
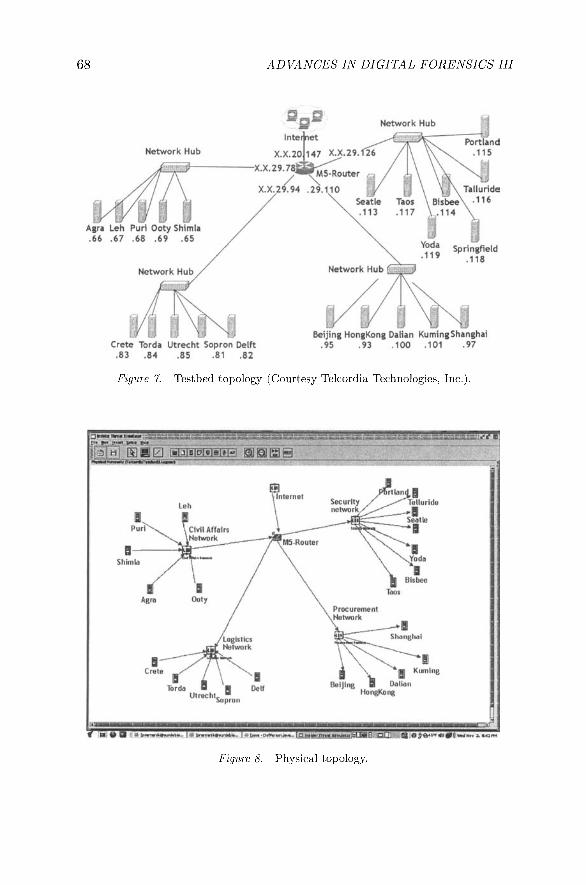
Figure 7 presents the network topology. The Civil Affairs, Logistics and Procurement network domains each have five machines while the Security network domain has seven machines. Each machine runs a service and has at least two accounts (one root and one normal account). Figure 8 presents the corresponding physical graph constructed by ICMAP. Note that all the information (services, user accounts and tokens) is not shown in the figure, but these are imported into the CAG.
Figure 9 presents the CAG generated by ICMAP from the physical graph. Hosts are represented by square boxes, accounts by circles, and vulnerabilities by ellipses. The source is selected to be the account rd .ooty on Ooty, while the target is a jewel file on Taos. In the current setup, only the root account on Taos has access to the jewel. However, ICMAP's analysis discovered that an insider could access the file by logging into Ooty as rd_ooty, then logging into Taos as rd_taos, exploiting a sshd vulnerability to become root_ taos , and finally accessing the jewel file. Figure 9 also shows a superimposed attack trail, which may be displayed as an animation.
ICMAP recommended that network sensors be positioned at the LAN, switch, source and target. These recommendations are expected; however, the real benefits of ICMAP are realized when the network being analyzed is large and a limited number of sensors can be placed.
6. Forensic Applications
Forensic tools such as EnCase Enterprise Automated Incident Response Suite provide sophisticated data gathering and analysis capabilities, but are not as useful at assisting with investigations of insider attacks. Due to the complexity of insider attacks, special guidance schemes are necessary to perform attack attribution. The digital forensics research community has only recently started to address this issue. One strategy is to use a layered genetic algorithm-based technique to generate an optimized rule set that identifies unauthorized processes and performs role-based process verification [3]. However, this work is only at a preliminary stage and is admittedly fraught with false alarms. This section describes two strategies through which the attack semantics embedded in ICMAP can be used to facilitate post-attack analysis.
As seen in the previous sections, ICMAP's off-line analysis produces a list of top k probable attack trails. These trails are constructed based on the knowledge of network topology, service vulnerabilities, authentication mechanisms used for the various services and social engineering
68 AD VANGES IN DIGITAL FORENSIGS III
Figure 7. Testbed topology (Courtesy Telcordia Technologies, Inc.
Figure 8. Physical topology.

Ha, et al. 69
Figure 9. Security analysis results along with a superimposed attack trail.
possibilities. In a system where alerts from intrusion detection sensors and audit logs (Apache, Windows IIS log files, etc.) are monitored, such real-time data can be used to narrow down the list of probable attack trails. Since the ICMAP-generated attack trails already have the attack semantics embedded in them (attack origination nodes and possible attack sequences), the real-time data can be utilized in a variety of ways to understand the details of the attacks.
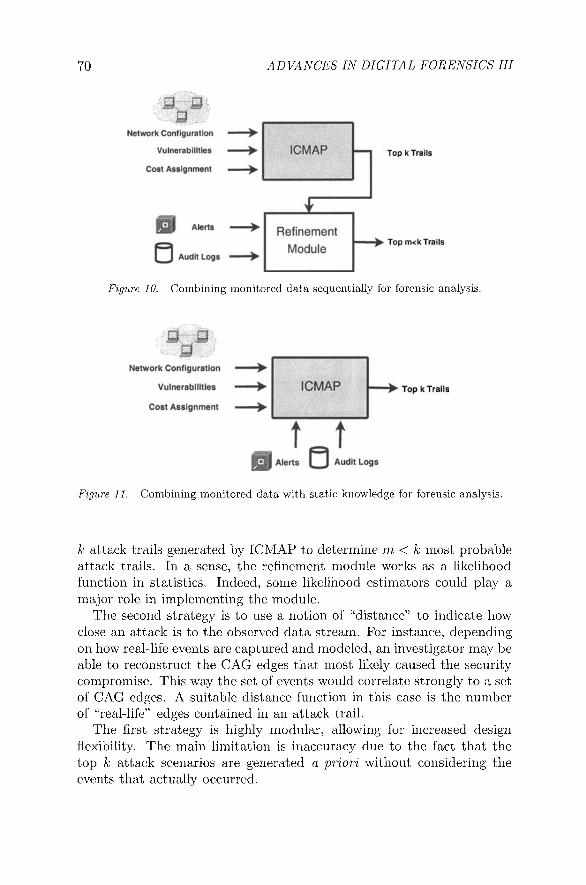
The first strategy requires no changes to the CAG model and the ICMAP engine. The top k attack trails that are generated a priori by ICMAP constitute the most likely attacks on the system. The set of likely attacks can be further refined using forensic data such as IDS alerts and audit logs (Figure 10). The refinement can be run periodically at the discretion of the system analyst or forensic investigator.
The refinement module can make use of well-known techniques for correlating alerts in the case of multi-stage attacks. These techniques would label involved nodes (hosts) either as stepping stones or as victims of full-fledged attacks. Bayesian causality graphs [7] could then be used to construct evidence graphs from the evidence stream obtained from the log events. Having created the evidence graphs, a sequence of nodes may be extracted from these graphs and matched (fully or partially) with the
70 ADVANCES IN DIGITAL FORENSICS III
Figure 10. Combining monitored data sequentially for forensic analysis.
Figure 11. Combining monitored data with static knowledge for forensic analysis.
k attack trails generated by ICMAP to determine in < k most probable attack trails. In a sense, the refinement module works as a likelihood function in statistics. Indeed, some likelihood estimators could play a major role in implementing the module.
The second strategy is to use a notion of "distance" to indicate how close an attack is to the observed data stream. For instance, depending on how real-life events are captured and modeled, an investigator may be able to reconstruct the CAG edges that most likely caused the security compromise. This way the set of events would correlate strongly to a set of CAG edges. A suitable distance function in this case is the number of "real-life" edges contained in an attack trail.
The first strategy is highly modular, allowing for increased design flexibility. The main limitation is inaccuracy due to the fact that the top k attack scenarios are generated a priori without considering the events that actually occurred.
Ha, et al. 71
Implementing the second strategy requires the CAG model and the ICMAP engine to be modified to accommodate incremental updates of the physical network graphs (Figure 11). For example, logged events may change tokens at vertices, edge costs and token challenges. Each incremental update to the parameters and/or topology of the CAG requires an adjustment to the top k attack trails. Ensuring that the current heuristic technique works with on-line updates is an important topic for future research. This feature is useful not only for forensic purposes, but also for speeding up the heuristic technique when there are actual (good) changes made by system administrators. The advantage of this strategy is more accurate input, which leads to more accurate top k trails.
7. Conclusions
According to the annual CSI/FBI surveys, internal attacks and insider abuse constitute a significant portion of security incidents in enterprise networks. Insider attacks are extremely damaging and can be launched with a short or non-existent reconnaissance phase. Security controls such as firewalls and intrusion detection systems developed to protect against external attacks are inadequate because insider attacks may be launched from any server and from a position of privilege in terms of resource access and knowledge of targets and vulnerabilities. Consequently, insider threat detection and attack attribution have become major issues, which are just beginning to be addressed by the research community.
The ICMAP tool presented in this paper is very effective at modeling insider threats, analyzing vulnerabilities and evaluating sensor deployment locations. Red teams can also use the tool to determine attack trails when evaluating network security.
ICMAP has several features that make it very useful for conducting post-incident (forensic) analyses. In particular, it captures the semantics of possible insider attacks via the generation of top k attack trails. Moreover, the CAG representation retains the topological structure of the enterprise network; this facilitates the mapping and displaying of the results of forensic analysis in the original network context.
Our future research will refine the cost estimation process of ICMAP based on larger real-world experiments. Also, we will investigate summarization methods to address scalability while retaining the visualization features. Another important topic is to enhance automation capabilities, e.g., automatic configuration, file input and output format conversion (to promote interoperability with other tools). Finally, we will work on refining ICMAP to support large-scale network forensic investigations, which require comprehensive analysis and visualization facilities.

72 ADVANCES IN DIGITAL FORENSICS III
References
[1] P. Ammann, D. Wijesekera and S. Kaushik, Scalable, graph-based network vulnerability analysis, Proceedings of the Ninth ACM Conference on Computer and Communications Security^ pp. 217-224, 2002.
[2] R. Ball, G. Fink and C. North, Home-centric visualization of network traffic for security administration. Proceedings of the ACM Workshop on Visualization and Data Mining for Computer Security, pp. 55-64, 2004.
[3] P. Bradford and N. Hu, A layered approach to insider threat detection and proactive forensics. Proceedings of the Twenty-First Annual Computer Security Applications Conference (Technology Blitz), 2005.
[4] R. Chinchani, D. Ha, A. Iyer, H. Ngo and S. Upadhyaya, On the hardness of approximating the Min-Hack problem, Journal of Combinatorial Optimization, vol. 9(3), pp. 295-311, 2005.
[5] R. Chinchani, A. Iyer, H. Ngo and S. Upadhyaya, Towards a theory of insider threat assessment. Proceedings of the International Conference on Dependable Systems and Networks, pp. 108-117, 2005.
[6] M. Dacier and Y. Deswarte, Privilege graph: An extension to the typed access matrix model. Proceedings of the European Symposium on Research in Computer Security, pp. 319-334, 1994.
[7] M. Jordan (Ed.), Learning in Graphical Models, MIT Press, Cambridge, Massachusetts, 1998.
[8] S. Mauw and M. Oostdijk, Foundations of attack trees, in Information Security and Cryptography (LNCS 3935), D. Won and S. Kim (Eds.), Springer, Berlin-Heidelberg, Germany, pp. 186-198, 2005.
[9] C. Phillips, The network inhibition problem. Proceedings of the Twenty-Fifth Annual ACM Symposium on the Theory of Computing, pp. 776-785, 1993.
[10] C. Phillips and L. Swiler, A graph-based system for network vulnerability analysis. Proceedings of the New Security Paradigms Workshop, pp. 71-79, 1998.
[11] B. Schneier, Attack trees: Modeling security threats. Dr. Dobb^s Journal, December 1999.
[12] O. Sheyner, J. Haines, S. Jha, R. Lippmann and J. Wing, Automated generation and analysis of attack graphs. Proceedings of the IEEE Symposium on Security and Privacy, pp. 273-284, 2002.

Ha, et al. 73
[13] L. Swiler, C. Phillips, D. Ellis and S. Chakerian, Computer-attack graph generation tool, Proceedings of the DARPA Information Survivability Conference and Exposition^ vol. 2, pp. 307-321, 2001.
[14] S. Teoh, K. Ma and S. Wu, A visual exploration process for the analysis of Internet routing data. Proceedings of the Fourteenth IEEE Visualization Conference, pp. 523-530, 2003.
[15] X. Yin, W. Yurcik, M. Treaster, Y. Li and K. Lakkaraju, Visflow-connect: Netflow visualizations of link relationships for security situational awareness, Proceedings of the ACM Workshop on Visualization and Data Mining for Computer Security, pp. 26-34, 2004.