chapter 4 methodologies and project design · chapter 4 methodologies and project design ... who...
TRANSCRIPT

CHAPTER 4
METHODOLOGIES AND PROJECT DESIGN
Introduction
The project was guided by the general hypothesis that: "Through current and
accurate understanding of the health and growth of the Evangelical Church in Guatemala,
the researcher will be able to make valid recommendations to the IMB Middle America
Regional Leadership Team to incorporate more effective and appropriate missiological
strategies." The challenge lies in the phrase "current and accurate understanding of the
health and growth of the Evangelical Church." The procedures outlined in this section
deal with arriving at good conclusions through accurate data. The first subproblem deals
with the primary research of measuring the percentage or quantity of evangelicals within
Guatemala. The results of this part of the research are in Chapter 5 and are also called the
"demographic data." The second subproblem analyzes the level of internalization of the
Gospel among evangelicals. Data were gathered through primary research concurrently
with the demographic data. The results of this data collection are given in Chapters 6 and
7 of this paper. The third subproblem identifies and analyzes the reasons for the
explosive growth of evangelicals in Guatemala. Conclusions are drawn primarily through
secondary historical research detailed in Chapter 3. The fourth subproblem deals with
sharing current insights of missions and church growth from the most prominent
107

Guatemalan denominations and Chapter 8 contains the summary of these insights. The
last subproblem treats the dissemination of the results and lessons of the research to
appropriate leaders of mission agencies. Credibility, trust, and personal relationships
were the first bridges to make in this process. For this part of the project, partnering with
SEPAL was invaluable and irreplaceable. Times and places of information sharing are
treated in the final sections of this chapter, but the issues of credibility and trust are
implicit throughout the entire project.
Mainstreaming a Counter-Cultural Project: A Challenge to Disseminate Results of
the Study of Religion in Guatemala
From the onset of the Joshua Project it was determined that the research would be
mainstreamed throughout the Guatemalan evangelical community. The need for research
was presented by SEPAL and initial actions were taken by the Regional Office of Middle
America of the IMB. In order for the results of the study to benefit the entire Guatemalan
Evangelical Church, the research had to be under the auspices of the neutral
inter-denominational agency, SEPAL. It has a proven track record for successfully
working with all Guatemalan evangelical groups and actively participates with the
Alianza Evangélica. In order to bring the entire project under the umbrella of SEPAL,
missionary Roger Grossmann was assigned by the IMB to SEPAL as the head of the
Joshua Research Project.
In the initial phase of the project, Hector Pivaral, a Guatemalan member of the
SEPAL team, wrote about some of the potential problems in presenting the results of the
research project to Guatemalan leadership:
108

Just doing the statistical study of the national evangelical churchnecessarily puts us in a counter-cultural project. This is because many donot want to know or do not want to discover or do not want others to knowthe reality of the church. It is a cultural characteristic to hold onto animage. Contradicting this image is counter-cultural.
. . . to attempt to change the perception of the image will cause problems.With this sensitive cultural issue in mind, the following questions must beasked: How can we go to the Church and present to them a statisticalproject? Do we need to consider unique presentations for the Pentecostals,for the non-pentecostals, for the traditional denominations, or for theNeo-pentecostals?1
Meetings were set with key leaders of the Alianza Evangélica to present the
general concept of a religious survey in Guatemala. All leaders present admitted that they
did not know the percentage of evangelicals but imagined it was somewhere between
33% to 45%. The leadership expressed great interest in the project once the goals were
well stated. "The Joshua Project is a research project that will gather information which
will give a clear picture of the state of the Church in Guatemala. When each
denomination or mission agency has the results of the study, they will be able to evaluate
their progress in light of the Great Commission, as well as to plan more effectively their
course of ministry for the future."2
In order to assure participation, ownership, and valid input by the Alianza
Evangélica, they were asked to appoint a committee to help produce a section of the
General Survey.3 They later were asked to help to assist in locating surveyors, funds, and
1 Hector Pivarol, personal correspondence, Guatemala, Guatemala, 20 April 2000.2 See Appendix 4.1 for the initial research proposal as presented to SEPAL leadership and
leadership of the IMB Middle American team. Handouts from the first meetings with Guatemala leadershipand mission agency leadership are in Appendix 4.3.
3 That is, section D of the General Survey in Appendices 4.10.5 and 4.10.6.
109

advertising to promote acceptance of the project and its results. They were also asked to
encourage denominational leaders to find sponsoring churches in the Interior of the
Republic to host the traveling surveyors. Three thousand color posters were handed out
in subsequent meetings to announce the purpose of the Joshua Project and the future
arrival of surveyors. These steps proved to be practical in that they reduced the costs of
the project, and stimulated participation by the major denominations.
Assuring a Scientific and Valid Study
Credentials and credibility are profoundly important in Guatemala. From the
inception of the project this researcher had the guidance of Dr. Edward Buchanan of
Southeastern Baptist Theological Seminary and Dr. Samuel Bouchillon, a medical doctor,
a private consultant and researcher, who works extensively in Third World antibiotic
research. Dr. Mike McAleer, researcher of the Middle America Region of the IMB, also
gave invaluable insights in the early planning stages. Their credentials, as well as this
author's credentials, lent credibility to the project. Dr. Buchanan gave invaluable help in
project design and served as a tireless consultant. Dr. Bouchillon consulted in survey
execution and compilation of the data.
Determining Study Areas and Sample Sizes
The rugged mountains of Guatemala create natural travel and cultural divisions
within the country. There are twenty-three different major languages in Guatemala and
innumerable cultures and subcultures in this tropical country. All who know this country,
110

understand that culture, language, and religion are heterogeneous. Accurate projections
for the entire country cannot be derived from small samples of regions or subcultures.
Many areas and subcultures had to be sampled in order to get a clear representation of the
entire country.
Guatemala is politically divided by Departments, which are similar in concept to
provinces. Each Department is governed by a central town or city called a cabecera.
Departments are divided further into municipios which are governed by the
municipalidad, which can be a city, town, or a village. Municipios are then divided into
the smallest political division, the aldeas, which contain towns, hamlets, settlements, or
open land. Guatemala has 22 Departments and 330 municipios.
Determining Socio/economic Segmentation Factors for Guatemala City
(12 Sample Areas)
Because the Capital and the Interior of the country are entirely different in
demographics, cultures, and homogeneity, these two areas were treated distinctly. This
study divides Guatemala City by socio-economic strata groups based upon discussions
with supervisors in the Area Jefatura de Salud of Quetzaltenango.4,5
4 Based upon an interview with Nora Morales, Director of Social services of the Department ofHealth, Quetzaltenango, Guatemala, 12 April 2001.
5 The Instituto de Estadísticas does not keep records on social classes. The Department of Healthis the main governmental branch that works closely with demographic statistics, but they do not have hardstatistics on economic strata either. As of 2001, no national census has collected this data and even Rentas,or the tax department does not have hard information. Most information that is given in this area is basedupon estimates and projections due to this general lack of good data. This contributes to the fuzzydemographics of various socio/economic groups because there is no governmental baseline.
111

Figure 4.1
Economic Strata of Guatemala City and Surrounding Metropolitan Area
EconomicStrata
Percentage ofUrban
Population
SampleAreas
Surveyed
Names of Surveyed Areas with General Agesof Communities
Upper 0.5 1 Zone 14, 15 (Phone survey)
Upper Middle 3.5 1 Zone 14, 15 (Phone survey)
Middle/Middle 10 2 Zone 6 (new), 11 (Townsend II-established)
Lower/Middle 16 3 Zone 7 (Ciudad de Plata and Tikal I-old), Zone12 (established), Vista Hermosa Petapa (new)
Upper/Lower 20 1 Zone 18 (established)
Middle/Lower 25 2 Zone 19 (La Florida-established, old), San JoseVilla Nueva (new)
Lower/Lower 25 2 Zone 6 (Proyecto 4-4 and Proyecto 4-10-new),Zone 7 (Bethania-new), Zone 12 (established)
Totals 100.0 12
Figure 4.1 shows the general division of economic strata in Guatemala City.
Stratified samples representing each of the major economic classes of Guatemala City
were randomly selected. In addition to economic classes, the sample areas were stratified
by age of the communities. Age was categorized as older established areas, new areas,
fast-growing communities
(colonias), and resettlement areas.
Several samples of 400 were
chosen for the larger economic
strata of the lower and middle
classes. This assured a good
representation of that stratum.
Figure 4.2 indicates the projected
sample size in each of the specific
areas and the actual amount of valid surveys completed.
112
Figure 4.2Sample Sizes of Studied Economic Strata in
Urban Guatemala Area
Projected ActualAsentimientos new Zone 6, 7 400 391Asentamientos old Zone 12 400 331 (Lower/ Lower-Upper)Middle/Lower S Jose Villa Nueva 400 387Middle/Lower Zone 19 200 260Upper/Lower Zone 18 200 199Lower/Middle V. Hermosa Petapa 380 266Lower Mid/Middle Mid Zone 7 400 462Lower/Middle Zone 12 400 484Middle/Middle Zone 6 200 420Middle/Middle Zone 11 200 104Lower/Upper Zone 14 400 177Middle/Upper Zone 15 192
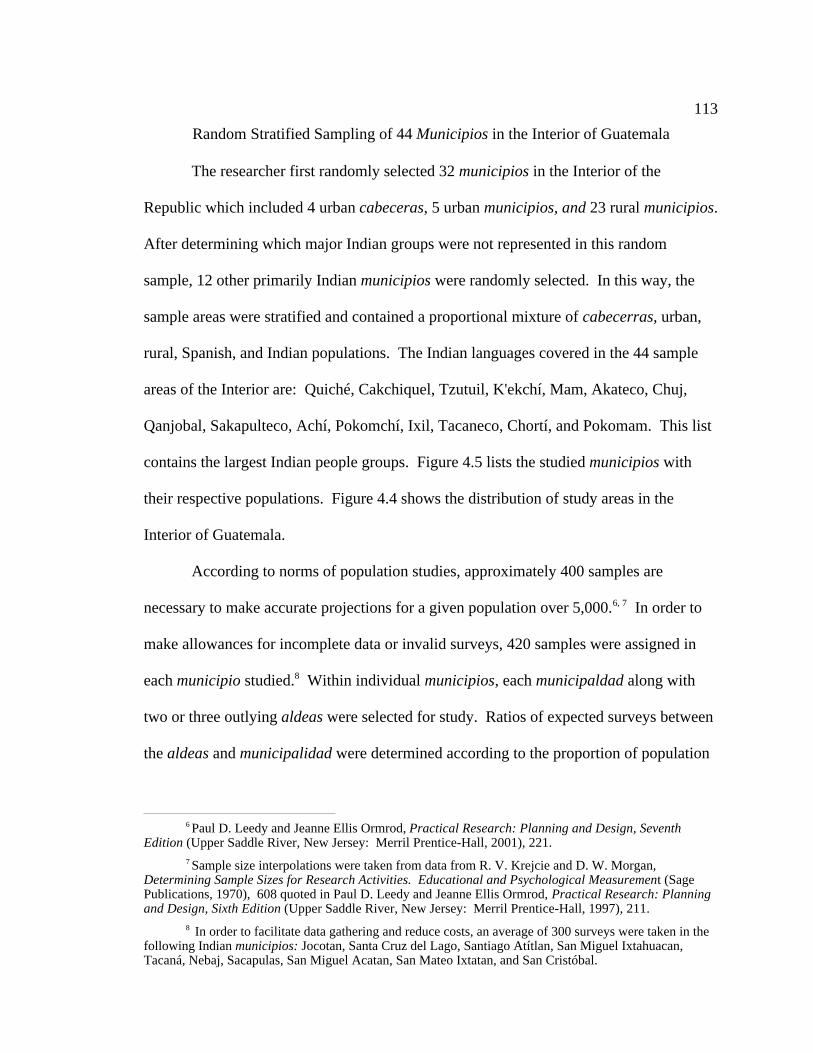
Random Stratified Sampling of 44 Municipios in the Interior of Guatemala
The researcher first randomly selected 32 municipios in the Interior of the
Republic which included 4 urban cabeceras, 5 urban municipios, and 23 rural municipios.
After determining which major Indian groups were not represented in this random
sample, 12 other primarily Indian municipios were randomly selected. In this way, the
sample areas were stratified and contained a proportional mixture of cabecerras, urban,
rural, Spanish, and Indian populations. The Indian languages covered in the 44 sample
areas of the Interior are: Quiché, Cakchiquel, Tzutuil, K'ekchí, Mam, Akateco, Chuj,
Qanjobal, Sakapulteco, Achí, Pokomchí, Ixil, Tacaneco, Chortí, and Pokomam. This list
contains the largest Indian people groups. Figure 4.5 lists the studied municipios with
their respective populations. Figure 4.4 shows the distribution of study areas in the
Interior of Guatemala.
According to norms of population studies, approximately 400 samples are
necessary to make accurate projections for a given population over 5,000.6, 7 In order to
make allowances for incomplete data or invalid surveys, 420 samples were assigned in
each municipio studied.8 Within individual municipios, each municipaldad along with
two or three outlying aldeas were selected for study. Ratios of expected surveys between
the aldeas and municipalidad were determined according to the proportion of population
6 Paul D. Leedy and Jeanne Ellis Ormrod, Practical Research: Planning and Design, SeventhEdition (Upper Saddle River, New Jersey: Merril Prentice-Hall, 2001), 221.
7 Sample size interpolations were taken from data from R. V. Krejcie and D. W. Morgan,Determining Sample Sizes for Research Activities. Educational and Psychological Measurement (SagePublications, 1970), 608 quoted in Paul D. Leedy and Jeanne Ellis Ormrod, Practical Research: Planningand Design, Sixth Edition (Upper Saddle River, New Jersey: Merril Prentice-Hall, 1997), 211.
8 In order to facilitate data gathering and reduce costs, an average of 300 surveys were taken in thefollowing Indian municipios: Jocotan, Santa Cruz del Lago, Santiago Atítlan, San Miguel Ixtahuacan,Tacaná, Nebaj, Sacapulas, San Miguel Acatan, San Mateo Ixtatan, and San Cristóbal.
113

in the municipalidad versus the outlying aldeas. Figure 4.4 is an example of a portion of
the worksheet used to determine specific sample sizes in each municipio.
Figure 4.3
Randomly Stratified Municipios from Interior of Guatemala Studied in the Joshua Project
Department Municipalidad Pop. Muni Department Municipalidad Pop. Muni
Guatemala San Pedro Sacatepequez 31,271 San Marcos Pajapita 15,557
El Progreso Sansare 10,841 Huehuetenango San Miguel Acatan 23,500
Sacatepequez Sumpango 27,753 Huehuetenango San Juan Atitán 16,552
Chiquimula Jocotan 36,747 Huehuetenango San Mateo Ixtatan 31,411
Chimaltenango Zaragoza 17,410 Huehuetenango San Juan Ixcoy 20,737
Escuintla Tiquisate 38,562 El Quiché Santa Cruz El Quiché 46,608
Escuintla Palín 24,914 El Quiché Nebaj 51,643
Santa Rosa Casillas 21,977 El Quiché Sacapulas 33,714
Santa Rosa Oratorio 19,352 El Quiché Canillá 3,231
Sololá Santa Cruz Del Lago 3,453 El Quiché Pachalum 8,121
Sololá Santiago Atítlan 29,380 Baja Verapaz Rabinal 29,342
Totonicapan Totonicapan 103,173 Alta Verapaz San Cristóbal 40,706
Totonicapan San Francisco El Alto 49,068 Alta Verapaz San Pedro Carchá 159,574
Quetzaltenango Concepción Chiquirichapa 21,349 Alta Verapaz Fray Bartolo de Las Casas 39,471
Quetzaltenango Cantel 31,457 Petén San Andrés 15,103
Suchitepequez San Antonio Such. 36,162 Izabal Puerto Barrios 92,507
Suchitepequez San Miguel Panan 7,984 Izabal Morales 89,359
Retalhuleu San Sebastian 21,654 Zacapa Zacapa 58,771
Retalhuleu El Asintal 25,401 Zacapa Estanzuela 11,201
San Marcos San Miguel Ixtahuacan 33,323 Zacapa Usumatlan 9,958
San Marcos Tacaná 70,823 Jalapa San Pedro Pinula 43,162
Jutiapa Yupiltepeque 11,572
Totals 1,513,854
The entire study had 56 sample areas between Guatemala City and the Interior of
the Republic. In 46 of these areas, an average of 380 surveys per area were projected. In
10 areas, 300 surveys were projected. This totals 20,480 surveys to be made throughout
the entire country of Guatemala.
114
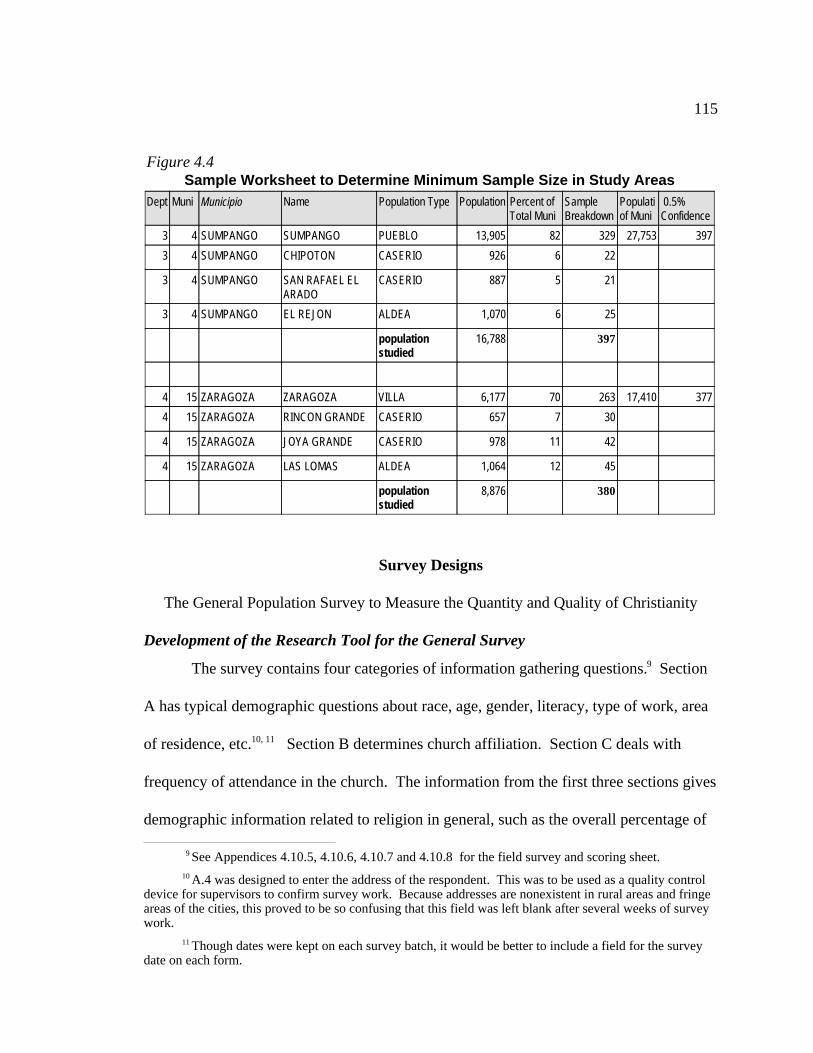
Figure 4.4 Sample Worksheet to Determine Minimum Sample Size in Study Areas
Dept Muni Municipio Name Population Type Population Percent ofTotal Muni
SampleBreakdown
Populatiof Muni
0.5%Confidence
3 4 SUMPANGO SUMPANGO PUEBLO 13,905 82 329 27,753 397
3 4 SUMPANGO CHIPOTON CASERIO 926 6 22
3 4 SUMPANGO SAN RAFAEL ELARADO
CASERIO 887 5 21
3 4 SUMPANGO EL REJON ALDEA 1,070 6 25
populationstudied
16,788 397
4 15 ZARAGOZA ZARAGOZA VILLA 6,177 70 263 17,410 377
4 15 ZARAGOZA RINCON GRANDE CASERIO 657 7 30
4 15 ZARAGOZA JOYA GRANDE CASERIO 978 11 42
4 15 ZARAGOZA LAS LOMAS ALDEA 1,064 12 45
populationstudied
8,876 380
Survey Designs
The General Population Survey to Measure the Quantity and Quality of Christianity
Development of the Research Tool for the General Survey
The survey contains four categories of information gathering questions.9 Section
A has typical demographic questions about race, age, gender, literacy, type of work, area
of residence, etc.10, 11 Section B determines church affiliation. Section C deals with
frequency of attendance in the church. The information from the first three sections gives
demographic information related to religion in general, such as the overall percentage of
9 See Appendices 4.10.5, 4.10.6, 4.10.7 and 4.10.8 for the field survey and scoring sheet.10A.4 was designed to enter the address of the respondent. This was to be used as a quality control
device for supervisors to confirm survey work. Because addresses are nonexistent in rural areas and fringeareas of the cities, this proved to be so confusing that this field was left blank after several weeks of surveywork.
11Though dates were kept on each survey batch, it would be better to include a field for the surveydate on each form.
115

evangelicals, numbers of adherents to specific denominations, concentrated evangelical
areas, areas of lostness, etc. The results of these sections are treated in Chapter 5 of this
paper. Section D deals with attitudes, actions, and opinions of the respondent. This
consists of 49 questions.
Figure 4.5 Sampled Municipios for the General Survey and Pastoral Survey
116

The scoring sheet was designed to be scanned electronically and the resulting
information stored in a database. The scanner and Teleform program reliably read
blocked circles or spaces. Due to handwriting quality, letters and numbers are read with
less precision. The score sheet was designed to record as much blocked information as
possible, with the least amount of written information as possible. Each letter sized page
contains three sets of score spaces.
An Initial Explanation of the Forty-nine Questions in the General Survey
The last section of the General Survey contains 49 questions to gather information
over areas such as basic evangelical doctrine, cardinal Catholic doctrine, ethics,
superstitions, Mayan beliefs, morals, and attitudes about the church. This information is
designed to give insight into levels of syncretism, Bible application, and discipleship.
There is also a question about usage and coverage of Christian Radio. The initial
theological, moral, and ethical questions were developed by two local pastors and this
researcher. The questions relating to culture, Mayan Beliefs, and Superstitions, were
developed by a Guatemalan anthropologist, Luz Marina Delgado; a businessman,
Guillermo Santos; and this researcher. Both Delgado and Santos are former Catholics
whose insight into Catholic culture was invaluable. All questions were then presented to
the members of the Guatemala City SEPAL team and to members of the Alianza
Evangélica who then made clarifications, deletions, and additions. Final refinements in
content and wording were made after three pilot surveys were completed. The pilots also
confirmed that most Guatemalans would respond to the 49 well-framed questions in a
117

personal survey. The volume of questions was problematical for phone surveys and the
survey was modified accordingly. (See Appendix 4.12.)
The questions were designed to be answered with a simple "Yes," "No," or "I Do
Not Know." The latter is abbreviated with the question mark, "?". This simple response
design was used in place of a Likert scale as most of the population is illiterate and
therefore are concrete thinkers.12, 13 Details of the questions used are in Appendix 6.1
entitled "An Explanation of the 49 Questions in the General Survey."
The scores derived from the answers from questions in Section D of the General
Survey offer clear understanding about a specific group's level of Christian commitment.
The questions are designed to demonstrate the level of syncretism in areas of Catholic
doctrine, Mayan teachings, and Catholic practices. They measure very basic Christian
doctrine that relates to foundational themes of salvation and the exclusivity of Christ's
claims. Christian morals, attitudes and actions, are measured in a combined category
called "Christian Living." These parameters together provide the data necessary to
evaluate the degree of internalization of the Gospel. The results from these questions
help Christian leaders to evaluate the effectiveness of the training and discipleship of
their denomination.
12The Likert scale raised much confusion in pilot rural settings. This not only slowed down theprocess but created uncertain answers by the respondents. These people responded more readily toaffirmative, negative or unknown.
13Each question has a value of 1 point if it is answered correctly according to Biblical norms and -1point if he incorrectly answered according to Biblical standards. If the respondent did not know the answeror was unsure of the answer, the score was 0 points. When an answer should be known by a Christian, aneutral answer received -1 point.
118

Designing the Pastoral Survey to Give Insight into
Denominational Health and Needs
The Pastoral Survey was designed by this researcher and members of the SEPAL
team. After initial design, the survey was presented to a committee of the Alianza
Evangélica for their input and revision. The tool was designed to give general church
information and specific felt needs of pastors. It is designed for a friendly audience who
gives thought to the questionnaire. It is divided into the following categories: general
demographics, education, ethnolinguistic information, discipleship, finances, use of time,
pastoral experience, general church information, and perceived educational needs. In the
design stages some pastors expressed skepticism about obtaining sensitive church growth
information. All were excited about the tool's ability to pinpoint the pastors' felt training
needs. This feature made the survey's perceived intrusiveness tolerable to leaders.
The survey itself was reduced to two pages and designed to be written on.14 There
was no special data sheet for this survey. Final data for these surveys were entered into a
database by hand.
Denominational Leader Structured Interviews to
Discover Lessons and Strategies from Successful Denominations
Structured interviews were designed for leaders of the twelve fastest growing or
major denominations.15 The interviews were designed to obtain the following
information: a brief history of the denomination and reasons for significant growth,
interventions of God in the work, the role of leadership and its development in the work,
general religious education and discipleship, special problems and challenges in the work,
14See Appendix 4.11.1 for the survey and its format.15A special thanks to Abner Rivera for helping in interview design.
119

status of missions, and the Church's involvement in social ministries in Guatemala. At
times the interviews departed from the guide as they flowed with the context and
discussion of each leader.
These interviews are designed to be published and shared with the entire
evangelical church. Most denominations do not have an idea what other groups are doing
because they are heavily focused on their own work. These interviews are meant to serve
as tools of encouragement and learning between denominations. The general questions
for the interviews are found in Appendix 4.13.
Field Testing the General Survey
Before entering into the massive nation-wide survey, the SEPAL team tested
preliminary surveys and procedures on a small scale with twelve volunteers in the rural
town of Comitancillo, San Marcos and later, two areas of Guatemala City. Procedures
are in Appendices 4.6 through 4.18 and reflect the final results after pilot testing.
Procedurally, SEPAL learned that there must be continuity among the surveyors.
They had to be trained in map reading, understanding interviewee selection, proper
administration of the surveys, appropriate interaction with the interviewees, and proper
record maintenance. Surveyors had to familiarize themselves with the survey tools, and
be an integral part of a team so as to keep vigil over the safety of each team member. The
pilot work demonstrated that surveyors had to be employed in order to assure consistent,
quality work under difficult working conditions.
The content and style of the General Survey were refined as a result of the pilot
study. The pilot demonstrated consistently that certain questions were unclear, and others
provoked a long answer. The field workers discovered that certain questions refined by
120

educated theologians had to be rephrased in order to be clearly understood on the street.
Part of the demographic section of the General Survey was also modified due to the
observations of the field workers.
A former SEPAL researcher told Kory Eller that we must "test, test, and retest the
survey." The lessons learned from the pilot studies refined the research tool. The lessons
gave this researcher a practical idea of the time frame and number of paid workers
required to execute successfully the entire data collection.
Executing the General Survey
Recruitment of Surveyors
SEPAL offices were responsible for the recruitment of surveyors. On the basis of
survey work of the past, they decided upon minimum qualifications for surveyors. The
Joshua Project was advertised through leaders connected to the Alianza Evangélica,
Christian Radio, and by the leadership of major denominations. Because of heavy
denominational participation in initial planning, research tool development, and
communication, most denominations centered in the Capital aided in recruitment of
surveyors.
The advertised qualifications for surveyors were:
Age: between 20 and 30 yearsSex: Male or a married couple without childrenCivil State: Single or MarriedEducation: Diversificado or Ninth grade is minimumMust be a mature ChristianMust be well-groomed and manneredMust be available to travel outside of the Capital a week at a timePreferably has previous survey experience and has worked in primitive areas.
121

Training
All surveyors were trained in a week long session which included classroom and
field work components. The major purpose and goals of the project were presented to the
surveyors.16 They understood their positions as ministers, who were contributing to the
expansion of the Evangelical Church of Guatemala. The following themes were covered:
The Employee-Employer Relationship; How to Present the General Survey; Details of
General Survey; The Pastoral Survey; How to Use Maps; How to Write for the Computer
Scanner; Safety and First-Aid; Ethics and Honesty, and Personal Commitment. The
surveyors put their training into practice throughout the week under teacher supervision.
Problems and doubts were addressed in group sessions.
Supervision
Surveyors were divided into groups of five people with one assigned as the group
leader. Each week, groups were assigned specific municipios to survey. Teams were
given maps with specific houses or streets to survey in different parts of a city or town.17
Team leaders were responsible to assure that each member completed their allotment of
weekly surveys. At the end of each day, the team leader reviewed each survey to assure it
was completed and filled out legibly. If it was not, then the surveyor had to copy the
information to a fresh answer sheet.
Mapping information made it possible to assure that a representative cross section
of the community was sampled. The samples were always a mixture of older sections of
16See Appendices 4.4, 4.5, and 4.6 for some of the materials used in training.17See sample maps in Appendices 4.10.2, 4.10.3, and 4.10.4.
122

town, new settlements, slums, rich sections, etc. The maps served as a guide to office
supervisors who at a later date could double check that given areas had been surveyed.
Data Collection
Four trained survey teams of five were sent out in mid-November, 2000. Three of
the teams completed the entire five months of surveys with the last data collection
finished in late April 2001. Two new teams of five were brought in after January of 2001
and March of 2001. Teams were instructed to survey only one member per household
between the ages of 19 and 56 years. No surveys were to be made with people in the
streets or in a public gathering, but rather, surveys were to be made in specific houses that
were marked on maps of all survey areas. If the respondent was not at home, the surveyor
went to the next house. Maps were marked with 50% more houses than necessary to give
leeway for no response due to lack of interest or to the respondent not being home. Teams
were instructed to maintain purposefully an equal ratio of male to female respondents.
Teams were monitored weekly as their work was evaluated. Spot checks by supervisors
were made in work areas each week to assure the integrity of data collection.
Reporting and Evaluation
Each week, survey teams debriefed in SEPAL offices or the Quetzaltenango
offices. Completed survey forms with observations were turned in during this time.
Survey work from the previous session was evaluated. Evaluations were based upon
goals, completeness, and neatness of survey work.
123

Processing of the Data
Original survey forms were sent to the United States and scanned into a database
using Teleform. The electronic data were mailed via email attachment to Guatemala,
processed, and then compared twice with the field copies of the surveys. During the
process, all inconsistent surveys were eliminated. Overall, nearly 4% of the surveys were
discarded because of common errors such as, illegibility, incompleteness, and logically
contradictory answers (eg. a single man whose wife attends church). Several teams had
problems entering the correct geographic codes on a number of occasions, but due to
redundant record keeping, it was possible to make corrections. Nearly 2% of the data did
not have critical demographic information such as race and class. This type of omission
was usually easy to extrapolate due to the context of other results in the same area of the
same week of study. A very small number of unrecorded religious data could not be
reconstructed, making it necessary to eliminate the entire record. At the beginning of the
project, surveyors committed more entry and omission errors but these were greatly
reduced due to weekly evaluations.
The cleaned data were manipulated with Microsoft Excel, Microsoft Access and
Systat 8.8.
Disseminating the Results of the Research
General Survey: Demographics of the Church
In July of 2001, the SEPAL group made an initial presentation of the demographic
data to the Alianza Evangélica, an interdenominational group that represents most
124

traditional evangelicals, in order to solicit feedback and critique. Three weeks later, the
general demographic information was presented to a large conference of 104 evangelical
denominational leaders in the Hyatt Hotel of Guatemala City. Although many were
disappointed with the lower than anticipated percentage of evangelicals, all leadership
was grateful and strongly supported the research results.
The results of the demographic section of the study were completed in late 2001.
SEPAL printed the initial materials in a reader friendly format in their monthly
newsletter, "Notas Para Pastores." This periodical newsletter is delivered to all major
denominations with nearly one third of all evangelical pastors receiving it. "Notas"
contained some preliminary information which has been updated in Chapter 5 of this
document. The newsletter is in Appendix 4.18. The final contents of the demographic
section were emailed to SEPAL leadership in November of 2001.
A focus group was held with IMB leadership in Richmond, Virginia on 9
November 2001 to present and discuss data derived from the research. Jim Slack of the
IMB Office of Research, along with his staff, were present. Phil Templin, (the D.Min.
project field supervisor as well as Region Leader) and Ken Sorrell of the Middle America
Leadership Team were present as well. This researcher was accompanied by Edward
Buchanan and results, techniques, and conclusions were presented and discussed. The
results of the discussions are found in the body of Chapter 5, "The Quantity and Location
of the Evangelical Church in Guatemala: The Demographic Study of Religion," as well
as in the accompanying appendices.
125

General Survey: The Level of Internalization of the Gospel in Guatemala
Results pertaining to internalization of the Gospel or the health of the church were
presented in two focus groups. The first was presented to SEPAL in Guatemala City on
9 November 2001. The second focus group met with IMB personnel in Richmond,
Virginia on 15 April 2002. (This was the same IMB personnel as the previous 21
February Demographic Study in Richmond.) The discussions centered on syncretism and
lost people groups. IMB personnel made many helpful suggestions to simplify the
presentation of some materials. Chapter 6, "The Nature of the Typical Evangelical in
Guatemala," and Chapter 7, "A Comparison of the Level of Internalization of the Gospel
among Major Denominations of Guatemala" reflect suggestions made by the IMB staff.
Final reports were emailed to the members of the Area Office-IMB, the Office of
Research-IMB and SEPAL on 29 June 2002.
Analysis of the Reasons Why Certain Denominations
Have Experienced Explosive Growth in Guatemala
General discussions of the reasons for growth of the Evangelical Church have
consistently been interwoven in all focus groups and conferences. Final reporting was
sent to the Leadership Team of IMB Middle America Region, Office of Research-IMB
and SEPAL on 3 June 2002. The final report is the contents of Chapter 3 of this
document, "Factors for the Miraculous Growth of Evangelicals in Guatemala until 1991
and the Subsequent Plateau in Church Growth: Secondary Research."
126

Lessons of Successful Denominations
An initial report of the lessons from other denominations was given to SEPAL
leadership in Guatemala City on 24 April 2002. Final reports were sent to the Leadership
Team of IMB Middle America Region, Office of Research-IMB and SEPAL on 3 June
2002. The final report is the contents of Chapter 8, "Inside the Evangelical
Denominations of Guatemala: The Leaders Speak."
Conclusion
The design and implementation of the Joshua Research Project were successful in
obtaining the necessary data to fulfill the needs of this research project. The manner in
which the data was collected, processed, and disseminated, created a high level of
credibility and acceptance by Guatemalan evangelical leaders, the Office of Research of
the IMB, the Middle America Leadership team-IMB, and SEPAL.
127