chapter 5. fault tree analysis (fta) - ntnu · 2018-07-06 · fault tree basics minimal cut sets...
TRANSCRIPT

Chapter 5.Fault Tree Analysis (FTA)
Mary Ann Lundteigen Marvin Rausand
RAMS GroupDepartment of Mechanical and Industrial Engineering
NTNU
(Version 0.1)
Lundteigen& Rausand Chapter 5.Fault Tree Analysis (FTA) (Version 0.1) 1 / 19

Introduction
Learning Objectives
The main learning objectives associated with these slides are to:I Give an overview and brief introduction to fault tree analysisI Describe the relationship between reliability block diagrams and fault
trees
The slides include topics from Chapter 5in Reliability of Safety-CriticalSystems: Theory and Applications. DOI:10.1002/9781118776353.
Lundteigen& Rausand Chapter 5.Fault Tree Analysis (FTA) (Version 0.1) 2 / 19

Introduction
Outline of Presentation
1 Introduction
2 Fault Tree Basics
3 �alitative Analysis
4 �antitative Analysis
5 Common Cause Failures
6 Importance measures
Lundteigen& Rausand Chapter 5.Fault Tree Analysis (FTA) (Version 0.1) 3 / 19
Fault Tree Basics
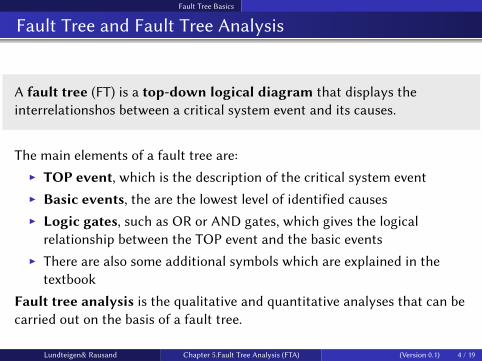
Fault Tree and Fault Tree Analysis
A fault tree (FT) is a top-down logical diagram that displays theinterrelationshos between a critical system event and its causes.
The main elements of a fault tree are:I TOP event, which is the description of the critical system eventI Basic events, the are the lowest level of identified causesI Logic gates, such as OR or AND gates, which gives the logical
relationship between the TOP event and the basic eventsI There are also some additional symbols which are explained in the
textbook
Fault tree analysis is the qualitative and quantitative analyses that can becarried out on the basis of a fault tree.
Lundteigen& Rausand Chapter 5.Fault Tree Analysis (FTA) (Version 0.1) 4 / 19

Fault Tree Basics
Fault Tree Analysis Steps
Fault tree analysis is o�en carried out in five steps:
1. Definition of the problem, system, and boundary conditions of theanalysis
2. Construction of the fault tree
3. Identification of minimal cut sets
4. �alitative analysis of the fault tree
5. �antitative analysis of the fault tree
Lundteigen& Rausand Chapter 5.Fault Tree Analysis (FTA) (Version 0.1) 5 / 19

Fault Tree Basics
Fault Tree vs Reliability Block Diagram
A fault tree may be converted into a reliability block diagram and vice verse,as illustrated below.
1 32
1
2
3
1
2
3
TOP
21 3
TOP
21 3
TOP
1 G1
2 3
(i)
(ii)
(iii)
Lundteigen& Rausand Chapter 5.Fault Tree Analysis (FTA) (Version 0.1) 6 / 19
Fault Tree Basics
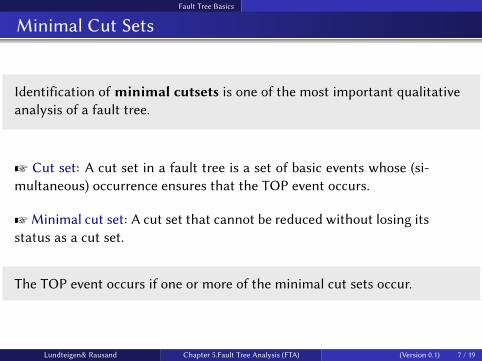
Minimal Cut Sets
Identification of minimal cutsets is one of the most important qualitativeanalysis of a fault tree.
Z Cut set: A cut set in a fault tree is a set of basic events whose (si-multaneous) occurrence ensures that the TOP event occurs.
ZMinimal cut set: A cut set that cannot be reduced without losing itsstatus as a cut set.
The TOP event occurs if one or more of the minimal cut sets occur.
Lundteigen& Rausand Chapter 5.Fault Tree Analysis (FTA) (Version 0.1) 7 / 19

Fault Tree Basics
Fault tree modelingExample
Consider the reliability block diagram of the SIF shown below:
PT1 PT2
LSPT1 PT3
PT2 PT3
SDV1
SDV2
We can already now, on the basis of the fault tree, identify the minimal cutsets (denoted Ci):
C1 = {PT1, PT2}C2 = {PT1, PT3}C3 = {PT2, PT3}C4 = {LS}
C5 = {SDV1, SDV2}
Lundteigen& Rausand Chapter 5.Fault Tree Analysis (FTA) (Version 0.1) 8 / 19

Fault Tree Basics
Fault Tree Example
Consider a SIF that comprises three pressure transmi�ers (voted 2oo3), one logic solver, andtwo shutdown valves (voted 1oo2). The critical event is that the pressure becomes to high,due to a failure of the SIF. The corresponding fault tree can be as shown below.
Critical high pressurein pipeline when
outlet blocked
Logic solver does not transmit signal
about high pressure
Shutdown valvesfail to close on
demand
SDV 1 fails to close
SDV 2 fails to close
LS
SDV2SDV1
TOP event description
OR-gate
No signal about highpressure from the
pressure transmitters
PT 1 and PT 2 fail to signal high pressure
PT 1 fails to signal high
pressure
PT 1 fails to signal high
pressure
PT 1 fails to signal high
pressure
PT 3 fails to signal high
pressure
PT 2 fails to signal high
pressure
PT 3 fails to signal high
pressure
PT 1 and PT 3 fail to signal high pressure
PT 2 and PT 3 fail to signal high pressure
PT1PT1 PT2PT2 PT3 PT3
AND-gate
Basic events(description and symbols)
We can from this small fault tree identifythe following cut sets:
C1 = {PT1, PT2}C2 = {PT1, PT3}C3 = {PT2, PT3}C4 = {LS }
C5 = {SDV1, SDV2}
With larger and more complex fault trees we need to use special tools (implementingalgorithms for extraction) of minimal cut sets.
Lundteigen& Rausand Chapter 5.Fault Tree Analysis (FTA) (Version 0.1) 9 / 19
Fault Tree Basics
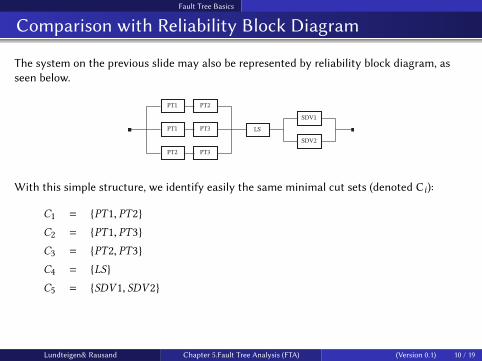
Comparison with Reliability Block Diagram
The system on the previous slide may also be represented by reliability block diagram, asseen below.
PT1 PT2
LSPT1 PT3
PT2 PT3
SDV1
SDV2
With this simple structure, we identify easily the same minimal cut sets (denoted Ci):
C1 = {PT1, PT2}C2 = {PT1, PT3}C3 = {PT2, PT3}C4 = {LS}
C5 = {SDV1, SDV2}
Lundteigen& Rausand Chapter 5.Fault Tree Analysis (FTA) (Version 0.1) 10 / 19

Fault Tree Basics
Fault Tree Symbols for koon Systems
The fault tree structure below indicates that the subsystem of pressure transmi�ers arevoted 2oo3.
Original structure:
No signal about highpressure from the
pressure transmitters
PT1 and PT2 fail to signal high pressure
PT1 fails to signal high
pressure
PT1 fails to signal high
pressure
PT1 fails to signal high
pressure
PT3 fails to signal high
pressure
PT2 fails to signal high
pressure
PT3 fails to signal high
pressure
AND-gate
PT1 and PT3 fail to signal high pressure
PT2 and PT3 fail to signal high pressure
PT1PT1 PT2PT2 PT3 PT3
PT
Modified with gate symbol for koon:
No signal about highpressure from the
pressure transmitters
PT1 fails to signal high pressure
PT2 fails to signal high pressure
PT3 fails to signal high pressure
PT1 PT2 PT3
PT
2/3
Note that the k/n gate is (n − k + 1)/nif it represents the failure of koon sys-tem.
Lundteigen& Rausand Chapter 5.Fault Tree Analysis (FTA) (Version 0.1) 11 / 19
�alitative Analysis
�alitative Analysis
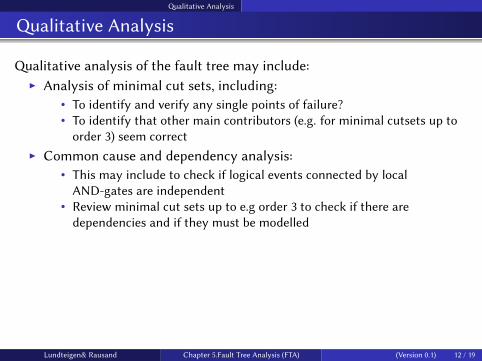
�alitative analysis of the fault tree may include:I Analysis of minimal cut sets, including:
• To identify and verify any single points of failure?• To identify that other main contributors (e.g. for minimal cutsets up to
order 3) seem correctI Common cause and dependency analysis:
• This may include to check if logical events connected by localAND-gates are independent
• Review minimal cut sets up to e.g order 3 to check if there aredependencies and if they must be modelled
Lundteigen& Rausand Chapter 5.Fault Tree Analysis (FTA) (Version 0.1) 12 / 19

�antitative Analysis
�antitative Analysis
I The TOP event occurs if one of the minimal cut sets occursI The main challenge is therefore to identify the minimal cut setsI If all minimal cut sets were independent, we could calculate the the
probability of the top event by:
Q0 (t) = 1 −k∏j=1
[1 − Q̌j (t)]
where Qj (t) is the failure probability of minimal cut set Cj :
Q̌j (t) =∏i∈Cj
qi (t)
Lundteigen& Rausand Chapter 5.Fault Tree Analysis (FTA) (Version 0.1) 13 / 19
�antitative Analysis
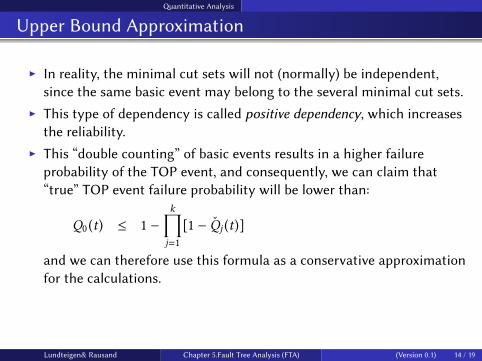
Upper Bound Approximation
I In reality, the minimal cut sets will not (normally) be independent,since the same basic event may belong to the several minimal cut sets.
I This type of dependency is called positive dependency, which increasesthe reliability.
I This “double counting” of basic events results in a higher failureprobability of the TOP event, and consequently, we can claim that“true” TOP event failure probability will be lower than:
Q0 (t) ≤ 1 −k∏j=1
[1 − Q̌j (t)]
and we can therefore use this formula as a conservative approximationfor the calculations.
Lundteigen& Rausand Chapter 5.Fault Tree Analysis (FTA) (Version 0.1) 14 / 19
�antitative Analysis
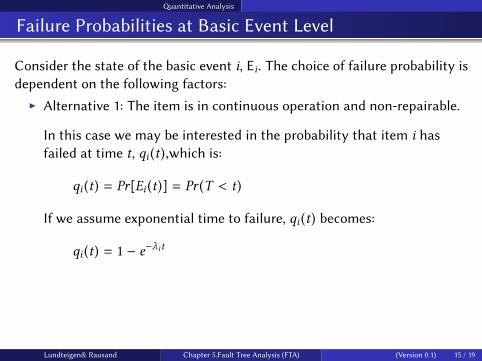
Failure Probabilities at Basic Event Level
Consider the state of the basic event i, Ei. The choice of failure probability isdependent on the following factors:I Alternative 1: The item is in continuous operation and non-repairable.
In this case we may be interested in the probability that item i hasfailed at time t, qi (t),which is:
qi (t) = Pr[Ei (t)] = Pr (T < t)
If we assume exponential time to failure, qi (t) becomes:
qi (t) = 1 − e−λit
Lundteigen& Rausand Chapter 5.Fault Tree Analysis (FTA) (Version 0.1) 15 / 19

�antitative Analysis
Failure Probabilities at Basic Event Level
I Alternative 2: The item is in continuous operation and repairable.
We assume that the item runs to failure and is then repaired. In thiscase, we may want to determine the mean unavailability of the item:
qi =MTTRi
MTTFi +MTTRi≈ λiMTTRi
where MTTRi is the mean time a�er the failure, and MTTFi is themean time to failure.
Note that we here have assumed (again) exponentially distributed timeto failure so that 1/MTTFi = λi
Lundteigen& Rausand Chapter 5.Fault Tree Analysis (FTA) (Version 0.1) 16 / 19

�antitative Analysis
Failure Probabilities at Basic Event Levels
I Alternative 3: The item is normally passive and therefore subject toregular testing and repair.
In this case, we may want to choose the mean unavailability or meandowntime due to a hidden failure:
qi =λiτ
2+ Pr(Failure found) ·Mean repair time
≈λiτ
2+ λiτ
MRTiτ
I Note that λi in this case represents the dangerous undetected (DU)failures, and that the mean down time due to other failure categoriesmay need to be added in addition.
Lundteigen& Rausand Chapter 5.Fault Tree Analysis (FTA) (Version 0.1) 17 / 19

Common Cause Failures
Inclusion of Common Cause Failures (CCFs)
There are mainly three strategies to modeling CCFs in relation to fault treeanalysis:
1. Include in FT (explicit): Model each CCF cause as a separate basicevent that may lead to the failure of several items
2. Include in FT (implicit): Model a CCF as a basic event that coversseveral causes that may lead to the failure of several items
3. Exclude from FT: Add the contribution from CCFs in the quantificationa�er the minimal cut sets have been extracted.
The last option may be favorable when the system complexity is high, andwhere dependency may exist between basic events at di�erent levels andsection of the fault tree.
Lundteigen& Rausand Chapter 5.Fault Tree Analysis (FTA) (Version 0.1) 18 / 19

Importance measures
Important Measures
Several importance measures have been developed to measure the relativeimportance of basic events. One of particular importance is the Birnbaummeasure, where the relative importance of basic event i is measures by:
IB (i |t) =δQ0 (t)δqi (t)
This may also be calculated more easily as:
IB (i |t) = Q0 (t |Ei (t) = 1) − Q0 (t |Ei (t) = 0)
Lundteigen& Rausand Chapter 5.Fault Tree Analysis (FTA) (Version 0.1) 19 / 19