chapter 5. microclimate - idaho fish and game 5. microclimate - multi-species baseline initiative...
TRANSCRIPT

CHAPTER 5. Microclimate - Multi-species Baseline Initiative Lucid, M.K., L. Robinson, and S.E. Ehlers. 2016. Multi-species Baseline Initiative project report. 2010-2014. Idaho Department of Fish and Game, Coeur d'Alene, Idaho, USA. Introduction Global climate change is expected to have widespread effects on temperature and precipitation regimes worldwide and mean annual global air temperatures are predicted to rise 2-4.5°C by the end of this century (Meehl et al. 2007). Conditions in the Pacific Northwest are expected to trend toward hotter drier summers and warmer wetter winters (Karl 2009). How wildlife populations will respond to these changes is uncertain. A clear understanding of local climatic landscapes and climatic requirements of wildlife species is the first step toward managing landscapes to reduce potential climatic stressors on wildlife species but empirical data to evaluate basic climatic requirements for most species are lacking (Mawdsley 2009). Delineating climatic requirements for species will inform landscape management on multiple spatial scales. On the macro-scale, a regional air temperature map could pinpoint cooler sections of the landscape which may be more important to species dependent on late spring snowpacks such as wolverines (Gulo gulo) (Inman et al. 2012). These areas may become more important both for wolverines and winter recreationists and careful planning now could help prevent future conflicts. Data collection for regional maps can be done simultaneously with the collection of micro-climate data for less vagile species such as terrestrial gastropods. The identification of species with specific climatic requirements may allow implementation of micro-habitat management techniques which could reduce the effects of climate change at micro-sites. Available micro-climate data from our study area are limited. Several networks of micro-climate data loggers and weather stations have been deployed in portions of our study area in recent years (Holden et al. 2011, Holden et al. 2015). Additionally, a variety of stream water temperature data loggers (Isaak 2015) and 15 Snowtel sites also occur within our study area. Lacking completely from our study area are water temperature data for small (≤500 meter diameter) lentic ponds. To our knowledge, micro-climate data loggers have never been co-located with wildlife survey locations within our study area. The Idaho (2005) and Washington (2005) State Wildlife Action Plans did not address climate change. Because Idaho and Washington both planned to incorporate climate change into the 2015 SWAP revisions, the MBI Competitive State Wildlife Grant was funded in part to address the emerging issue of climate change. Our goals were to 1) develop an air temperature map of the study area, 2) delineate air or water temperature envelopes for individual species 3) develop a baseline micro-climatic data set including air temperature, water temperature, and relative humidity variables to be available for use by other researchers and resource managers. Methods Study Design We stratified our 22,975km2 study area into 920 5x5km sampling grids (Map 5-1) and deployed at least one air temperature data logger for a minimum of twelve months in 803 cells. We did not install air temperature loggers in 116 cells because we were unable to gain access to privately owned land or lacked a suitable location for the logger at the survey site. We selected our terrestrial survey sites in 3 ways (see Chapter 2, Invertebrates for more detail): 1) technicians
204
selected sites while in the field (n = 172), 2) randomly but biased to roads and trails (n = 670), or 3) sub-selected from randomly selected Forest Inventory and Analysis (FIA) plots (n = 150). We attempted to deploy water temperature data loggers at ponds which fell in the same survey cell as the 150 FIA plots. However, we were only able to successfully find ponds in 55 (37%) FIA cells. Therefore, we deployed the remaining water temperature loggers as ponds became available. In total, we deployed air temperature data loggers at 951 sites for 1 (n = 549), 2 (n = 27), 3 (n = 290), or 4 (n = 85) years. We deployed relative humidity data loggers at 200 sites and 151 water temperature data loggers at 133 ponds. All data loggers were synchronized to collect a data point every 90 minutes. This document provides a summary of climate data collected from September 1, 2013-August 31, 2014. Data collected prior to September 1, 2013 will be used for future analyses. Field Methods Air Temperature and Relative Humidity - We used TRIX8 or TRIX16 LogTag® Transit data loggers to collect air temperature data and HAXO8 LogTag® Transit data loggers to collect air temperature and relative humidity data concurrently. TRIX8 and HAXO8 loggers can store 8,000 readings and were collected after approximately one year of deployment. TRIX16 loggers store up to 16,000 readings and were collected after a two year deployment.
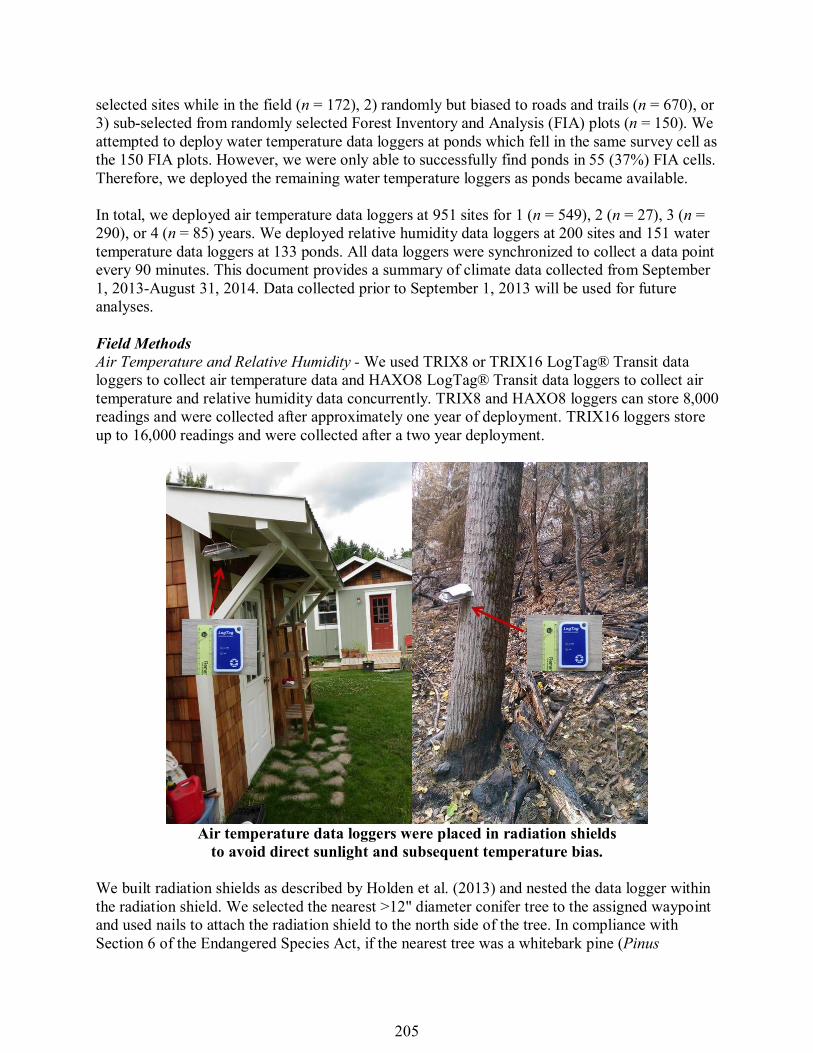
Air temperature data loggers were placed in radiation shields
to avoid direct sunlight and subsequent temperature bias. We built radiation shields as described by Holden et al. (2013) and nested the data logger within the radiation shield. We selected the nearest >12" diameter conifer tree to the assigned waypoint and used nails to attach the radiation shield to the north side of the tree. In compliance with Section 6 of the Endangered Species Act, if the nearest tree was a whitebark pine (Pinus
205

albicaulis), we did not attach hardware to the tree but selected the nearest conifer of a different species. If no conifer trees were present we mounted the radiation shield on a post. We then photographed the radiation shield. The latest air temperature data logger deployment date was August 27, 2013 and the latest water temperature deployment date was September 5, 2013. All air and relative humidity data loggers were removed from the field between September 4 and October 31, 2014. Therefore, air temperature data were collected from each survey site in the study area (n = 941) for a continuous 12 month period (September 1, 2013-August 31, 2014). When loggers were removed in 2014, we took a photograph of each radiation shield and three site photographs facing 45°, 180°, and 315° from the radiation shield tree. Radiation shield height (bottom of shield) from ground was measured and a shade index was estimated: 1-completely open (clear cut or field), 2- some direct sun but not completely open, 3- mostly shade, 4- completely shaded. Observers noted if the logger was on the ground and if any obvious recent landscape changes (clear cut, forest fire, etc.) had occurred.
Water Temperature - We deployed 151 of Onset® HOBO® TidbiT® v2 Submersible Temperature Loggers at 133 of ponds. We deployed one data logger at 131 ponds in 2013 and an additional 2-3 data loggers at the seven 2014 temporal wetlands (Chapter 3, Amphibians). Data loggers were deployed at depths ranging from 4 – 140 cm (mean = 37 cm). We built PVC radiation shields as described by Isaak et al. (2013), zip-tied the logger to the cap of the radiation shield and attached the radiation shield to an anchor using underwater epoxy
Idaho Fish and Game Conservation Officers assisted with micro-climate monitoring.
206

(Isaak et al. 2013). We attempted to attach radiation shields to large boulders at the shore line. However, pond conditions sometimes dictated we attach loggers to smaller rocks which were deployed either near the shoreline or toward the center of the pond depending on pond depth. Occasionally radiation shields were zip-tied to logs in the pond if no rocks were available. Data loggers were re-visited at least 12 months after initial deployment and data were downloaded with an Onset® HOBO® Datalogger Waterproof Shuttle and downloaded to a computer using Onset® HOBO® HOBOware® Pro Software. The radiation shield was photographed and depth was measured during the revisit. Data loggers were left in the field retaining the battery life and memory to log data until summer 2019.
Water temperature data loggers were protected by PVC radiation shields and attached to rocks in lentic wetlands with underwater epoxy.
207

Analysis Erroneous Air Temperature Data - We encountered two situations in which data loggers collected erroneous data: sunlight directly hitting the radiation shield and the radiation shield being buried by or otherwise affected by snow. We worked with Andrew Shirk of the University of Washington Climate Impacts group to develop an algorithm to weed out erroneous data points and impute small data gaps (Appendix 5-c).
Figure 5-1. Accurate (top) and erroneous data (bottom) air temperature data logs.
Table 5-1. Erroneous Air Temperature Algorithm Rules Maximum allowed daily temperature 38.8°C Minimum allowed daily Temperature -30.0°C Minimum min-max daily temperature range 2.0°C Maximum temperature anomaly threshold 2.5°C Maximum allowed missing observations per day 2 Maximum allowed interpolated observations per day 2
208

Missing Relative Humidity Data - Relative humidity data did not appear to be affected by sunlight. However, loggers did not collect data when snow covered. We used the algorithm to calculate a variety of relative humidity variables and to describe the percentage of missing data for each logger. Erroneous Water Temperature Data - Pond hydrology was dynamic and some loggers were exposed to air as pond depth decreased over the course of the summer. If the radiation shield was covered by water when we downloaded data in September 2014, we assumed the logger was continuously under water from March-August. We used Onset® HOBO® HOBOware® Pro Software to visualize pond data to further determine if loggers had been exposed to air. If loggers recorded a temperature below 0°C we assumed the logger was exposed to air from that point forward. If the radiation shield was exposed to air during the September data download we examined pictures of the logger and viewed the data to make a conservative estimate of when the logger was exposed to air. We visually estimated which month the logger was exposed to air and removed that entire month of data and all subsequent months of that year. Mean Annual Air Temperature - We calculated the mean annual air temperature for each survey site (n = 905) for the period of September 1, 2013-August 31, 2014. We used the algorithm to remove erroneous data and calculate the percentage of missing data. We removed sites which had ≥75% missing data (n = 12). An additional 14 loggers were removed from the analysis due to an algorithm error which was later fixed. These loggers had missing data ranging from 24-71%. A total of 26 loggers were removed from the analysis and we used the remaining sites (n = 879) for the analyses described in this report. March-August Mean Water Temperature - We calculated the mean March-August temperature for data loggers which were not exposed to air (n = 83) and used this variable for the analyses described in this report (Map 5-3).
Figure 5-2. Read out from water temperature data logger. Vertical maroon line is a selection tool which is part of the software.
209

Other Air Temperature Variables - We calculated monthly and quarterly mean, minimum, and maximum temperatures for each logger. We calculated annual variables for both the calendar year (January 1-December 31) and for the period in which we had loggers at each survey site (September 1-August 31). Annual variables included mean warmest month temperature (MWMT), mean coldest month temperature (MCMT), temperature difference between warmest and coldest months (TD), degree days < 0C (DDLT0), degree days < 18C (DDLT18), degree days > 5C (DDGT5), degree days > 18C (DDGT18), number of frost free days (NFFD), julian day beginning the frost free period (bFFP), julian day ending the frost free period (eFFP), and days in the frost free period (FFP). Additionally, we calculated variables directly related to our survey period including mean, minimum, and maximum temperatures for the 48 hours immediately following each visit and 14 days following the first visit to terrestrial sites. This will allow for future analysis of the air temperature variable in relation to gastropod survey data. Relative Humidity Variables - We calculated monthly and quarterly mean, minimum, and maximum temperatures for each logger. Additionally, we calculated variables directly related to our survey period including mean, minimum, and maximum relative humidity for the 48 hours immediately following each visit and 14 days following the first visit to terrestrial sites. This will allow for future analysis of the relative humidity variable in relation to gastropod survey data. Other Water Temperature Variables - We calculated pond freeze dates by calculating the first date after a 48 hour period when the standard deviation of pond temperature was ≤0.05 for a 48 hour period. We calculated pond thaw dates by determining the first date after a 48 hour period when the pond temperature standard deviation remained ≥0.05. We then calculated number of days frozen and number of days open. We calculated annual, quarterly, and monthly mean, minimum, and maximum temperatures. We determined the warmest month and calculated its mean. Starting at midnight the night of the survey we calculated the mean, minimum, and maximum temperatures for the 48 hours period following the survey. Temperature Associations - We calculated mean temperature and temperature envelopes (site air or water temperature ranges where a certain proportion of species detections) occur for all species with ≥15 detections, all SGCN, and several additional species. We calculated these values for all pond breeding amphibians both for individual species and as a group. We calculated 50%, 80%, and 95% temperature envelopes by proportionately selecting the coolest annual mean temperature sites for each species and determining the temperature range. Results This document provides a summary of climate data collected from September 1, 2013-August 31, 2014. Data collected prior to September 1, 2013 will be used for future analyses. Air Temperature During fall 2014, we successfully collected 899 of 941 air temperature data loggers that were deployed at the time. Forty-two loggers were not found or collected because they were removed
210

by animals, lost in clear-cutting operations, stolen, or not found for other reasons. Data from 26 (2.7%) of the 899 collected loggers were excluded from this analysis as described in the methods. Therefore, data from 873 data loggers were used for this analysis. The remaining 873 loggers had an average of 11.5% (3 – 72.3%) of data excluded. Imputed data averaged 0.14% (0-6.2%) per logger with 644 (73.2%) loggers having 0 imputed data. Mean annual air temperature for the study area was 6.17°C (-1.90-14.17°C). Additional variables are reported in Table 5-2. The majority of cooler sites clustered in the northern Selkirk Mountains with other clusters forming in the Purcell and St. Joe Mountains (Map 5-2).
Table 5-2. Annual air temperature variables September 1, 2013- August 30, 2014
Variable Description Mean Min Max T mean annual temperature (°C) 6.17 -1.90 14.17
TD temperature difference between warmest and coldest month (°C)
53.87 31.78 65.39
DDGT18 degree days > 18° C 104.22 0.00 463.32 DDGT5 degree days > 5° C 1428.28 293.22 2345.94 DDLT0 degree days < 0° C 458.58 0.00 1290.06 DDLT18 degree days < 18° C 3941.92 598.50 5970.36 NNFD number of frost-free days 186.95 53.00 267.00
Relative Humidity During fall 2014, we collected 191 (96%) of the 200 relative humidity data loggers deployed. Nine loggers were not found. We calculated monthly mean, minimum, and maximum relative humidity for each site for the months of September, October, and November 2013 and June, July, and August 2014. We removed loggers from the analysis if ≥20% of data were missing (n = 121 sites), or if a 0% relative humidity reading was recorded (n = 5 sites) for the month in question (Table 5-3). 98% (n = 118) of months missing ≥20% data were November. This is likely because snow covered the sensors and why we do not report values for December-May.
Table 5-3. Monthly Relative Humidity Values Month Year Mean Min Max n (sites)
June 2014 73.98 9.3 99.3 188 July 2014 61.70 10.1 99.2 189 August 2014 68.37 7.6 99.5 189 September 2013 78.55 13.6 99 187 October 2013 82.97 18.7 99.1 186 November 2013 87.76 29.7 98.1 67
Water Temperature During September and October of 2014, we visited 151 data loggers (138 ponds) and successfully downloaded data from 125 (83%) loggers. We were unable to find 26 (19%) loggers. Data downloads were successful for all loggers found. Variables calculated had different
211

sample sizes due to loggers being exposed to air for varying amounts of time. March-August mean temperature was the variable with the largest number of available loggers (n = 83) and therefore was the variable we used to calculate temperature envelopes. March-August mean temperature was 8.03° C (2.88 – 15.67°C) and annual mean temperature was 5.88° C (2.39 – 10.52°C) (n = 73) (Table 5-4).
Table 5-4. Water Temperature Variables Variables Mean Min Max n Annual Mean 5.88 2.39 10.52 73 Mean for March, April, May 3.09 -0.02 9.74 83 Mean for June, July, August 13.02 3.58 21.63 83 Mean for March-August 8.03 2.88 15.67 83 Days Frozen 160.69 0 261 59 Days Open 204.30 104 365 59
Temperature Associations Gastropods - Of species with sample size ≥15 sites, magnum mantleslugs (Magnipelta macrophaga) (n = 38) had the lowest mean annual temperature (4.17°C) and Limax maximus (n = 15) had the highest mean annual temperature (7.79°C). L. maximus also had the narrowest 50% temperature envelope (0.69°C) and Microphysula ingersolli had the widest 50% temperature envelope (4.05°C) (Table 5-5, Fig. 5-3). Twenty-one of the 31 species analyzed had mean temperatures which fell within 1°C of the annual study area mean of 6.17°C. Magnum mantleslug, Pristiloma wascoense, Hemphillia camelus, and Hemphillia unk1 all were associated with mean temperatures of at least 1°C less (2.71-1.01°C) than the mean annual study area mean of 6.17°C. Magnum mantleslugs were associated with cooler temperatures than other species. A majority of magnum mantleslug detections occurred within a temperature envelope of 2-4°C (Fig. 5-4). Striatura pugentensis, Prophysaon andersoni, Prophysaon coeruleum, Planogyra clappi, and L. maximus were all associated with mean annual temperatures of at least 1°C above (1.23-1.57°C) the mean annual study area mean of 6.17°C. However, P. coeruleum and P clappi had sample sizes of only 2 each. Heliodiscus salmonaceus had a mean annual temperature 2.68°C greater than the study area mean but had a sample size of just one. Non-native gastropods tended to be more associated with warmer temperatures but this may be an artifact of their association with human development which is biased to lower elevations.
212

Figure 5-4. Magnum mantleslug detections by temperature.
Magnum mantleslug (Magnipelta macrophaga)
213

Figure 5-3. Mean annual air temperature and 50% temperature envelopes for selected gastropod species. Temperature envelopes were calculated by proportionately selecting the coolest mean temperature sites for each species and determining the temperature range.
Mean study area temp. 6.17°C
-/+ 1° from mean study area temperature
Mean study area temp. 6.17°C
1°C below mean study area temp. 5.17°C
1°C above mean study area temp. 7.17°C
214

Amphibians - Mean March-August temperature of western toad (Anaxyrus boreas) (n = 5) and American bullfrog (Rana catesbeianus) (n = 2) breeding ponds were both >1°C different than the mean March-August water temperature for all ponds (n = 83). Western toad breeding ponds averaged 6.84°C (1.19°C < mean all pond temperature) and bullfrog breeding ponds averaged 14.61°C (8.03°C > mean all pond temperature) (Table 5-6). Mean March-August breeding pond temperature of the other 3 species detected fell within 1°C of mean all pond temperature. Columbian spotted frogs (Rana luteiventris) (mean 7.13°C, n = 33) and long-toed salamanders (Ambystoma macrodactylum) (mean = 7.43, n = 32) were detected at ponds cooler than mean all-pond temperature. Pacific treefrogs (Pseudacris regilla) (mean = 9.00°C, n = 5) were detected at ponds warmer the mean all-pond temperature. Mean March-August temperature of all amphibian breeding ponds (7.70°C, n = 55) was 0.97°C cooler than non-breeding ponds (8.67°C, n = 28) (Table 5-6).
Discussion We explore only two micro-climate variables, annual and March-August mean temperature, in relation to species occurrence. However, mean temperature may not be the most important variable in describing species response to climate change. Climatic variables such as minimum and maximum daily temperatures may change at different rates (Karl et al. 1993) and non-climatic variables may have a greater effect on species occurrence than temperature. Adaptive capacity influences climate change vulnerability and is not addressed in this report. We plan to conduct more in depth analyses to elucidate which climatic and other variables may drive species distribution and persistence potential. The associations of species occurrence and micro-climate presented herein should be viewed as preliminary assessments. The temperature data we collected adds to growing networks of northern Rockies air (eg Holden et al. 2015) and water (Isaak 2015) temperature data loggers. Our water temperature sensors are unique in that they monitor small lentic waters instead of streams (Isaak 2015) and, to our knowledge, our data loggers are the first in our study area to be co-located with terrestrial gastropod and amphibian surveys. In addition to species specific air and water temperature envelopes, our data delineate both macro and micro-sites that are relatively cool and may serve as cool-air refugia during climate warming (Dobrowski 2011, Greenwood et al. 2016). The largest congregation of cool air sites occurs in the Selkirk Mountains (Map 5-2). This is likely due to this mountain range having a
Western toad (Anaxyrus boreas)
215

combination of relatively higher elevation and steeper topography, which protects air from solar warming, than much of the study area. This presents an opportunity to manage a macro-level area for cool temperatures but potential micro-refugia were also documented across the study area. Micro-refugia are sites that support favorable climate conditions within a larger landscape of unfavorable conditions (Dobrowski 2011). Cool air micro-site management is a relatively new concept and the effectiveness of various management techniques is still unclear. Regardless, several techniques have proven to be at least moderately successful in maintaining cooler air temperatures than the surrounding landscapes including afforestation, reduced or removal of grazing, slope creation or protection, and woody debris addition (Greenwood et al. 2016).
Figure 5-5. An example of how micro-climate planning might be incorporated into a management plan. Fire planning and management is one example of how we might manage for cool air temperatures at key micro-sites. Magnum mantleslug was our most strongly cool-air associated species with the majority of detections occurring within a 2-4°C temperature envelope >2°C below the mean study area temperature (Fig. 5-4). Because increased vegetative cover buffers against temperature extremes and reduces maximum temperatures (Greenwood et al. 2016) a magnum mantleslug management plan would likely include recommendations to maintain
216

vegetative cover at sites where the species is known to occur. If we were selecting sites of known species occurrence to prioritize maintenance of vegetative cover and associated cooler air temperatures, we would want to choose sites less likely to be affected by outside forces such as fire. Imagine a timber sale is being planned in an area of late seral forest with two sites where magnum mantleslugs are known to occur. The nature of the sale requires one of the two sites be clear-cut and the other to not be managed. If one site is flat and another is a steep slope, we would recommend the flat spot not be harvested because, in the event of a stand altering fire, the flat location would be more likely retain vegetative cover and, thus, more protection from extreme temperatures (Jaiswal et al. 2002) (Fig. 5-5). Conclusions Our micro-climate surveys represent the first effort in our study area to co-locate micro-climate data loggers with amphibians and terrestrial gastropod surveys. Five species are associated with air (magnum mantleslug, P. wascoense, H. camelus, and H. unk1) or water (western toad) mean temperatures ≤1°C than study area mean. However, P. wascoense (n = 6) and western toads (n = 5) were represented by small sample sizes. The Selkirk Mountains contain the largest area suitable for macro-cool air refugia but multiple micro-cool air refugia are located across the study area. Data presented in this report are a summary of results and further analyses are needed to more firmly associate 'cool' or 'warm' species within temperature envelopes, to determine if temperature is a limiting factor for these species, and determine species adaptive capacity to micro-climatic changes. We encourage managers to consider air and water temperature as an important factor when managing natural resources at the macro or micro scale. Literature Cited Dobrowski, S. Z. 2011. A climatic basis for microrefugia: the influence of terrain on climate. Global change biology, 17(2), 1022-1035. Greenwood, O., H. L. Mossman, A. J. Suggitt, R. J. Curtis, & I. Maclean. 2016. Using in situ management to conserve biodiversity under climate change. Journal of Applied Ecology. Holden, Z. A., M. A. Crimmins, S. A. Cushman, & J. S. Littell. 2011. Empirical modeling of spatial and temporal variation in warm season nocturnal air temperatures in two North Idaho mountain ranges, USA. Agricultural and Forest Meteorology, 151(3), 261-269. Holden, Z. A., A. E. Klene, R. F. Keefe, & G. G. Moisen. 2013. Design and evaluation of an inexpensive radiation shield for monitoring surface air temperatures. Agricultural and forest meteorology, 180, 281-286. Holden, Z. A., A. Swanson, A. E. Klene, J. T. Abatzoglou, S. Z. Dobrowski, S. A. Cushman, J. Squires, G. G. Moisen, & J. W. Oyler, J. W. 2015. Development of high-resolution (250 m) historical daily gridded air temperature data using reanalysis and distributed sensor networks for the US Northern Rocky Mountains. International Journal of Climatology.
217

Idaho Department of Fish and Game. 2005. Idaho comprehensive wildlife conservation strategy. Idaho Conservation Data Center, Idaho Department of Fish and Game, Boise, ID;[cited 22 August 2012]. Inman, R. M., A. J. Magoun, J. Persson, & J. Mattisson. 2012. The wolverine's niche: linking reproductive chronology, caching, competition, and climate. Journal of Mammalogy, 93(3), 634-644. Isaak, Daniel J.; D. L. Horan, S. P. Sherry. 2013. A simple protocol using underwater epoxy to install annual temperature monitoring sites in rivers and streams. Gen. Tech. Rep. RMRS-GTR-314. Fort Collins, CO: U.S. Department of Agriculture, Forest Service, Rocky Mountain Research Station. 21 p. Isaak, D. 2015, August. The Norwest Stream Temperature Database and Climate Scenarios for Western Streams and Rivers. In 145th Annual Meeting of the American Fisheries Society. Afs. Jaiswal, R. K., S. Mukherjee, K. D. Raju, & R. Saxena. 2002. Forest fire risk zone mapping from satellite imagery and GIS. International Journal of Applied Earth Observation and Geoinformation, 4(1), 1-10. Karl, T. R. 2009. Global climate change impacts in the United States. Cambridge University Press. Karl, T. R., R. W. Knight, K. P. Gallo, T. C. Peterson, P. D. Jones, P. D., G. Kukla, N. Plummer, V. Razuvayev, K. P. Gallo, J. Lindseay, R. J. Charlson, and T.C. Peterson. 1993. A new perspective on recent global warming: asymmetric trends of daily maximum and minimum temperature. Bulletin of the American Meteorological Society, 74(6), 1007-1023. Mawdsley, J., R. O’Malley, & D. S. Ojima. 2009. A review of climate-change adaptation strategies for wildlife management and biodiversity conservation. Conservation Biology, 23(5), 1080-1089. Meehl, G. A., T. F. Stocker, W. D. Collins, P. Friedlingstein, A.T. Gaye, J. M. Gregory, A. Kitoh, R. Knutti, J. M. Murphy, A. Noda, A., & S.C. Raper. 2007. Global climate projections. Climate change, 3495, 747-845. Washington Department of Fish and Wildlife. 2005. Washington's comprehensive wildlife conservation strategy.
218
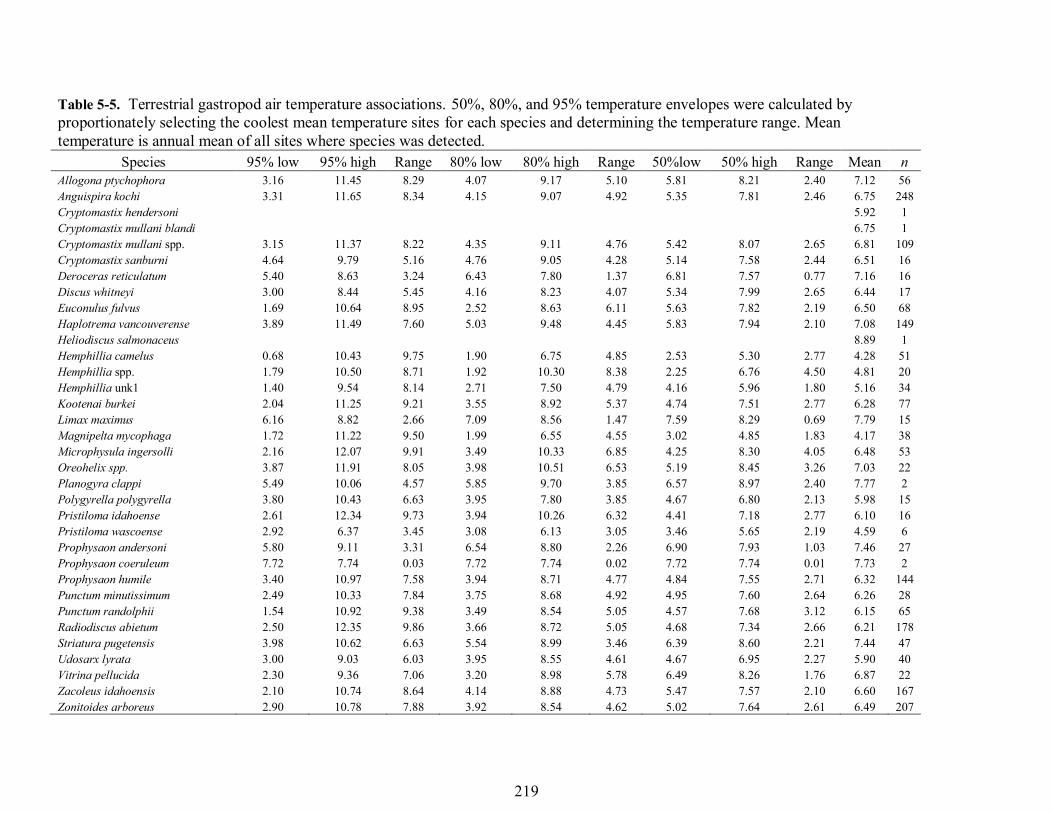
Table 5-5. Terrestrial gastropod air temperature associations. 50%, 80%, and 95% temperature envelopes were calculated by proportionately selecting the coolest mean temperature sites for each species and determining the temperature range. Mean temperature is annual mean of all sites where species was detected.
Species 95% low 95% high Range 80% low 80% high Range 50%low 50% high Range Mean n Allogona ptychophora 3.16 11.45 8.29 4.07 9.17 5.10 5.81 8.21 2.40 7.12 56 Anguispira kochi 3.31 11.65 8.34 4.15 9.07 4.92 5.35 7.81 2.46 6.75 248 Cryptomastix hendersoni 5.92 1 Cryptomastix mullani blandi 6.75 1 Cryptomastix mullani spp. 3.15 11.37 8.22 4.35 9.11 4.76 5.42 8.07 2.65 6.81 109 Cryptomastix sanburni 4.64 9.79 5.16 4.76 9.05 4.28 5.14 7.58 2.44 6.51 16 Deroceras reticulatum 5.40 8.63 3.24 6.43 7.80 1.37 6.81 7.57 0.77 7.16 16 Discus whitneyi 3.00 8.44 5.45 4.16 8.23 4.07 5.34 7.99 2.65 6.44 17 Euconulus fulvus 1.69 10.64 8.95 2.52 8.63 6.11 5.63 7.82 2.19 6.50 68 Haplotrema vancouverense 3.89 11.49 7.60 5.03 9.48 4.45 5.83 7.94 2.10 7.08 149 Heliodiscus salmonaceus 8.89 1 Hemphillia camelus 0.68 10.43 9.75 1.90 6.75 4.85 2.53 5.30 2.77 4.28 51 Hemphillia spp. 1.79 10.50 8.71 1.92 10.30 8.38 2.25 6.76 4.50 4.81 20 Hemphillia unk1 1.40 9.54 8.14 2.71 7.50 4.79 4.16 5.96 1.80 5.16 34 Kootenai burkei 2.04 11.25 9.21 3.55 8.92 5.37 4.74 7.51 2.77 6.28 77 Limax maximus 6.16 8.82 2.66 7.09 8.56 1.47 7.59 8.29 0.69 7.79 15 Magnipelta mycophaga 1.72 11.22 9.50 1.99 6.55 4.55 3.02 4.85 1.83 4.17 38 Microphysula ingersolli 2.16 12.07 9.91 3.49 10.33 6.85 4.25 8.30 4.05 6.48 53 Oreohelix spp. 3.87 11.91 8.05 3.98 10.51 6.53 5.19 8.45 3.26 7.03 22 Planogyra clappi 5.49 10.06 4.57 5.85 9.70 3.85 6.57 8.97 2.40 7.77 2 Polygyrella polygyrella 3.80 10.43 6.63 3.95 7.80 3.85 4.67 6.80 2.13 5.98 15 Pristiloma idahoense 2.61 12.34 9.73 3.94 10.26 6.32 4.41 7.18 2.77 6.10 16 Pristiloma wascoense 2.92 6.37 3.45 3.08 6.13 3.05 3.46 5.65 2.19 4.59 6 Prophysaon andersoni 5.80 9.11 3.31 6.54 8.80 2.26 6.90 7.93 1.03 7.46 27 Prophysaon coeruleum 7.72 7.74 0.03 7.72 7.74 0.02 7.72 7.74 0.01 7.73 2 Prophysaon humile 3.40 10.97 7.58 3.94 8.71 4.77 4.84 7.55 2.71 6.32 144 Punctum minutissimum 2.49 10.33 7.84 3.75 8.68 4.92 4.95 7.60 2.64 6.26 28 Punctum randolphii 1.54 10.92 9.38 3.49 8.54 5.05 4.57 7.68 3.12 6.15 65 Radiodiscus abietum 2.50 12.35 9.86 3.66 8.72 5.05 4.68 7.34 2.66 6.21 178 Striatura pugetensis 3.98 10.62 6.63 5.54 8.99 3.46 6.39 8.60 2.21 7.44 47 Udosarx lyrata 3.00 9.03 6.03 3.95 8.55 4.61 4.67 6.95 2.27 5.90 40 Vitrina pellucida 2.30 9.36 7.06 3.20 8.98 5.78 6.49 8.26 1.76 6.87 22 Zacoleus idahoensis 2.10 10.74 8.64 4.14 8.88 4.73 5.47 7.57 2.10 6.60 167 Zonitoides arboreus 2.90 10.78 7.88 3.92 8.54 4.62 5.02 7.64 2.61 6.49 207
219

Table 5-6. Amphibian water temperature associations. 50%, 80%, and 95% temperature envelopes were calculated by proportionately selecting the coolest mean temperature sites for each species and determining the temperature range. Mean temperature is March-August mean of all sites where species was detected. All pond sites include any pond where species was detected. Breeding ponds are only ponds where breeding activity was detected.
Species 95% low
95% high
95% Range
80% low
80% high
80% Range
50% low
50% high
50% Range Mean n
All Ponds Long-toed Salamander 3.89 13.36 9.47 4.90 11.40 6.49 5.64 9.07 3.43 7.42 36 Columbia Spotted Frog 3.88 13.60 9.71 5.04 11.71 6.66 5.86 9.44 3.59 7.65 65 Western Toad 5.33 10.00 4.67 5.68 9.59 3.91 5.86 7.75 1.90 7.01 9 Sierran Treefrog 6.21 12.80 6.59 6.75 11.85 5.10 7.74 10.43 2.69 9.25 8 Amercian Bullfrog 13.64 20.40 6.75 13.96 19.65 5.69 14.61 18.16 3.55 16.62 3
Breeding Ponds Long-toed Salamander 3.89 13.50 9.61 4.80 11.46 6.66 5.64 9.07 3.43 7.43 32 Columbia Spotted Frog 3.67 12.18 8.51 5.26 10.02 4.76 5.86 8.26 2.40 7.13 33 Western Toad 5.87 9.19 3.31 5.93 8.37 2.45 6.03 6.75 0.72 6.84 5 Sierran Treefrog 6.22 11.19 4.97 6.81 10.84 4.04 7.97 10.14 2.17 9.00 5 Amercian Bullfrog 13.59 15.62 2.03 13.75 15.46 1.71 14.07 15.14 1.07 14.61 2
All Species Combined Breeding Ponds 3.88 14.21 10.34 5.04 11.92 6.88 5.82 9.18 3.36 7.70 55 Non Breeding Ponds 3.52 13.47 9.95 4.13 12.92 8.79 6.15 11.00 4.86 8.67 28 All Ponds 3.69 14.18 10.49 4.57 12.61 8.04 5.82 10.21 4.38 8.03 83
220

Map 5-1. 803 5x5 km cells where micro-climate data was collected between 2010-2014.
Selkirks
Coeur d'Alenes
Saint Joe
Purcells
West Cabinets
221
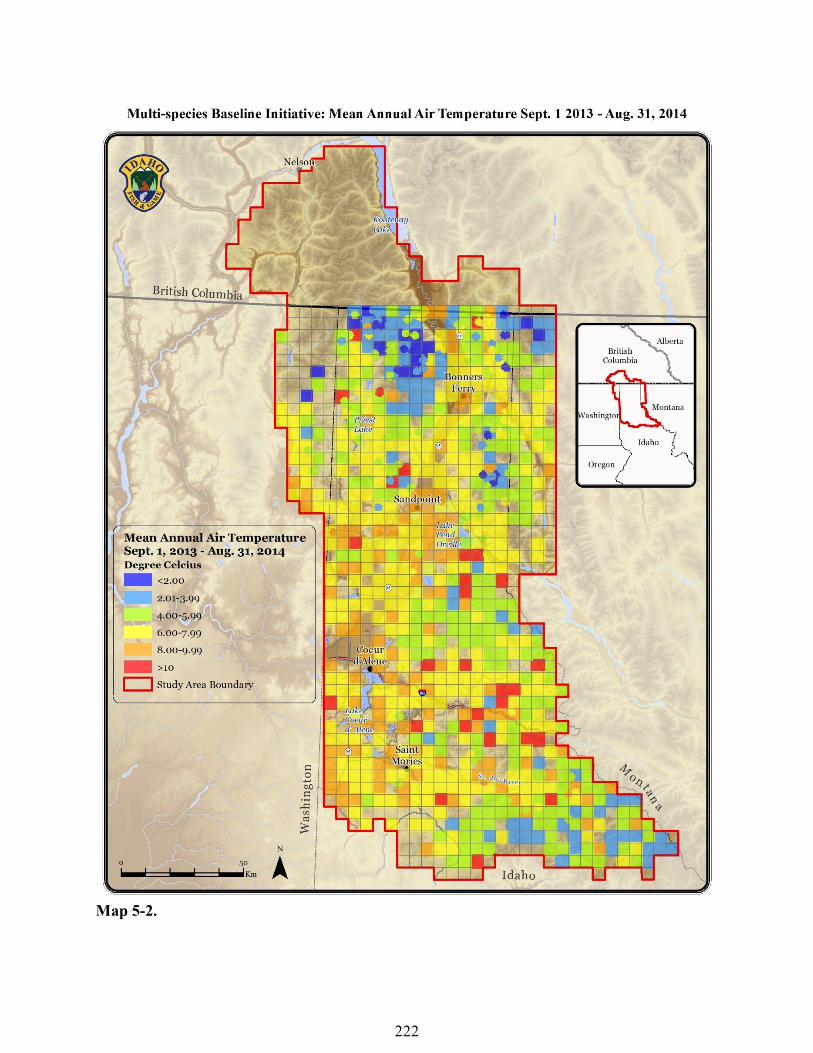
Map 5-2.
222
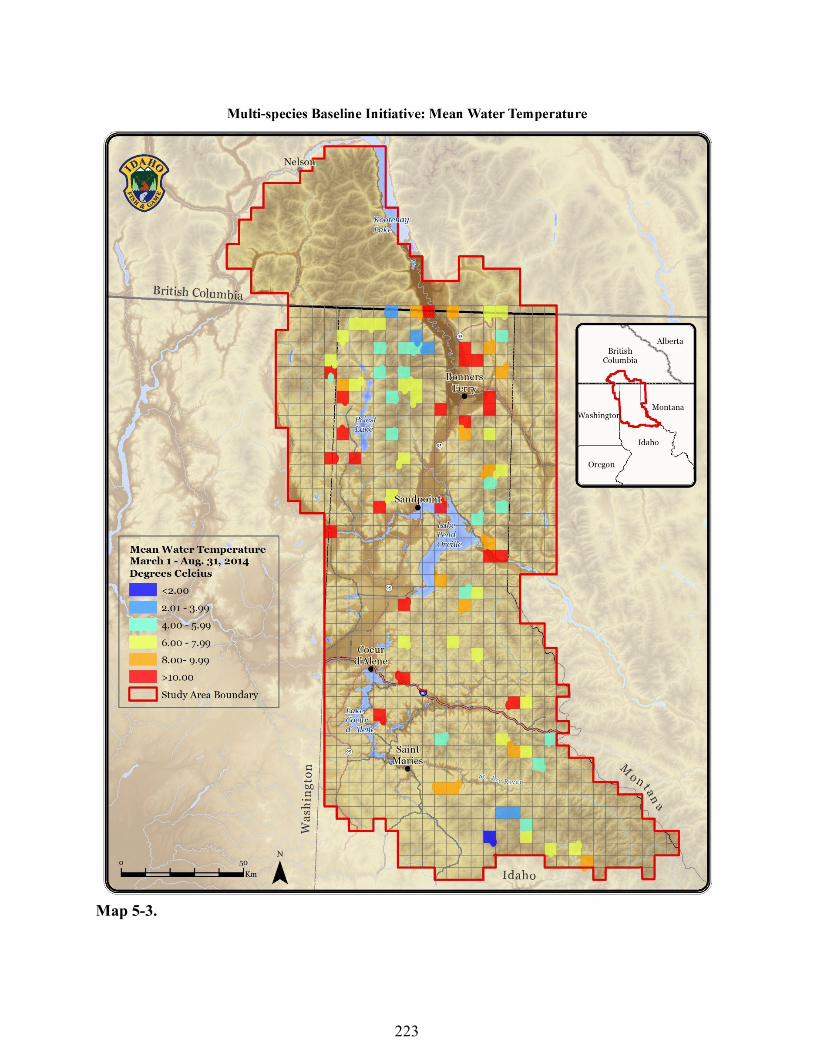
Map 5-3.
223