chapter 5: soft-budget constraint on local governments in ... · soft-budget constraint on local...
TRANSCRIPT
1
Chapter 5:
Soft-Budget Constraint on Local Governments in China
Jing Jin and Heng-fu Zou
I. Introduction
A significant feature of China’s economic reform since 1978 is the devolution of the
central government’s control over the economy to subnational gove rnments. The fiscal system is
decentralized among five levels of government: national, provincial, municipal, county, and
township governments, which are broadly categorized into center, provincial, and local
governments (all sub-provincial governments). This paper mainly focuses on soft-budget
constraints in the relationship between the central government and the provinces. The term
“local” and “subnational” refers to the provincial level or aggregated subnational governments,
unless otherwise specified.
China’s subsidy, taxation, credit and administrative pricing systems are all subject to soft
budget constraints. Prior to 1994 under the Chinese fiscal regime, the collection of all taxes and
profits followed the pre-reform pattern: local government collections were remitted to the center
and then transferred back to the provinces according to expenditure needs approved by the
center. Policymakers in the central government decided what type of revenues should be
collected and how these revenues were to be reallocated for national and local public good
provisions. Most expenditures at subnational levels were financed by central transfers and
complemented by a few self-retained local tax receipts. The prereform fiscal system resulted in a
fundamental lack of incentives and efficiency, which became the major concern of the central
authorities. In the 1980s, a series of reforms were implemented to revamp the fiscal relations

2
between the central and subnational governments. Although incentives to spur tax collection
efforts by local governments were successful to a certain extent,1 they also reduced the share of
revenues passed on to the central government. Before the 1994 tax system reform, the central
government’s share of total revenue declined from 44 percent in 1978 to 23 percent in 1993,
while the total subnational revenue share increased from roughly 56 percent to 77 percent during
same period. At the same time, the consolidated government revenue share in GDP also shrank
from 47 percent in 1978 to 13 percent in 1993. Despite the fact that fiscal decentralization in the
1980s shifted more resources to local governments in terms of its increased share in total
revenues, the shrinking pie also considerably reduced the budgetary resources allocated at the
provincial level (Table 1).
1 Unlike the previous system, reform in the 1980s allowed provincial authorities to retain all or a proportion of the
tax collected after sharing with the center.

3
Table 1
Central and Provincial Government Revenue Shares in Total Revenue and GDP
Year Tax Revenue ( Billion Yuan)
[without SOE remittance]
Revenue from
Enterprises (Profit
Remittance, Billion Yuan)/a
Total Revenue (Billion Yuan)
Central Tax Revenue
(Billion Yuan)
Total Central Revenue (Billion Yuan)
Subnational Revenue (Billion Yuan)
Share of Total Central Revenue in
Total Revenue
(%)
Share of Subnational Revenue in
Total Revenue
(%)
GDP (Billion Yuan)
Total Government Revenue as a Percentage in
GDP (%)
1978 113.2 57.2 170.4 17.6 74.8 95.6 43.9 56.1 362.4 47.0 1979 114.6 49.5 164.1 23.1 72.6 91.5 44.2 55.8 403.8 40.6 1980 116 43.5 159.4 28.4 71.9 87.5 45.1 54.9 451.8 35.3 1981 117.6 35.4 153 31.1 66.5 86.5 43.5 56.5 486.2 31.5 1982 121.2 29.6 150.8 34.7 64.3 86.5 42.6 57.4 529.5 28.5 1983 136.7 24.1 160.8 49 73.1 87.7 45.5 54.5 593.5 27.1 1984 164.3 27.7 191.9 66.5 94.2 97.7 49.1 50.9 717.1 26.8 1985 200.5 4.4 204.9 77 81.4 123.5 39.7 60.3 896.4 22.9 1986 212.2 4.2 216.4 77.8 82 134.4 37.9 62.1 1020.2 21.2 1987 219.9 4.3 224.2 73.6 77.9 146.3 34.7 65.3 1196.3 18.7 1988 235.7 5.1 240.7 77.4 82.5 158.2 34.3 65.7 1492.8 16.1 1989 266.5 6.4 272.9 82.3 88.7 184.2 32.5 67.5 1690.9 16.1 1990 293.7 7.8 301.5 99.2 107 194.5 35.5 64.5 1854.8 16.3 1991 314.9 7.5 322.4 93.8 101.3 221.1 31.4 68.6 2161.8 14.9 1992 348.3 6 354.4 98 104 250.4 29.3 70.7 2663.8 13.3 1993 434.9 4.9 439.8 95.8 100.7 339.1 22.9 77.1 3463.4 12.7
1994/b 521.8 521.8 290.7 290.7 231.1 55.7 44.3 4675.9 11.2 1995 624.2 624.3 325.7 325.7 298.6 52.2 47.8 5847.8 10.7 1996 740.8 740.7 366.1 366.1 374.6 49.4 50.6 6788.4 10.9 1997 865.1 865.1 422.7 422.7 442.4 48.9 51.1 7446.3 11.6 1998 987.6 987.6 489.2 489.2 498.4 49.5 50.5 7939.6 12.4
Note: a/ Before 1984, a considerable amount of central revenue came from SOEs' Profit Remittance, which exclusively went to the central treasury. Since 1984, the Profit Remittance had been increasingly replaced by Enterprises Income Tax (Li gai sui). Profit Remittance from SOEs remained as a residual category until 1993 before it terminated.
b/ Tax assignment system reform introduced. Data after 1994 are not compatible with those before 1994. Sources: China Statistical Yearbook (1999)
China Government Finance Yearbook (Various issues).

4
Throughout the 1980s, the central government’s inability to cut spending to stay
within declining revenue created persistent budget deficits, which contributed to
mounting inflationary pressures. At the same time, subnational governments faced greatly
expanded expenditure responsibilities stemming from obligations imposed by national
policy (Wong, 1991). As the central government responded to fiscal pressure by
attempting to devolve expenditure responsibilities to lower levels of government, it left
provincial governments starved for revenues. Apart from the intensified bargaining
between central and local governments over the sharing schemes, fiscal pressures created
by the contract system of the 1980s led to undesirable responses by subnational
governments. Examples include the diversion of resources from budgetary to
extrabudgetary channels, the duplication of industries to capture revenues that formerly
flowed to the national treasury, generous tax concessions to local state-owned enterprises
(SOEs) under their own jurisdictions, and expanded local bank lending to these SOEs.
All these measures circumvented the central government’s efforts to impose hard budget
constraints and weakened overall financial discipline.
As the country moved toward economic federalism with the fiscal
decentralization marked by a continuous decline of government revenue as a percentage
of national income, the unitary political system was also transformed and decentralized.
Even though the central bureaucratic hierarchy continued to select, assign, and promote
top provincial cadres (Huang, 1996), since 1983, bureau level officials (e.g., the heads of
provincial fiscal bureaus and the managers of provincial branches of national banks) have
been selected by provincial governments and appointed by the corresponding level of the
People’s Congress. No central approval is required. Driven by common economic

5
interests and the pressure to seek growth, which is the most important measure of their
political performance, the directors of fiscal and banking agencies tend to “stand where
they sit” rather than delegate their central line administrators. As a result, the former
hierarchical management has been considerably weakened and increasingly transformed
into horizontal administration featured by a highly fragmented economy. The central
authority’s attempt to strengthen the hierarchical management-- by strengthening
personnel management at the level of provincial party secretaries and governors-- thus
may not necessarily be able to penetrate the horizontal coalitions increasingly shaped by
common interests and contiguity at the subnational level. According to Yang (1997), the
heads of faster-growing provinces now tend to be promoted more quickly than otherwise
would be. Bo (1996) also finds that provincial leaders of more populous and richer
provinces are more likely to be promoted than those in less populous and less developed
ones.
This paper outlines some major economic and administrative mechanisms that
undermine the central government’s endeavor to harden the budget constraint on
provincial governments. Section II describes briefly the evolution of China’s
intergovernmental fiscal relations in the post-reform period. Section III presents the
major channels of soft budget constraints on provincial governments. Section IV
concludes.
II. The Evolution of Intergovernmental Fiscal Relations from the 1980s through the
1990s
6
(1) 1980-1993: Fiscal Contract System (Tax-Sharing System)
In 1980, the centralized fiscal regime was replaced with the fiscal contract system
whereby each level of government contracted with the next level up to meet certain
revenue and expenditure targets. Central and subnational governments shared the revenue
proportionately or in the form of a fixed quota plus a percentage share. At the same time,
subnational governments were required to finance their own expenditures through self-
generated and shared revenues—a step in the direction of hardening the budget constraint
on local governments.
Unlike other countries where taxes are collected by the central government and
then allocated to subnational governments, in China local authorities collected all tax
revenues and remitted a portion to the higher levels. The amount submitted to central
coffer depended on provincial receipts, and the sharing formula between the center and
provinces. Given such a highly decentralized revenue collection system, the center had to
resort to various instruments to ensure revenue remittance from local authorities. These
instruments, in turn, led to perverse reactions from the provinces, which always found
ways to retain more revenues through their relaxed revenue collection for and the
negotiations with the center regarding shared revenue.
From 1980 through the early 1990s, four revenue-sharing systems were
employed, with many variations. Until the tax system reform in 1994, six different
contract types were in use between the central government and provinces, with many
more at the subprovincial level (Table 2) (also see World Bank, 1993, and Bahl and
Wallich, 1992).

7
Table 2
Revenue-Sharing System between the Central and Provincial Governments, 1988-1992
Type A Type B Type C Type D Type E Type F Incremental Contract Basic
Proportional Sharing
Proportional Sharing and Incremental Sharing
Remittance Incremental Contract
Fixed-Remittance
Fixed-Subsidy
Contracted growth rate(%)
Retention rate (%)
Proportion Incremental sharing
Remittance (100 million)
Incremental Contract (%)
(100 million Yuan)
Beijing 4.00 50.00 Hebei 4.50 70.00
Liaoning 3.50 58.30 Shenyang 4.00 30.30 Haerbin 5.00 45.00 Jiangsu 5.00 41.00
Zhejiang (exl. Ningpo) 6.50 61.50 Ningpo 5.30 27.90 Henan 5.00 80.00
Chongqing a/ 4.00 33.50 Tianjin 46.50 Shanxi 87.60 An Hui 77.50 Da Lian 27.70 27.30 Qingdao 16.00 34.00 Wuhan a/ 17.00 25.00
Guangdong 14.10 9.00 Hunan 8.00 7.00
Shanghai 105.00 Heilongjiang 2.90 Shangdong (exl. Qingdao) 4.90
Hubei (exl.Wuhan) 1.22 Ji Lin 1.07
Sichuan (exl. Chongqing) 1.79 Jiangxi 0.50
Sha'anxi 1.20 Gansu 1.30 Fujian 0.50
Inner Mongolia 18.40 Guangxi 6.10
Tibet 9.00 Ningxia 5.30 Xinjiang 15.30 Guizhou 7.40 Yunan 6.70
Qinghai 6.60 Hainan 1.40
Source: Ministry of Finance, P.R. China Also see Bahl and Wallich, 1992, and World Bank, 1993. a/: After the cities of Wuhan and Chongqing were treated differently from Hubei and Sichuan provinces, the provinces changed from net providers to the state to net recipients of subsidies from the state.

8
Type A: Incremental contract – Based on 1987 revenues, the provincial retention
rate of all tax revenues ranged from 28 percent to 80 percent while local remittance to the
center needed was to increase from 3.5 percent to 6.5 percent (contracted growth rate) on
an annual basis. Tax revenues in excess of the stipulated growth rates was retained
entirely by provinces.
Type B: Basic Proportional Sharing – A fixed proportion of all revenues was
remitted to the center.
Type C: Proportional Sharing and Incremental Sharing – A certain proportion of
the actual revenue collection of the previous year was retained, and then a different
(usually higher) proportion of revenues was retained for the incremental amount in excess
of the total revenues for the previous year.
Type D: Remittance Incremental Contract – A specific nominal amount was
transferred to the center in the initial year; in subsequent years, the remitted amount
increased at a contracted rate (9 percent for Guangdong province and 7 percent for Hunan
province).
Type E: Fixed Remittance – A specific nominal amount was transferred to the
center with no annual adjustments.
Type F: Fixed Subsidy – Deficit provinces received fixed subsidies.2
Two crucial features survived every change in revenue-sharing systems. First,
central fixed revenues were not subject to the revenue sharing, so that whatever was
designated as central revenues left the pool of revenues to which revenue-sharing
2 Bahl and Wallich (1992).
9
formulas were applied.3 Second, enterprise income, both remitted profits and direct tax
revenues (after 1984), were still divided among governments according to their
administrative subordination, i.e., state-owned enterprises subordinated to the central,
provincial, and local governments, respectively.
Problems of the Fiscal Contract System
Central revenue declined as a percentage of total revenue. The decentralized nature
of tax collection meant that the central government lacked effective supervision of tax
collections and remittances by provincial governments. Consequently, local governments
avoided sharing revenues with the center through various means. Before the tax system
reform in 1994, around 10 provinces and municipalities (include Beijing, Hebei,
Liaoning, Shengyang, Haerbin, Jiangsu, Zhejiang, Nigpo, Henan and Chongqing) were
under the “incremental contract” scheme (Table 2). Take Jiangsu for example: if the total
revenue collected by Jiangsu provincial government was within the total amount of the
previous year (taking 1987 as the base year) plus a 5 percent increase, Jiangsu provincial
government could retain 41 percent of the total revenue collected. Any amount exceeding
the total of increased revenue can be retained by the provincial government. Frequently
tax revenues stagnated for years, limiting the amount for sharing with the center. This
phenomenon was prevalent among the provinces under contracts A, B, and C. Assuming
some growth in taxes accruing to the provinces by either transferring budgetary revenue
to extrabudgetary items, or allowing generous tax recessions to local enterprises so that
3 E.g. income taxes from railways, coal mining, petroleum and airline industries as well as income taxes of
banks and insurance companies, etc.

10
benefits could be accrued within the enterprises under the jurisdiction of subnational
governments—the center’s share would decrease.
In other cases, tax remitted to the center was fixed in nominal terms for many years
and growth was retained by the province. Guangdong, one of the fastest growing
economies in China, is a case at point—the remittance from Guangdong was fixed at 1.4
billion Yuan for many years. Not until 1988 had the “remittance incremental contract”
been implemented (Table 2), under which the remittance of Guangdong was set at an
annual increase of 9 percent with 1987 as the base year. By 1993, its remittance increased
to 2.4 billion Yuan, barely 7 percent of its total 34.7 billion revenue. Hunan, a relatively
poor province, was under the same contract. Shanghai, 4 Jilin (excluding Changchun), and
Shandong (exclude Qingdao) were categorized into “fixed remittance” schemes,
representing 10.5 billion, 0.29 billion, and 0.49 billion, or 46 percent, 4 percent and 3
percent of their respective total revenue in 1993.
With the power of tax collection provincial governments acted strategically to
escape sharing their revenues with the center, which resulted in a decline of central
revenue share vis-a-vis that of the local in total revenue (Table 1). Tax generation in such
a fiscal system tends to be inelastic with respect to GDP and procyclical. In a rapidly
growing economy with fiscal contracts containing a large fixed component, the rate of
increase in tax revenues would be less than that of income growth. Tax policy thus
becomes a procyclical mechanism that exacerbated economic fluctuations instead of
4 Before the tax system reform in 1994, Shanghai was far more heavily taxed with nearly half of its revenue
remitted to the center under the fixed-remittance term. However, it might be “compensated” with a credit allocation beyond the local deposit base (see World Bank, 1993).
11
moderating them (Agarwala, 1992). When government expenditure increases in line with
GDP, the deficit is likely to expand as a consequence.
Extrabudgetary fund. The rapid growth of extrabudgetary revenues was a striking
feature of tax reform during the 1980s. By 1992, the size of such extrabudgetary revenue
was almost equal to state revenue and accrued mostly to state-owned enterprises and their
supervisory agencies (See Section III). Richer provinces could raise extrabudgetary funds
more easily than poorer ones.
Regional disparity. The fiscal contract system also led to an increasing regional
disparity. Provinces with enormous economic potential such as Guangdong accumulated
a substantial and growing revenue base by retaining most of the incremental revenues
within the province through (1) a contract system that, in fact, favored better-off
provinces with more bargaining power; and (2) for some other provinces, moving
revenues to extrabudgetary funds without sharing with the center. This shift in financial
flows from the early 1980s—where central government received more from the provinces
with surpluses than it paid out in transfers and grants (Ahmad, 1997)—handcuffs the
central government in stabilizing the economy and bridging horizontal imbalances.
Administrative Decentralization. The transition from a vertical hierarchy (Tiao) to
horizontal administration (Kuai) began with Mao’s decentralization of state enterprise
ownership among the central, provincial, county governments, and local communes
during the 1970s (Sachs, Woo, and Yang, 1999). Then during the 1980s, the central
authorities gave subnational governments the power to nominate and assign most
provincial officials. Before 1983 the Chinese Communist party (CCP) appointed and
promoted officials two levels down. The Department of Organization (DOO) under the
12
Central Committee of the CCP managed this process. Since 1983 central government is
less involved in provincial- level appointments making the appointment system only “one
level down.” Directors of fiscal agencies and tax bureaus are now determined by
provincial governments and their party committees (Huang, 1996). This new
decentralized organization included managers of local branches of state banks (a point
that will be elaborated later).
In combination with fiscal decentralization, provincial governments now have the
wherewithal and authority to circumvent central plans and policies in favor of regional
priorities. Although provincial fiscal agencies and tax bureaus were subject to the
hierarchical (professional) instructions of the Ministry of Finance at the center, they are,
in fact, under the leadership of their respective provincial governments. The new
mechanism has problems of its own: “The shortcoming of the two-level downward
system was excessive centralization and unwieldiness; the problem with the one- level
system was that it encouraged nepotism and localism because it concentrated too many
appointment decisions locally” (Manion, 1985).
(2) 1994-Present: (Dual Track System: Tax Assignments Together with the Contract System).
The central government introduced the tax assignment system in 1994 to
strengthen the central government’s ability to achieve macroeconomic stabilization,
regional equalization, and efficient public goods provisions. At the same time, the reform
introduced more rigorous budget constraints on local governments.
The objectives of the reform package were fourfold: (1) to simplify and rationalize
the tax structure by reducing tax types, tax rates, unifying the tax burden on taxpayers

13
and reduce exemptions; (2) raise the revenue-to-GDP ratio; (3) raise the central-to-total
revenues ratio; and (4) put central- local revenue-sharing on a more transparent, objective
basis by shifting the negotiated sharing of general revenues to a tax assignment system.
Under the new system, taxes were reassigned between the central and local
governments as follows:
• Taxes exclusive to the central government include tariff duties, income taxes
of state-owned enterprises (SOEs) under the jurisdiction of the central
government, consumption taxes, import-related consumption taxes, and taxes
imposed on banks, non-bank financial institutions and insurance companies,
and taxes on railroads;
• Taxes exclusive to provincial governments include sales taxes (provided that
sales taxes applicable to banks and railroads would be payable to the central
government), income taxes from state-owned enterprises under the
jurisdiction of provincial governments and collectively owned enterprises, and
personal income taxes.
• Shared taxes include the value added tax (VAT) (at the fixed rate of 75
percent for the central government, and 25 percent for local governments),
stamp duties on securities transactions, taxes on natural resources, and other
taxes.
In order to implement this tax assignment system and ensure the effective
collection of the central government’s portion of revenues, the central and provincial tax
collection bureaus were to be separated. Once fully implemented, the central and
provincial governments were to collect their own exclusive taxes. The shared taxes were
14
to be levied and collected by the central tax bureau, and then shared between the central
and provincial governments.
This new tax assignment system met with unprecedented resistance from
provincial authorities, and significant concessions by the central government were
obtained (for details, see Wang, 1997). As a compromise, the revised scheme would
ensure provincial interests of fait accompli with the new assignments only applied to the
incremental receipts (with 1993 as the base year).
The revenue-sharing contracts negotiated under the old system were allowed to
remain effective at the same time. The provinces were still supposed to remit a specified
amount of locally collected revenues to, or receive a certain amount of subsidies from,
the central government. In practice, after the provinces shared taxes with the center under
the new rule effective since 1994, they have had to “hand over remittances to or receive
subsidies from the center according to the old revenue-sharing contracts. In the end, no
one knew what constituted real central revenue or local revenue” (Wang, 1997).
The de facto dual track system which combined tax assignment with the contract
regime thus limited the capability for central government to harden the budget constraints
on local governments. Moreover, a policy to ensure the provincial revenue level in 1993
triggered sudden inflated receipts5 in their 1993 reported budgetary revenues. Those
provinces that tried to underreport their revenues in order to avoid sharing with the center
in the previous fiscal contract system now faced the opposite problem. More 1993
budgetary revenues also meant more “return transfers” the provinces could receive from
the center. In 1993, the actual total subnational revenues increased by 88.8 billion within
5 Most of which clustered in the last three months of the year after the Central government promulgated the
tax reform plan in September 1993 (Wang, 1997).

15
a single year, from 250.3 billion Yuan in 1992 to 339.1 billion Yuan, which was 28.3%
higher than the budgeted amount and 39.9% higher than the previous year.6 The Ministry
of Finance agreed to top up the reported 1993 revenues of provinces with one proviso: if
the province’s revenue growth rate of 1994 was not parallel to that of 1993, the 1993 base
amount would be subjected to readjustment according to the lower growth rate of 1994,
and the extra transfers for 1993 would be deducted from the transfers for 1994.
The implementation of the new tax system increased central revenues from 95.8
billion in 1993 to 290.7 billion in 1994 and correspondingly raised the central share in
total revenues from 22 percent in 1993 to 55.7 percent in 1994, and decreased aggregated
provincial revenues from 339.1 billion in 1993 to 231.1 billion in 1994 (Table 1).
According to the deal between the central and provincial authorities, the reduced amount
was to be topped up by central “return transfers.” Therefore, in 1994, the central
expenditure was 414.4 billion (including transfers), although the budgetary spending at
the discretion of central government was only 175.4 billion. Transfers from the center to
provinces soared from 54.5 billion in 1993 to 238.9 billion in 1994, among which
roughly 180 billion was the “return transfers” from the center to top up to their 1993
revenue level.7
Even after all these adjustments, the redistribution of revenues did not improve.
The central government’s revenues continued to experienced a decline (52.2% in 1995,
49.4% in 1996 and 48.9% in 19978) because local government tax revenues from the
6 Ma Hong and Sun Shangqing. Jingji Baipishu. 1992-1993. Economic White Paper, 1992-93. (Beijing:
China Development Press, 1993.) quoted in Wang (1997). 7 Finance Yearbook of China (1997). All revenue and expenditure figures exclude debt.
8 Finance Yearbook of China (1997).
16
agricultural tax, individual income tax, and business tax increased at a faster pace than
central government tax revenues from the VAT, certain customs tariffs, and consumption
taxes. In addition, the central government increased export VAT rebates and reduced
customs tariffs in order to encourage exports and technology imports and attract foreign
direct investment.
III. Forms of the Soft-budget Constraint
The fiscal year in China follows the calendar year. State budgets are prepared
every September and the National Budget Department of the MOF collects the spending
plans and revenue estimates from ministries and agencies of the central and provincial
governments. The aggregated budget prepared by the MOF (for central and aggregated
subnational governments combined) is then submitted to the State Council. After the
State Council approves the budget, the draft budget is then sent to the National People’s
Congress (NPC) (usually by March of the next each year) for final approval, when the
processing budget has already been executed for three months. Pursuant to the budget law
effective January 1, 1995, the NPC reviews and approves the budget for the central
government. The budget law also lays out rules and procedures for the review and
approval by the corresponding people’s congresses of the corresponding local
government’s budgets. In practice, the review and approval of subnational budgets follow
the approval of the budget by NPC at the superior level. i.e., only after the aggregated
national budget is approved, can the NPC at the provincial level start to review the
aggregated provincial budget. The auditing of the national budget by the National
Auditing Office is carried out in June of the next year.
17
Prior to 1994, budget deficits were financed through a combination of credits from
the People’s Bank of China (PBOC) and domestic and international borrowing as debt
revenues. The new budget law (effective January 1, 1995) states in its first chapter that
budgets at all levels of government shall be balanced. Chapter 10 of the same law
stipulated that any violation of the balanced budget approved by the legal process would
result in administrative prosecution against parties directly responsible. The government
now finances its budget deficits only through domestic and international borrowings and
such borrowing is no longer counted as “debt revenues” in the state budget.
(1) Increased Transfers from the Center and Bargaining with the Center.
One way for subnational governments to balance their budgets each year is by
increasing transfers from the center through grant allocations and revenue bargaining.
Fiscal redistribution via earmarked grants occurs through an ad hoc case-by-case process,
which is often poorly targeted and provides grants too small to meet basic needs in poorer
regions. Also, the arbitrary nature of central grant allocations has led to extensive
negotiations and rent-seeking by local authorities, tying up valuable administrative
resources.
Under the “contract system” of the 1980s and early 1990s, “transfers” were
obtained by local authorities through “negotiating or renegotiating” the contracted rates
and periods under each sharing method. Remittance revenues were subject to adjustment
and resulted in a “default” by subnational governments. For example, in 1991, in
response to the regional flood in some eastern areas (Hua Dong region), the central
government waived or reduced the required remittances from the affected provinces
18
(Gao, 1993). In this the budget constraint suffered a considerable discount during the
bargaining process between the central and the subnational governments.
Agarwala (1992) enumerates several scenarios that lead to bargaining over
intergovernmental transfers between central and provincial governments: First, the
responsibilities of both central and provincial governments overlap considerably. Clear
evidence of their joint involvement in various activities resulted in significant impacts on
resources and expenditures.
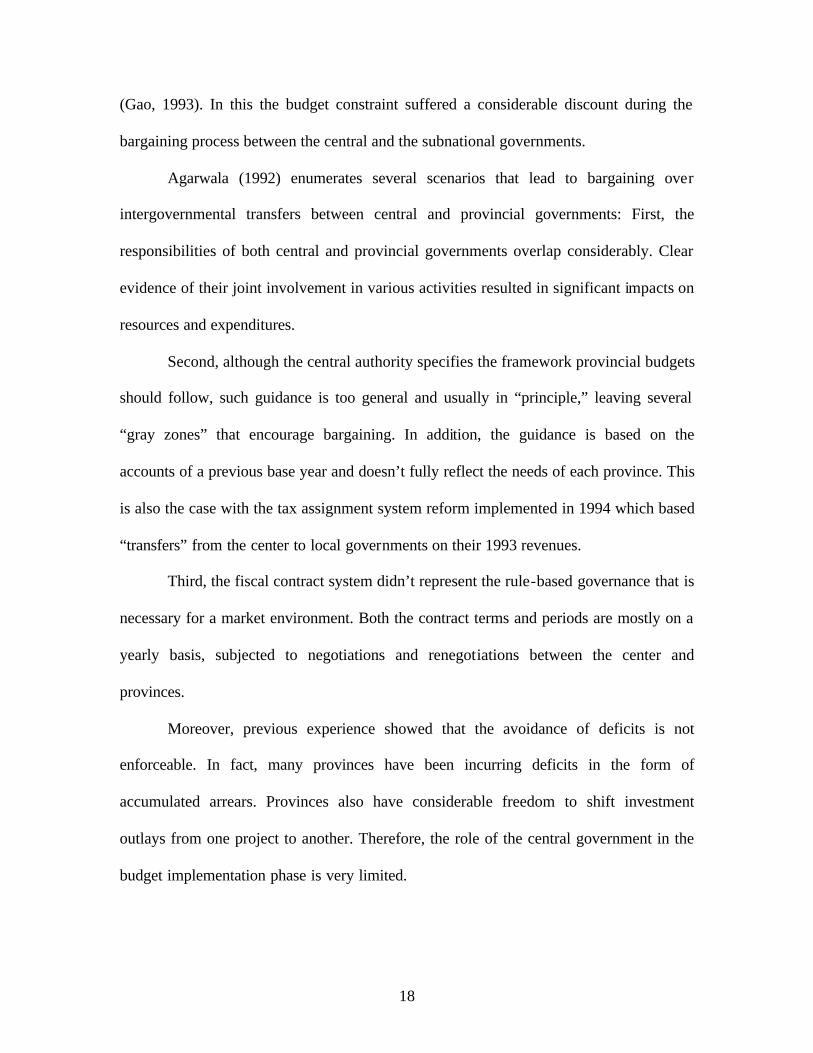
Second, although the central authority specifies the framework provincial budgets
should follow, such guidance is too general and usually in “principle,” leaving several
“gray zones” that encourage bargaining. In addition, the guidance is based on the
accounts of a previous base year and doesn’t fully reflect the needs of each province. This
is also the case with the tax assignment system reform implemented in 1994 which based
“transfers” from the center to local governments on their 1993 revenues.
Third, the fiscal contract system didn’t represent the rule-based governance that is
necessary for a market environment. Both the contract terms and periods are mostly on a
yearly basis, subjected to negotiations and renegotiations between the center and
provinces.
Moreover, previous experience showed that the avoidance of deficits is not
enforceable. In fact, many provinces have been incurring deficits in the form of
accumulated arrears. Provinces also have considerable freedom to shift investment
outlays from one project to another. Therefore, the role of the central government in the
budget implementation phase is very limited.
19
In the current system, bargaining is used to (1) determine additional contributions
to the center, (2) make transfers to the provinces to meet additional expenditure
requirements stemming from natural calamities and related factors, (3) obtain credit from
the banking sector, and (4) determine quotas for the subscription of state bonds.
(2) Subsidies
Subnational governments in China pay huge subsidies to state-owned enterprises
(SOEs) for their losses resulting from market or price distortions. With direct ownership
of SOEs, subnational governments can subsidize their respective loss-making enterprises
and list such financial transactions as negative revenues in their budgets. Less explicit
forms of subsidies are debt forgiveness and reduced or refunded government taxes and
charges.
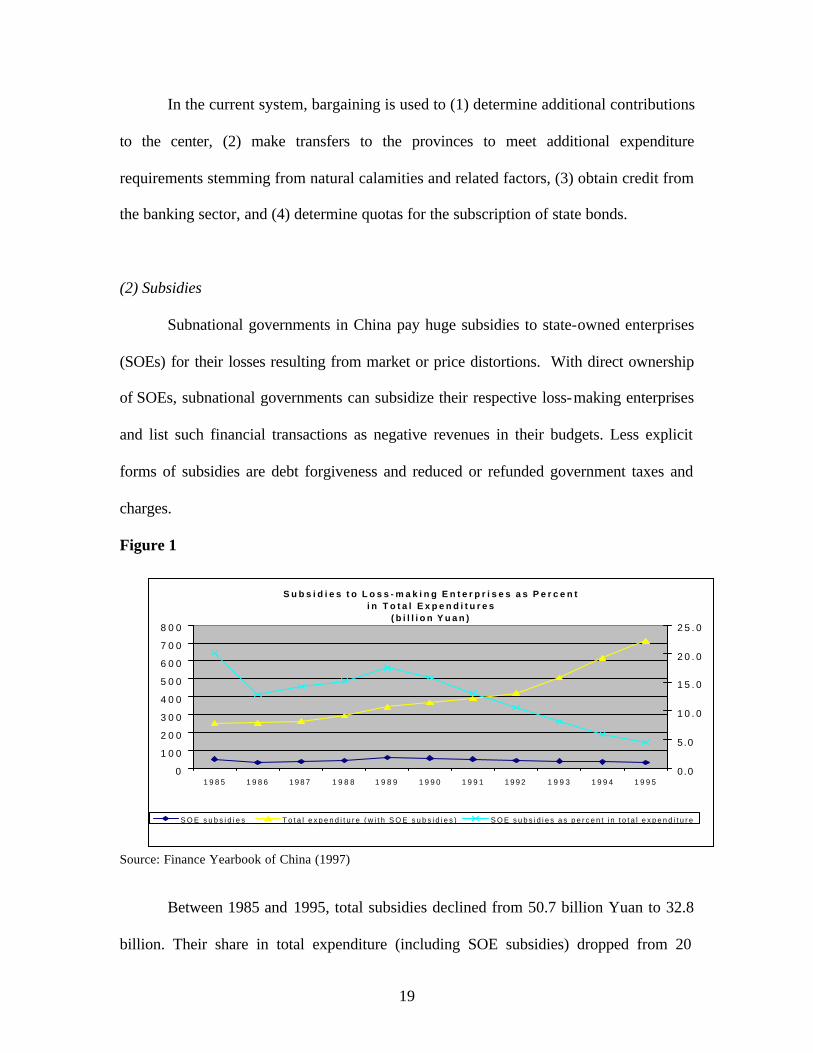
Figure 1
Source: Finance Yearbook of China (1997)
Between 1985 and 1995, total subsidies declined from 50.7 billion Yuan to 32.8
billion. Their share in total expenditure (including SOE subsidies) dropped from 20
S u b s i d i e s t o L o s s - m a k i n g E n t e r p r i s e s a s P e r c e n t i n T o t a l E x p e n d i t u r e s
( b i l l i o n Y u a n )
0
1 0 0
2 0 0
3 0 0
4 0 0
5 0 0
6 0 0
7 0 0
8 0 0
1 9 8 5 1 9 8 6 1 9 8 7 1 9 8 8 1 9 8 9 1 9 9 0 1 9 9 1 1 9 9 2 1 9 9 3 1 9 9 4 1 9 9 50.0
5.0
1 0 . 0
1 5 . 0
2 0 . 0
2 5 . 0
S O E s u b s i d i e s T o t a l e x p e n d i t u r e ( w i t h S O E s u b s i d i e s ) S O E s u b s i d i e s a s p e r c e n t i n t o t a l e x p e n d i t u r e

20
percent in 1985 to 4.6 percent in 1995 (Figure 1). Such a significantly diminished role of
subsidies may be largely attributed to a comparatively rapid increase in total expenditure.
In practice, a portion of the government assistance to SOEs covers for the operational
inefficiencies of these enterprises (Lall and Hofman, 1995).
At the same time, SOEs are obligated to employ redundant workers and bear the
cost of related services, such as housing, healthcare, child care, schooling and pension. In
the current system, many SOEs share the spending responsibilities of local governments
and have become conduits for central- local financial transfers. As Steinfeld (1999)
explains: SOEs are continually exposed to intervention by local state agencies,
empowered by the very policies of governmental decentralization that were intended to
undermined command planning. Meanwhile, profit contracts—arrangements intended to
rationalize the relationship between firm and state—fail to protect the firm from the state
yet do encourage the firm to overproduce and overexpand. Overproduction is then
fostered by soft credit, capital made available through a banking system that was
supposed to be the linchpin of market reform. On top of all that, new accounting
standards—intended to permit managers the kind of autonomy that would encourage
market behavior—actually make the misapplication of funds or outright decapitalization
of the firm even easier.
(3) Credit Plan and Borrowing from Commercial Banks
Prior to the economic reforms in China, the credit plan, together with the cash plan,
the central government budget, and the foreign exchange plan, represented the financing
side of the physical plan. Although plans are still drafted, their significance has steadily
21
diminished since 1978. The reestablishment of banking system in the early reform period
(1978-94) led to the independent operation of the People’s Construction Bank of China
(renamed China Construction Bank, CCB) and the Bank of China (BOC), which were
subordinates under MOF and PBC, respectively, before the reform. At the same time, the
Agricultural Bank of China (ABC) was established to take over the PBC’s rural banking
business. By 1994, there were three policy banks,9 four state commercial banks,10 four
universal banks,11 and a number of other local commercial banks and nonbank financial
institutions.
The credit plan.12 The annual credit plan, which was formulated by the People’s
Bank of China (PBC) in consultation with the MOF and State Planning Commission
(renamed State Development and Planning Commission, SDPC), took into account the
need for investment in fixed capital and working capital, as well as PBC’s direct
financing of the government’s deficit.13 Ultimately, the credit plan was approved by the
State Council and implemented by the PBC’s provincial and local branches, and later
through a set of credit quotas for each specialized and universal banks. As banks have
been transformed into financing institutions, local governments have gained powerful
influence over bank lending through the appointment of regional bank leaders. Apart
from these formal controls, local governments retain intangible influences that banks
9 State Development Bank of China (renamed as China Development Bank, CDB), Agricultural
Development Bank of China, Export and Import Bank of China. 10 Industrial and Commercial Bank of China, Agricultural Bank of China, Bank of China, and People’s Construction Bank of China.
11 Bank of Communications, China International Trust and Investment Corportation (CITIC)’s Industrial Bank, China Everbright Bank, and Hua Xia Bank.
12 See World Bank (1993). China: Budgetary Policy and Intergovernmental Fiscal Relations.
22
ignore only at their own peril. For example, the supply of water and electricity, housing,
recruitment of bank employees, schooling of their children, etc., all are potentially under
the influence of local governments (Huang, 1996). These relationships further
undermine central control over subnational governments and possibly stimulate
corruption. “Contiguity brings personalism to relationships, and personalism is the
enemy of arm’s length relationships” (Tanzi, 1995). Local governments thus gained
substantial control over the credit supply, which has become a source of soft budget
constraints of local governments and SOEs, as well as inflation (Qian and Rolland, 1998).
The commercialization of banks has enhanced the profit motives of lending
operations, merging the economic interests of banks with those of the local governments,
which both want to develop industries with high accounting profits (Huang, 1996). Thus
the developmental urges of banks are now similar to those of the local industrial bureaus.
This convergence of incentives means that it is harder for the central government to
achieve its industrial policy goal through the credit plans. Moreover, although the formal
power over credit creation rests with the headquarters of the PBC (and ultimately with the
State Council), the operational autonomy granted to the local bank branches attenuates
this central power. Bank branches are motivated to create credits on their own, by
converting deposits into loans (Bowles and White, 1993).
The credit plan also allocates preferential interest rates to some regions and
sectors. In addition to making direct contributions to the capital of the Bank, the MOF
also provides indirect support to the Bank through interest subsidies allocated each year
in the annual budget of the government to the projects receiving loans from the bank.
13 World Bank (1990). Financial Sector Policies and Institutional Development, Washington, D.C.
23
These subsidies are intended to further economic development policies of the government
by enabling borrowers to obtain loans with interest rates below commercial rates (World
Bank, 1993).
Local officials’ influence over lending combined with underpricing of loans
contributed to the excessive expansion of banks’ credit and a growing number of bad and
non-performing loans. Even frequent interest rate changes would not curb the situation.
This is partly because the soft budget constraints on SOEs make them unresponsive to the
cost of borrowing. In fact, the impact of interest rate changes was felt much more on
household savings than on bank lending (Mehran, Quintyn, Nordman, and Laurens,
1996). According to a statement by the governor of the People’s Bank, Dai Xianglong,
the share of nonperforming loans in the portfolios of the four largest state-owned banks
increased to 25 percent by the end of 1997. “Ultimately the borrowers of nonperforming
loans may default, requiring the lender to absorb the loss, drawing on either reserves or
its own capital” (Lardy, 1998). In 1998, the MOF issued 270 billion Yuan in government
bonds to recapitalize these state-owned banks. Such capital injections are an indirect
measure of the center’s bailout to local governments.
Following the commercialization of the banking system, 14 China’s State
Development Bank was established on March 17, 1994, replaced the PCBC as the
“policy-oriented” bank fostering economic development through long-term financing for
policy-oriented and related projects in accordance with the government’s development
plan and industrial policies. More specifically, its mission is to extend loans to policy-
14 Namely the five specialized banks: Bank of China, Construction Bank of China, Industrial and
Commercial Bank of China, Agriculture Bank of China, and the Bank of Communications.
24
oriented, medium- and large-scale construction, technological transformation and related
projects for key state infrastructure facilities, basic industries, and pillar industries.
According to China’s 1994 budget law, local governments are forbidden from
borrowing on the capital market. However, local enterprises (that provide public services)
can and do borrow from banks and on the capital market—despite their dependence on
government subsidies of various kinds, which often makes them de facto government
agencies. Given the still limited direct and indirect transfers from the center to provinces,
such borrowing from local commercial banks by enterprises (under the jurisdiction of
local governments) actually finances much subnational spending. This in turn creates
contingent liabilities for local governments, and given the lack of transparency, is less
easily controlled than explicit government borrowing.
Although the central government reserved credit resources such as bank loans and
capital market access for use only by state-approved projects, and it strengthened the
traditional investment plan and approval mechanism, local authorities still maintained
considerable latitude in securing and deploying financial resources. For example,
subnational government maintained the power to approve investment projects below 50
million (projects above 50 million require approval by SDPC) and technical
transformation or technology promotion projects below 30 million (projects above 30
million require approval by the State Economic and Trade). These projects can be
funded by commercial and indirect borrowing. These rules have resulted in redundant
investment of medium- and small-sized investment projects directly under the jurisdiction
of subnational governments. Moreover, in the fiscal system before 1994, product tax and
business tax were both exclusively assigned to the subnational government, leading to the
25
expansion of capital construction, particularly those industries (e.g., tobacco and alcohol)
that generate high revenue from the product tax and business tax.
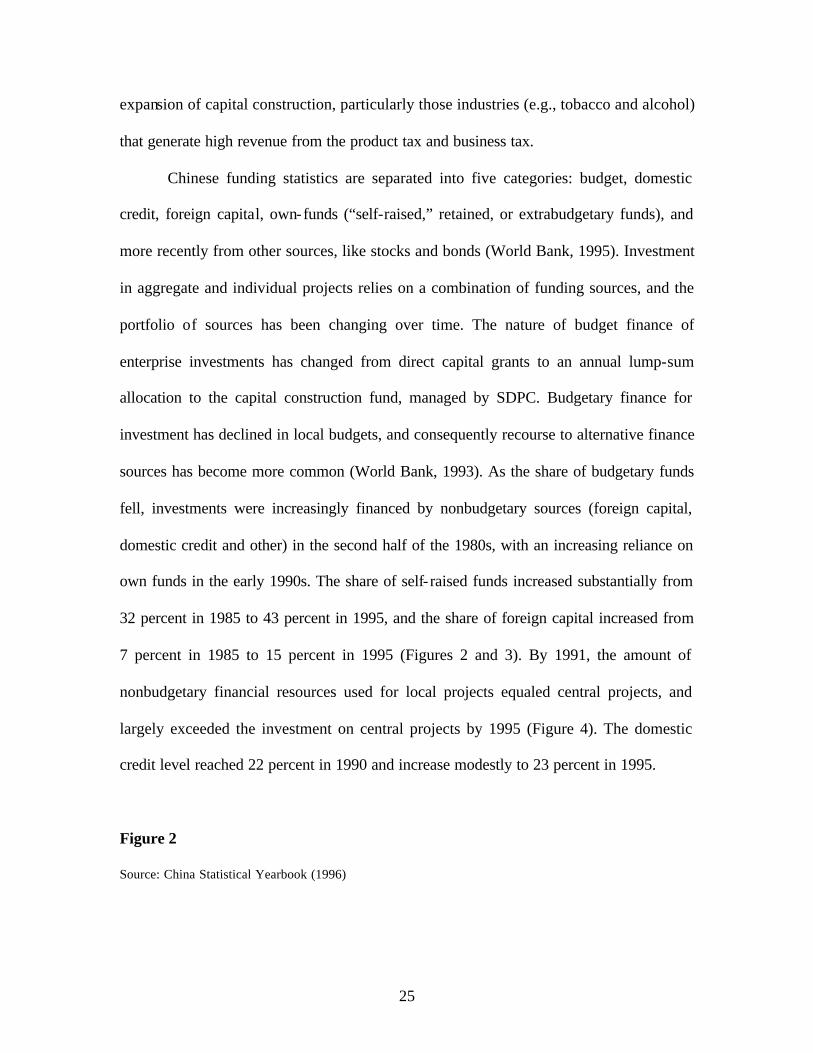
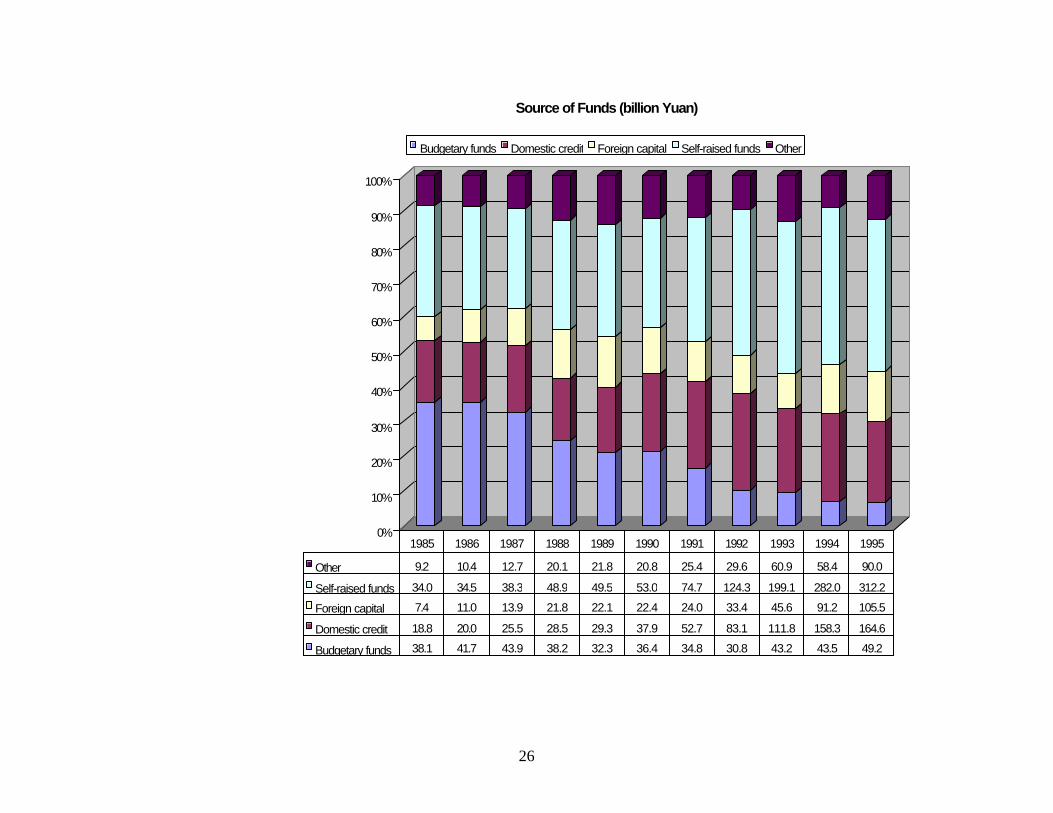
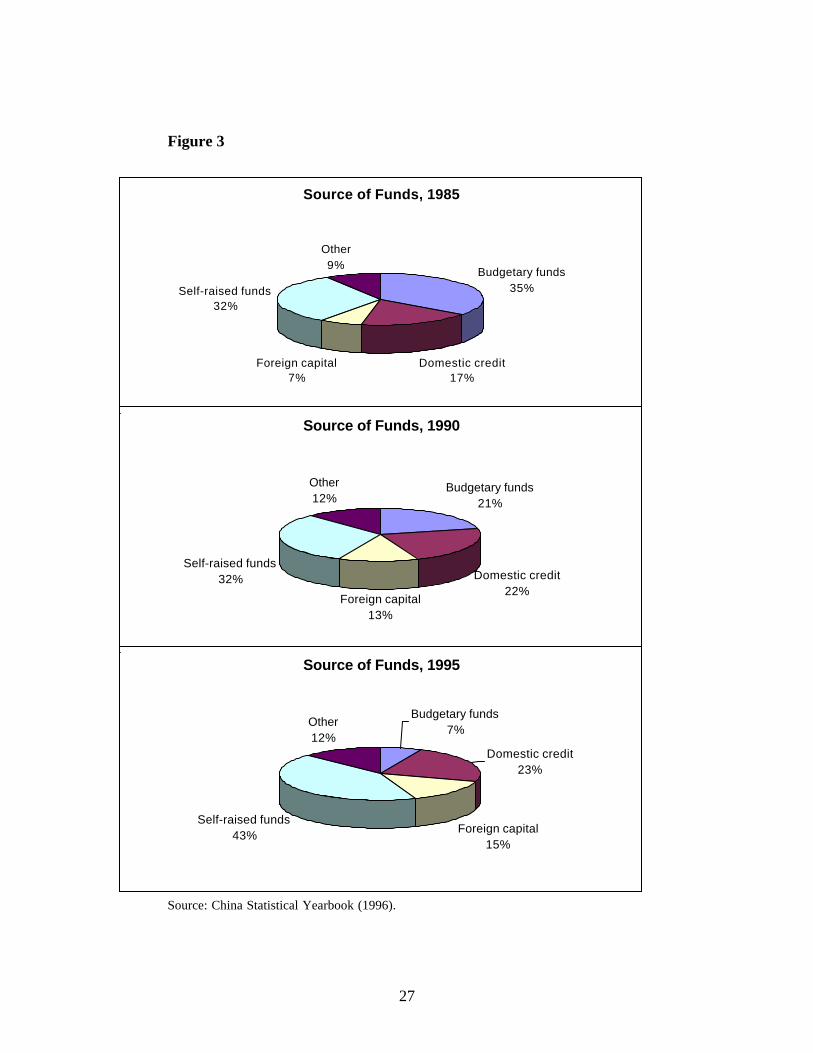
Chinese funding statistics are separated into five categories: budget, domestic
credit, foreign capital, own-funds (“self-raised,” retained, or extrabudgetary funds), and
more recently from other sources, like stocks and bonds (World Bank, 1995). Investment
in aggregate and individual projects relies on a combination of funding sources, and the
portfolio of sources has been changing over time. The nature of budget finance of
enterprise investments has changed from direct capital grants to an annual lump-sum
allocation to the capital construction fund, managed by SDPC. Budgetary finance for
investment has declined in local budgets, and consequently recourse to alternative finance
sources has become more common (World Bank, 1993). As the share of budgetary funds
fell, investments were increasingly financed by nonbudgetary sources (foreign capital,
domestic credit and other) in the second half of the 1980s, with an increasing reliance on
own funds in the early 1990s. The share of self- raised funds increased substantially from
32 percent in 1985 to 43 percent in 1995, and the share of foreign capital increased from
7 percent in 1985 to 15 percent in 1995 (Figures 2 and 3). By 1991, the amount of
nonbudgetary financial resources used for local projects equaled central projects, and
largely exceeded the investment on central projects by 1995 (Figure 4). The domestic
credit level reached 22 percent in 1990 and increase modestly to 23 percent in 1995.
Figure 2
Source: China Statistical Yearbook (1996)
26
0%
10%
20%
30%
40%
50%
60%
70%
80%
90%
100%
Source of Funds (billion Yuan)
Budgetary funds Domestic credit Foreign capital Self-raised funds Other
Other 9.2 10.4 12.7 20.1 21.8 20.8 25.4 29.6 60.9 58.4 90.0
Self-raised funds 34.0 34.5 38.3 48.9 49.5 53.0 74.7 124.3 199.1 282.0 312.2
Foreign capital 7.4 11.0 13.9 21.8 22.1 22.4 24.0 33.4 45.6 91.2 105.5
Domestic credit 18.8 20.0 25.5 28.5 29.3 37.9 52.7 83.1 111.8 158.3 164.6
Budgetary funds 38.1 41.7 43.9 38.2 32.3 36.4 34.8 30.8 43.2 43.5 49.2
1985 1986 1987 1988 1989 1990 1991 1992 1993 1994 1995
27
Figure 3
Source: China Statistical Yearbook (1996).
Source of Funds, 1985
Budgetary funds35%
Domestic credit17%
Foreign capital7%
Self-raised funds32%
Other9%
Source of Funds, 1990
Budgetary funds21%
Domestic credit22%
Foreign capital13%
Self-raised funds32%
Other12%
Source of Funds, 1995
Budgetary funds7%
Domestic credit23%
Foreign capital15%
Self-raised funds43%
Other12%

28
Figure 4
Source: China Statistical Yearbook (1996)
(4) Indirect Borrowing and Foreign Borrowing
Indirect Borrowing. Provincial and local governments undertake indirect
borrowing mainly by creating dummy financial companies that are able to borrow and
provide resources for local government expenditures. Another method of indirect
borrowing has been through a buildup of arrears, as well as IOUs on the procurement of
agricultural products (Ahmad, 1997).
Thus, soft budget constraints are reflected in the proliferation of trust and
investment companies (TICs) and securities houses under the jurisdictions of provincial
and local governments. According to Mehran, Quintyn, Nordman, and Laurens (1996),
TICs receive government and enterprise trust deposits or entrusted deposits. The larger
companies also underwrite and broker securities. Most TICs were established by the four
state-owned specialized banks, while other banks, the MOF, and some municipalities also
Investment of Nonbudgetary Resources (billion Yuan)
0
50
100
150
200
250
300
350
400
450
500
1985 1986 1987 1988 1989 1990 1991 1992 1993 1994 1995
Central government projects Local projects
29
own TICs. Banks initially established these TICs to circumvent the credit quotas, but
most TICs have been increasingly engaged in banking business, taking household
deposits and granting working capital loans. In the late 1980s, the number of TICs
operating throughout China was as many as 365. A portion of these TICs are engaged in
international business as the International Trust and Investment Companies (ITICs).
Some of them are involved in external borrowings.
External borrowing. SDPC authorizes and establishes quotas for external debt. The
State Administration of Foreign Exchange (SAFE) monitors and regulates compliance
with these quotas for external borrowings through a registration process. Under the
budget law, local governments are not allowed to incur foreign indebtedness unless
otherwise permitted by law. However, external borrowings by the central and local
government-owned financial institutions have been managed by a “window”
management system, under which the issuance of debt requires a quota from the SDPC
and an approval from SAFE. This system of quotas and approvals favored a limited
number of predesignated “window” companies. The window management system is
being replaced by a credit management system, whereby the quotas and approvals will be
granted to central and local government-owned enterprises and financial institutions
(including leasing companies) on the basis of their demonstrated capacity to repay the
borrowings, their free-standing creditworthiness, and China’s balance of payments
situation. Unless otherwise stated by the central government in the relevant debt issuance
documents or other official PRC documents, borrowings by these entities are not
guaranteed by any direct or indirect credit support from the central government. Most of
these local “window” financial institutions are TICs controlled by local governments.
Before Guangdong International Trust and Investment Company (GITIC) went bankrupt

30
in the first half of 1999, other local financial institutions enjoying the same treatment
included Fujian ITIC, Tianjin ITIC, Shanghai ITIC, Dalian ITIC, Shangdong ITIC, and
Shenzhen ITIC. By the end of 1998, the external debt of domestic financial institutions
(including central agencies) was 41.99 billion U.S. dollars, accounting for 28.8 percent of
China’s total external debt.15 With the bankruptcy of GITIC—the first since the economic
reform—the central government moved a step forward in hardening budget constraint on
subnational governments by refusing to bail out GITIC. Should financial difficulties
emerge in a large scale among these ITICs, it is not clear whether the central government
will join forces with provincial authorities to bail them out.
(5) Tax Incentive Policies
Tax incentive policies are widely adopted by developing countries to attract
foreign direct investment or to serve their indus trial policy (e.g. increase infrastructure
investment and high/new technology investment). One of the most salient features of
China’s tax incentive policies is its strong discrimination against domestic investors in
favor of foreign investors, and its regional and industry preferences (World Bank,
1999).16 In addition to general fiscal incentives, the application of these tax incentives,
especially the exemptions and reductions of corporate income tax, can be more generous
within the special economic zones, coastal open economic zones, economic and
technology development zones, and high/new technology development zones.17 These
15 Source: MOF. 16 For detailed information about tax exemptions and reductions, please see World Bank (1999, pp. 21-25).
17 Besides the widely applied income tax holidays, the reduction in corporate income tax rate is also substantial—whereas the corporate income tax rate is 33 percent, many activities and regions enjoy reduced tax rates between 15 and 24 percent. In addition, many investment projects in those regions and activities are exempted from the 17 percent import tariffs on imports of equipment and raw
31
policies sparked keen competition among subnational governments for the right to
establish such special economic zones, which adversely affected the central government.
First, subnational governments’ offer of ever-greater tax relief reduced government
revenues. Second, the establishment of unauthorized SEZs weakened the ability of the
central government to set and control macroeconomic policy.
Only four cities, namely, Shenzhen, Xiamen, Zhuhai, and Shantou were opened as
SEZs in 1980. In 1984, 14 more coastal cities were opened to foreign investment as
“Economic and Technical Development Zones” (ETDZs), allowing them to grant SEZ-
like incentives. Through the 1990s special zones extended to all coastal provinces, which
were authorized to give tax incentives or attractive commercial terms to foreign investors.
Special incentives for developing projects in the interior were also created, especially for
provincial capital cities (Rosen, 1999). Yang (1997) reported 111 development zones in
1991 (only 27 of which were centrally approved), 1,951 by September 1992, and as many
as 8,700 by mid-1993.
(6) Extrabudgetary Funds
Although public finance has been centrally controlled since 1949, certain revenues
and expenditures of state-owned enterprises, local governments, agencies of the central
government and certain public institutions have historically been excluded from the state
budget. These extrabudgetary revenues and expenditures are subject to varying degrees of
control and regulation by the central government.
materials. Export-oriented enterprises in the special economic zones and the economic technological development zones where the enterprise income tax has already been reduced to 15 percent would be taxed at 10 percent (World Bank, 1999).
32
Since 1980, a devolution of expenditures from central to local governments, down
to the township level, has led to a rapid increase in local expenditures, particularly
administrative costs, health, education, and scientific research expenditures. The
decentralization of expenditures over the reform period can be attributed to the following
shifts: (1) a new emphasis on functions traditionally administered at local levels, such as
social expenditures; (2) increases in administrative expenses and wages (largely due to
the rapid increase in the number of civil servants at local level), which fell more heavily
on local governments; and (3) sharp rises in locally administered but centrally set price
subsidies. The local own-tax sources of revenues has not kept pace with rising
expenditures, and local governments have become increasingly dependent on their
extrabudgetary funds to perform their functions. The proliferation of extrabudgetary
funds has blurred priority setting and weakened the budgetary control mechanisms
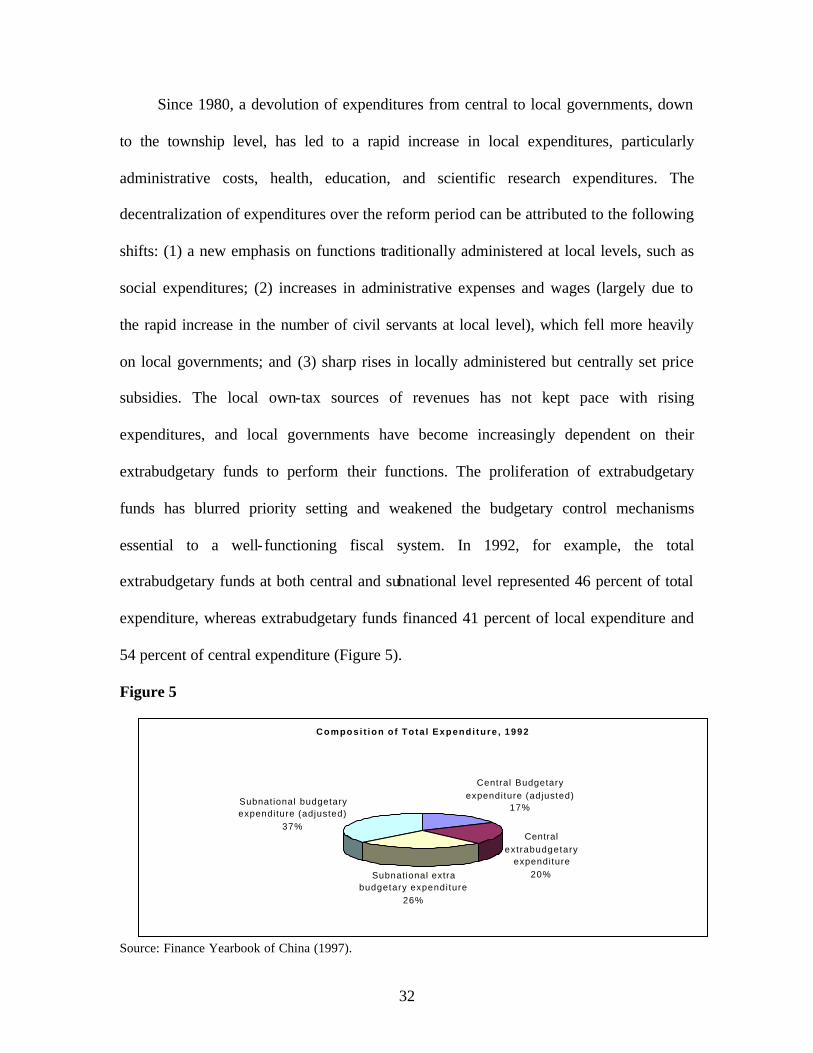
essential to a well- functioning fiscal system. In 1992, for example, the total
extrabudgetary funds at both central and subnational level represented 46 percent of total
expenditure, whereas extrabudgetary funds financed 41 percent of local expenditure and
54 percent of central expenditure (Figure 5).
Figure 5
Source: Finance Yearbook of China (1997).
Composi t ion o f Tota l Expendi ture , 1992
Central Budgetary expenditure (adjusted)
17%
Subnational extra budgetary expenditure
26%
Central extrabudgetary
expenditure20%
Subnational budgetary expenditure (adjusted)
37%
33
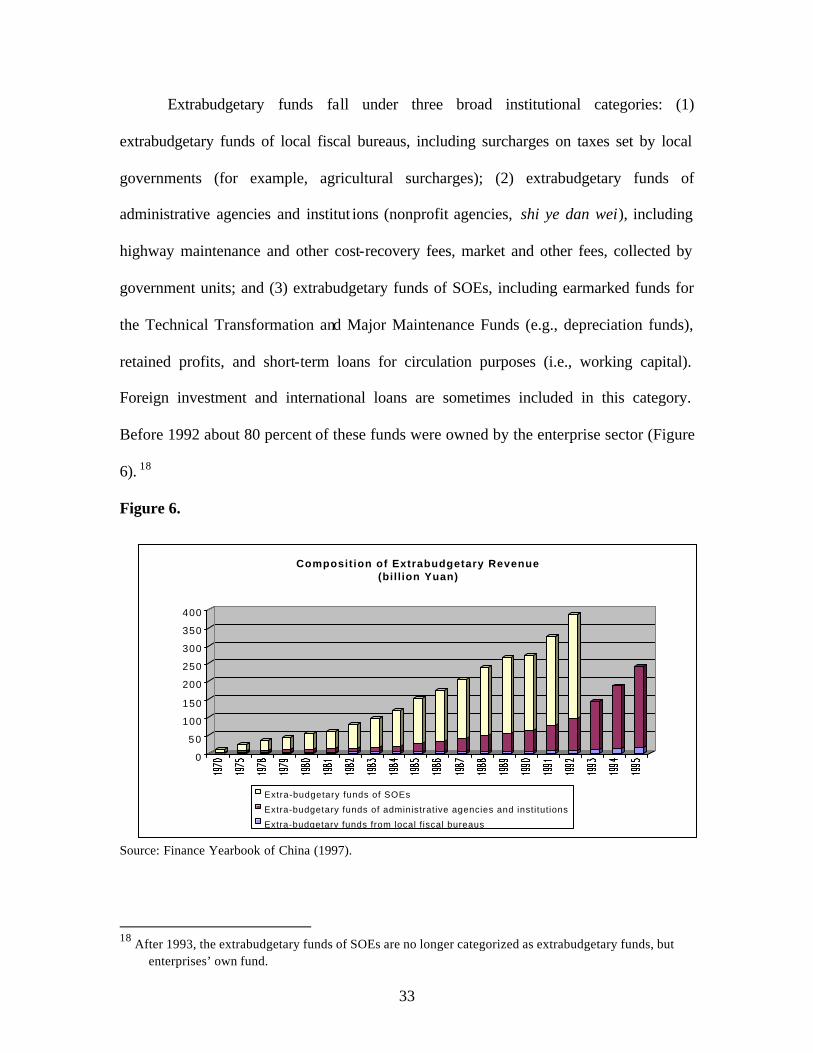
Extrabudgetary funds fall under three broad institutional categories: (1)
extrabudgetary funds of local fiscal bureaus, including surcharges on taxes set by local
governments (for example, agricultural surcharges); (2) extrabudgetary funds of
administrative agencies and institut ions (nonprofit agencies, shi ye dan wei), including
highway maintenance and other cost-recovery fees, market and other fees, collected by
government units; and (3) extrabudgetary funds of SOEs, including earmarked funds for
the Technical Transformation and Major Maintenance Funds (e.g., depreciation funds),
retained profits, and short-term loans for circulation purposes (i.e., working capital).
Foreign investment and international loans are sometimes included in this category.
Before 1992 about 80 percent of these funds were owned by the enterprise sector (Figure
6). 18
Figure 6.
Source: Finance Yearbook of China (1997).
18 After 1993, the extrabudgetary funds of SOEs are no longer categorized as extrabudgetary funds, but
enterprises’ own fund.
0
50
100
150
200
250
300
350
400
Composition of Extrabudgetary Revenue (bill ion Yuan)
Extra-budgetary funds of SOEs
Extra-budgetary funds of administrative agencies and institutions
Extra-budgetary funds from local f iscal bureaus
34
Initially, the explicit objective of extrabudgetary transactions was to allow
increased flexibility. They were also supposed to change the structure of incentives to
help revitalize SOEs, speed up growth, and, in general, improve incentives for
government units.
The increasing use of price subsidies and SOE subsidies during the second half of
the 1980s pushed other more pressing expenditures off the budget. This allowed a rapid
growth of extrabudgetary funds, which became a particularly striking feature of the tax
reform period of the 1980s (Figure 7). A combination of reform initiatives, e.g., the
profit-retention schemes, enterprise retention of depreciation funds, and the deduction of
pretax amortization before tax payments which transferred resources from the
government to the enterprise sector, gave the SOEs more autonomy, but at the same time,
reduced fiscal control over resources. Starting in 1993, extrabudgetary funds of SOEs
were abolished, which, then led to a substantial increase of extrabudgetary funds in the
other two categories (Figure 6). In 1996, for example, the aggregated extrabudgetary
revenue of central administrations increased by nearly 200 percent, and that of the
provincial governments increased by 41 percent.19
19 Source: Finance Yearbook of China (1997).

35
Figure 7.
Source: Finance Yearbook of China (1997).
On the expenditure side, extrabudgetary funds are used to finance fixed-asset
investment, major maintenance, bonuses and welfare payments, administrative
expenditures, expenditures in the social sectors, transfers and taxes paid to the central
government, increases in working capital and other earmarked programs (Figure 8).
Extrabudgetary Revenue as a Percentage of Total Government Revenue (billion Yuan)
0
100
200
300
400
500
600
700
800
900
1982 1983 1984 1985 1986 1987 1988 1989 1990 1991 1992 1993 1994 1995 1996
Extra-budgetary revenue Total government revenue (exclude SOEs subsidy as negative revenue)

36
Figure 8.
Source: Finance Yearbook of China (1997).
From the second half of 1980s to the first half of 1990s the extrabudgetary funds
became the central government’s major concern. Since provinces are only required to
report extrabudgetary revenues in very broad aggregated categories and no requirements
for them to report their extrabudgetary expenditures to MOF, the central authority lacked
any effective instruments to monitor the funds. Although MOF resorted to restricting the
number of banking accounts, that is, requiring all extrabudgetary funds be deposited into
the specific fiscal accounts with each extrabudgetary funds having one bank account, this
measure actually made the fiscal departments rely on the banking sector for the
surveillance. Nonetheless, the banking sector was experiencing a substantial
decentralization, under which each bank was urged to depend on its own funding
resources. As branches of different banks at localities started to solicit more clients, they
Extrabudgetary Expenditures (billion Yuan)
0.0
20.0
40.0
60.0
80.0
100.0
120.0
140.0
1990 1991 1992 1993 1994 1995
Technical updating and transformation
Capital construction
Production facilities maintenance ofstate-owned enterprises
Welfare and bonuses
Road-use fees and urban maintenance
Administrative Expenses
Central government funds for energy,transportation and key projects
Other
37
were more than happy to offer shelter for extrabudgetary funds, among which a
proportion came from local fiscal departments.20 As a result, one agency could end up
with several accounts for one kind of extrabudgetary fund.
The growth of extrabudgetary funds has undermined control over the scale of total
government expenditures by enabling growth-oriented local governments to spend more
freely outside the purview of central budgetary control. Local governments have tended
to spend virtually all the revenues generated from ad hoc off-budget fiscal levies (Lall
and Hofman, 1995). In 1996, the 29th decree of the State Council brought 13
extrabudgetary funds, totaling 150 billion Yuan, under the supervision of the MOF (Ding,
1997). According to the decree, all revenues generated from these funds are to be
remitted to the treasury, and its expenditure is subjected to the financial management by
the MOF based on the proposed plans drafted by line administrations. The income from
these extrabudgetary funds are to be earmarked for specific projects and not used for any
other purposes or to balance the budgets. The decree further stated that similar measures
would be introduced as the government sees fit.
IV. Conclusions
In this paper, we briefly review the evolution of intergovernmental fiscal relations
in China and describe the major forms of soft-budget constraint facing local
governments. During the fiscal reform of the 1980s and 1990s, local governments
responded to tightening budget constraints in ways that undermine desired fiscal
discipline by (1) expanding the local tax base at the cost of the central government; (2)
turning budgetary into extrabudgetary funds and tapping enterprises’ extrabudgetary
20 Some of the local fiscal agencies moved their budgetary fund to extrabudgetary accounts.
38
funds for government purposes; (3) pushing expenditures into extrabudget items,
sometimes financed by indirect local borrowing, which placed additional demands on
local banks and strains macroeconomic stability; (4) raising funds through internal and
external borrowings, and (5) extending tax preferential policies by lavishly establishing
SEZs. In addition, local governments have reduced effective tax rates on enterprise
profits below the statutory rate via enterprise profit contracts. Local governments have
offered tax concessions to enterprises that affect the size of the taxable income to the
detriment of tax buoyancy, for instance by manipulating the rules for pretax repayment of
investment loans. And because the resource-strapped local governments depend on local
enterprises for their revenues, they are tempted into inefficient regional competition and
local protectionism made possible by voids in competition regulations.
The reform introduced in 1994 continues to meet with significant resistance at the
local levels. The premise that taxes belong to the central government unless specifically
assigned to the localities is not accepted at the local levels. The goals of uniformity and
transparency were compromised at the outset when the central government set the
transfer rule based on the assurance of the status quo distribution in 1993. To avoid
arbitrary, ad hoc negotiations between the center and local authorities in the allocation of
grants, the central government must move quickly to introduce a formula-based
intergovernmental transfer scheme and fund it with significant resources.
The highly fragmented authoritarian arrangement features the ownership of
enterprises by local governments that have strong links to financial intermediaries. Thus
local governments enjoy both a soft budget constraint and autonomy in lending decisions,
which enables them to resort to SOEs for both delivery of public services and debt

39
financing. Soft budgets are thus incurred for both the SOEs and local governments. At the
same time, SOEs treat tax liabilities lightly in an environment where the local finance
bureaus play the double role of tax collector and owner, and in a situation where taxes are
frequently contracted rather than assessed. Budgetary financing of SOE investment is still
virtually free, as repayment ratios of the banks are extremely low, or as repayments are
canceled out against tax obligation. This works to the detriment of banking-sector
stability.
While the objective of separating policy and commercial lending is important, it is
not enough by itself to foster commercialization of the banking sector. Specialized banks
are still subject to lending quotas, are obliged to provide working capital loans to SOEs,
can lend only for government-approved projects, and to finance SDB through the
compulsory purchase of its bonds. Banks cannot operate on a commercial basis until
project-specific credit allocation has been eliminated. A hard budget constraint on local
governments and SOEs cannot be established until local governments and the banking
sector are separated and distributed ownership is phased out.
In the past 20 years, tax preferential policies played a significant role in attracting
foreign direct investment to facilitate the economic reform agenda in China. However,
the lavish adoption of such a policy by subnational governments without the approval of
the center largely undermined fiscal discipline and negatively affected the industrial
restructuring and regional development agenda set by the central government. The tax
system reform should also address this issue by cleaning up the SEZs and tax preferential
policies.

40
References
Agarwala, Pamgopal. (1992). China: Reforming Intergovernmental Fiscal Relations. World Bank Discussion Paper 178. Washington D.C.
Ahmad, Ehtisham. (1997). “China.” In Teresa Ter-Minassian, ed., (1997), Fiscal
Federalism in Theory and Practice, Washington D.C: IMF. Bahl, Roy, and Christine Wallich. (1992). “Intergovernmental Fiscal Relations in China.”
Research Working Paper 863, Washington D.C: Development Research Group, World Bank.
Bo, Zhiyue. (1996). “Economic Performance and Political Mobility: Chinese Provincial
Leaders,” Journal of Contemporary China, 5 (12): 135-54. Bowles, Paul, and Cordon White. (1993). The Political Economy of China’s Financial
Reforms. Boulder, CO: Westview Press. “Budget Law of the People’s Republic of China” (1994). Beijing. China Development Bank.(1999).Prospectus Supplement. New York. China Statistical Yearbook. Various issues. Ding, Xianjue. (1997). “Renzhen guanche luoshi guowuYuan ‘Jueding’ jingshen, qieshi
jiaqiang yusuanwai zijin guanli” (Implementing the Decision by the State Council, Strengthening the Financial Management of Extrabudgetary Fund). Paper presented at Fiscal Reform and Development Seminar, Beijing.
Finance Yearbook of China. Various issues. Gao, Qiang. (1993). “Problems Remained in China’s Intergovernmental Fiscal Relations,
Tax Assignment System and Prospects for Future Reform.” In Ministry of Finance and International Monetary Fund ed. China: Intergovernmental Fiscal Relations. Beijing: China Economics Press.
Huang, Yasheng. (1996). “Central-Local Relations in China During the Reform Era: The
Economic and institutional Dimensions.” World Development, 24 (4): 655-672. Kornai, Janos. (1992). The Socialist System: The Political Economy of Communism.
Princeton, New Jersey : Princeton University press. Lall, Rajiv, and Bert Hofman. (1995). “Decentralization and the Government Deficit in
China.” In Jayanta Roy ed. Macroeconomic Management and Fiscal Decentralization. Washington D.C: World Bank Institute of the World Bank.
Lardy, Nicholas. (1998). “China and the Asian Contagion,” Foreign Affair, 77 (4):
July/Aug.

41
Mehran, Hassanali, Marc Quintyn, Tom Nordman, and Bernard Laurens. (1996).
Monetary and Exchange System Reforms in China: An Experiment in Gradualism. Washington, D.C: International Monetary Fund.
Manion, Melanie. (1985). “The cadre management system, post Mao: The appointment,
promotion, transfer and removal of party and state leaders”. China quarterly, 102 (June): 203-33.
Qian, Yingyi and Gerard Roland. (1998). “Federalism and the Soft Budget Constraint,”
American Economic Review, 88 (5): 1143-62. Rosen, Daniel H. (1999). Behind the Open Door: Foreign Enterprises in the Chinese
Market Place. IIE. Roy, Jayanta, ed. (1995). “Macroeconomic Management and Fiscal Decentralization,”
Washington D.C: World Bank Institute of the World Bank. Sachs, Jeffery, Wing Thye Woo and Xiaokai Yang. (2000). “Economic Reforms and
Constitutional Transition,” Annals of Economics and Finance. Vol.1, No.2. Steinfeld, Edward. (1999). Forging Reform in China: The Fate of State-Owned Industry.
Cambridge: Cambridge University Press. Tanzi, Vito. (1995). “Fiscal Federalism and Decentralization: A Review of Some
Efficiency and Macroeconomic Aspects.” In Michael Bruno and Boris Pleskovic eds., Annual Bank Conference Development Economics 1995. Washington D.C: World Bank.
Wang, Shaoguang. (1997). “China’s Fiscal Reform in 1994: An Initial Assessment,” Asian Survey (U.S.) 37: 801-17. World Bank. (1989). “China: Revenue Mobilization and Tax Policy Issues and Options,”
Report No. 7605-CHA, Washington D.C. World Bank. (1990). Financial Sector Policies and Institutional Development,
Washington, D.C. World Bank. (1993). “China: Budgetary Policy and Intergovernmental Fiscal Relations.”
Report No. 11094-CHA, Washington D.C. World Bank. (1995). “China: Public Investment and Finance.” Report No. 14540-CHA,
Washington, D.C. World Bank. (1999). China: Preferential Tax Policy. Washington, D.C.
42
Wong, Christine P. W. (1991). “Central-Local Relations in an Era of Fiscal Decline: The Paradox of Fiscal Decentralization in Post-Mao China”. The China Quarterly, 128: 691-715.
Yang, Dali, L. (1997). Beyond Beijing. Liberalization and the Regions in China.
Routledge: London.