chapter 6 experimentation and methodology for the...
TRANSCRIPT

CHAPTER 6
EXPERIMENTATION AND METHODOLOGY FOR THE STUDY OF RHA
ON OPC- HYDRATION SYSTEM
6.1 INTRODUCTION
This chapter reports the effect of rice husk ash on OPC hydration mechanism.
Development of compressive strength with age has been chosen as the principal
parameter for comparing the effects of rice husk ash in mortar and concrete.
6.2 MATERIALS
6.2.1 Cement
Ordinary Portland Cement-53 grade confirming to IS: 12269-1989 was used for the
present study. The total quantity of cement required was approximately estimated,
brought, and stored in an air tight container. The physical properties of the cement
were tested in accordance with IS: 4031-1968 and are given in Table 6.1.
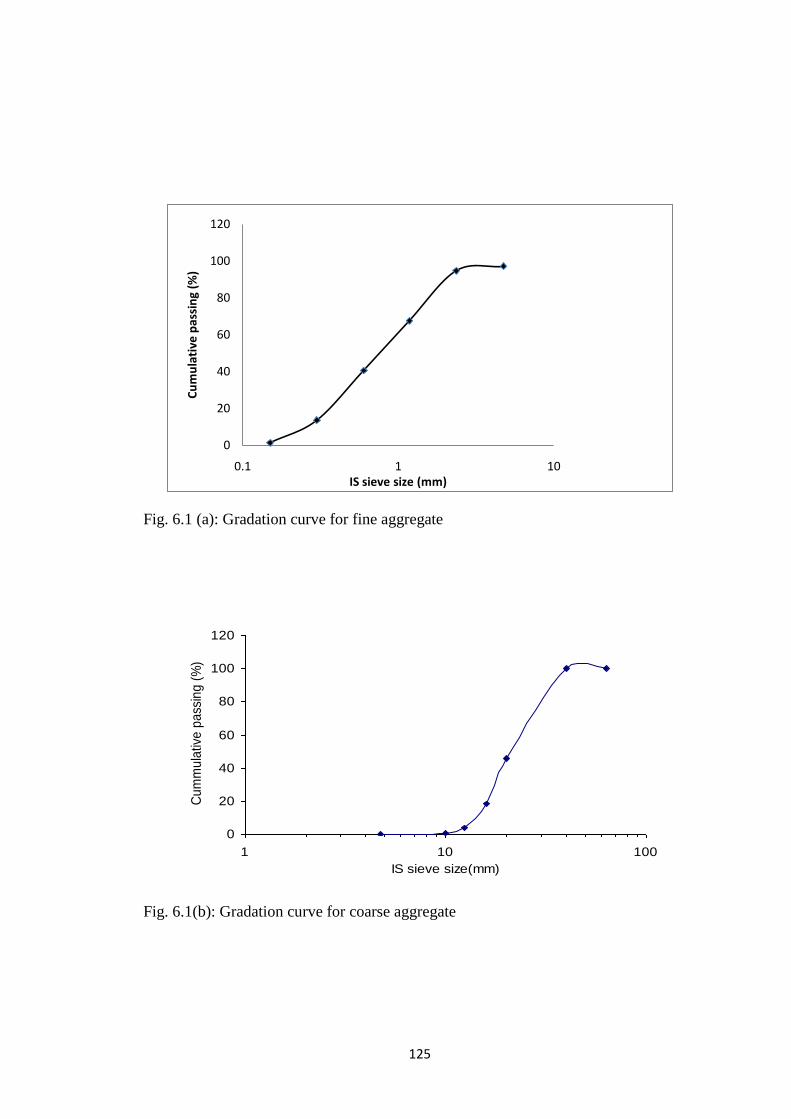
6.2.2 Aggregates
Locally available crushed granite aggregate of 20mm maximum size was used as
coarse aggregate. Locally available river sand with fineness modulus of 2.62 was used
as fine aggregate. The specific gravity of both coarse and fine aggregate was 2.70 and
2.63 respectively and the water absorption was 0.4 percent and 0.5 percent
respectively. Aggregates were tested as per IS: 2386-1963 and the results pertaining
to the properties and sieve analysis are presented in Table 6.2. Gradation curves for
fine and coarse aggregates are shown in Figs. 6.1(a) & (b) respectively.
6.2.3 Rice Husk Ash
Rice husk ash produced under optimum incineration/production condition (500°C -
120 minutes) was used for further studies. The grinding was done in a laboratory ball
mill for 30 minutes duration (Vide § 4.4). The sample retrieved from the furnace was

110
kept in air tight polythene bags and stored in a similar manner after grinding. The
standard Le-chatelier flask confirming to IS: 1727-1967 was used for the
determination of specific gravity of RHA samples. The fineness of RHA samples
were found out using Blaine’s air permeability apparatus as per IS: 1727-1967 and
BET nitrogen adsorption technique (vide § 4.6.3). The chemical composition of RHA
was found out by chemical analysis tests. The physical properties and chemical
composition of RHA are presented in Table 6.3.
a) Properties of RHA: The specific gravity of RHA sample studied was observed as
2.19. The range of specific gravity values reported by earlier researchers is 2.02 to
2.16 [Nehdi et al., 2003; Bui et al., 2005 and Ganesan et al., 2008]. It is to be noted
that the fineness of RHA sample used in the present study is higher than the values
reported by other studies [Zhang et al., 1996; Nehdi et al., 2003 and Ganesan et al.,
2008].
Loss on ignition (LOI) which represents the un-burnt carbon present in the sample is
one of the important parameters for assessing the quality of pozzolana. In the present
study, LOI of RHA sample is 2.27 percent. This value is much lower than the
maximum limit of 10 percent prescribed for Class N pozzolan [ASTM C 618]. It is
observed that the total oxide content, including silica, alumina, and iron, is 91 percent.
Sodium oxide is present in 2.09 percent. Alkalies in RHA are permanently bound in
the structure and therefore do not leach out and are not available for alkali silica
reaction [Mehta and Folliard, 1995 and Hwang and Chandra, 1997].
6.2.4 Chemical Admixture
Due to the porous nature of RHA, there will be a considerable reduction in the
workability of the mixes. Therefore, super-plasticizer was used as water reducing
111
agents to maintain required/comparable workability. Super-plasticizer based on
second generation of poly carboxylic ether polymers, developed using nano
technology was used for the mortar and concrete mixtures as high range water
reducing agents. It is a light brown free flowing liquid solution containing not less
than 30 percent solids by weight.
6.2.5 Mixing Water
Ordinary potable water available in Pondicherry Engineering College (PEC) campus
was used for the entire experimental investigation including curing of specimens.
6.3 RICE HUSK ASH MORTAR
6.3.1 Consistency and Setting Time of RHA- OPC Blends
Standard consistency of RHA blended cement samples was determined in accordance
with IS: 4031 (Part 4)-1995 with RHA content varied from 10 percent to 30 percent
by weight. Pastes having standard consistency were used to determine the initial
setting time and final setting time in accordance with IS: 4031 (Part 5) -1995. It was
observed that the consistency values of RHA blends varied from 31 percent to 42
percent. The initial and final setting times of RHA blends varied from 125 to 110
minutes and 185 to 162 minutes respectively. Fig.6.2 indicates that the increase in
RHA content causes the increase in water requirement for standard consistency. Due
to high specific surface area and hygroscopic nature of RHA, it absorbs more water
[Ganesan et al., 2008 and Hwang and Chandra, 1997].
Fig. 6.3 shows the setting time of cement paste with RHA in various percentage of
replacement. RHA addition tends to increase the initial setting time of cement. The
rate of increase in initial setting time varies depending upon the addition rate of RHA.
The rate of increase increases with RHA replacement up to 20 percent and then it

112
decreases. But, according to Ganesan et al. (2008), the decrease was beyond 15
percent RHA addition. Unlike other pozzolanic materials, RHA tends to shorten the
final setting time. The rate of retardation of final setting time decreases continuously
with increase in RHA content up to 30 percent. This may be due to the water
adsorption ability of the cellular form of rice husk ash and hence, the surrounding
water-to-cement ratio is reduced. Similar observations were made by Hwang and
Chandra (1997).
6.3.2 Hydration Mechanism of RHA Mortar
To study the hydration mechanism of RHA with cement, standard cement mortar
cubes and RHA-cement mortar cubes were prepared by partially replacing 10 percent
(mass) of cement by RHA. Water-binder ratio was maintained constant for all the
mixtures by introducing water reducing agents. Addition of RHA increased the water
demand of mortar and hence super-plasticizer (SP) was added. The dosage of super-
plasticizer was 0.75 percent by weight of cementitious materials.
Reference mortar cubes and OPC-RHA mortar cubes of specimen size 70.6mm were
prepared with 1:3 mix proportions using 53 grade OPC cement as per IS: 4031 part 6
(1998). Initially, RHA and standard sand were mixed thoroughly for 2 minutes and
then mixed with cement thoroughly till homogeneous mixture obtained. Totally 30
specimens were prepared to study the hydration mechanism of RHA in mortar. Soon
after the preparation of mortar specimens, they were covered by wet gunny bags in
order to avoid desiccation, for the initial period of 24 hours. After 24 hours, the
specimens are de-moulded and transferred to water for curing under laboratory
conditions. Compressive strength of the mortar cubes was determined at 1, 3, 7, 28
113
and 60 days, using three test specimens per age. Lumps of crushed specimens were
examined at appropriate ages under SEM.
Variation of compressive strength with age has been presented in Fig.6.4. In attaining
strength levels, RHA mortar cubes shows higher compressive strength than that of
reference mix at all ages. Maximum percentage of increase in strength was about 24
percent at the age of 60 days.
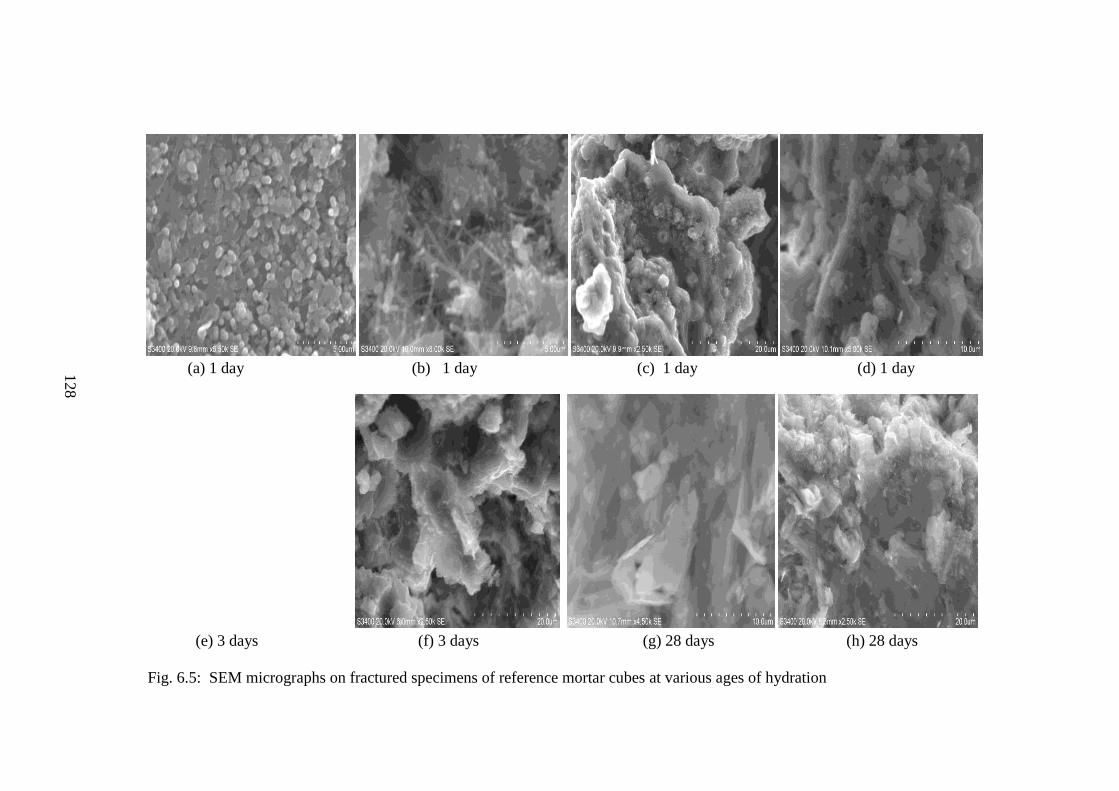
Figs.6.5 & 6.6 shows SEM micrographs taken on fractured specimen of reference
mortar cubes and OPC-RHA blend cubes at various ages of hydration. Calcium
silicate hydrates crystals with fibrous morphology and poorly crystalline is clearly
identified from Fig.6.5 (a). Fig.6.5 (b) shows the presence of small fibrous crystals of
calcium silicate hydrates, thin hexagonal crystals of mono sulphate hydrate and needle
shaped crystals of calcium sulpho aluminate hydrate (ettringite) in the control mix.
Appearance of massive crystals of calcium hydroxide can be noticed from the Fig.6.5
(e). Even at 28 days of hydration, appearance of calcium hydroxide crystals in the
OPC hydration system is recognized from Fig. 6.5 (h). In RHA mortar, C-S-H gel
was in the form of dense sponge matrix (Fig.6.6 (a)). Close scrutiny reveals small
protuberances on the gel matrix. It looks like bundle of fibres interlocked and have
flower ends (Fig.6.6 (b). Large prismatic crystals of calcium hydroxide were seen.
Irregular particles of RHA were also seen (Fig.6.6 (c)). After three days of hydration,
fibers of CSH gel grow in size and occupy the voids (Fig.6.6 (e) & (f)). This is also
confirmed by SEM-EDXA analysis (Fig.6.7). Some hexagonal plates similar to mono
sulpho aluminate were also observed on three days of hydration. After 28 days of
hydration (Fig.6.6 (h)), small fibrous crystals of calcium silicate hydrates are seen
predominantly. The matrix becomes denser. The presence of calcium hydroxide

114
becomes unclear. SEM-EDXA analysis (Figs.6.8 & 6.9) specified the formation of
relatively denser hydrated products in the OPC-RHA system with probably a few
calcium hydroxide cubical crystals.
6.4 RHA BLENDED CONCRETE
6.4.1 General
Compressive strength is the most important mechanical property of concrete. In
general, for a given set of cement and aggregates and under the same mixing, curing,
and testing conditions, the compressive strength of a concrete primarily depends on
water binder (w/b) ratio, binder/aggregate ratio, mixture composition, degree of
consolidation, etc. However, it is the w/b ratio that chiefly controls the development
of compressive strength in concrete. The limits of w/b ratio to achieve a targeted
compressive strength in high-strength HPC are as follows: [Lessard et al., 1995]
50 MPa – 75 MPa, for 0.30≤ w/b≤ 0.40
75 MPa – 100 MPa, for 0.25 ≤ w/b ≤ 0.35
100 MPa – 125 MPa, for 0.20 ≤ w/b ≤ 0.30
125 MPa and above, for w/b ≤ 0.20
6.4.2 Mix Proportions Selected
Four concrete mixtures have been considered in the present study. They are
designated as C550, C500, C450, and C350. C550 indicates that the cement content in the
mixture is 550 kg/m3. The four mixtures were proportioned with suitable quantity of
fine and coarse aggregates and water cement ratio such that the slump of concrete was
aimed at 75 to 100 mm. RHA has been added to the concrete mixtures in partial
replacement of cement by 10, 15, 20 and 30 percentage on weight basis. The mixture
details are presented in Table 6.4. Totally 19 concrete mixtures including control

115
mixtures are considered in the work. The super-plasticizers dosage is tailored in each
mixture to achieve a slump of 75 to 100 mm. The slump details are also presented in
Table 6.4.
6.4.3 Casting of Specimens
A laboratory type concrete pan mixture of 55 litre capacity was employed to prepare
concrete mixtures. Initially the dry ingredients were mixed for 2 minutes to ensure
homogeneity and then mixed for 3 minutes after adding water. Slump of concrete was
determined immediately following the mixing. Cubes of 100 mm size were cast and
compacted in two layers using vibrating table. The moulds were covered, after casting
with wet gunny bags for 24 hours. Thereupon, the specimens were de-moulded and
cured in water at a temperature of 20°C until the day of testing. Totally 228 specimens
were prepared to study the compressive strength. Compressive strength of the
concrete specimens was determined at 3, 7, 28, and 60 days using three test specimens
per age.
6.5 TESTS CONDUCTED
6.5.1 Compatibility Test
Chemical admixtures, especially super-plasticizers have become essential components
of high performance and high strength concretes. There are guidelines available to use
chemical admixtures on concrete. However, these guidelines are for general purpose
applications only. When it becomes the need for maximum exploitation of a chemical,
it needs to be done carefully and cautiously without causing any adverse behavior on
concrete.
In this study, compatibility tests were conducted by means of a marsh cone with
dimensions as shown in Fig.6.10 (a) and Photo 6.10 (b). This is an approach similar to

116
the flow cone tests in the ASTM C 939 and a recent AFREM recommendation. It
consists of an inverted hollow metal cone with small opening of 12.5 mm at the
bottom. The test was conducted using the following procedure:
A marsh cone was attached to a wall using the clamp so that the small
orifice was pointing down and a graduated glass cylinder was placed
under the cone.
Closing the small orifice with the finger, 1000 ml of cement paste was
poured into the cone.
The orifice was opened and the stop watch was started.
The time taken for 200 ml to flow through it is determined.
The same procedure is repeated for various dosages of super
plasticizers level.
The fluidity and the saturation dosage for a particular cement-super plasticizer
combination are determined by generating a flow curve. The variation of time of flow
with SP dosage is shown in Fig. 6.11. The plot reflects the decrease in the flow time
(or the increase in fluidity) due to the incorporation of SP until the saturation dosage,
beyond which the fluidity does not increase significantly. Optimum dosage of super
plasticizer used in this study as determined by the flow curve is 2.5 percent.
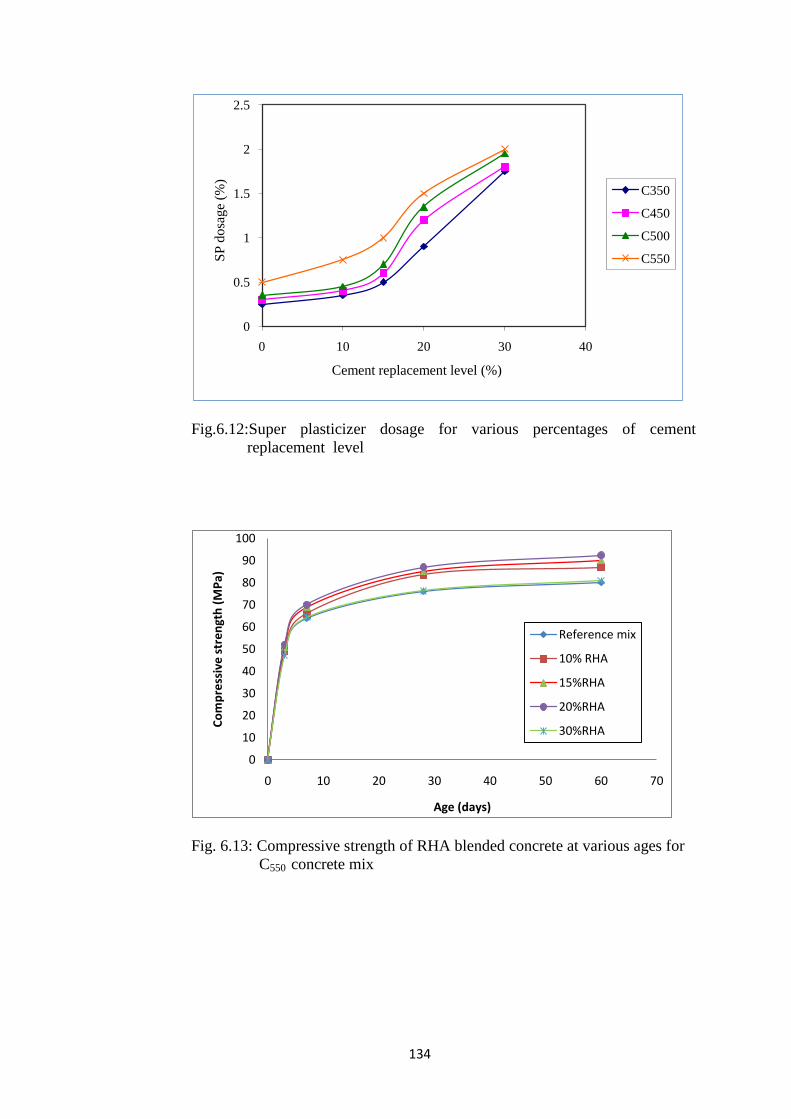
6.5.2 Workability
It is the property of freshly mixed concrete that determines the ease with which it can
be properly mixed, placed, consolidated, and finished without segregation. Slump was
used as a measurement of workability. Slump was measured as per IS: 1199 (1989).
The slump was maintained between 75 to 100 mm by varying the dosage of the super
plasticizer for all mixes. The dosages of super plasticizer for different mixes to have

117
desired slump range are shown in Fig. 6.12. All investigated mixtures had targeted
slump values. Higher the RHA content, higher will be the SP dosage. The maximum
dosage of SP was 11.00 lit/m3 for mix C550-30. RHA being very fine material
demanded more SP dosage to maintain comparable workability. Increased surface
area necessitated the use of higher dosage of SP to achieve targeted range of
workability. This behaviour goes well with the findings of Bui et al, (2005).
6.5.3 Compressive Strength
Compressive strength was determined at the ages of 3, 7, 28, and 60 days. At the
appropriate ages the specimens were recovered from water curing. Surface water was
wiped off, and then tested for compressive strength in accordance with IS: 516 (1959)
using 3000 kN compressive testing machine. The compressive strength for various
mixes is presented in Tables 6.5 to 6.8 and Figs. 6.13 to 6.16.
RHA addition has contributed to strength improvement of concrete at all ages.
However, with the amount of cement replacement up to 20 percent with RHA,
strength gain goes up and beyond this level of RHA addition, the strength gain
decreases. Investigation has been carried out in the range of 0 to 30 percent of cement
replacement. At 30 percent RHA addition, compressive strength of RHA concrete
attains values equivalent to that of control concrete mixtures. From the results, it is
inferred that 20 percent RHA addition contributes to maximum strength in all the
mixtures. The above behaviour is independent of the age of curing and water binder
ratio. From the study, it is noticed that cement content of the concrete mixture has
some impact on the compressive strength of RHA-concrete. The maximum
compressive strength attained is 92MPa for the C550 concrete mix with 20 percent

118
RHA replacement. It appears that higher the cement content higher will be the
compressive strength, however it needs further investigation for confirmation.
Increase in compressive strength of RHA concrete mixtures for various cement
replacement levels at various ages are depicted in Figs.6.17 & 6.18. Percentage of
increase in compressive strength increases with increase in RHA content up to 20
percent and beyond this level of RHA addition; it gets decreased drastically for all
mixtures. C500 and C350 concrete mixes has the highest and the lowest percentage of
increase in compressive strength respectively. The corresponding values are 25
percent and 5 percent. It reveals that 20 percent RHA addition is the optimum for the
maximum contribution to the compressive strength of RHA concrete.
Variation of compressive strength of RHA concretes with respect to cement
replacement levels are shown in Figs.6.19 to 6.21. Rate of increase in compressive
strength remains fairly uniform up to 10 percent RHA addition level. Between 10 and
20 percent level, rate of increase in compressive strength increases with increase in
RHA content. The highest increase in compressive strength is found at 20 percent
RHA addition level for all investigated mixtures. Beyond 20 percent level, there is a
steep decrease in the rate of increase in compressive strength of RHA concrete
mixtures.
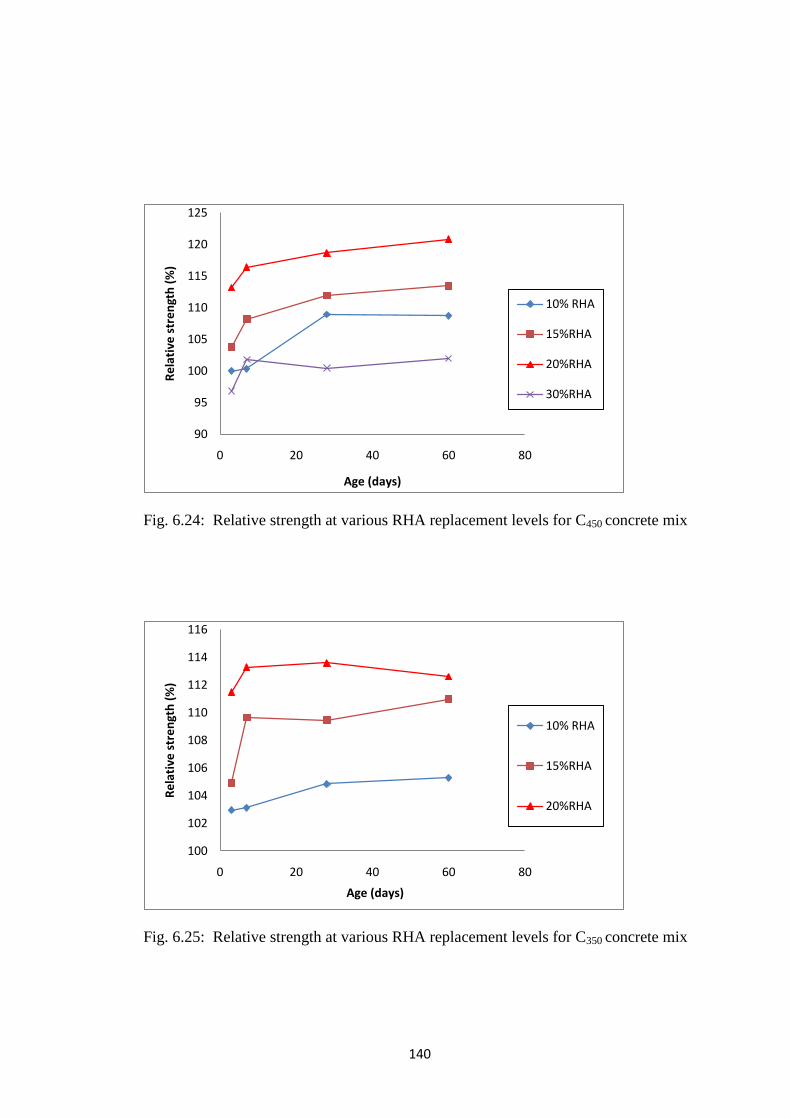
The relative strength of RHA blended concrete for various mixes is shown in Figs.
6.20 to 6.23. Relative strength is defined as the ratio of compressive strength of RHA
blended concrete to the strength of plain cement concrete with the same binder
content and cured to the same age. Relative strength is found to increase with the
amount of RHA addition up to 20 percent for all the mixes and is found to be more
than 100 percent. At 30 percent RHA addition level, relative strength decreases

119
drastically and it is almost equal to 100 percent. It is noticed that with respect to age,
the relative strength increases with increase up to 28 days and remains fairly uniform
or slightly increases at later age of 60 days. The maximum value of relative strength
attained is 125 percent. This is probably due to the fact that during this period
pozzolanic reaction is active.
It was reported that the compressive strength of concrete containing up to 30 percent
RHA was higher than that of control concrete [Zhang and Malhotra, 1996;
Bhanumathidas and Mehta, 2004]. The amorphous silica and high specific surface
area of RHA are the principle reasons for the excellent pozzolanic activity and
increase in compressive strength of concrete.
6.6 SUMMARY
In this chapter, comprehensive experimental investigations on the effect of RHA on
OPC hydration system were carried out. RHA addition tends to retard the initial
setting and accelerate the final setting. Compressive strength of mortar cubes blended
with RHA was higher than that of reference mix at all ages. Microscopic studies
confirm the formation of relatively denser hydrated products of C-S-H in OPC-RHA
hydration mechanism. The strength characteristics of RHA blended concretes were
also investigated. It was observed that RHA contribute much to the strength gain in
concrete. Compressive strength of reference concrete mixtures varies from 49 to 80
MPa. Whereas, compressive strength of RHA concrete mixtures varies from 55 to 92
MPa.
The results obtained have indicated that 20 percent RHA addition is optimum, since
the maximum strength is achieved at that level. The maximum percentage of relative
strength achieved in RHA concrete is 125 percent. However, at 30 percent

120
replacement, comparable/equivalent strength with respect to the reference mixture is
achieved. Though in the present study, RHA was not replaced beyond 30 percent,
from the overall behaviour and trend of strength gain, addition of RHA beyond 30
percent could not be beneficial. Further, the SP requirement beyond 30 percent RHA
addition may be increased significantly, which may result in high cost.

121
Table 6.1: Physical properties of cement
S.No Properties 53 Grade OPC Recommended as
per IS:12269
1 Standard consistency (%) 29.0 -
2 Initial setting time, minutes 105 30 (min)
3 Final setting time, minutes 145 600 (max)
4 Specific gravity 3.10 -
5
Compressive strength (MPa)
3days
7days
28days
28.03
40.65
56.75
27 (min)
37 (min)
53 (min
Table 6.2: Properties of aggregates
Sieve size(mm)
Cumulative percentage retained (%)
Coarse aggregate Fine aggregate
20 mm 54.1 -
16 mm 81.2 -
12.5 mm 96.6 -
10 mm 99.5 -
4.75 mm 99.99 0.5
2.36 mm - 1.6
1.18 mm - 22.5
600 µm - 63.3
300 µm - 77.5
150 µm - 98.4
Fineness modulus 9.31 2.62
Water absorption (%) 0.40 0.50
Specific gravity 2.74 2.63
Rodded density (g/cc) 1.74 1.62

122
Table 6.3: Physical properties and chemical composition of RHA
Properties RHA
Physical properties
Specific gravity
Fineness passing 45μm (%)
Blaine’s fineness (cm2/g)
BET surface area (m2/g)
Colour
Constituents by weight (%)
Silicon dioxide (SiO2)
Ferric oxide (Fe2O3)
Calcium oxide (CaO)
Aluminum oxide (Al2O3)
Magnesium oxide (MgO)
Sulphur oxide (SO3)
Sodium oxide (Na2O)
Potassium oxide (K2O)
Loss on ignition
2.19
99.50
22, 260
50.20
White
89.47
0.62
2.69
Traces
1.16
0.93
2.09
0.83
2.27
Table 6.4: Mix proportions and slump of the various concrete mixtures
Mix
designation
Cement
(kg/m3)
RHA
(kg/m3)
Sand
(kg/m3)
Coarse
aggregate
(kg/m3)
Water
(lit/m3)
SP*
(lit/m3)
w/b**
Slump
(mm)
C550-0
C550-10
C550-15
C550-20
C550-30
550
495
467
445
385
0
55
83
105
165
490
490
490
490
490
1200
1200
1200
1200
1200
165
165
165
165
165
2.75
4.12
5.50
8.25
11.00
0.30
0.30
0.30
0.30
0.30
100
80
90
85
80
C500-0
C500-10
C500-15
C500-20
C500-30
500
450
425
400
350
0
50
75
100
150
510
510
510
510
510
1240
1240
1240
1240
1240
165
165
165
165
165
1.75
2.25
3.50
6.75
9.75
0.33
0.33
0.33
0.33
0.33
75
100
80
90
85
C450-0
C450-10
C450-15
C450-20
C450-30
450
405
382
360
315
0
45
68
90
135
530
530
530
530
530
1280
1280
1280
1280
1280
162
162
162
162
162
1.35
1.80
2.70
5.40
8.10
0.36
0.36
0.36
0.36
0.36
100
90
100
80
85

123
C350-0
C350-10
C350-15
C350-20
350
315
297
280
0
35
53
70
560
560
560
560
1345
1345
1345
1345
154
154
154
154
0.87
1.22
1.75
3.15
0.44
0.44
0.44
0.44
90
100
75
75
SP* - Super-plasticizer
w/b**- Water-binder ratio
Table 6.5: Compressive strength and relative strength of concrete mix C350
Mix
designation
Compressive strength (MPa) at
various ages (days)
Relative strength (%) at various
ages (days)
3 7 28 60 3 7 28 60
C350-0 30.5 38.4 43.4 49.2 100 100 100 100
C350-10 31.4 39.6 45.5 51.8 103 103 105 106
C350-15 32.0 42.1 47.5 54.6 105 110 110 111
C350-20 34.0 43.5 49.3 55.4 111 113 114 112
Table 6.6: Compressive strength and relative strength of concrete mix C450
Mix
designation
Compressive strength (MPa) at
various ages (days)
Relative strength (%) at various
ages (days)
3 7 28 60 3 7 28 60
C450-0 53.2 61.1 67.3 72.0 100 100 100 100
C450-10 53.5 61.5 73.8 78.3 100 104 109 109
C450-15 55.6 66.4 75.6 81.7 103 108 112 113
C450-20 60.3 71.2 79.5 87.0 113 116 118 120
C450-30 51.3 62.1 67.3 73.4 97 102 101 102

124
Table 6.7: Compressive strength and relative strength of concrete mix C500
Mix
Designation
Compressive strength (MPa) at
various ages (days)
Relative strength (%) at various
ages (days)
3 7 28 60 3 7 28 60
C500-0 55.1 61.0 68.2 71.0 100 100 100 100
C500-10 57.4 63.8 72.0 78.0 104 105 106 108
C500-15 59.3 67.5 76.5 81.0 108 110 112 113
C500-20 61.7 72.0 85.0 88.6 113 116 125 122
C500-30 52.0 60.1 69.4 72.3 95 98 102 101
Table 6.8: Compressive strength and relative strength of concrete mix C550
Mix
Designation
Compressive strength (MPa) at
various ages (days)
Relative strength (%) at
various ages (days)
3 7 28 60 3 7 28 60
C550-0 48.1 64.0 76.0 80.0 100 100 100 100
C550-10 49.7 66.0 83.5 87.0 102 103 110 109
C550-15 51.0 69.0 85.0 90.1 106 108 112 113
C550-20 52.0 70.0 87.0 92.0 108 109 115 116
C550-30 47.1 64.5 76.4 81.0 98 101 100 101
125
Fig. 6.1 (a): Gradation curve for fine aggregate
Fig. 6.1(b): Gradation curve for coarse aggregate
0
20
40
60
80
100
120
0.1 1 10
Cu
mu
lati
ve p
assi
ng
(%)
IS sieve size (mm)
0
20
40
60
80
100
120
1 10 100
IS sieve size(mm)
Cu
mm
ula
tive
pa
ssin
g (
%)

126
Fig. 6.2: Standard consistency of RHA- OPC blends
Fig. 6.3: Initial and final setting time of RHA-OPC blends
0
5
10
15
20
25
30
35
40
45
0 5 10 15 20 25 30 35
Stan
dar
d c
on
sist
en
cy (
%)
Cement replacement level (%)
0
20
40
60
80
100
120
140
160
180
200
0 10 20 30
Sett
ing
tim
e (
min
ute
s)
Cement replacement level (%)
initial setting time
Final setting time

127
Fig. 6.4: Compressive strength of reference and RHA blended mortar specimens
0
10
20
30
40
50
60
70
80
0 10 20 30 40 50 60
Co
mp
ress
ive
str
en
gth
(M
Pa)
Age (days)
Reference mortar
10% RHA
(a) 1 day (b) 1 day (c) 1 day (d) 1 day
(e) 3 days (f) 3 days (g) 28 days (h) 28 days
Fig. 6.5: SEM micrographs on fractured specimens of reference mortar cubes at various ages of hydration
128

(a) 1 day (b) 1 day (c) 1 day (d) 1 day
(e) 3 days (f) 3 days (g) 28 days (h) 28 days
Fig. 6.6: SEM micrographs on fractured specimens of OPC-RHA blend cubes at various ages of hydration
129
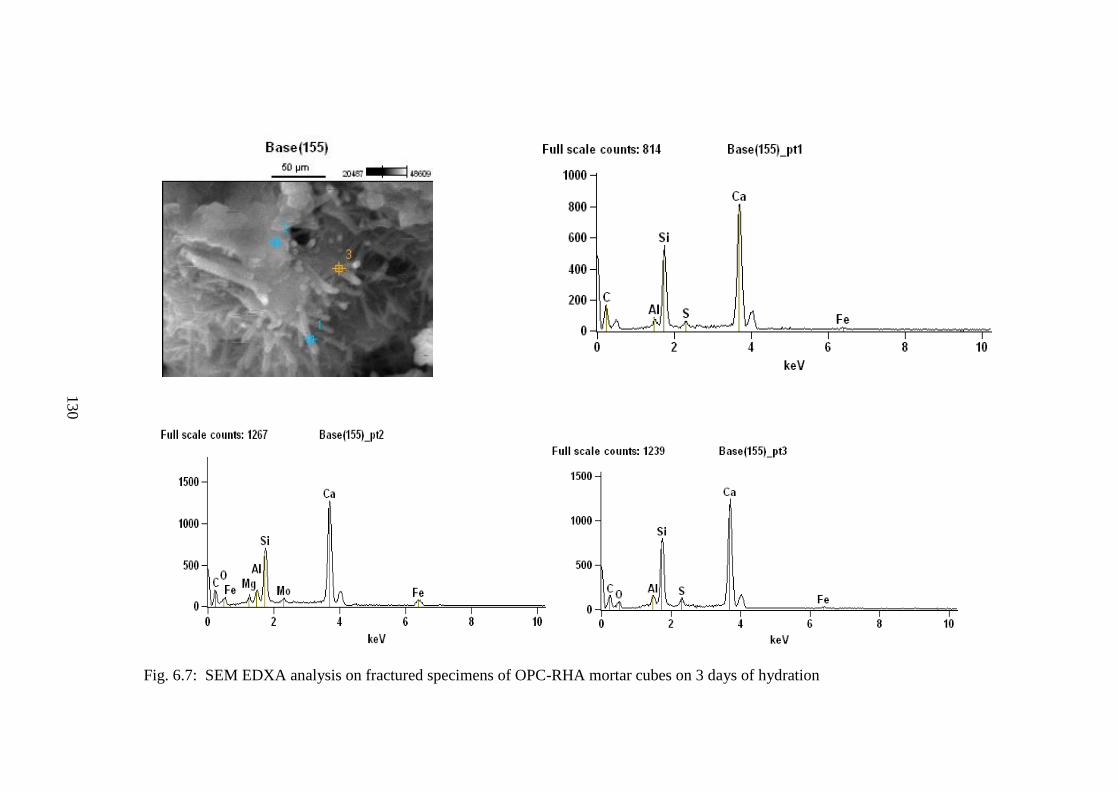
Fig. 6.7: SEM EDXA analysis on fractured specimens of OPC-RHA mortar cubes on 3 days of hydration
130

Fig. 6.8: SEM EDXA analysis on fractured specimens of reference mortar cubes on 28 days of hydration
131

Fig. 6.9: SEM EDXA analysis on fractured specimens of OPC-RHA mortar cubes on 28 days of hydration
132

133
Fig. 6.10: (a) Marsh cone details (b) Test set up photo
Fig.6.11: Marsh flow curve for various dosages of super plasticizer
0
2
4
6
8
10
12
0.5 1 1.5 2 2.5 3 3.5 4
Tim
e o
f fl
ow
(se
con
ds)
Dosage of SP (% wt of cement)
134
Fig.6.12:Super plasticizer dosage for various percentages of cement
replacement level
Fig. 6.13: Compressive strength of RHA blended concrete at various ages for
C550 concrete mix
0
0.5
1
1.5
2
2.5
0 10 20 30 40
SP
do
sag
e (%
)
Cement replacement level (%)
C350
C450
C500
C550
0
10
20
30
40
50
60
70
80
90
100
0 10 20 30 40 50 60 70
Co
mp
ress
ive
str
en
gth
(M
Pa)
Age (days)
Reference mix
10% RHA
15%RHA
20%RHA
30%RHA

135
Fig. 6.14: Compressive strength of RHA blended concrete at various ages for C500
concrete mix
Fig. 6.15: Compressive strength of RHA blended concrete at various ages for C450
concrete mix
0
10
20
30
40
50
60
70
80
90
100
0 10 20 30 40 50 60 70
Co
mp
ress
ive
str
en
gth
(M
Pa)
Age (days)
Reference mix
10% RHA
15%RHA
20%RHA
30%RHA
0
10
20
30
40
50
60
70
80
90
100
0 10 20 30 40 50 60 70
Co
mp
ress
ive
str
en
gth
(M
Pa)
Age (days)
Reference mix
10% RHA
15%RHA
20%RHA
30%RHA

136
Fig. 6.16: Compressive strength of RHA blended concrete at various ages for C350
concrete mix
Fig. 6.17: Increase in the compressive strength of RHA blended concrete mixtures for
various cement replacement levels
0
10
20
30
40
50
60
0 10 20 30 40 50 60 70
Co
mp
ress
ive
str
en
gth
(M
Pa)
Age (days)
Reference mix
10% RHA
15%RHA
20%RHA
0
5
10
15
20
25
30
0 5 10 15 20 25 30 35
Incr
eas
e in
str
en
gth
@2
8 d
ays
(%)
Cement replacement level (%)
C550
C500
C450
C350

137
Fig. 6.18: Increase in the compressive strength of RHA blended concrete mixtures for
various cement replacement levels
Fig. 6.19: Compressive strength of C550 concrete mix at cement replacement levels
0
5
10
15
20
25
0 10 20 30 40
Incr
eas
e in
str
en
gth
@6
0 d
ays
(%)
Cement replacement level (%)
C550
C500
C450
C350
0
10
20
30
40
50
60
70
80
90
100
0 5 10 15 20 25 30 35
Co
mp
ress
ive
str
en
gth
(M
Pa)
RHA content (%)
3 days 7 days
28 days 60 days

138
Fig. 6.20: Compressive strength of C500 concrete mix at cement replacement levels
Fig. 6.21: Compressive strength of C450 concrete mix at cement replacement levels
0
10
20
30
40
50
60
70
80
90
100
0 5 10 15 20 25 30 35
Co
mp
ress
ive
str
en
gth
(M
Pa)
RHA content (%)
3 days 7 days
28 days 60 days
40
45
50
55
60
65
70
75
80
85
90
0 5 10 15 20 25 30 35
Co
mp
ress
ive
str
en
gth
(M
Pa)
RHA content (%)
3 days 7 days
28 days 60 days

139
Fig. 6.22: Relative strength at various RHA replacement levels for C550 concrete mix
Fig. 6.23: Relative strength at various RHA replacement levels for C500 concrete mix
90
95
100
105
110
115
120
0 20 40 60 80
Re
lati
ve s
tre
ngt
h (
%)
Age (days)
10% RHA
15%RHA
20%RHA
30%RHA
90
95
100
105
110
115
120
125
130
0 20 40 60 80
Re
lati
ve s
tre
ngt
h (
%)
Age (days)
10% RHA
15%RHA
20%RHA
30%RHA
140
Fig. 6.24: Relative strength at various RHA replacement levels for C450 concrete mix
Fig. 6.25: Relative strength at various RHA replacement levels for C350 concrete mix
90
95
100
105
110
115
120
125
0 20 40 60 80
Re
lati
ve s
tre
ngt
h (
%)
Age (days)
10% RHA
15%RHA
20%RHA
30%RHA
100
102
104
106
108
110
112
114
116
0 20 40 60 80
Re
lati
ve s
tre
ngt
h (
%)
Age (days)
10% RHA
15%RHA
20%RHA