chapter 6 prediction of sunspot cycle...
TRANSCRIPT

218
CHAPTER 6
PREDICTION OF SUNSPOT CYCLE 24
Precursor techniques in particular those using geomagnetic indices often are
used in the prediction of the maximum amplitude for a sunspot cycle In this
chapter I predict the maximum amplitude and timing of the current sunspot
cycle 24 using precursor techniques I also predict the annual mean
geomagnetic activity for the solar maximum year for the current cycle 24
61 Sunspot cycle Prediction A brief overview
Solar outbursts cause inclement space weather that sometimes wrecks havoc
on technological systems on which our society is progressively more
dependent These outbursts involve the sudden release of energy that is
stored in stressed coronal magnetic fields They occur on a wide variety of
scales depending upon the available free magnetic energy which however is
drawn from sunspot magnetic fields Predictions of solar and geomagnetic
activities are important for various purposes including the operation of low-
earth orbiting satellites operation of power grids on Earth and satellite
communication systems Various techniques namely evenodd behavior
precursor spectral climatology and neural networks and flux transport
dynamo model have been used in the past for the prediction of the solar
activity Many researchers (Ohl 1966 Kane 1978 2007 Thompson 1993
Jain 1997 Hathaway and Wilson 2006) have used the bdquoprecursor‟ technique
to predict the solar activity Also the report entitled ldquoSolar Cycle 23 Project
Summary and Panel Findingsrdquo (Joselyn et al 1997) has mentioned precursor
techniques as being the most successful Jain (1997) used a bdquoprecursor‟
technique to predict the amplitude of the solar cycle 23 using the geomagnetic
activity aa index and predicted the maximum annual mean sunspot number
for cycle 23 to be 1662 which however was found to be higher than the
observed values of 120 Had he used an error estimate perhaps his forecast
would have been within the error limits The high level of geomagnetic activity
occurs not only at sunspot maximum but also in the following two to four
years thereby supporting the idea of the bdquoextended solar cycle‟ where a solar
219
cycle really begins some years before solar minimum and where two solar
cycles co-exist on the Sun for a number of years Wilson and Hathaway
(2008a 2008b) observed that the variation of the aa index usually peaks after
a sunspot maximum which appears to be directly related to increased solar
wind speed which probably is the result of high-speed streams from coronal
holes The prediction of maximum amplitude of a sunspot cycle using various
aspects of the aa index has been pursued for many years (since the 1960s)
by many authors For example Ohl (1966 1971) and Wilson (1990) showed
that the aa index values in the few years prior to a sunspot cycle minimum
can be used to gauge the size of the next unfolding sunspot cycle The level
of geomagnetic activity near the time of solar activity minimum has been
found to be a reliable indication of the amplitude of the following solar activity
maximum (Hathaway and Wilson 2006) In this view I was motivated to
predict the amplitude of the maximum annual mean sunspot number of solar
cycle 24 using the technique employed by Jain (1997) I also attempt to
predict the annual mean geomagnetic activity for the solar maximum year for
the current cycle 24
62 Data
To predict the amplitude of a solar cycle a few precursor techniques employ
geomagnetic activity indices viz Ap and aa I have employed the aa
geomagnetic index in the current investigation The details of the
observatories and instruments are given in section 26 and the data
acquisition has been described in section 37 Further the details of the data
acquisition related to yearly sunspot number are described in section 38 For
our current investigation I have used the data for the period January 1868 ndash
November 2008
63 Analysis and Results
631 Defining the Sunspot Minimum Year of Cycle 24
The trend of observed annual mean sunspot number and annual mean aa
index for the period 1868-1992 is shown in Figure 61 while for the period
1992-2008 is shown in Figure 62
220
Figure 61 The observed annual mean aa index (1868 to 2009) and annual mean sunspot number (1868 to 2010)
I observed from Figure 61 and 62 that the annual mean aa index
ranges from 9 nT in 1901 to 371 in 2003 which is an indicator of minimum
and maximum geomagnetic activity respectively during the period of 1868ndash
2008 Whereas the annual mean sunspot number varies between 14 in 1913
and 1902 in 1957 Sunspot numbers rise steadily to maximum and then fall
steadily to a low level during each sunspot cycle whereas geomagnetic
indices (Ap or aa) show two or more maxima per cycle one near or before the
sunspot maximum and others in the declining phase and the gap between
the two primary maxima (the Gnevyshev gap) results in the quasi-biennial and
quasi-triennial periodicities observed in the geomagnetic indices (Kane 1997)
In this investigation the year of the sunspot minimum of solar cycle 24 is of
greatest importance and thus at least its precise determination is explicitly
necessary According to ldquoThe Weeklyrdquo report by NOAASpace Weather
Prediction Center (available at
httpwwwswpcnoaagovweeklypdf2008prf1688pdf the first sunspot of
solar cycle 24 was observed on 4 January 2008 and it was numbered NOAA
AR 10981 Later NOAA AR 10990 and 10993 were observed in April and
221
May 2008 respectively and these have also been classified as sunspots of
cycle 24
Figure 62 The observed annual mean aa index and annual sunspot number for the period of 1992 ndash 2008 Note that the annual mean aa index for the period of 2004 ndash 2008 is 184
However in parallel and simultaneously sunspots of solar cycle 23 were also
been appearing near the equator until and even after mid 2008 Thus the
year 2008 is considered as the transition period from one cycle to the next
Monthly aa values for 2008 are identified at the website only for Januaryndash
November The aa value for December 2008 is estimated to be about 144
+minus 43 which is found close to the observed value 101 In this investigation
however I employ the 2008 aa to be about 146 and the average aa value for
the sunspot minimum year together with the preceding four years (2004 ndash
2008) is estimated to be about 184 The annual mean sunspot number for the
year 2008 is found to be 29 (lower than 75 in 2007) which is well within the
range of a typical sunspot minimum value (Dabas et al 2008) Therefore in
the current study I considered 2008 as the year of the sunspot minimum and
August 2008 as the month of the year of the sunspot minimum of solar cycle
24
222
632 Prediction of the Maximum Annual Mean Sunspot Number
Following to the method described by Jain (1997) I examined the level of
geomagnetic activity to predict the amplitude of solar cycle 24 The annual
mean sunspot number for the period 1868 ndash 2008 and the annual mean of
geomagnetic activity aa index for the period 1868 - 2008 are considered in
the present investigation I have determined (aan)dsc an average of the
geomagnetic aa index for the year of sunspot minimum and preceding four
years of the descending phase of the nth cycle (ie in total 5 years) and
compared with the observed maximum annual mean sunspot number
(Rn+1)max of the next (n+1)th cycle The variation of observed amplitude
(Rn+1)max for the (n+1)th cycle is plotted as a function of (aan
)dsc as shown in
Figure 63 I obtained the best linear fit to the data with the correlation
coefficient (r) of 089 Figure 63 demonstrates the validation of Ohl‟s
precursor method for deducing the size of maximum amplitude for a sunspot
cycle Ohl (1966) observed that the geomagnetic activity level during the
declining phase of a solar cycle was related to the maximum level of solar
activity of the next cycle
Figure 63 Plot of (Rn+1)max of the (n+1)th cycle as a function of (aan
)dsc The solid line is the best fit with a correlation coefficient of r=089
223
The linear equation derived from the fit of the data ranging for cycle 11
to 23 is of the following form
(Rn+1)max = 744 (aan
)dsc ndash 4412 (61)
Using equation (61) I predicted the maximum annual mean sunspot number
(Rn+1)max for cycles 12 to 24 using (aan
)dsc of the previous cycle The predicted
(open circle) and observed (triangle) maximum annual mean sunspot number
(Rn)max for cycle 12 to 23 as well as predicted value for cycle 24 are shown in
Figure 64 I found the amplitude of the predicted annual mean sunspot
number of cycle 24 to be 928 plusmn 196 (1-sigma accuracy) The maximum
amplitude of cycle 24 is estimated to be about 928 plusmn 355 (the 90 prediction
interval) This suggests that there is only a 5 chance that (R24)max is expected
to exceed 1283 or be below 573 unless cycle 24 proves to be a statistical
outlier My predicted amplitude of 928 plusmn 196 for cycle 24 is in agreement with
the predictions made by a few other investigators (Kane 1999 Wang et al
2002 de Meyer 2003 Sello 2003 Duhau 2003 Schatten 2005 Svalgaard
Cliver amp Kamide 2005 Xu et al 2008)
Figure 64 Variation of predicted (open circle) and observed (triangle) maximum annual mean sunspot number (Rn)
max as a function of sunspot cycle number (n) The predicted (Rn)
max are connected with dashed line
224
633 Prediction of the Ascending Period of Cycle 24
The ascent duration of a solar cycle is observed to be inversely correlated
with the maximum amplitude of a solar cycle Waldmeier (1935) showed that
there is an inverse correlation between the length of the ascending duration of
a solar cycle and the peak sunspot number of that cycle This phenomenon is
often called the ldquoWaldmeier effectrdquo To predict the ascending period for solar
cycle 24 I studied the relationship between the ascending period in months
(Pn)asc (often simply defined as the elapsed time in months from sunspot
minimum amplitude to sunspot maximum amplitude) and (Rnmax)
Figure 65 The ascending period (in months) (Pn)asc is plotted as a function of (Rn)
max for cycles 11 to 23 (Cycle 19 is omitted) The solid line is the best fit with r = - 086
In this investigation I have considered the ascending period in months for
cycles 11 to 23 however excluding cycle 19 to improve the correlation The
statistical relation between maximum annual mean sunspot number (Rnmax)
and the corresponding (Pn)asc for the cycle 11 to 23 is shown in Figure 65
This figure unambiguously shows that the (Pn)asc of a solar cycle decreases
with the increase in maximum annual mean sunspot number which is the
manifestation of ldquoWaldmeier effectrdquo Figure 65 is the best linear fit with a
225
negative correlation coefficient of ~ 086 and a standard error of estimate of 4
months Figure 65 gives a linear relationship which can be expressed in the
form of following relation
(Pn)asc= 6614 - 018 (Rn)max (62)
From equation (62) the (Pn)asc for cycle 11 to 23 is calculated Considering
(R24)max = 928 plusmn 196 (Section 632) in relation (62) suggests (Pn)asc= 50 plusmn 4
months with 1-sigma accuracy or 50 plusmn 8 months being the 90 prediction
interval Provided that minimum amplitude indeed occurred in August 2008
the maximum amplitude would be expected about October 2012 plusmn 8 months
inferring only a 5 chance that maximum amplitude for cycle 24 will occur
after June 2013 or before February 2012
634 Prediction of the annual mean geomagnetic activity for the solar
maximum year
Next in order to predict the level of geomagnetic activity for the sunspot
maximum year in cycle 24 I obtained aa which is the annual mean of aa
during the year when sunspot is maximum for each cycle 11-23 And then the
relation between the observed (Rn)max and aa is studied Figure 66
represents the relationship between (Rn)max and aa for a given cycle A linear
fit is obtained between the two with a correlation coefficient of ~ 085 which
can be expressed as
aa = 009(Rn)max + 134 (63)
Using the above relation I predicted aa for each cycle 11-23 which is in
good agreement (standard deviation between the observed and calculated
(predicted value is 203) with the observations Considering the predicted
amplitude of cycle 24 to be 928 plusmn 196 (cf section 632) enabled me to
estimate the aa during the sunspot maximum year for cycle 24 to be 215 plusmn
38 This predicted value of aa is lower relative to the observed 31 (in 1989)
and 254 (in 2000) for cycle 22 and 23 respectively This depicts the
decreasing trend of geomagnetic activity during the sunspot maximum year of
the upcoming cycle 24 as compared to previous two cycles
226
Figure 66 Representation of observed values of aa as a function of (Rn)
max of the same cycle Correlation coefficient is 085
64 Discussion and Conclusion
In the current investigation I have used the long term data of sunspot
numbers and aa indices from year 1868 to 2008 to predict the amplitude of
sunspot cycle 24 employing the bdquoprecursor technique‟ of Jain (1997)
However the prediction by Jain (1997) for cycle 23 was not accompanied by
error estimates Further the linear relation derived by him (Equation (1) in his
paper) to predict the sunspot amplitude for cycle 23 requires modification For
example if relation (61) is used to predict the amplitude of cycle 23 then
(R23)max = 1386 with error estimates plusmn196 ( Figure 64) which is closer to the
observed 120 This suggests that the precursor technique employed by Jain
(1997) is successful if the current linear relation with error estimates is
considered
In the present investigation I have predicted the maximum amplitude
of cycle 24 considering the error estimates I predict the maximum amplitude
for cycle 24 to be 928plusmn196 (1-sigma accuracy) which is expected to peak in
227
October 2012 plusmn 4 months (1-sigma accuracy) My results suggest that cycle
24 will be about 40 41 and 22 weaker than cycle 21 22 and 23
respectively Further my prediction is found to be in agreement with the
predictions made by some investigators (Kane 1999 Wang et al 2002 de
Meyer 2003 Sello 2003 Duhau 2003 Schatten 2005 Svalgaard Cliver
and Kamide 2005 Xu et al 2008) but in disagreement with many others who
have predicted either an acute minimum or an extraordinarily high amplitude
of cycle 24 Recently Wilson and Hathaway (2009) have published a
technical report (NASATP-2009-215687 February 2009) which appears on
the website httpsolarsciencemsfcnasagovpapersshtml They have
identified 11 statistically important single-variate fits and 22 statistically
important bi-variate fits for estimating the size of the sunspot maximum
amplitude applying the fits to cycle 24 The weighted mean prediction of 11
statistically important single-variate fits is 116 plusmn 34 and that of 22 statistically
important bi-variate fits is 112 plusmn 32 Both predictions appear to be on higher
side than our prediction Many investigators have used different ldquoprecursor
techniquesrdquo and their predictions for the maximum amplitude for solar cycle
24 appear to be varying between 75 (Svalgaard Cliver and Kamide 2005)
and 190 (Li Gao and Su 2005) Further using the solar polar magnetic field
strength Svalgaard Cliver and Kamide (2005) have predicted that the
approaching cycle (~ 2011 maximum) will have a peak smoothed monthly
sunspot number of 75 plusmn 8 making it potentially the smallest cycle in the last
100 years According to Dikpati et al (2006) the upcoming cycle 24 will be
about 30-50 stronger (Rz = 155-180) using modified flux transport solar
dynamo model and the data of sunspot area Choudhuri et al (2007)
modelled the last few solar cycles by bdquofeeding‟ observational data of the Sun‟s
polar magnetic field into their solar dynamo model They predict that cycle 24
will be about 35 weaker than cycle 23 On the other hand Nandy Andreacutes
amp Petrus 2011) reported results from kinematic dynamo simulations which
demonstrate that a fast meridional flow in the first half of a cycle followed by
a slower flow in the second half reproduces both characteristics of the
minimum of sunspot cycle 23 Their model predicts that in general very deep
minimum of a solar cycle is associated with weak polar magnetic field which
perhaps explains the prolonged sunspot minimum in cycle 24
228
However I propose the following two hypotheses to explain the
expected low amplitude of cycle 24 First a given sunspot cycle is an
extended sunspot cycle composed of two sunspot cycles one main and the
second sympathetic The latter begins two-three years after the main cycle
and it produces a rather stronger geomagnetic activity While comparing the
geomagnetic activity during the descending phase of cycles 21 22 and 23 I
found that the aa index (aan)dsc was 2706 2456 and 184 respectively
indicating that the magnitude of the sympathetic cycle has been decreasing
since cycle 21 The weak geomagnetic activity during the descending phase
of solar cycle 23 is an indicator of low amplitude of solar cycle 24 My
estimate of aa during the sunspot maximum year for cycle 24 is 215 plusmn 38
This predicted value of aa is an indication of weak geomagnetic activity
relative to the observed 31(in 1989) and 254(in 2000) for cycle 22 and 23
respectively I propose that the sympathetic cycle plays an important role in
governing the amplitude length and activity of the next main cycle
My second hypothesis is based on long term periodicities of sunspots
over and above 11-year primary sunspot cycle The ~200-year periodicity
(Nordemann Rigozo and de Faria 2005 Ma and Vaquero 2009 and many
previous studies) is well known and we propose that the low amplitude in
cycle 24 may be an epoch of this periodicity which previously occurred in
1816 approximately 196 years ago However there might be other possible
mechanisms to switch over the Sun to lower amplitude of the solar activity
such as the Wolf ndash Gleissberg cycle which has a periodicity of about 80 ndash 100
years
Nevertheless currently the sunspots are not appearing with
faster speed and therefore many US based scientists are predicting the
sunspots hibernation However on the contrary to this statement I would like
to further emphasize in view of my validation of ldquoWaldmeier effectrdquo (cf Figure
65) that slow growth is another indication of cycle 24 to be a low-magnitude
cycle
229
CHAPTER 7
DISCUSSION AND FUTURE PROSPECTS
In this chapter I discuss the results obtained and present the international
scenario with future prospects
Discussion
In order to improve our current understanding on the solar activity and the
Sun-Earth connection in context to the solar eruptions and their impact on
Earth‟s environment I carried out the following investigations in this thesis
X-ray emission characteristics of solar flares (chapter 4)
Solar flare plasma characteristics in association to CMEs and SEPs
(chapter 5)
Prediction of solar activity using precursor technique (chapter 6)
X-ray emission characteristics of Solar Flares
In chapter 4 of this thesis I have investigated X-ray emission
characteristics of solar flares in detail employing observations from ldquoSolar X-
ray Spectrometer (SOXS)rdquo and ldquoReuven Ramaty High-Energy Solar
Spectroscopic Imager (RHESSI)rdquo missions In the analysis of solar flares
observed by SOXS and RHESSI simultaneously the spectra in the dynamic
range of about 41-24 keV (SOXS) and 13-100 keV RHESSI) were analyzed
using multi-thermal plus single power-law (SOXS) and isothermal plus single
power-law (RHESSI) I found that C ranges between 20-29 keV as
determined by fitting thick2 function to the HXR spectra for 6-January-2004
event The shift of C to higher energies is due to increasing contribution of
thermal Bremsstrahlung at higher temperature of the flare plasma Employing
RHESSI observations I estimated the thermal and non-thermal energies for
different flare intervals for two M class flares (6-January-2004 and 5-April-
2004) The investigation showed that the thermal and non-thermal energies
are of the same order of magnitude (~1028 -1029 erg) The integrated thermal
230
and non-thermal energies for these two flares range between (~1029 -1030
erg) The Enth Eth () ratio is observed to be 052 and 09 This result may be
inferred as conversion of non-thermal energy to hot flare plasma However
the thermal energy obtained from SOXS is about 1-2 orders of magnitude
higher than the non-thermal energies obtained from RHESSI This may be
due to the different energy ranges chosen for the two different instruments
and high value of the computed emission measure from SOXS observations
My result is in agreement to the following results Aschwanden (2007)
ignoring possible low-energy cutoff has found the thermal-non-thermal
crossover energy 18plusmn34 keV using the power law approximation of X-ray
emission However Sui et al (2005) found 242 keV as the low-energy cutoff
(Ec) to ensure that always thermal emission dominates over non-thermal
emission in low energy They estimated the non-thermal energy content in the
electrons of the order of 16 x 1030 ergs Saint and Benz (2005) considering
20 keV as the turnover energy which is perhaps the same as the break
energy (Eb) estimated the non-thermal energy to be 2 1030 ergs almost
the same value as Sui et al (2005) found for an M12 class flare However
the low-energy cutoff seems physically not realistic as such a configuration
leads to plasma instability Such instabilities have a growth rate typically of the
order of local plasma frequency ie orders of magnitude shorter than the
propagation time of the beam within the acceleration region Therefore the
turnover of break energy appears to be more physically realistic and needs to
be measured as precisely as possible
The correlation among the spectral parameters of the flare confirms the
general flare scenario of contribution of non-thermal flux in heating up the
plasma This study strongly supports the thermal and non-thermal relationship
which confirms the standard flare model For both the flares the temperature
reached 40-45 MK (super-hot component) during the rise phase
I also investigated the temporal evolution of conductive and radiative
power for 27-July-2005 and 5-April-2004 events The study suggests that
thermal conduction is a dominant during the rise phase which is more evident
from 5-April-2004 event This clearly indicates that in flare loops at higher
temperatures thermal conduction is a dominant mechanism during the rise
231
phase Both events also indicate that in post-flare loops (or decay phase)
radiative cooling is the dominant mechanism in thermal energy range
Flare-CME-SEP association
The flare-CME phenomena often occur in conjunction but the exact
nature of the flare-CME triggers and the relationship between the cause and
consequence is still open and quite puzzling (Jain et al 2010)
In chapter 5 I analyzed the HXR emission of the flare and CME
dynamics for 30 flare-CME pairs I conclude that the initial linear speed of the
coronal mass ejection right at the solar surface is strongly related (power-law
relationship with r=077 for all 30 flares and r=084 for 19 flares for which the
peak photon flux in 12-25 keV is lt11000 c (4s)-1) to the non-thermal spectral
characteristics however before-the-peak interval of the associated flare
event My results indicate that the flare and the associated CME are the two
components of one energy release system and perhaps occur together at the
time of impulsive acceleration Recent investigations regarding flare-CME
relationship have been carried out by Aarnio et al (2011) and Temmer et al
(2010) Comparing the X-ray flare fluxes with CME masses of 826 CMEflare
paired events Aarnio et al (2011) found that CME mass increases with flare
flux following an approximately log-linear broken relationship Recent
investigations by Temmer et al (2010) indicated a correlation between the
CME acceleration peak and the flare hard X-ray peak flux and suggested that
a large sample of events may be studied to arrive to a better conclusion They
further suggested a possible relationship between the spectral slope of the
HXR spectra and the CME acceleration However I studied in greater detail
the 30 solar flare events associated with CMEs in contrast to 3 events
investigated by Temmer et al (2010) and achieved a new significant result
that showing a good correlation between non-thermal hard X-ray spectral
index and CME linear velocity This new result rather strongly suggests that
flare and CME are the two phenomena that occur together as a consequence
of reconnection in the corona
As mentioned in section 512 the flare-SEP relationship has been
studied by many researchers Saldanha et al (2008) studied the progressive
232
spectral hardening in January 2005 solar flare events and confirmed that the
progressive spectral hardening in these flares are related to solar energetic
particle (SEP) events Grigis and Benz (2008) studied the spectral hardening
in large solar flares and proposed that the hardening during the decay phase
is caused by continuing particle acceleration with longer trapping in the
accelerator before escape Grayson et al (2009) studied 37 magnetically well-
connected flares (W30deg-W90deg) observed by RHESSI and found that 12 out of
18 flares with SHH behavior produced SEP events and none of 19 flares
without SHH behavior produced SEPs However all these studies are based
on temporal evolution of spectra while no study has been carried out in detail
to estimating the evolution of the spectral index (hardness parameter) over
time and its relation with spectral index of the associated SEP event
Therefore I studied hard X-ray spectra of the flares in greater detail in context
to their relationship with the SEPs I employed the RHESSI observations for
this investigation and the results are presented in Chapter 5
In chapter 5 I also investigated the flare-SEP relationship for 12 major
solar flares I obtained a correlationship of r=067 between hardest flare
spectral index and hardest proton spectral index for these events (neglecting
20-January-2005 event) The study shows a good relationship between the
hardness of the flare spectra seen on the Sun and the hardest proton spectra
observed at the earth My current result is new in contrast to previously known
for electrons as well as soft-hard-hard nature of X-ray spectra because it
suggests that proton (ions) acceleration is in simultaneous to electrons at the
same site and the source for SEP is in the solar corona
Krucker et al (2007) compared the hard X-ray (HXR) photon spectra
observed by the RHESSI with the spectra of the electrons in the associated
solar impulsive particle events and found that the HXR photon power-law
spectral index and the in situ observed electron spectral index measured
above 50 keV show a good linear fit (r= 083) for prompt events and a weak
correlation (r=043) for delayed events
My results are consistent with earlier studies (section 512)
suggesting that there exists a good relationship between solar flares and SEP
events It can be concluded from the investigations carried out in this chapter
233
that the flare CME and SEP events may be considered as a combined event
as regards to Sun-Earth connection
Prediction of Solar Activity
Owing to the space weather impact of solar eruptive phenomena I
have predicted the maximum amplitude of cycle 24 using the long term data
of sunspot numbers and aa indices from year 1868 to 2008 and employing the
bdquoprecursor technique‟ of Jain (1997) I predict the maximum amplitude for
cycle 24 to be 928plusmn196 (1-sigma accuracy) which is expected to peak in
October 2012 plusmn 4 months (1-sigma accuracy) My results suggest that cycle
24 will be about 40 41 and 22 weaker than cycle 21 22 and 23
respectively In their overall performance during the course of last few solar
cycles precursor methods have clearly been superior to extrapolation
methods (Petrovay 2010) He stated that the current cycle 24 will probably
mark the end of the Modern Maximum with the Sun switching to a state of
less strong activity and therefore it will be an important testbed for solar cycle
prediction methods for our understanding of the solar dynamo Many
investigators have used different ldquoprecursor techniquesrdquo and their predictions
for the maximum amplitude for solar cycle 24 appear to be varying between
75 (Svalgaard Cliver and Kamide 2005) and 190 (Li Gao and Su 2005)
I propose the following two hypotheses to explain the expected low
amplitude of cycle 24 First a given sunspot cycle is an extended sunspot
cycle composed of two sunspot cycles one main and the second
sympathetic The latter begins two-three years after the main cycle and it
produces a rather stronger geomagnetic activity While comparing the
geomagnetic activity during the descending phase of cycles 21 22 and 23 I
observed that the aa index (aan)dsc was 2706 2456 and 184 respectively
indicating that the magnitude of the sympathetic cycle has been decreasing
since cycle 21 The weak geomagnetic activity during the descending phase
of solar cycle 23 is an indicator of low amplitude of solar cycle 24 My
estimate of aa during the sunspot maximum year for cycle 24 is 215 plusmn 38
This predicted value of aa is an indication of weak geomagnetic activity
relative to the observed 31(in 1989) and 254 (in 2000) for cycle 22 and 23
234
respectively I propose that the sympathetic cycle plays an important role in
governing the amplitude length and activity of the next main cycle
My second hypothesis is based on long term periodicities of sunspots
over and above a 11-year primary sunspot cycle The ~200-year periodicity
(Nordemann Rigozo and de Faria 2005 Ma and Vaquero 2009 and many
previous studies) is well known and I propose that the low amplitude in cycle
24 may be an epoch of this periodicity which previously occurred in 1816
approximately 196 years ago I would like to mention that the prediction along
with the hypothesis has already been published (Bhatt et al 2009b) The
recently updated (4-April-2011) ldquoSolar Cycle 24 Predictionrdquo project Homepage
(NASA MSFC team) states that the current cycle 24 maybe the smallest
sunspot cycle in nearly 200 years which supports my hypothesis
Future Prospects
The solar eruptions such as flaresCMEsSEPs are the most powerful
explosions in the solar system and they endanger astronauts and spacecraft
These eruptions have a significant impact on the Earth‟s environment Owing
to this Sun-Earth connection they are of the utmost importance and of
scientific interest in order to understand this difficult process of connection
X-ray emission from solar flares can be studied with the instruments
such as SOXS and RHESSI However the nature of the flare emission below
10 keV is still not clear Thus it is extremely important to characterize the soft
X-ray emission below 10 keV This is possible with the development of high
spectral resolution instruments The development of high resolution
instruments can give precise information on the line emission and hence the
elemental abundance can be studied in greater detail
In recent years the flare- CME relationship is fairly better understood in
view that the both phenomena have comparable energy budgets and
impulsive acceleration phases However there are many unaddressed
questions viz origin and initiation of the CMEs in general and is it precursor or
a follow-up event with the associated flare event After about 100 years of
study of solar flaresSEPs we are not able to understand the physical process
that links these two phenomena and the location and time of the acceleration
235
of the particles Great efforts have been made to probe into these events in
recent years and as of now many questions remain unanswered such as
how is the energy built-up in the corona and by which mechanism does it
store the energy for a long time Further how all these eruptive phenomena
are suddenly released
I believe that in near future the advanced observations of these most
explosive solar events will be possible with the development of new and
highly sophisticated instrumentation Also they will allow accurate
measurements of weaker events in the light of increased sensitivity of the
instruments
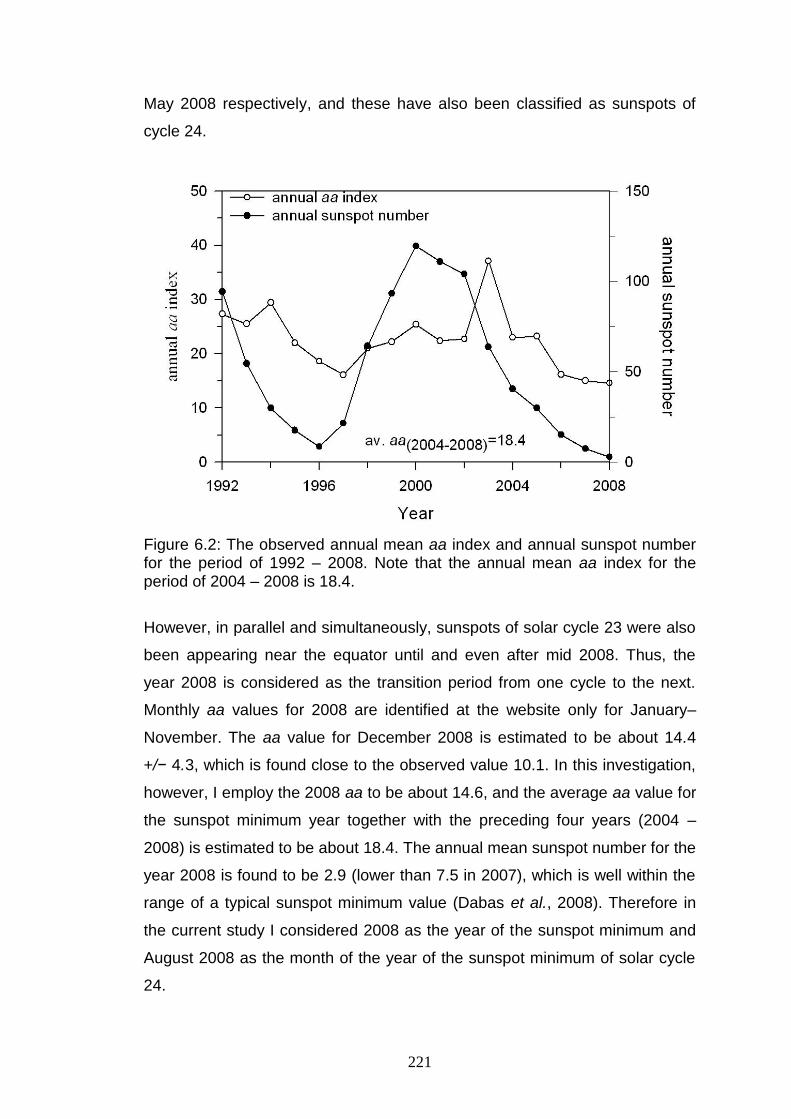
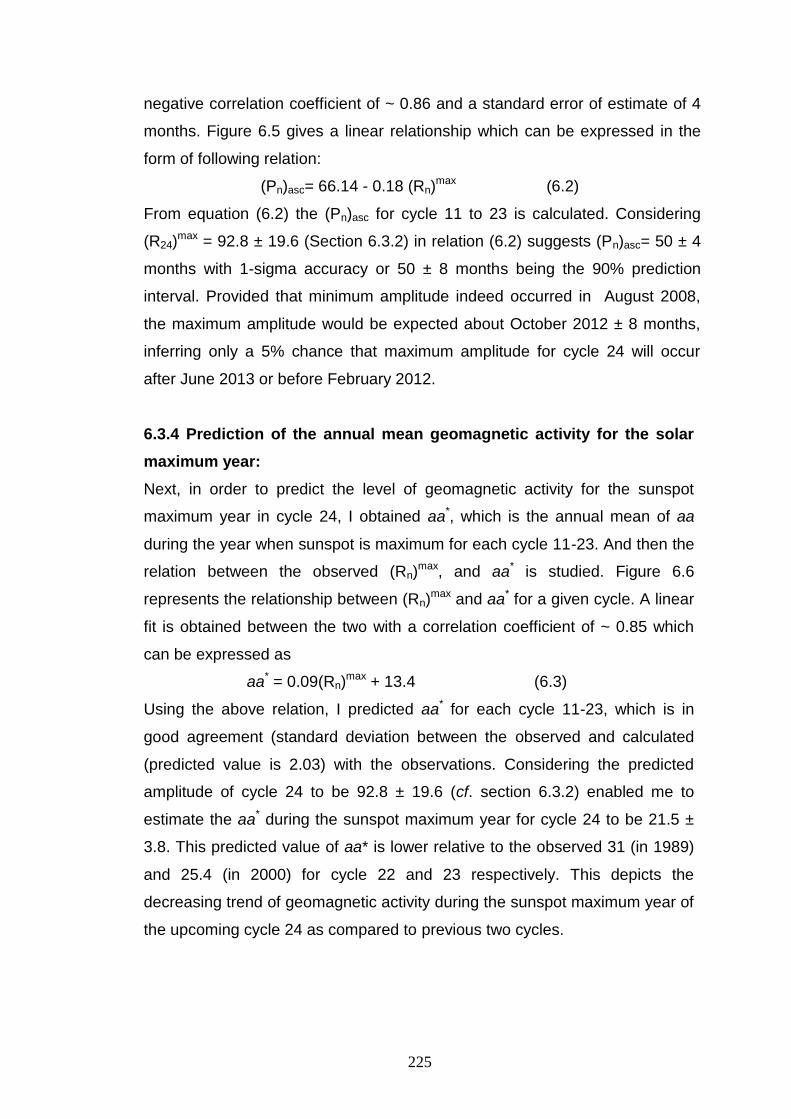