chapter 7 conclusions · 2006-07-25 · chapter 7 conclusions vincas p. steponaitis, jeffrey d....
TRANSCRIPT
Chapter 7
ConclusionsVincas P. Steponaitis, Jeffrey D. Irwin, and John J. W. Rogers
In the preceding chapters, we have laid out our research design, outlined the geology of our study area, described the quarries and artifacts on which our study is based, and presented three different approaches to characterizing the composition of our samples. It now remains to pull the various lines of evidence together in assigning the artifacts to geological sources and to discuss the methodological and archaeological conclusions that have emerged.
We begin by reviewing the results presented in each of the analytical chapters in turn. Then we synthesize these results and consider their implications.
Petrography
Stoddard’s petrographic study in Chapter 4 presents considerable information on the composition and character of the rocks in our sample. Through microscopic examination of thin sections, he identifies the larger mineral grains and also makes observations on textures and qualitative features that allow him to infer the processes by which the rocks were formed. He classifies the rocks based not only on mineralogy, but also on the major-element chemistry as determined by x-ray fluorescence.
Of the 12 quarry zones that were sampled, ten yielded relatively homogeneous rock assemblages, while the remaining two zones (Cumberland County and Chatham Siler City) produced assemblages that Stoddard describes as petrographically “heterogeneous.” Each of the zones, particularly the homogeneous ones, is marked by certain distinctive features that set it apart from the others (Table 7.1; also see Table 4.4). These features are well summarized in Chapter 4 and need not be repeated here. For present purposes, it is most useful to focus on certain general trends in the distribution of rock types and minerals across the study area, at least as represented in the zones that we studied.
Particularly striking are the petrographic distinctions between the southern and northern portions of the study area (Figure 7.1), roughly corresponding to the Uwharrie and Virgilina rock sequences described in Chapter 2. In the southern zones, from Asheboro southward, all our quarry samples were metavolcanic rocks. In the northern zones, from Chatham County northward, our quarries yielded a mixture of metavolcanic and metasedimentary rocks. To some extent, this distinction is a product of our sampling strategy, but not entirely so. The Uwharrie Mountains are peppered with well-known metavolcanic quarries that were heavily used by ancient peoples, and it was these quarries on which we focused in selecting samples. Metasedimentary rocks also outcrop in the Uwharries, but these are generally not associated with
98
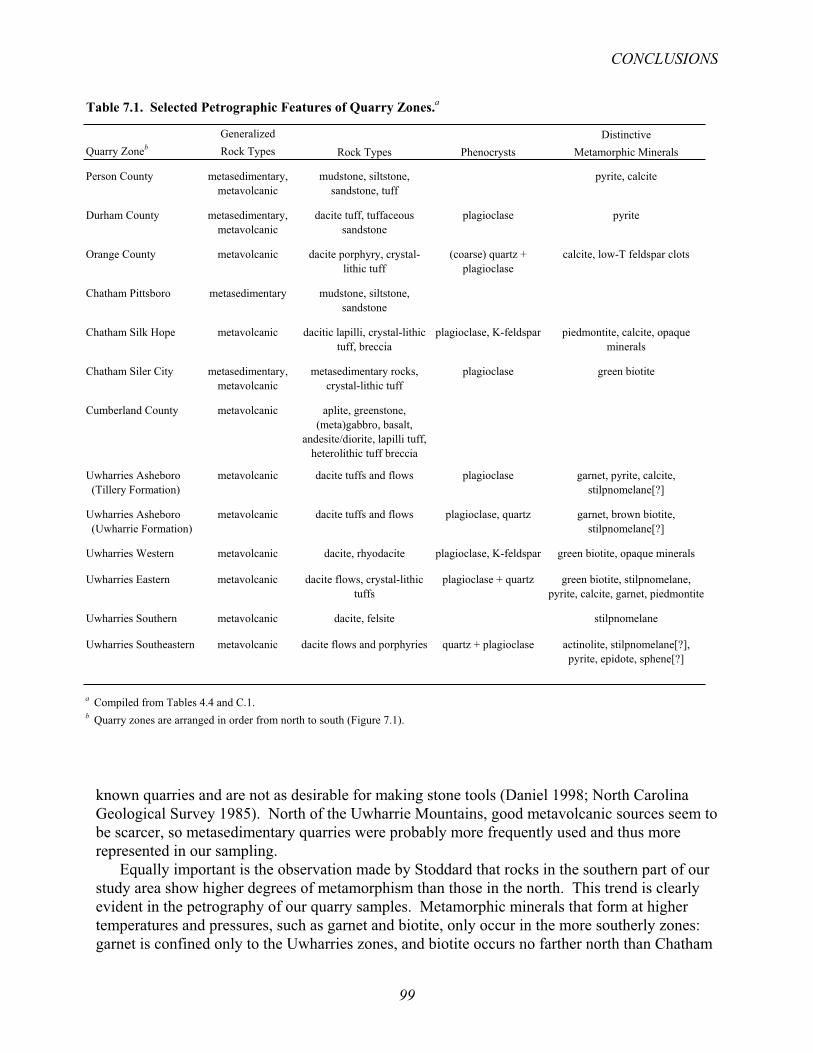
known quarries and are not as desirable for making stone tools (Daniel 1998; North Carolina Geological Survey 1985). North of the Uwharrie Mountains, good metavolcanic sources seem to be scarcer, so metasedimentary quarries were probably more frequently used and thus more represented in our sampling.
Equally important is the observation made by Stoddard that rocks in the southern part of our study area show higher degrees of metamorphism than those in the north. This trend is clearly evident in the petrography of our quarry samples. Metamorphic minerals that form at higher temperatures and pressures, such as garnet and biotite, only occur in the more southerly zones: garnet is confined only to the Uwharries zones, and biotite occurs no farther north than Chatham
Table 7.1. Selected Petrographic Features of Quarry Zones.a
Generalized DistinctiveQuarry Zoneb Rock Types Rock Types Phenocrysts Metamorphic Minerals
Person County metasedimentary, metavolcanic
mudstone, siltstone, sandstone, tuff
pyrite, calcite
Durham County metasedimentary, metavolcanic
dacite tuff, tuffaceous sandstone
plagioclase pyrite
Orange County metavolcanic dacite porphyry, crystal-lithic tuff
(coarse) quartz + plagioclase
calcite, low-T feldspar clots
Chatham Pittsboro metasedimentary mudstone, siltstone, sandstone
Chatham Silk Hope metavolcanic dacitic lapilli, crystal-lithic tuff, breccia
plagioclase, K-feldspar piedmontite, calcite, opaque minerals
Chatham Siler City metasedimentary, metavolcanic
metasedimentary rocks, crystal-lithic tuff
plagioclase green biotite
Cumberland County metavolcanic aplite, greenstone, (meta)gabbro, basalt,
andesite/diorite, lapilli tuff, heterolithic tuff breccia
Uwharries Asheboro (Tillery Formation)
metavolcanic dacite tuffs and flows plagioclase garnet, pyrite, calcite, stilpnomelane[?]
Uwharries Asheboro (Uwharrie Formation)
metavolcanic dacite tuffs and flows plagioclase, quartz garnet, brown biotite, stilpnomelane[?]
Uwharries Western metavolcanic dacite, rhyodacite plagioclase, K-feldspar green biotite, opaque minerals
Uwharries Eastern metavolcanic dacite flows, crystal-lithic tuffs
plagioclase + quartz green biotite, stilpnomelane, pyrite, calcite, garnet, piedmontite
Uwharries Southern metavolcanic dacite, felsite stilpnomelane
Uwharries Southeastern metavolcanic dacite flows and porphyries quartz + plagioclase actinolite, stilpnomelane[?], pyrite, epidote, sphene[?]
a Compiled from Tables 4.4 and C.1.b Quarry zones are arranged in order from north to south (Figure 7.1).
CONCLUSIONS
99
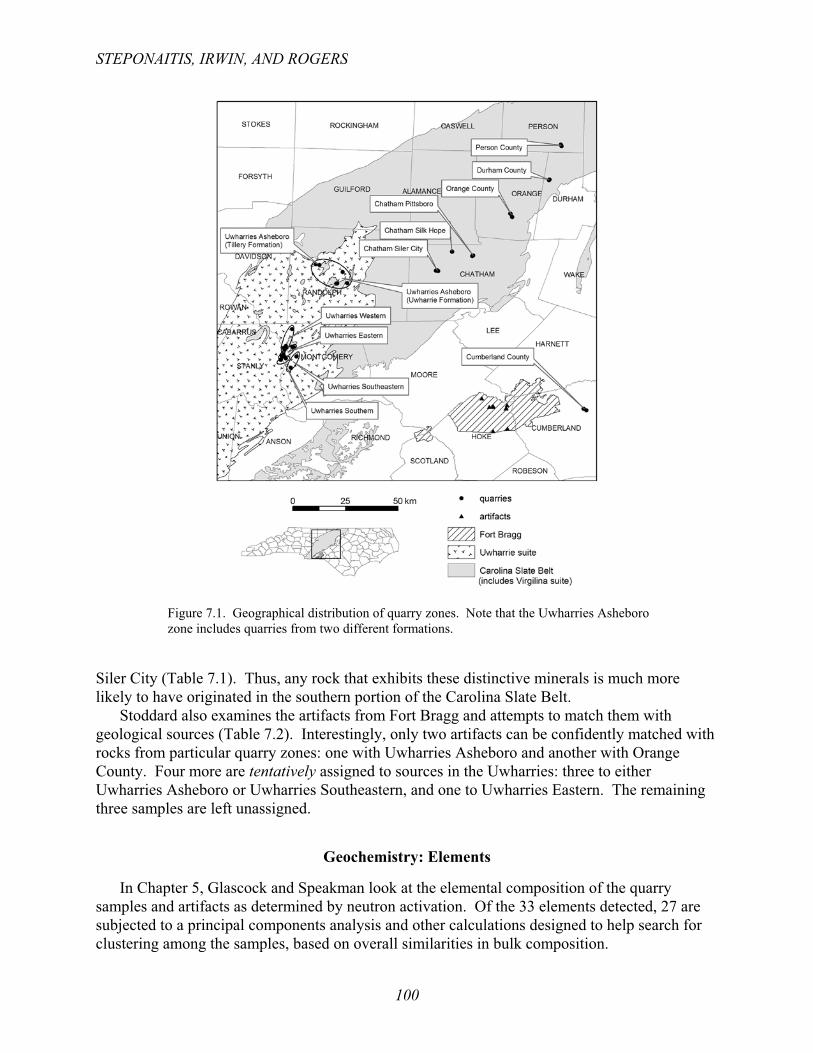
Figure 7.1. Geographical distribution of quarry zones. Note that the Uwharries Asheboro zone includes quarries from two different formations.
Siler City (Table 7.1). Thus, any rock that exhibits these distinctive minerals is much more likely to have originated in the southern portion of the Carolina Slate Belt.
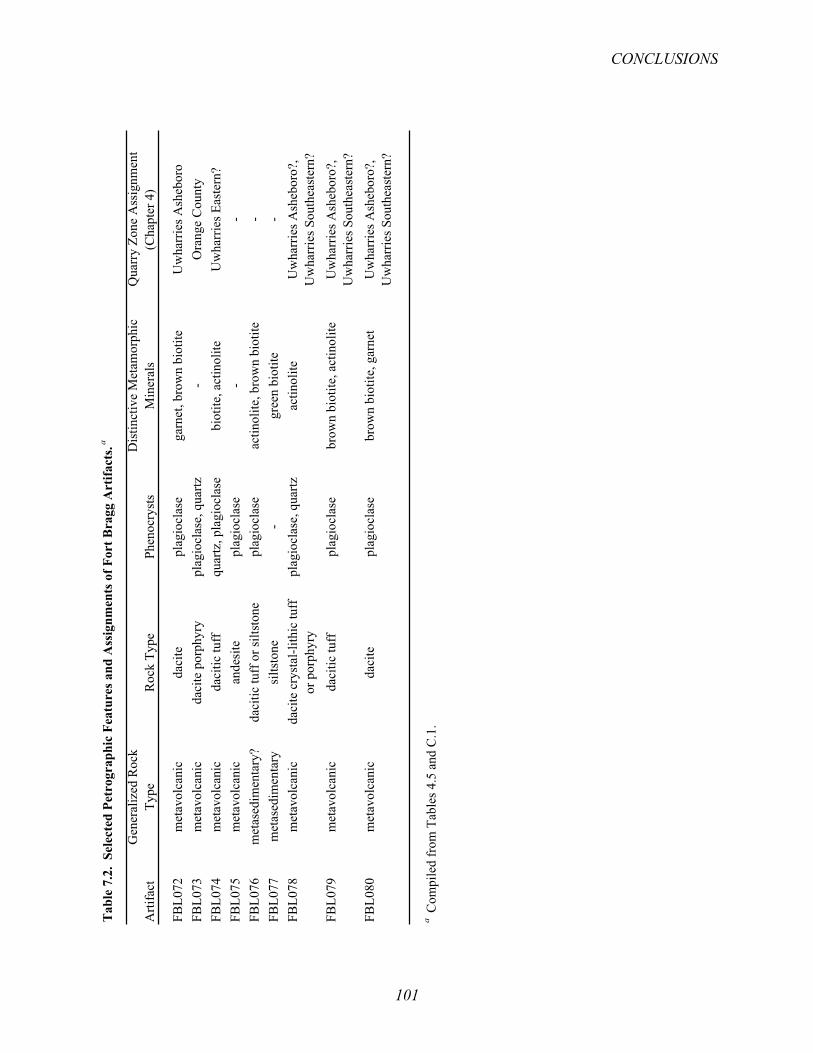
Stoddard also examines the artifacts from Fort Bragg and attempts to match them with geological sources (Table 7.2). Interestingly, only two artifacts can be confidently matched with rocks from particular quarry zones: one with Uwharries Asheboro and another with Orange County. Four more are tentatively assigned to sources in the Uwharries: three to either Uwharries Asheboro or Uwharries Southeastern, and one to Uwharries Eastern. The remaining three samples are left unassigned.
Geochemistry: Elements
In Chapter 5, Glascock and Speakman look at the elemental composition of the quarry samples and artifacts as determined by neutron activation. Of the 33 elements detected, 27 are subjected to a principal components analysis and other calculations designed to help search for clustering among the samples, based on overall similarities in bulk composition.
STEPONAITIS, IRWIN, AND ROGERS
100
Tab
le 7
.2.
Sele
cted
Pet
rogr
aphi
c Fe
atur
es a
nd A
ssig
nmen
ts o
f For
t Bra
gg A
rtifa
cts.a
Arti
fact
Gen
eral
ized
Roc
k Ty
peR
ock
Type
Phen
ocry
sts
Dis
tinct
ive
Met
amor
phic
M
iner
als
Qua
rry
Zone
Ass
ignm
ent
(Cha
pter
4)
FBL0
72m
etav
olca
nic
daci
tepl
agio
clas
ega
rnet
, bro
wn
biot
iteU
wha
rrie
s Ash
ebor
oFB
L073
met
avol
cani
cda
cite
por
phyr
ypl
agio
clas
e, q
uartz
-O
rang
e C
ount
yFB
L074
met
avol
cani
cda
citic
tuff
quar
tz, p
lagi
ocla
sebi
otite
, act
inol
iteU
wha
rrie
s Eas
tern
?FB
L075
met
avol
cani
can
desi
tepl
agio
clas
e-
-FB
L076
met
ased
imen
tary
?da
citic
tuff
or s
iltst
one
plag
iocl
ase
actin
olite
, bro
wn
biot
ite-
FBL0
77m
etas
edim
enta
rysi
ltsto
ne-
gree
n bi
otite
-FB
L078
met
avol
cani
cda
cite
cry
stal
-lith
ic tu
ff
or p
orph
yry
plag
iocl
ase,
qua
rtzac
tinol
iteU
wha
rrie
s Ash
ebor
o?,
Uw
harr
ies S
outh
east
ern?
FBL0
79m
etav
olca
nic
daci
tic tu
ffpl
agio
clas
ebr
own
biot
ite, a
ctin
olite
Uw
harr
ies A
sheb
oro?
,U
wha
rrie
s Sou
thea
ster
n?FB
L080
met
avol
cani
cda
cite
plag
iocl
ase
brow
n bi
otite
, gar
net
Uw
harr
ies A
sheb
oro?
,U
wha
rrie
s Sou
thea
ster
n?
a C
ompi
led
from
Tab
les 4
.5 a
nd C
.1.
CONCLUSIONS
101
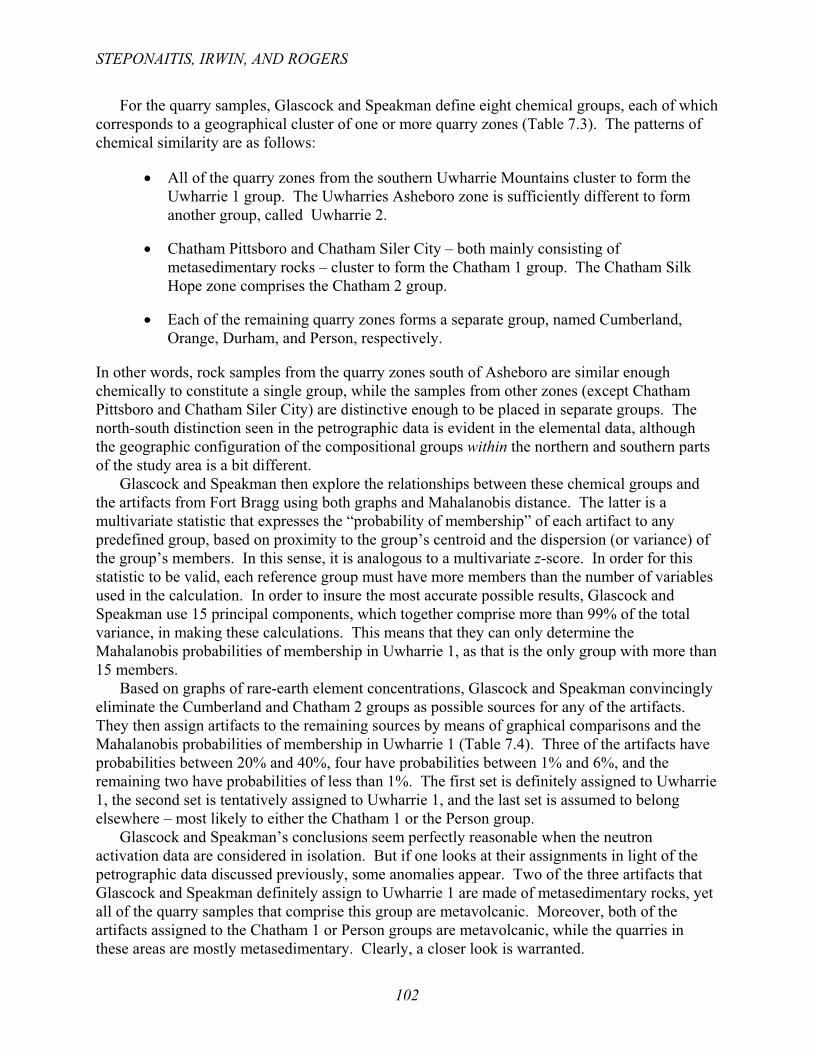
For the quarry samples, Glascock and Speakman define eight chemical groups, each of which corresponds to a geographical cluster of one or more quarry zones (Table 7.3). The patterns of chemical similarity are as follows:
All of the quarry zones from the southern Uwharrie Mountains cluster to form the Uwharrie 1 group. The Uwharries Asheboro zone is sufficiently different to form another group, called Uwharrie 2.
Chatham Pittsboro and Chatham Siler City – both mainly consisting of metasedimentary rocks – cluster to form the Chatham 1 group. The Chatham Silk Hope zone comprises the Chatham 2 group.
Each of the remaining quarry zones forms a separate group, named Cumberland, Orange, Durham, and Person, respectively.
In other words, rock samples from the quarry zones south of Asheboro are similar enough chemically to constitute a single group, while the samples from other zones (except Chatham Pittsboro and Chatham Siler City) are distinctive enough to be placed in separate groups. The north-south distinction seen in the petrographic data is evident in the elemental data, although the geographic configuration of the compositional groups within the northern and southern parts of the study area is a bit different.
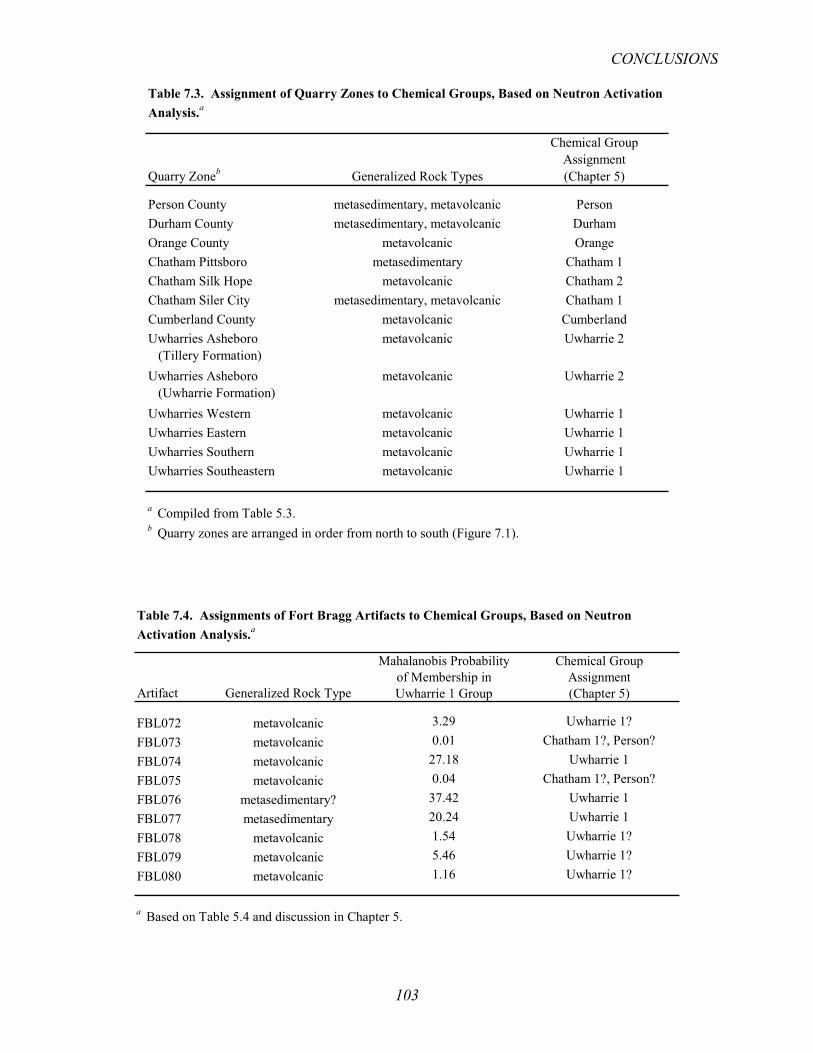
Glascock and Speakman then explore the relationships between these chemical groups and the artifacts from Fort Bragg using both graphs and Mahalanobis distance. The latter is a multivariate statistic that expresses the “probability of membership” of each artifact to any predefined group, based on proximity to the group’s centroid and the dispersion (or variance) of the group’s members. In this sense, it is analogous to a multivariate z-score. In order for this statistic to be valid, each reference group must have more members than the number of variables used in the calculation. In order to insure the most accurate possible results, Glascock and Speakman use 15 principal components, which together comprise more than 99% of the total variance, in making these calculations. This means that they can only determine the Mahalanobis probabilities of membership in Uwharrie 1, as that is the only group with more than 15 members.
Based on graphs of rare-earth element concentrations, Glascock and Speakman convincingly eliminate the Cumberland and Chatham 2 groups as possible sources for any of the artifacts. They then assign artifacts to the remaining sources by means of graphical comparisons and the Mahalanobis probabilities of membership in Uwharrie 1 (Table 7.4). Three of the artifacts have probabilities between 20% and 40%, four have probabilities between 1% and 6%, and the remaining two have probabilities of less than 1%. The first set is definitely assigned to Uwharrie 1, the second set is tentatively assigned to Uwharrie 1, and the last set is assumed to belong elsewhere – most likely to either the Chatham 1 or the Person group.
Glascock and Speakman’s conclusions seem perfectly reasonable when the neutron activation data are considered in isolation. But if one looks at their assignments in light of the petrographic data discussed previously, some anomalies appear. Two of the three artifacts that Glascock and Speakman definitely assign to Uwharrie 1 are made of metasedimentary rocks, yet all of the quarry samples that comprise this group are metavolcanic. Moreover, both of the artifacts assigned to the Chatham 1 or Person groups are metavolcanic, while the quarries in these areas are mostly metasedimentary. Clearly, a closer look is warranted.
STEPONAITIS, IRWIN, AND ROGERS
102
Quarry Zoneb Generalized Rock Types
Chemical GroupAssignment(Chapter 5)
Person County metasedimentary, metavolcanic PersonDurham County metasedimentary, metavolcanic DurhamOrange County metavolcanic OrangeChatham Pittsboro metasedimentary Chatham 1Chatham Silk Hope metavolcanic Chatham 2Chatham Siler City metasedimentary, metavolcanic Chatham 1Cumberland County metavolcanic CumberlandUwharries Asheboro (Tillery Formation)
metavolcanic Uwharrie 2
Uwharries Asheboro (Uwharrie Formation)
metavolcanic Uwharrie 2
Uwharries Western metavolcanic Uwharrie 1Uwharries Eastern metavolcanic Uwharrie 1Uwharries Southern metavolcanic Uwharrie 1Uwharries Southeastern metavolcanic Uwharrie 1
a Compiled from Table 5.3.b Quarry zones are arranged in order from north to south (Figure 7.1).
Table 7.3. Assignment of Quarry Zones to Chemical Groups, Based on Neutron Activation Analysis.a
Mahalanobis Probability Chemical Groupof Membership in Assignment
Artifact Generalized Rock Type Uwharrie 1 Group (Chapter 5)
FBL072 metavolcanic 3.29 Uwharrie 1?FBL073 metavolcanic 0.01 Chatham 1?, Person?FBL074 metavolcanic 27.18 Uwharrie 1FBL075 metavolcanic 0.04 Chatham 1?, Person?FBL076 metasedimentary? 37.42 Uwharrie 1FBL077 metasedimentary 20.24 Uwharrie 1FBL078 metavolcanic 1.54 Uwharrie 1?FBL079 metavolcanic 5.46 Uwharrie 1?FBL080 metavolcanic 1.16 Uwharrie 1?
a Based on Table 5.4 and discussion in Chapter 5.
Table 7.4. Assignments of Fort Bragg Artifacts to Chemical Groups, Based on Neutron Activation Analysis.a
CONCLUSIONS
103
One way that Glascock and Speakman’s statistical analysis can be extended is by calculating Mahalanobis probabilities with reference to more than one group. Note that these probabilities are determined for each group independently, and so they need not sum to 100%. Thus, for example, a high probability of membership in Uwharrie 1 does not preclude an even higher probability of membership in another group. In this case, bringing additional groups into the calculation requires that we reduce the number of variables so that it is less than the number of members in the smallest group. The best solution is to use only the first four principal components, which together account for more than 80% of the total variance. While these four components contain less variance than the 15 used by Glascock and Speakman, they still capture most of the variation in the data and should produce interpretable results. The relatively small proportion of variance lost is more than offset by the advantage of being able to make comparisons with more than one reference group simultaneously.
Table 7.5 shows the Mahalanobis probabilities calculated in this way for each artifact, with reference to the six compositional groups that remain as plausible sources. One can see a more complex array of possibilities for group membership than was evident previously. If we were to make assignments based on the highest probability for each artifact, only one artifact would be assigned to Uwharrie 1, four would be assigned to Uwharrie 2, two would be placed in Chatham 1, and two would be assigned to the Durham group. Of course, such a decision rule may be too simplistic in this case, as some artifacts show comparably high probabilities of membership in more than one group. Also, because Mahalanobis probabilities behave like z-scores, reference groups with high internal variance tend to more easily “capture” additional members by means of the highest-probability criterion than do groups with smaller internal variance. This tendency must be taken into account when interpreting the numbers. It may, for example, explain why the probabilities of membership in the Uwharrie 2 and Person groups, with high internal variance, are generally greater than the probabilities for membership in the Orange group, which forms a very “tight” cluster (see Figure 5.5, noting the relative sizes of the confidence ellipses for each chemical group).
We will defer a further discussion of these relationships until later in this chapter, when we consider multiple lines of evidence in assigning provenance. For now, suffice it to say that the elemental data convincingly eliminate certain quarry zones (Cumberland County and Chatham Silk Hope) as sources for the Fort Bragg artifacts. The data further suggest that these artifacts show relationships to at least four different chemical groups corresponding to quarry zones located in both the southern and the northern portions of the study area.
Geochemistry: Isotopes
Coleman and Miller’s analysis of neodymium (Nd) isotopes, presented in Chapter 6, provides additional useful information on patterns of compositional variability in the Carolina Slate Belt. Using a mass spectrometer, they measure the present-day 143Nd/144Nd ratio. Then, based on the known age of the rock and the abundance of 147Sm (which radioactively decays to produce 143Nd), they mathematically correct this ratio to estimate its original value at the time the rock was formed. This age-corrected Nd ratio is known to be constant for any given magma source. Thus, all the metavolcanic rocks that were formed from the same magma source would exhibit the same ratio. Moreover, the ratio is immune to accidental variation from
STEPONAITIS, IRWIN, AND ROGERS
104

inhomogeneities in the rock itself. This characteristic makes the numbers very reliable, even when dealing with limited powder samples taken from small artifacts.
Coleman and Miller demonstrate that each quarry zone tends to exhibit a restricted range of age-corrected Nd ratios, with some zones being more variable than others (Figure 7.2). For present purposes it is convenient to divide the Nd ratios into three categories, which we simply call low, medium, and high. Low ratios (below 0.51193) occur only in the Chatham Pittsboro zone. Medium ratios (0.51193-0.51210) are characteristic of almost all the samples from the Uwharrie Mountains, except for a few from the Uwharries Asheboro zone. High ratios (above 0.51210) are found in all the samples from the Chatham Siler City, Chatham Silk Hope, Orange County, and Durham County zones. The remaining three quarry zones – Uwharries Asheboro, Cumberland County, and Person County – have assemblages that include both medium and high ratios. Interestingly, the different Nd ratios found within the Uwharries Asheboro zone correlate perfectly with geological units: the rocks with medium values are from the Uwharrie Formation, while those with high values come from the Tillery Formation.
In addition to looking at the Nd isotopes, Coleman and Miller also compute ratios of selected rare-earth elements, specifically La/Lu and Ta/Yb, as supplemental evidence in making comparisons. When the Nd ratios are plotted against these rare-earth ratios, samples from individual zones tend to form clusters – a useful result for sourcing artifacts.
Based on these graphs, Coleman and Miller match artifacts with probable sources (Table 7.6). Three artifacts with medium Nd ratios are confidently assigned to sources in the Uwharrie Mountains south of Asheboro, with affinities to the Uwharries Southern, Eastern, or Southeastern samples. Two more artifacts with medium ratios do not match any of the known sources, but seem to come from metasedimentary sources closely related to rocks in the Uwharries Southeastern or Asheboro zones. Two artifacts with high Nd ratios are assigned to Orange County and Uwharries Asheboro, respectively. And, finally, two artifacts with low Nd ratios are left unassigned; their isotopic similarity to the Chatham Pittsboro samples is noted, but the relationship is discounted – and for good reason, since the artifacts are metavolcanic and the Chatham Pittsboro sources are metasedimentary.
Table 7.5. Mahalanobis Probabilities of Group Membership, Based on Four Principal Components.a
Artifact Uwharrie 1 Uwharrie 2 Chatham1 Orange Durham Person
FBL072 12.82 13.95 1.28 0.80 9.76 11.76FBL073 1.10 14.90 0.44 0.37 6.51 9.76FBL074 71.46 13.54 23.99 3.16 9.28 16.87FBL075 0.00 16.71 12.02 0.21 38.41 25.35FBL076 9.69 16.33 26.84 10.64 20.30 20.98FBL077 11.57 11.84 5.14 3.73 23.60 10.22FBL078 2.83 13.74 89.06 5.29 10.41 45.61FBL079 9.54 21.82 8.13 0.73 9.84 16.53FBL080 1.29 17.83 0.54 0.37 7.14 10.22
a The highest probability in each row is shown in bold type.
Chemical Group
CONCLUSIONS
105

Figure 7.2. Dot plot showing Nd-isotope ratios for quarry zones and artifacts. The vertical dotted lines divide the ratios into three categories: low, medium, and high. Note that the quarry zones are arranged in order from north to south along the Carolina Slate Belt’s strike. The Cumberland County zone is placed in the order according to where the Cape Fear River, the zone’s major drainage feature, crosses the Slate Belt. Circles indicate metavolcanic rocks, diamonds indicate metasedimentary rocks, and a pentagon indicates the one rock of indeterminate type.
Moving beyond the specific assignments made in Chapter 6, two general patterns are evident in the Nd-isotope data, both of which can be seen clearly in Figure 7.2.
First, the Nd ratios in quarry zones dominated by metasedimentary rocks show much more internal variation than the ratios in zones dominated by metavolcanic rocks. Only two of the metavolcanic zones have comparably high variation, and both are clearly mixed assemblages: Uwharries Asheboro includes rocks from two different formations, and Cumberland County rocks were transported by water from within a large basin. Setting aside these exceptions, the metavolcanic rocks from each quarry zone show a very tight clustering of values, which is exactly what one would expect given the geological mechanism that determines these ratios.
Second, the Nd ratios in the Carolina Slate Belt exhibit a strong geographical trend, increasing from south to north along strike. This pattern plays out most consistently in the metavolcanic rocks. Not surprisingly, the only two zones that violate this trend – Chatham Pittsboro and, to a lesser extent, Person County – are predominantly metasedimentary units. Yet even with these exceptions, our data show that metavolcanic or metasedimentary rocks with high
STEPONAITIS, IRWIN, AND ROGERS
106

Nd ratios occur only from Asheboro northward, and metavolcanic rocks with medium ratios occur almost exclusively from Asheboro southward (i.e., within the Uwharrie Mountains). If the trend holds, by extension one might expect metavolcanics with low ratios to originate from somewhere south of the Uwharries, but this assumption has yet to be tested.
All in all, these general patterns provide useful benchmarks for sourcing artifacts, particularly if the rock comes from a quarry that has not yet been sampled and characterized.
Discussion and Synthesis
Based on our review of the individual studies, one thing is abundantly clear: in the matter of assigning artifacts to geological sources, there are significant discrepancies among the assignments made by different researchers working with different lines of evidence (Table 7.7). Indeed, there is not a single artifact in our pilot study for which all the assignments agree perfectly. At best, the three assignments show partial overlap; at worst, they are completely different. This illustrates the need for a synthetic approach, which considers and weighs all the lines of evidence together.
It is also worth noting that even when looking at the individual studies, very few of our artifacts match up exactly with any of the quarries we sampled. This should not be too surprising. For one thing, as discussed in Chapters 2 and 4, the rocks in the Carolina Slate Belt show a tremendous amount of variability. Moreover, as shown in Chapter 3, the number of quarries we sampled is only a small proportion of those that are known to exist, and many more remain to be discovered.
Yet even in the absence of an exact match, one may still draw inferences about geological provenance. It is reasonable to assume that a general similarity to a specific, known source
Table 7.6. Assignments of Fort Bragg Artifacts to Quarry Zones, Based on Nd-Isotope Ratios.a
Nd-Isotope Quarry Zone AssignmentArtifact Generalized Rock Type 143Nd/144Nd(550 Ma) Category (Chapter 6)
FBL072 metavolcanic 0.512023 medium Uwharries Southern,Uwharries Eastern
FBL073 metavolcanic 0.512167 high OrangeFBL074 metavolcanic 0.511871 low -FBL075 metavolcanic 0.512143 high Uwharries Asheboro (Tillery
Formation)FBL076 metasedimentary? 0.511944 medium -FBL077 metasedimentary 0.511964 medium -FBL078 metavolcanic 0.511988 medium Uwharries SoutheasternFBL079 metavolcanic 0.511924 low -FBL080 metavolcanic 0.512024 medium Uwharries Southern,
Uwharries Eastern
a Compiled from Table G.1.
CONCLUSIONS
107

Tab
le 7
.7.
Sum
mar
y of
Sou
rce
Ass
ignm
ents
for
Fort
Bra
gg A
rtifa
cts.
Gen
eral
ized
Qua
rry
Zone
Che
mic
al G
roup
Q
uarr
y Zo
neSo
urce
Are
aSa
mpl
eR
ock
Type
Roc
k Ty
pe(C
hapt
er 4
)(C
hapt
er 5
)(C
hapt
er 6
)(C
hapt
er 7
)
FBL0
72m
etav
olca
nic
daci
teU
wha
rrie
s Ash
ebor
oU
wha
rrie
1?
Uw
harr
ies S
outh
ern,
Uw
harr
ies E
aste
rnU
wha
rrie
s Ash
ebor
o (U
wha
rrie
For
mat
ion)
FBL0
73m
etav
olca
nic
daci
te p
orph
yry
Ora
nge
Cou
nty
Cha
tham
1?,
Per
son?
Ora
nge
Cou
nty
Ora
nge
Cou
nty
FBL0
74m
etav
olca
nic
daci
tic tu
ffU
wha
rrie
s Eas
tern
?U
wha
rrie
1-
Uw
harr
ie M
ount
ains
or
farth
er so
uth
FBL0
75m
etav
olca
nic
ande
site
-C
hath
am 1
?, P
erso
n?U
wha
rrie
s Ash
ebor
o (T
iller
y Fo
rmat
ion)
?no
rther
n po
rtion
of s
tudy
ar
eaFB
L076
met
ased
imen
tary
?da
citic
tuff
or
silts
tone
-U
wha
rrie
1-
-
FBL0
77m
etas
edim
enta
rysi
ltsto
ne-
Uw
harr
ie 1
--
FBL0
78m
etav
olca
nic
daci
te c
ryst
al-li
thic
tu
ff o
r por
phyr
yU
wha
rrie
s Ash
ebor
o?,
Uw
harr
ies S
outh
east
ern?
Uw
harr
ie 1
?U
wha
rrie
s Sou
thea
ster
nU
wha
rrie
Mou
ntai
ns
FBL0
79m
etav
olca
nic
daci
tic tu
ffU
wha
rrie
s Ash
ebor
o?,
Uw
harr
ies S
outh
east
ern?
Uw
harr
ie 1
?-
Uw
harr
ie M
ount
ains
or
farth
er so
uth
FBL0
80m
etav
olca
nic
daci
teU
wha
rrie
s Ash
ebor
o?,
Uw
harr
ies S
outh
east
ern?
Uw
harr
ie 1
?U
wha
rrie
s Sou
ther
n,U
wha
rrie
s Eas
tern
Uw
harr
ie M
ount
ains
Sour
ce A
ssig
nmen
ts
STEPONAITIS, IRWIN, AND ROGERS
108

provides at least a clue as to approximate source. In other words, usually there is enough regional consistency in the nature of rocks that one can make inferences about the general area from which an artifact may have come, even if one has not pinpointed the exact source. Identifying overall patterns and trends is critically important in making such assignments.
In the present case, all our lines of evidence point to major compositional differences between the rocks in the northern and southern portions of our study area. These differences correspond roughly to the distinction within the Carolina Slate Belt between the Uwharrie and Virgilina suites – the former making up the Uwharrie Mountains, and the latter constituting areas to the north. The boundary between these two compositional provinces occurs roughly at Asheboro, although the precise nature and location of the boundary varies depending on the analytical technique being used. The mineralogical and chemical differences between these provinces have already been mentioned in the preceding sections but are worth repeating here:
Mineralogically, the southern province tends to show higher degrees of metamorphism than the northern province. This means that minerals such as garnet and biotite are more likely to appear in the south. Based on our quarry samples, these minerals do not occur in metavolcanics north of Asheboro or in metasedimentary rocks north of Chatham Siler City.
In terms of elemental composition, the quarry samples in the southern province show considerable homogeneity in comparison to the northern province. The statistical analysis in Chapter 5 illustrates this pattern nicely. All the Uwharries zones fall into only two chemical groups, while the more northerly zones are much more variable and fall into five groups.
The age-corrected Nd-isotope ratios show a consistent trend of increase from south to north, especially in the metavolcanic rocks. All the metavolcanics south of Asheboro exhibit medium values, and virtually all the metavolcanics north of Asheboro yield high values. In the Uwharries Asheboro zone itself, the results are mixed. Rocks in this zone from the Tillery Formation have high values (like the northern zones), while those from the Uwharrie Formation have medium values (like the southern zones).
With these patterns in mind, let us now weigh all the lines of evidence in assessing the likely geological sources for each of the nine artifacts in turn.
FBL072
This artifact is made of a fine-grained metadacite with sparse and small plagioclase phenocrysts. According to Stoddard, this material resembles the Uwharries Asheboro samples, particularly FBL055, in terms of both mineralogy and major-element chemistry. The neutron activation data confirm this assessment, as this artifact has the highest probability of membership in the Uwharrie 2 group, which contains all the Uwharries Asheboro samples. In terms of Nd-isotopes, the specimen has a medium value that falls within the range of values for the Uwharries Asheboro samples from the Uwharrie Formation, including FBL055. The La/Lu and Ta/Yb ratios fall within the range of those from the Uwharries Asheboro samples, although they are at the low end of those from the Uwharrie Formation. The presence of garnet and biotite are also consistent with a source in the Uwharrie Mountains.
CONCLUSIONS
109

In sum, all lines of evidence point to a source in the Uwharries Asheboro zone, particularly the portion within the Uwharrie Formation. No other artifact in our sample can be as confidently assigned to a single source.
FBL073
The raw material is a strongly porphyritic dacite with plagioclase and quartz phenocrysts comprising about 20% of the rock’s volume. Stoddard notes its strong similarity to the Orange County rock samples in terms of petrographic characteristics. However, the Mahalanobis probabilities based on the neutron activation data suggest a much closer affinity to the Uwharrie 2, Person, and Durham groups, which correspond to the Uwharries Asheboro, Person County, and Durham County zones, respectively. Isotopically, the artifact has a high Nd-isotope ratio, consistent with rocks from the northern half of the study area, including Orange County, Durham County, Person County, and the Tillery Formation portion of the Uwharries Asheboro zone. Visual examination of rare-earth-element scatter plots leads Glascock and Speakman to suggest that this artifact shows the closest affinities to the Person and Chatham 1 groups. Despite the chemical similarities, however, the Person, Durham, and Chatham 1 groups consist mainly of metasedimentary rocks, which bear very little resemblance to the artifact under consideration. In terms of La/Lu and Ta/Yb ratios, this artifact comes closest to the Uwharries Asheboro (Tillery Formation) samples. One rock sample from the Uwharries Asheboro zone (FBL023) does have a phenocryst density almost as high as this artifact’s, but it comes from the Uwharrie Formation, whose Nd-isotope ratios are in the medium range and therefore inconsistent with this artifact; FBL023 also contains biotite, which this artifact lacks.
Generally speaking, we can safely say that this artifact comes from the northern portion of the study area. Petrographically it is most similar to the Orange County samples, but chemically it most resembles the Uwharries Asheboro (Tillery Formation) samples. In this case, we find the former similarities more compelling than the latter, and therefore believe Orange County to be the most likely source.
FBL074
This is a sparsely porphyritic metadacitic tuff with quartz and plagioclase phenocrysts too small to be seen with the naked eye. Petrographically this artifact resembles samples from the Uwharries Eastern zone. The neutron activation data point in the same direction, with high probabilities of membership in the Uwharrie 1 group; on plots of the first three principal components, this artifact falls closest to the Uwharries Eastern samples. The presence of biotite also suggests a southerly source. Yet despite the petrographic and chemical similarities to rocks in the Uwharrie Mountains, the Nd-isotope ratio falls considerably below the known range of the Uwharries samples, and the La/Lu and Ta/Yb ratios fall slightly above the Uwharries range. These data lead Coleman and Miller to suggest a non-Uwharries origin for this piece. Given how specific and consistent the Nd ratios are for a particular magma source, and given how many samples we have from the Uwharries, the low Nd ratio presents a real anomaly that cannot be ignored. If this artifact is not from the Uwharries, then the north-south trend in Nd-isotope values would suggest that it comes from somewhere south of the Uwharries – an area we did not sample for this study.
Thus, our evidence suggests that this artifact comes either from the southern Uwharrie Mountains, or, even more likely, from an unknown source even farther south.
STEPONAITIS, IRWIN, AND ROGERS
110
FBL075
Stoddard describes this specimen as an extremely fine-grained andesitic rock with sparse and very small plagioclase phenocrysts. He also says that petrographically it is “unlike any of the quarry specimens examined.” Mahalanobis probabilities based on the neutron activation data show moderate probabilities of membership in the Durham, Person, and Uwharrie 2 groups, in that order, and an extremely low probability of membership in Uwharrie 1. The Nd-isotope ratio is high, which suggests an origin in the northern part of the study area. The La/Lu and Ta/Yb ratios fall closest to the Uwharries Asheboro (Tillery Formation) samples. Biotite and garnet are absent.
We can reasonably conclude that this artifact comes from a source located in the northern half of the study area, but one that we did not sample.
FBL076
The material in this artifact is difficult to characterize, and even more difficult to match reliably with any of our sources. Stoddard calls it an “exceedingly fine grained ... dacitic (ash) tuff, or a tuffaceous metasiltstone/metamudstone.” In other words, he is unsure whether the rock is volcanic or sedimentary in origin. He also refrains from suggesting a possible source. Neutron activation data indicate a high probability (based on 15 principal components) of membership in the Uwharrie 1 group, but an even higher probability (based on only 4 components) of membership in the Chatham 1, Person, Durham, Uwharrie 2, and Orange groups. The Nd-isotope ratio has a middling value well below those found in the Chatham Siler City zone and slightly above those usually found in the Chatham Pittsboro zone, which makes a Chatham 1 assignment problematic, although not impossible. The isotope ratio is also well below those that typify the Orange and Durham County sources. By process of elimination, this leaves Person County and Uwharries Asheboro (Uwharrie Formation) as possibilities. But if the rock is sedimentary, then the latter falls away also. All in all, this sample seems chemically and isotopically most similar to FBL056, an outlier among the Chatham Pittsboro samples, but the match is not close enough to inspire confidence.
In sum, the Chatham Pittsboro and Person County zones are possibilities, but weak ones at best. The source might also be a metasedimentary rock from the Uwharrie Mountains, a type of rock we did not sample. Despite our best efforts, the only safe conclusion is that the source of this rock remains unknown.
FBL077
Stoddard describes this specimen as a fine-grained metasedimentary rock with mineral grains that are too small to be confidently identified in thin section. Even so, he observes an abundant metamorphic mineral that is probably green biotite. The neutron activation analysis suggests this artifact has a moderately high probability of membership in the Durham, Uwharrie 2, Uwharrie 1, Person, and Chatham 1 groups, in that order. Its middling Nd-isotope ratio would seem to eliminate the Durham County zone, and the likely presence of biotite would eliminate Person County. Its La/Lu and Ta/Yb ratios fall closest to individual specimens from the Uwharries Asheboro and Chatham 1 zones. The Nd ratio overlaps with samples from the Uwharries
CONCLUSIONS
111
Southeastern and Uwharries Asheboro (Uwharrie Formation) zones and is not far from one Chatham Pittsboro sample (FBL056).
If discretion is indeed the better part of valor, then we should be loath to make an assignment here. Be that as it may, the best guess would be either Chatham Pittsboro or an unknown metasedimentary source derived from the Uwharrie Mountains – but neither of these possibilities is strong enough to trust. For now, this artifact is best left unassigned.
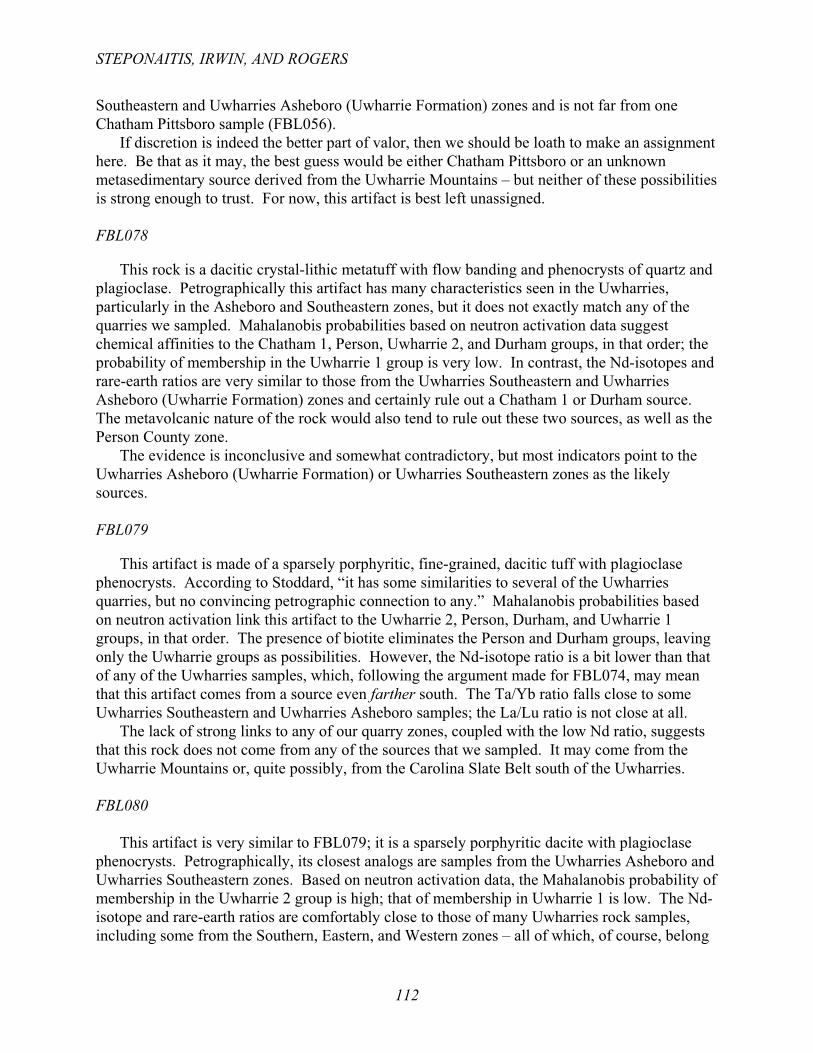
FBL078
This rock is a dacitic crystal-lithic metatuff with flow banding and phenocrysts of quartz and plagioclase. Petrographically this artifact has many characteristics seen in the Uwharries, particularly in the Asheboro and Southeastern zones, but it does not exactly match any of the quarries we sampled. Mahalanobis probabilities based on neutron activation data suggest chemical affinities to the Chatham 1, Person, Uwharrie 2, and Durham groups, in that order; the probability of membership in the Uwharrie 1 group is very low. In contrast, the Nd-isotopes and rare-earth ratios are very similar to those from the Uwharries Southeastern and Uwharries Asheboro (Uwharrie Formation) zones and certainly rule out a Chatham 1 or Durham source. The metavolcanic nature of the rock would also tend to rule out these two sources, as well as the Person County zone.
The evidence is inconclusive and somewhat contradictory, but most indicators point to the Uwharries Asheboro (Uwharrie Formation) or Uwharries Southeastern zones as the likely sources.
FBL079
This artifact is made of a sparsely porphyritic, fine-grained, dacitic tuff with plagioclase phenocrysts. According to Stoddard, “it has some similarities to several of the Uwharries quarries, but no convincing petrographic connection to any.” Mahalanobis probabilities based on neutron activation link this artifact to the Uwharrie 2, Person, Durham, and Uwharrie 1 groups, in that order. The presence of biotite eliminates the Person and Durham groups, leaving only the Uwharrie groups as possibilities. However, the Nd-isotope ratio is a bit lower than that of any of the Uwharries samples, which, following the argument made for FBL074, may mean that this artifact comes from a source even farther south. The Ta/Yb ratio falls close to some Uwharries Southeastern and Uwharries Asheboro samples; the La/Lu ratio is not close at all.
The lack of strong links to any of our quarry zones, coupled with the low Nd ratio, suggests that this rock does not come from any of the sources that we sampled. It may come from the Uwharrie Mountains or, quite possibly, from the Carolina Slate Belt south of the Uwharries.
FBL080
This artifact is very similar to FBL079; it is a sparsely porphyritic dacite with plagioclase phenocrysts. Petrographically, its closest analogs are samples from the Uwharries Asheboro and Uwharries Southeastern zones. Based on neutron activation data, the Mahalanobis probability of membership in the Uwharrie 2 group is high; that of membership in Uwharrie 1 is low. The Nd-isotope and rare-earth ratios are comfortably close to those of many Uwharries rock samples, including some from the Southern, Eastern, and Western zones – all of which, of course, belong
STEPONAITIS, IRWIN, AND ROGERS
112

to the Uwharrie 1 group. The presence of both garnet and biotite is consistent with a source in the Uwharries and inconsistent with a metavolcanic source farther north. The porphyritic nature of the rock eliminates the Uwharries Southern zone as a possibility; the middling Nd ratio eliminates the Tillery Formation portion of the Uwharries Asheboro zone. Beyond that, little more can be said.
All in all, this sample probably comes from somewhere in the Uwharrie Mountains, but exactly where is hard to say. The source is one that we did not sample.
Summary
When all lines of evidence are considered, most of the Fort Bragg artifacts can reasonably be assigned to geological sources, albeit with varying degrees of confidence and precision (Figure 7.3). Two artifacts probably come from the northern portion of the study area, one from the Orange County zone (FBL073) and the other from an unknown source (FBL075). Three probably come from the Uwharrie Mountains, one definitely from the Uwharries Asheboro zone (FBL072) and two from ambiguous or undefined sources (FBL078, FBL080). Two more may come from either the Uwharrie Mountains or areas farther south (FBL074, FBL079). The remaining two are simply left unassigned (FBL076, FBL077).
Clearly, a number of different quarries scattered over a wide area were used by the Late Archaic inhabitants of Fort Bragg. The archaeological implications of this pattern will be discussed presently, but first let us turn to an evaluation of our sourcing methods and their relative utility.
Evaluation of Methods
This investigation has used five methods to characterize and compare nine artifacts from Fort Bragg with 71 quarry samples from the Carolina Slate Belt. These methods differ in effectiveness, cost, and the amount of destruction that samples undergo during the analytical process. Each has advantages and disadvantages which must be evaluated relative to the circumstances of any given study. A brief assessment of each method follows, with particular reference to the provenance questions addressed in the present research.
Petrographic examination of thin sections provides the most complete information about the nature of a rock, based on its mineralogy and texture. Thin sections may represent the only way to identify fine-grained rocks without phenocrysts. The method is quite destructive, particularly when used on artifacts, as it requires that a block of the specimen be cut away, glued to a glass slide, then ground to a thin section. However, there is no substitute for the kind of qualitative information this method provides.
The 143Nd/144Nd ratio adjusted to the age of the rock is very diagnostic. Because the ratio is the same in all minerals that crystallized from the same magma, it can be obtained by
drilling only a few tenths of a gram from anywhere in a sample, thus preserving the shapes of artifacts. A further advantage to measuring Nd ratios is that they are not affected by weathering, other surface processes, or inhomogeneities in the rock (such as phenocrysts), thus assuring that the ratio in any part of the artifact is the same as in the
CONCLUSIONS
113
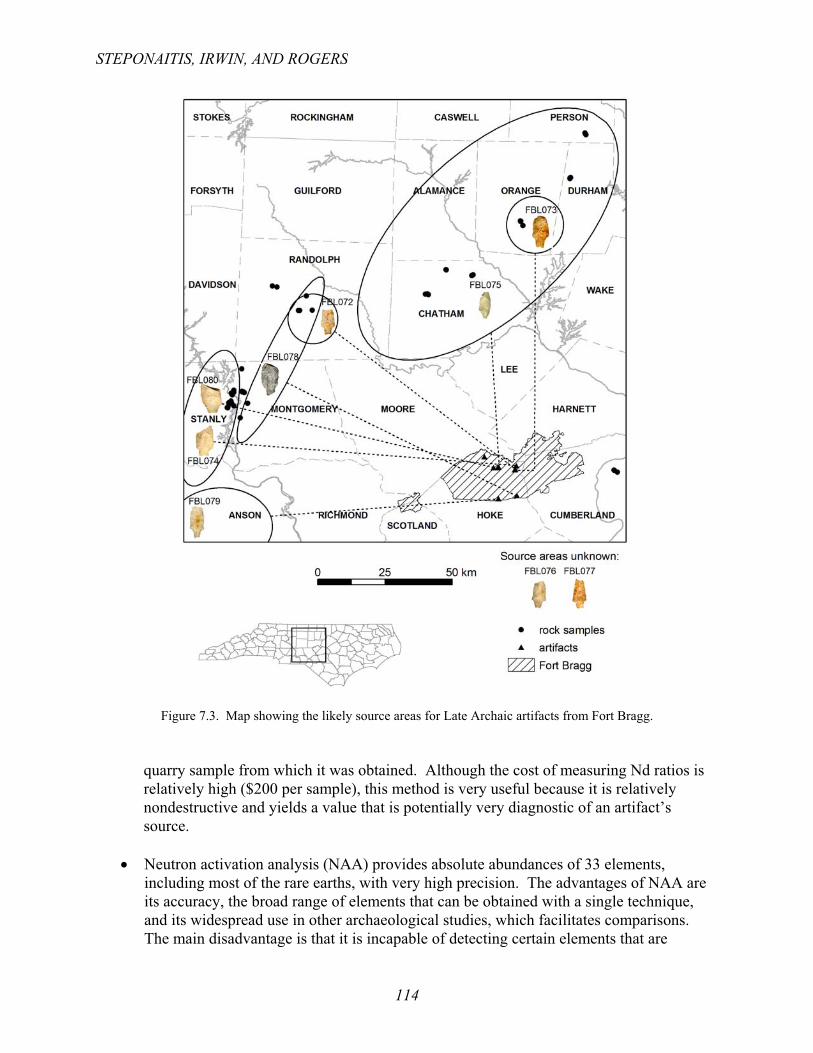
Figure 7.3. Map showing the likely source areas for Late Archaic artifacts from Fort Bragg.
quarry sample from which it was obtained. Although the cost of measuring Nd ratios is relatively high ($200 per sample), this method is very useful because it is relatively nondestructive and yields a value that is potentially very diagnostic of an artifact’s source.
Neutron activation analysis (NAA) provides absolute abundances of 33 elements, including most of the rare earths, with very high precision. The advantages of NAA are its accuracy, the broad range of elements that can be obtained with a single technique, and its widespread use in other archaeological studies, which facilitates comparisons. The main disadvantage is that it is incapable of detecting certain elements that are
STEPONAITIS, IRWIN, AND ROGERS
114
particularly important for geological interpretation, such as silicon (Si) and four of the rare earths (Gd, Ho, Er, Tm). NAA is also relatively destructive when used with porphyritic rocks like those in the present study. The analysis itself only requires a few milligrams of powder, but a much larger portion of the sample must be ground up and homogenized to insure that these few milligrams adequately represent the bulk composition of the sample as a whole.
X-ray fluorescence analysis (XRF) provides abundances of 21 elements, many of which are so affected by weathering and other surface processes that they cannot be used for comparison of artifacts and quarry samples. The most useful elements are probably Si, Ti, Ga, and Zr. XRF data have been used here mainly for the purpose of classifying rocks according to standard geological typologies (see Chapter 4). Like NAA, traditional methods of XRF require destruction of samples by grinding and homogenizing the powder. Nondestructive XRF techniques are available, but these tend to be less precise and are only useful for sourcing of very homogeneous lithics in which the abundance of an element is not affected by the abundance of phenocrysts or sedimentary clasts on exposed surfaces. In other words, they are not likely to work very well with the kinds of rocks found in our study area.
Inductively coupled plasma mass spectrometry (ICP-MS) is the only technique that yields abundances of all the rare-earth elements, which are important in making geological inferences and relatively immobile. Here the rare-earth concentrations obtained by ICP-MS were used in conjunction with the Nd-isotope ratios in defining compositional groups. Chondrite-normalized rare-earth concentrations can also be used to source artifacts, at least in some situations. In the present case, a preliminary investigation showed that chondrite-normalized rare-earth patterns were similar for all quarry and artifact samples except for rocks from the Chatham Siler City zone (Miller 2002), and so this approach was not pursued further. Like NAA and XRF, this measurement requires powdering a significant piece of each sample.
Based on our observations in this project, the two most useful methods for sourcing the artifacts from Fort Bragg proved to be petrography and the Nd-isotope ratios, although the elemental data were also very helpful in certain instances.
Even though the information gleaned from petrography is invaluable for sourcing, the utility of the technique is constrained by its destructiveness. Cutting a thin section necessitates destroying a large portion of the artifact being studied. To the extent that research questions can be answered by thin-sectioning quarry samples or debitage, this destructiveness is not a major concern. But if one is dealing with points or other formal tools, then it becomes a problem. We recommend that thin-section studies be continued, but that they be done selectively, balancing the information gained against that potentially lost when a portion of the sample is cut away.
As mentioned previously, the measurement of Nd-isotope ratios is the least destructive of all our approaches to sourcing. Moreover, the Nd ratios seem to show a geographical pattern of increase from south to north along the Carolina Slate Belt. If this trend holds up with further studies, then it may be possible to estimate the general location of a source from a Nd ratio, even if the quarry itself has not yet been sampled. For these reasons, Nd-isotope analysis is particularly attractive as a way of sourcing artifacts from our study area.
CONCLUSIONS
115
With regard to the techniques used to measure elements, NAA provides data on roughly the same suite of elements as XRF and ICP-MS combined. For purposes of archaeological sourcing alone, the former is cheaper and provides adequate data. For purposes of geological interpretation, however, the combination of XRF and ICP-MS provide certain critical elements (such as Si and several rare earths) that NAA cannot detect. Which of these techniques one uses in the future should therefore depend on the research questions being asked.
We recommend further studies of both quarries from the Carolina Slate Belt and artifacts from Fort Bragg. Additional quarries should be sampled in order to refine our understanding of their geographical variability and to answer some of the questions raised by this pilot study. It is especially important, for example, to sample areas south of the Uwharrie Mountains in order to see if the north-south trend in Nd ratios continues in this direction. We also need to learn more about the composition and distribution of metasedimentary rocks in the Uwharries – a category that was overlooked in our initial sample of quarries but which may be present among the artifacts from Fort Bragg. The sample of artifacts should also be expanded to include a wider variety of materials and periods other than the Late Archaic.
Archaeological Implications and Future Directions
While some ambiguity exists, the artifact assignments just described suggest that Late Archaic inhabitants of Fort Bragg utilized a number of quarries scattered over a wide area. As these assignments are based on only nine artifacts, it is safe to assume that the actual variation of raw material utilized throughout the Late Archaic period was considerably greater. Moreover, the fact that two of the artifacts fail to resemble any of the geological samples suggests the real possibility that some quarries or zones may never be identified. Nonetheless, the assignments made and the methods developed in this study are encouraging initial steps towards addressing archaeological sites and lithic assemblages in a broader cultural context. Using the Late Archaic period as our example, we outline below several key research problems that may be addressed as the methods and results presented here are expanded upon in the future.
The most obvious and perhaps most commonly addressed problem in lithic sourcing studies is the mobility scale of prehistoric hunter-gatherers. The artifacts studied were all discarded at the end of their use lives, following fracture of the blade. When we consider the distances at which these discarded points were found from their geological sources, we may appreciate the potential range of movement reflected. Before being discarded these hafted bifaces had likely been carried over routes covering minimally the linear distance of Fort Bragg to the Slate Belt quarries, i.e. some 70 to 80 km. Given the non-linear movement of hunter-gatherers (Close 2000), it is likely that these Fort Bragg finds were discarded after circuitous routes around or along major rivers, perhaps along overland paths, to and from certain natural resource draws or social meetings. The total distances covered in a seasonal round that included Slate Belt procurement would minimally double the linear path and more likely involve a lengthier meandering route. We might expect then a distance in some cases of well over 200 km, consistent with the mobility scale of ethnographically studied hunting and gathering groups (Kelly 1995: Table 4.1).
For the Late Archaic, this scale of mobility may be related to broader social and economic trends, or the lack thereof. In North Carolina the hallmarks of increasing social and economic complexity seen elsewhere during the Late Archaic are notably absent (Anderson 1996; Benson
STEPONAITIS, IRWIN, AND ROGERS
116

2000; Phelps 1983; Ward 1983; Ward and Davis 1999). There may be a slight trend towards riverine settlement in the Coastal Plain (Phelps 1983) and sedentism overall (Ward 1983), and certainly sites such as Doerschuk and Lowder’s Ferry suggest intensive occupations or frequent re-occupations (Coe 1964; Drye 1998). However, if there is a notable increase in sedentism as seen in other parts of the Southeast and Midwest, a pattern towards more localized use of raw materials and a more limited mobility scale may be expected.
The connection of sites like those found on Fort Bragg to riverine corridors is an important question for any prehistoric period. Three major river basins are represented in the distribution of quarry zones in the Slate Belt. The kind of sourcing methods developed can be used to evaluate riverine settlement. If groups at Fort Bragg were oriented along the Cape Fear or one of its major tributaries, e.g., the Deep or Haw Rivers, we may expect a high proportion of material from quarry zones along those drainages, e.g., Uwharries Asheboro or Chatham County. The glimpse provided here suggests the possibility of cross-drainage movement that may reflect use of the Sandhills by different social groups entering the area from different river basins or a settlement pattern that is not riverine-based.
Beyond simple distances and directions of movement, the potential to correlate variation in artifact form and raw material procurement is important as well. Benson (2000) suggests, based in part on Savannah River points morphologically divergent from those found in the Uwharrie Mountains, the possibility of regionalization of populations in the North Carolina Piedmont and inner Coastal Plain during the Late Archaic. Sassaman and Anderson (1995) suggest distinct Piedmont/Fall Zone and Coastal Plain populations in South Carolina during the Late Archaic Mill Branch phase, evidenced by local raw-material procurement. There is potentially significant variation in Savannah River Stemmed points, including size disparities (Oliver 1985) and manufacturing differences such as narrow stemmed, weak-shouldered variants like FBL075 (see Trinkley et al. 1996b:149-150). Variation in design that may reflect temporally or socially distinct groups could be correlated with differing procurement and mobility patterns.
The question of raw material selection in relation to technological organization may also be directly linked to sourcing. Again, with a small sample and some ambiguous results, it is difficult to conclude anything about Late Archaic technology, but research questions heretofore impractical may now be more easily addressed. While these tools may not have been curated, the size of the Savannah River points necessitated a certain core requirement that may have been more easily met by metavolcanic stone acquired directly from outcrops, as opposed to quartz that occurs in small packages. In these nine points there is little suggestion of a pattern of raw-material procurement, except for a possible emphasis on stone from the Uwharrie Mountains. There is quite obviously a significant range of variability in the material used. Each of the nine bifaces analyzed is unique and the types of stone include andesite, fine-grained metasedimentary material, and coarse-grained porphyritic tuff. Factors affecting such variable selection will be difficult to model, but the potential to recognize patterns of raw material selection and address these critical elements of archaeological cultures is evident.
Related to the question of technological organization is raw-material quality, an issue that should be addressed through experimental studies of rocks from the different quarry zones. Along with more systematic study of quarries to understand the density of debris, intensity and temporal range of activity, and the range of materials exploited, some knowledge of the quality of stone for making tools would benefit our understanding of these sites. The quality of stone may affect the types of tools manufactured (e.g., expedient or formal) and the distance carried. It may also affect the likelihood of a material being used or widely distributed. In some cases there
CONCLUSIONS
117
may be preferences for a higher-quality material (e.g., Cable and Mueller 1980), or only selected material types from a particular quarry may have been widely dispersed (e.g., Abbott 1987).Replication experiments would help to clarify these issues.
We recommend further studies of both quarries from the Carolina Slate Belt and artifacts from Fort Bragg. Additional quarries in the Piedmont should be sampled in order to refine our understanding of their geographical variability and to answer some of the questions raised by this pilot study. It is especially important, for example, to sample areas south of the Uwharrie Mountains in order to see if the north-south trend in Nd ratios continues in this direction. We also need to learn more about the composition and distribution of metasedimentary rocks in the Uwharries – a category that was overlooked in our initial sample of quarries but which may be present among the artifacts from Fort Bragg. We may eventually add other areas such as a western Slate Belt with quarries like Three Hat Mountain (Mountjoy and Abbott 1982; Abbott 1987). The sample of artifacts should also be expanded to include a wider variety of materials and periods other than the Late Archaic.
Additional studies should also be done of stone sources in the Coastal Plain. Our sample from the Cumberland County zone consists of metavolcanic material washed out of the Piedmont and deposited in the Coastal Plain. With one exception, this heterogeneous sample of rocks appears similar to material utilized locally around the Cape Fear River in the vicinity of Fayetteville. The ability to distinguish between redeposited material in the Coastal Plain and outcrops in the Piedmont is critical, as these represent two major physiographic provinces. Identification of Cape Fear material on Fort Bragg would tie settlement into a major river drainage as well as indicate a direction of movement away from the Slate Belt. Despite the heterogeneity of the sample, the geochemical results are encouraging. The Cumberland County sample is an important initial measure of Coastal Plain material. The redeposited Slate Belt material must be better characterized in order to see if chemical signatures of Coastal Plain provenance can be found.
It should be noted that modeling prehistoric mobility does not require that we be able to discriminate individual quarries or quarry zones. Rather, discriminating among larger provinces may be sufficient for many purposes. For example, the division of the Carolina Slate Belt into northern and southern provinces based on the results of the present study will surely be helpful in assessing mobility. While there is no a priori reason to suspect prehistoric groups organized themselves in a manner consistent with such a broad division, sourcing artifacts to these general areas will facilitate modeling range and directionality of movement at a scale not unlike Daniel’s (1998) macroband.
Distinguishing between the southern and northern Uwharrie Mountains is also important for testing archaeological interpretations. The southern Uwharries, by virtue of including Morrow Mountain, rest at the core of Daniel’s (1998) settlement model. In another settlement model proposed by Moore and Irwin (2002) for Fort Bragg, a specific overland route between the Cape Fear and southern Uwharries was posited. Furthermore, there are implications for modeling riverine-based settlement. The southern and northern Uwharrie Mountains are located in two separate river drainages, the Yadkin–Pee Dee and Cape Fear Rivers, respectively. For Fort Bragg and other areas, the level of specificity in regional settlement models will be somewhat contingent on our ability to assign artifacts to sources in these drainages.
Whether approached from a pure research perspective or used in cultural resource management, the methods developed here have great utility. In the archaeological study of prehistoric hunters and gatherers, analysis of individual occupations offers important but limited
STEPONAITIS, IRWIN, AND ROGERS
118

information. The duration of ephemeral camps in upland environments may involve days or weeks out of a seasonal round that lasts a year. An ephemeral campsite may be one stop in a mobility range that covers hundreds of kilometers. It is crucial to relate sites, artifacts, and behavior into a broader regional context.
CONCLUSIONS
119