chapter 7 child poverty and well-being in china in the … · chapter 7 child poverty and...
TRANSCRIPT

HARNESSING GLOBALISATION FOR CHILDREN: A report to UNICEF
Chapter 7Child poverty and well-being in China
in the era of economic reforms and external opening *
Lu Aiguo and Wei Zhong
Summary: During its period of reforms and openness China has achieved positive results inper capita income growth and poverty reduction. However, there is evidence that the mostsignificant progress in poverty reduction occurred in the early days of reform when opennessand trade liberalization were not yet playing a major role. At the same time, increasingincome inequality (in particular the inequality between regions and between rural and urbanareas) explains the persistence of poverty in the midst of rapid growth and jeopardizes thebroad-based growth pattern. The chapter examines the changes in child well-being in Chinaover the last two decades, with poverty as the central focus. Its policy recommendationsinsist on the role of central government in sustaining the rural economy and “developing thewest” to reduce the bias for east-coastal and urban development. Policies to accelerate theestablishment of social safety nets, welfare programmes – particularly those targeted atchildren – and the enforcement of reasonable labour and social standards for small andmedium-sized enterprises are also necessary to reinforce the ‘equality’ that is currently inshort supply in China.
JEL: D63, F43, I31, J13
* This study presents the views of its authors and not the official UNICEF positionin this field.
-----------------------------------------------------------------------------------------------------------

CHAPTER 7: CHILD WELL-BEING IN CHINA IN THE ERA OF ECONOMIC REFORMS
2
This is chapter 7 of the overall study “Harnessing Globalisation for Children” edited by GiovanniAndrea Cornia
HARNESSING GLOBALISATION FOR CHILDREN: A report to UNICEF
3
1. Introduction
Economic growth raises the level of income of the population, including for the poor, helpingthem to rise out of poverty. However, while growth may be an influential factor, it is notsufficient for the elimination of poverty. Whether growth has a major impact on povertyreduction depends on favourable changes in income distribution. In their absence, growthbenefits the poor only as much as other segments of the population, i.e. proportionally. Incontrast, if growth is accompanied by changes in inequality the extent of poverty can changeeither favourably or unfavourably. It goes without saying that the most preferable growthpattern, the so-called ‘pro-poor’ growth, comprises both fast growth and low or declininginequality.
The question of whether globalization is good for the poor cannot therefore be properlyanswered without an examination of its effects on both growth and inequality (see chapter 4of this study). In cases where globalization has a positive effect on growth, there will be afavourable effect on poverty reduction. But growth alone is no guarantee of povertyreduction. It is possible that, because of the negative effects of globalization on incomedistribution, poverty falls modestly or even increases.
China has been reforming and opening up its economy for more than two decades. As GDPhas been growing rapidly and the country has become increasingly integrated into the worldmarket, a considerable part of the population has gained from the reforms. But compellingevidence also suggests that the benefits of such globalization have not been equally shared,as income inequality has increased to an alarming level. While the fight against poverty hasachieved remarkable success, it is also obvious that the war is far from being won. Despitethe record growth rates and the government pledge to eliminate poverty by the end of the20th century, poverty has persisted to this day. This chapter, after mapping out the overallchanges in child poverty, identifies the links between globalization, growth and inequality,and examines whether and how “Chinese style globalization” has contributed to a reductionin child poverty.
The notion of globalization is used in this chapter to describe various aspects of aninternationalization process that tends to integrate the countries into a single world economy.From the point of view of China, this process is often referred to as external openness.Thus, globalization here is understood as the integration of China into the world economy, aprocess that has been initiated, encouraged and promoted by the government policiestowards deregulation and external liberalization known as reforms and openness, beginningin the late 1970s.

CHAPTER 7: CHILD WELL-BEING IN CHINA IN THE ERA OF ECONOMIC REFORMS
4
2. Background and Analytical Framework
2.1 Economic reforms and external openness
Domestic liberalization and external openness represent two aspects of the developmentstrategy pursued by the Chinese government since 1978. The process has involvedderegulation and liberalization in the domestic economy and in external economic relations.The reforms began in 1978 with the establishment of the “household responsibility system”,under which farmland was contracted to peasants for a fixed number of years. Meanwhile,the government raised the price of grains and other major agricultural products several times,often substantially. Agricultural production grew rapidly as a result of changes in the systemof agricultural management and the increased prices for agricultural products. As for theurban industries, reforms such as profit sharing between the state and enterprises aimed toprovide incentives and greater management autonomy to enterprises without changing theownership structure. These reforms led to a substantial increase in national income and to arise in rural income faster than that of the urban population. Consequently, overall incomeinequality declined.
Beginning from 1985, the focus of reform shifted to urban areas and to industry. Contractsbecame important instruments in the reform of state owned industries, while a non-statesector began to emerge. In the countryside, the autonomy of peasant production grew to thepoint where the household was restored as the basic unit of rural economy, while thecommune system collapsed. Meanwhile, the town and village enterprises (TVE) began togrow. In particular, deregulation of prices carried out step by step from 1985 led to theincreasing role of the market in price setting, a change that had a profound impact on theoverall economy. Reforms stagnated in 1989-1991 and, while the economy continued togrow, income inequality in both rural and urban areas, as well as nationally, started to risesignificantly.
Economic reforms were accelerated in 1992, and were marked by further deregulation,marketization and de facto privatization. The government has been steadily withdrawing itssupport for the state industrial sector, and an increasing number of state-owned enterpriseshave either closed, been sold, or declared bankrupt. On the other hand, the governmenttook various measures to encourage the development of non-state sectors, especially forprivate and foreign funded enterprises. As a result, the state sector share in the nationaleconomy has dwindled to less than 50 per cent – a downward trend that continues. Thisperiod has also seen the emergence and rapid development of a capital market, the outflowof large numbers of rural labourers seeking non-farm jobs, and the rapid growth of export-oriented manufacturing. While the economy has maintained its growth momentum, incomeinequality has increased to an unprecedentedly high level.
Since 1978, therefore, the policy of external openness has proceeded gradually butpersistently, via a series of policy changes, ranging from the reduction and elimination of thestate monopoly over foreign trade, the implementation of new exchange rate policies andencouragement for foreign capital investment, to the establishment of Special EconomicZones (SEZs) – testing grounds for further external liberalization policies. The major steps of
HARNESSING GLOBALISATION FOR CHILDREN: A report to UNICEF
5
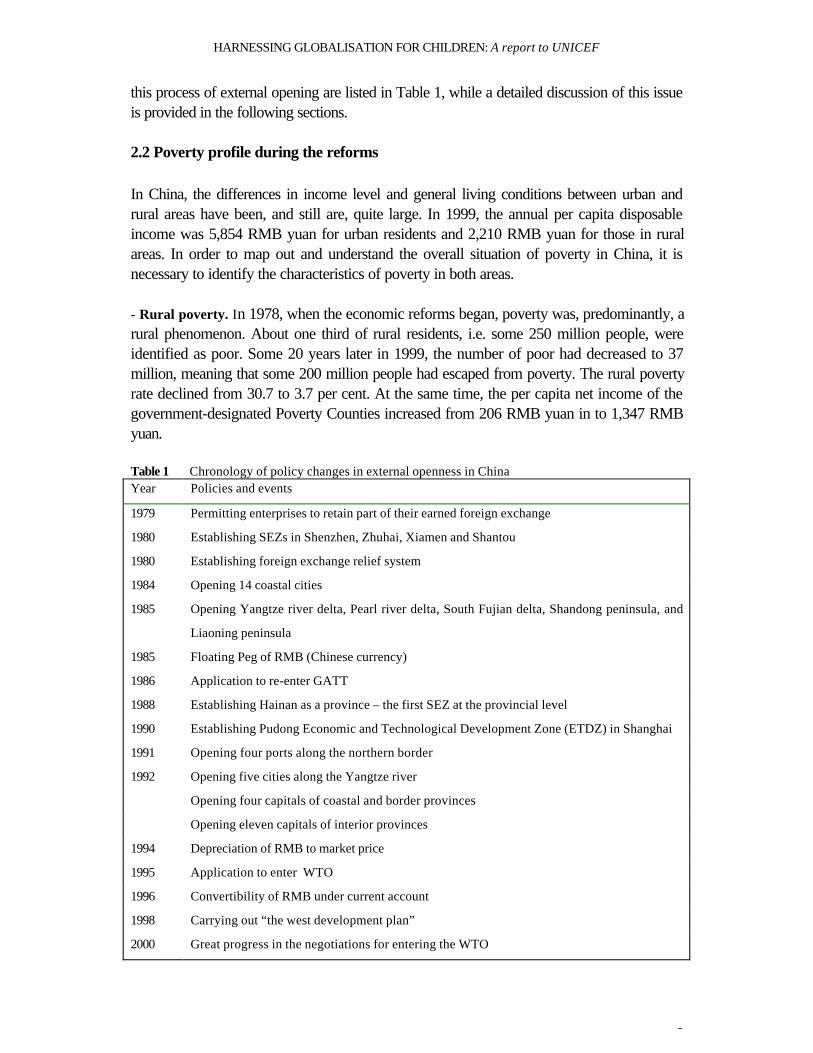
this process of external opening are listed in Table 1, while a detailed discussion of this issueis provided in the following sections.
2.2 Poverty profile during the reforms
In China, the differences in income level and general living conditions between urban andrural areas have been, and still are, quite large. In 1999, the annual per capita disposableincome was 5,854 RMB yuan for urban residents and 2,210 RMB yuan for those in ruralareas. In order to map out and understand the overall situation of poverty in China, it isnecessary to identify the characteristics of poverty in both areas.
- Rural poverty. In 1978, when the economic reforms began, poverty was, predominantly, arural phenomenon. About one third of rural residents, i.e. some 250 million people, wereidentified as poor. Some 20 years later in 1999, the number of poor had decreased to 37million, meaning that some 200 million people had escaped from poverty. The rural povertyrate declined from 30.7 to 3.7 per cent. At the same time, the per capita net income of thegovernment-designated Poverty Counties increased from 206 RMB yuan in to 1,347 RMByuan.
Table 1 Chronology of policy changes in external openness in ChinaYear Policies and events
1979 Permitting enterprises to retain part of their earned foreign exchange
1980 Establishing SEZs in Shenzhen, Zhuhai, Xiamen and Shantou
1980 Establishing foreign exchange relief system
1984 Opening 14 coastal cities
1985 Opening Yangtze river delta, Pearl river delta, South Fujian delta, Shandong peninsula, and
Liaoning peninsula
1985 Floating Peg of RMB (Chinese currency)
1986 Application to re-enter GATT
1988 Establishing Hainan as a province – the first SEZ at the provincial level
1990 Establishing Pudong Economic and Technological Development Zone (ETDZ) in Shanghai
1991 Opening four ports along the northern border
1992 Opening five cities along the Yangtze river
Opening four capitals of coastal and border provinces
Opening eleven capitals of interior provinces
1994 Depreciation of RMB to market price
1995 Application to enter WTO
1996 Convertibility of RMB under current account
1998 Carrying out “the west development plan”
2000 Great progress in the negotiations for entering the WTO
CHAPTER 7: CHILD WELL-BEING IN CHINA IN THE ERA OF ECONOMIC REFORMS
6
From the very beginning of the reforms, the government had focused its poverty alleviationefforts on the countryside to enable rural residents to “dress warmly and eat one’s fill”. Thereform process can be divided into three stages. The first stage – poverty alleviation –spanned the year 1978 to 1985. Initial rural reforms and price increases for agriculturalproducts resulted in rapid growth of rural income, which led, in turn to a sharp drop in ruralpoverty. The number of people living in poverty was drastically reduced from 250 million to125 million, and the poverty rate fell from 30.7 to 14.8 per cent.
During the second stage – 1986 to 1993 – the government launched a large-scale povertyalleviation campaign, with the establishment of special institutions and funding and theimplementation of special policies in poverty-stricken regions. The main object was todevelop regional economies to increase the incomes of local people. Poverty alleviationslowed in terms of the absolute number of people being brought out of poverty. But by theend of 1993, the number of poor had decreased to 80 million, and the poverty rate to 8.7per cent in the countryside.
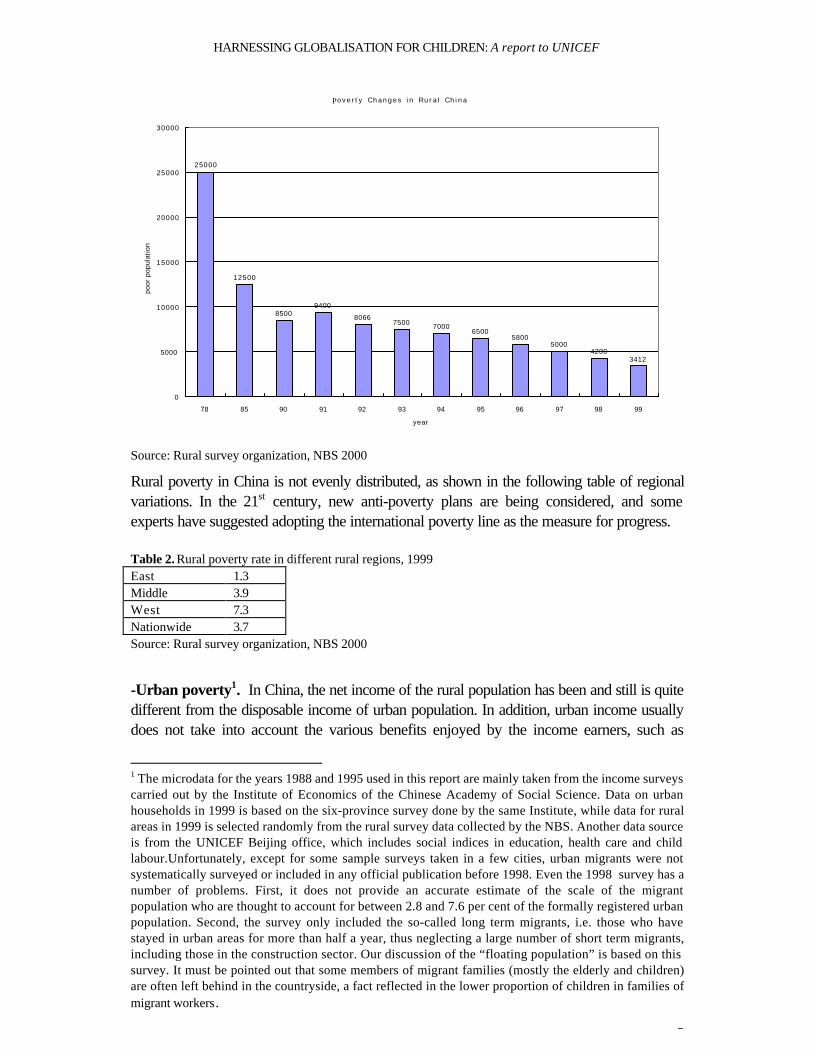
The third phase began in 1994 and was heralded as the implementation of the “NationalEighty-Seven Poverty Alleviation Plan”. The government envisaged a concentration ofmanpower, material resources and financial resources to resolve the poverty problem oncefor all, i.e. to lift the remaining 80 million rural residents out of poverty in seven years – bythe end of the century. Poverty alleviation conferences were held in 1996 and 1999 toensure the realization of the goal. By the end of 1999, the number of the poor in rural areashad been reduced to about 34 million, or 3.7 per cent of rural residents. However, ifpoverty was measured by means of the international poverty line set up by the World Bank(known as the “one dollar per day” poverty line), there were still 106 million poor, and apoverty rate of 11.5 per cent in China at the turn of the century.
Figure 1. Poverty changes in rural China
HARNESSING GLOBALISATION FOR CHILDREN: A report to UNICEF
7
Po v e r t y C h a n g e s i n R u r a l C h i n a
25000
12500
85009400
80667500 7000
65005800
50004200
3412
0
5000
10000
15000
20000
25000
30000
78 85 90 91 92 93 94 95 96 97 98 99
year
poo
r pop
ula
tion
Source: Rural survey organization, NBS 2000
Rural poverty in China is not evenly distributed, as shown in the following table of regionalvariations. In the 21st century, new anti-poverty plans are being considered, and someexperts have suggested adopting the international poverty line as the measure for progress.
Table 2. Rural poverty rate in different rural regions, 1999East 1.3Middle 3.9West 7.3Nationwide 3.7Source: Rural survey organization, NBS 2000
-Urban poverty1. In China, the net income of the rural population has been and still is quitedifferent from the disposable income of urban population. In addition, urban income usuallydoes not take into account the various benefits enjoyed by the income earners, such as
1 The microdata for the years 1988 and 1995 used in this report are mainly taken from the income surveyscarried out by the Institute of Economics of the Chinese Academy of Social Science. Data on urbanhouseholds in 1999 is based on the six-province survey done by the same Institute, while data for ruralareas in 1999 is selected randomly from the rural survey data collected by the NBS. Another data sourceis from the UNICEF Beijing office, which includes social indices in education, health care and childlabour.Unfortunately, except for some sample surveys taken in a few cities, urban migrants were notsystematically surveyed or included in any official publication before 1998. Even the 1998 survey has anumber of problems. First, it does not provide an accurate estimate of the scale of the migrantpopulation who are thought to account for between 2.8 and 7.6 per cent of the formally registered urbanpopulation. Second, the survey only included the so-called long term migrants, i.e. those who havestayed in urban areas for more than half a year, thus neglecting a large number of short term migrants,including those in the construction sector. Our discussion of the “floating population” is based on thissurvey. It must be pointed out that some members of migrant families (mostly the elderly and children)are often left behind in the countryside, a fact reflected in the lower proportion of children in families ofmigrant workers.

CHAPTER 7: CHILD WELL-BEING IN CHINA IN THE ERA OF ECONOMIC REFORMS
8
health care, housing subsidy, and pensions, none of which are enjoyed by the ruralpopulation. Due to the lack of adequate data to compare the purchasing power in rural andurban areas, one should be always cautious when contrasting the two incomes. Beforegetting into detailed discussion of poverty changes, it is necessary to clarify some issuesconcerning the data. The rural poverty line in China differs from the urban poverty line.Attempts have been made to establish a national poverty line, largely by re-calculating ruraland urban income data (Gustafsson and Wei, 2000). However, the 1999 data used in theChina study cannot support the national poverty line established by previous studies. Inaddition, the 1999 poverty line is not consistent with that established by the NBS (NationalBureau of Statistics), and thus incomparable with most official data. This study is based onthe official poverty line published by the NBS.
Poverty in urban areas has four main features2. The first is the different incidence of povertyby the sector of employment and the type of ownership of the firm where a person works.Poverty remains a problem in households where the breadwinner’s work is in traditionalsectors such as textile, coal mining and machinery industries. Increasingly, however, theurban poor live in households of the unemployed, including workers laid off from stateowned enterprises. Second, the growing links between urban poverty and economicstructural adjustment. This adjustment, which began in 1994, has resulted in growingnumbers of urban unemployed, and has become the main cause of urban poverty. The thirdfeature is that urban poverty is more widespread among migrant workers. During thereforms, especially in the early 1990s, a great number of rural labourers moved temporarilyor permanently to the cities, attracted by opportunities to earn income. Those who fail tofind a way to make money face poverty. Fourth, disparities between provinces and citiesremain substantial. Uneven development during the reforms has widened the gap betweenthe coastal and interior regions, leading to an uneven distribution of urban poverty amongdifferent provinces and cities.
2 The poverty line used in this report is the official poverty line set by the National Bureau of Statistics.The method of determining the poverty line for both rural and urban areas is as follows: First, theminimum calorie requirement of 2,100 kilocalories per day per person was selected as the minimumnutrition need as suggested by nutritionists. The second step consists in selecting the food bundle thatcan satisfy this minimum calorie requirement. The actual composition of the food intake selected is thatof the 25 per cent of poorest households in poor areas. Third, the minimum food expenditure (or foodpoverty line) is calculated by means of the prices paid by the poorest 25 per cent of households. Finally,the poverty line is derived by dividing the food poverty line by a "reasonable food share". It was 300RMB yuan for 1990, or about 50 per cent of per capita net income in 1990.
In China’s statistical system, data for urban areas are separate from those for rural areas, and the sameapplies to household income. The rural poverty line was the first, and for a long period of time the only,measurement. Rather belatedly, it became clear that a poverty line was needed for urban populations. In1997, the NBS set up an urban poverty line of 2,200 yuan per capita to monitor urban poverty change.The Bureau estimated the urban poverty rate at 6.1 per cent based on its 1997 survey data. This povertyline indicates that the poverty line in 1990 should have been 1,014 yuan per capita income. But theBureau recognized that the poverty line of 2,200 yuan seemed to be too high compared to that for ruralareas. A lower poverty line of 1,540 yuan was set up on the basis of the same survey, which the Bureauconsidered to be equal to the 640-yuan poverty line for rural areas in the same year.2 In 1999 the povertyline for urban residents was 2,159 yuan in current prices, while the comparative poverty line for ruralresidents was 1,511 yuan. These are the poverty lines used in the following discussion.

HARNESSING GLOBALISATION FOR CHILDREN: A report to UNICEF
9
Table 3. Urban poverty rate in selected provinces, 1999
Province Region PovertyHeadcount Index
Liaoning Coastal 5.38
Jiangsu Coastal 0.59
Beijing Coastal 0.16
Henan Interior 9.29
Sichuan Interior 7.26
Gansu Interior 6.87
Urban 5.16
Source: Household survey data
The children of migrants living in urban areas face several problems in addition to poverty,one of the most serious being that of schooling. According to a 1997 survey of Beijing, themigrant population numbered 2.85 million, or 30 per cent of the formally registeredresidents, of whom 76.7 per cent were employed in Beijing. Of their children aged 6 to 15years, 14 per cent were unable to study in schools. Various reasons were given for non-attendance, including the high price of school fees (43 per cent) and because the parentsconsidered education useless (28 per cent) 3. In 1997 the Government had tried to restrictthe high fees collected by urban schools from families of migrant children, but with littleeffect. A 1998 survey shows that school fees paid by migrant families for their children inurban schools far exceed the fees paid by urban residents for the same education services. 4
However, because of the lack of reliable data, children of migrant populations are not dealtwith as a separate category in the following discussion.
3. Trends in Child Well-being
3.1. Child poverty5 in 1988, 1995 and 1999
Child poverty is measured by means of the poverty line established by the NBS for bothurban and rural areas: 2,159 RMB yuan for urban residents in current prices, and 1,511RMB yuan for rural residents. In general, the poverty line for urban China is far higher than 3 China population yearbook 19984 Urban survey organization, NBS 20005 Given the cross-country differences in socio-economic conditions, the measurement of child povertyremains an unsettled issue. Because of the lack of relevant research on child poverty in China, in thischapter we adopt per capita income as the index to measure child poverty. A better index is theequivalent income, but this has never been used by the NBS. Income per capita is used in this researchfor comparison with the official report on poverty. In addition, the economies of scale in consumptionare not very obvious in China5. Expenditure for a child in a poor family is not, in general, much smallerthan that for an adult. It is clear that income levels or economic indicators are not the only measures ofchild well-being. In the following section, social indices are also discussed.

CHAPTER 7: CHILD WELL-BEING IN CHINA IN THE ERA OF ECONOMIC REFORMS
10
the international poverty line, whereas the poverty line for rural areas is far lower, e.g. abouttwo-thirds of the international poverty line according to a World Bank estimate. Because ofthe non-existence of child poverty data for 1978-1985 and the lack of existing researchresults on child poverty in China, we confine our discussion to the years of 1988, 1995 and1999, for which data are available.
Table 4 gives the estimates of head count poverty index for both rural and urban areas. Datashow that the incidence of child poverty in urban areas fell from 24.4 per cent in 1988 to 6.6per cent in 1999. Using the alternative urban poverty line comparable to rural poverty line(see above), the incidence of urban poverty among children decreased from 6.7 per cent in1988 to 1.9 per cent in 1999. Overall, these data show that the child poverty ratedecreased in both rural and urban areas from 1988 to 1999.
Table 4. Trends in child poverty over 1988, 1995 and 1999
Child poverty 1988 1995 1999
Rural Poverty Rate 14.2 11.1 5.1
Urban Poverty Rate
High line 24.4 9.9 6.6
Low line 6.7 3 1.9
Source: Household survey data 1988, 1995 and 1999
While per capita income in rural areas grew by 55 per cent, the Gini coefficient alsoincreased, from 0.305 to 0.336. In urban areas, the disposable per capita income increasedby 98 per cent, and the Gini coefficient rose from 0.230 to 0.295. Because of the hugedifference between rural and urban income levels, income discrepancy between the twosegments of the population ensured that the Gini coefficient at the national level becamemuch higher by the end of the 1990s. In fact, nationwide income distribution became farmore unequal (see chapter 4).
The uneven development of different regions indicates that poverty has become increasinglyconcentrated in the western part of rural China where about one-fifth of the population live.However, in 1988, this area accounted for one third of the total poverty in the country, risingto more than half in 1995. In 1998, an average person in the rural west was around threetimes more likely to be poor than a person in the east. By 1995, they were six times morelikely to be poor. The same held true for children.
- Features of child poverty. One of the main features of child poverty in China is itsuneven spatial distribution, and the most notable dividing line is between coastal and interiorregions. The coastal region has experienced far more rapid economic growth and incomeincrease than the interior region, leaving a strong mark on the overall picture of povertydistribution. As Table 5 shows, the poverty rate can be so low as to be negligible in someprovinces in the coastal region, such as Beijing and Jiangsu province. For Liaoning province,which has benefited from globalization with some foreign investment and, at the same time,

HARNESSING GLOBALISATION FOR CHILDREN: A report to UNICEF
11
suffered from globalization with the recession in state owned enterprises, poverty is relativelyhigher. However, it is still lower than in interior provinces that are less affected byglobalization. Within rural areas, the regional difference is even clearer. Children living in theinterior rural region are 2.5 times more likely to be poor than children living in the coastalrural region (Table 6).
Table 5. Child poverty index in urban areas of coastal and interior provinces
Province Region Child Poverty Rate
Liaoning Coastal 6.34
Jiangsu Coastal 1.07
Beijing Coastal 0.00
Henan Interior 11.27
Sichuan Interior 8.01
Gansu Interior 8.64
Total 6.60Source: Household survey data 1999
Table 6. Children poverty index in rural areas of coastal and interior provinces
Region Child poverty rate
Coastal 2.45
Interior 6.29
Rural 5.15
Source: Rural Survey Data 1999
The difference in poverty rates between genders has not been large compared to otherindicators. In the countryside, no obvious gender difference in poverty rates has beenobserved. However, this may not tell the whole story, because the poverty rate based onhousehold surveys does not reveal the structure of the families interviewed.
Table 7. Poverty rate by region and gender
Urban Region Rural Region
Gender Proportion of
sample
Child Poverty Rate Proportion of
sample
Child Poverty Rate
Male 50.45 6.21 52.20 5.19
Female 49.55 6.61 47.80 5.11
Total 100.00 6.41 100.00 5.15Source: Household survey data 1999 and Rural survey data 1999
CHAPTER 7: CHILD WELL-BEING IN CHINA IN THE ERA OF ECONOMIC REFORMS
12
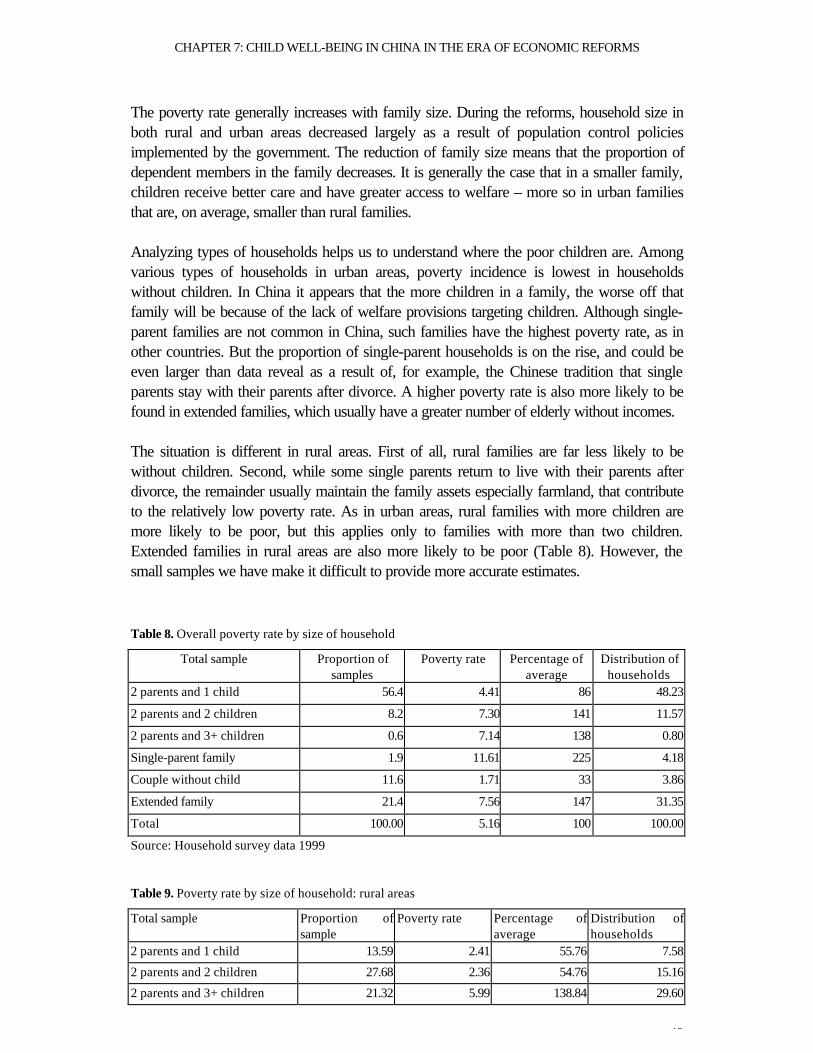
The poverty rate generally increases with family size. During the reforms, household size inboth rural and urban areas decreased largely as a result of population control policiesimplemented by the government. The reduction of family size means that the proportion ofdependent members in the family decreases. It is generally the case that in a smaller family,children receive better care and have greater access to welfare – more so in urban familiesthat are, on average, smaller than rural families.
Analyzing types of households helps us to understand where the poor children are. Amongvarious types of households in urban areas, poverty incidence is lowest in householdswithout children. In China it appears that the more children in a family, the worse off thatfamily will be because of the lack of welfare provisions targeting children. Although single-parent families are not common in China, such families have the highest poverty rate, as inother countries. But the proportion of single-parent households is on the rise, and could beeven larger than data reveal as a result of, for example, the Chinese tradition that singleparents stay with their parents after divorce. A higher poverty rate is also more likely to befound in extended families, which usually have a greater number of elderly without incomes.
The situation is different in rural areas. First of all, rural families are far less likely to bewithout children. Second, while some single parents return to live with their parents afterdivorce, the remainder usually maintain the family assets especially farmland, that contributeto the relatively low poverty rate. As in urban areas, rural families with more children aremore likely to be poor, but this applies only to families with more than two children.Extended families in rural areas are also more likely to be poor (Table 8). However, thesmall samples we have make it difficult to provide more accurate estimates.
Table 8. Overall poverty rate by size of household
Total sample Proportion ofsamples
Poverty rate Percentage ofaverage
Distribution ofhouseholds
2 parents and 1 child 56.4 4.41 86 48.23
2 parents and 2 children 8.2 7.30 141 11.57
2 parents and 3+ children 0.6 7.14 138 0.80
Single-parent family 1.9 11.61 225 4.18
Couple without child 11.6 1.71 33 3.86
Extended family 21.4 7.56 147 31.35
Total 100.00 5.16 100 100.00
Source: Household survey data 1999
Table 9. Poverty rate by size of household: rural areas
Total sample Proportion ofsample
Poverty rate Percentage ofaverage
Distribution ofhouseholds
2 parents and 1 child 13.59 2.41 55.76 7.58
2 parents and 2 children 27.68 2.36 54.76 15.16
2 parents and 3+ children 21.32 5.99 138.84 29.60
HARNESSING GLOBALISATION FOR CHILDREN: A report to UNICEF
13
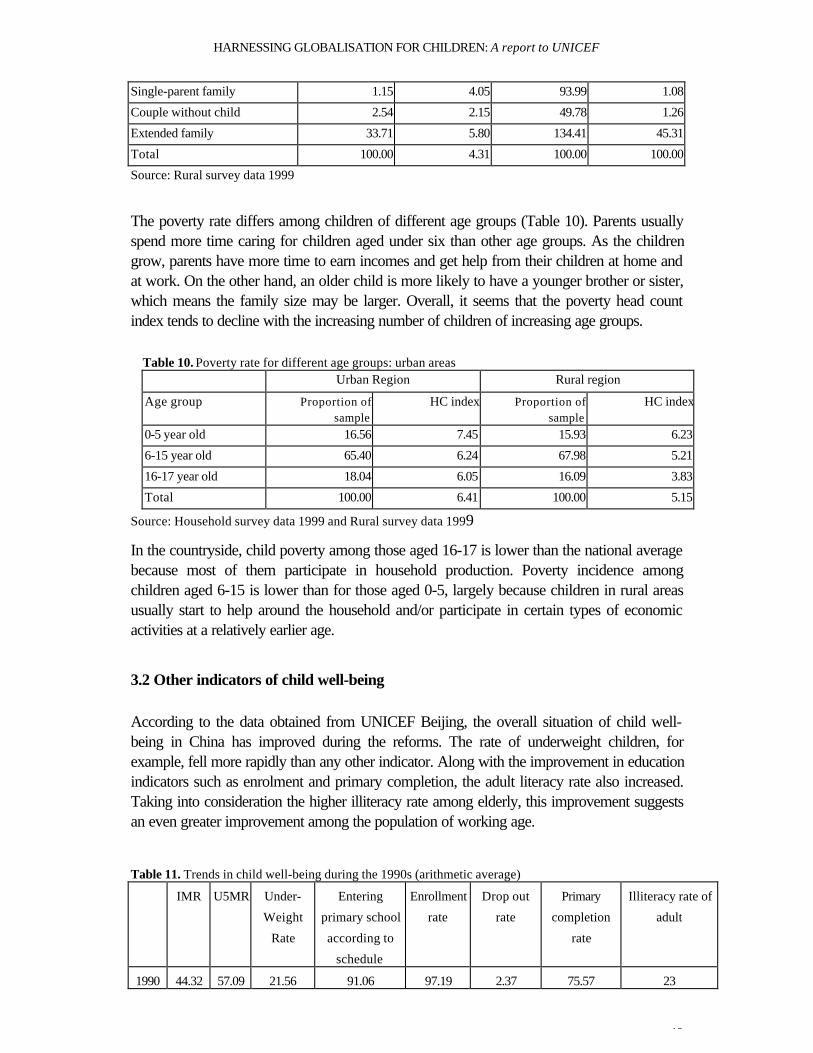
Single-parent family 1.15 4.05 93.99 1.08
Couple without child 2.54 2.15 49.78 1.26
Extended family 33.71 5.80 134.41 45.31
Total 100.00 4.31 100.00 100.00
Source: Rural survey data 1999
The poverty rate differs among children of different age groups (Table 10). Parents usuallyspend more time caring for children aged under six than other age groups. As the childrengrow, parents have more time to earn incomes and get help from their children at home andat work. On the other hand, an older child is more likely to have a younger brother or sister,which means the family size may be larger. Overall, it seems that the poverty head countindex tends to decline with the increasing number of children of increasing age groups.
Table 10. Poverty rate for different age groups: urban areasUrban Region Rural region
Age group Proportion ofsample
HC index Proportion ofsample
HC index
0-5 year old 16.56 7.45 15.93 6.23
6-15 year old 65.40 6.24 67.98 5.21
16-17 year old 18.04 6.05 16.09 3.83
Total 100.00 6.41 100.00 5.15
Source: Household survey data 1999 and Rural survey data 1999
In the countryside, child poverty among those aged 16-17 is lower than the national averagebecause most of them participate in household production. Poverty incidence amongchildren aged 6-15 is lower than for those aged 0-5, largely because children in rural areasusually start to help around the household and/or participate in certain types of economicactivities at a relatively earlier age.
3.2 Other indicators of child well-being
According to the data obtained from UNICEF Beijing, the overall situation of child well-being in China has improved during the reforms. The rate of underweight children, forexample, fell more rapidly than any other indicator. Along with the improvement in educationindicators such as enrolment and primary completion, the adult literacy rate also increased.Taking into consideration the higher illiteracy rate among elderly, this improvement suggestsan even greater improvement among the population of working age.
Table 11. Trends in child well-being during the 1990s (arithmetic average)
IMR U5MR Under-
Weight
Rate
Entering
primary school
according to
schedule
Enrollment
rate
Drop out
rate
Primary
completion
rate
Illiteracy rate of
adult
1990 44.32 57.09 21.56 91.06 97.19 2.37 75.57 23

CHAPTER 7: CHILD WELL-BEING IN CHINA IN THE ERA OF ECONOMIC REFORMS
14
1995 34.49 42.43 10.15 94.84 97.39 1.68 85.13 17
1996 32.84 39.49 8.60 93.90 98.04 1.64 88.32 18
1997 31.59 38.38 6.57 94.10 95.28 1.15 87.88 16
1998 29.39 36.34 5.46 94.15 98.13 1.13 89.10 16
1999 26.13 32.76 4.79 94.30 98.56 1.12 89.95 15Source: UNICEF Beijing Office
- child health and mortality. Since 1949, the Chinese government has made great effortsto develop health care facilities for children. In 1949, there were only five childcarehospitals, with a total of 139 hospital beds. In 1998, the number of children’s hospitalsincreased to 37 with 9,808 hospital beds, and there were around 60,000 pediatricians. Inaddition, there were more than 15,000 departments of Maternal and Child Health as well asa department of pediatrics in every general hospital at or above the county level. Since1979, the government has implemented the nationwide immunization plan for children. In1997, the inoculation rate for BCG and DPT was 96 per cent; MV stood at 95 per cent,and OPT at 97 per cent. According to data on IMR, U5MR and the underweight rate,which collectively form a standard measurement of the health status of children, theimprovement is obvious taking China as a whole (Table 12). However, regional disparityremains shockingly large.
Table 12. Health indicators for children of different regions in selected years
IMR U5MR Underweight rate
1990 1995 1999 1990 1995 1999 1990 1995 1999
East 28.2 24.1 17.1 33.8 28.0 20.9 7.7 5.3 2.1
Middle 39.9 32.8 24.1 55.2 40.6 28.8 20.0 10.6 4.5
West 66.5 44.3 36.8 87.7 55.7 47.9 23.0 14.1 8.0
Nationwide 44.3 34.5 26.1 57.1 42.4 32.8 17.6 10.2 4.8Source: UNICEF Beijing Office
- School enrolments and educational attainments. Measured by all major indicators,education statistics for children have improved during the reforms. (Tables 13 and 14). Bythe end of the 1990s, virtually all primary school-aged children were able to enrol in schools.But again, regional differences are easy to detect, especially in relation to rates for drop outand school completion. Children living in the West have less chance to finish primary schooleducation. Unfortunately, these data do not tell us about the quality of education. In fact,children living in the poor areas are less likely to receive quality education even if they areenrolled in schools.
Table 13. Entrance rate and enrolment rate in different regions
Entering primary school according to
schedule
Enrolment rate
1990 1995 1999 1990 1995 1999
East 93.80 98.88 96.89 99.12 99.57 99.79
Middle 92.66 94.11 93.91 98.13 99.73 99.41

HARNESSING GLOBALISATION FOR CHILDREN: A report to UNICEF
15
West 85.55 91.86 92.02 94.21 93.70 96.65
Nationwide 91.06 94.84 94.30 97.19 97.39 98.56Data source: UNICEF Beijing Office
Table 14. Drop out rate and primary completion rate in different regions
Drop out rate Primary school completion rate
1990 1995 1999 1990 1995 1999
East 1.28 0.67 0.59 87.70 95.48 95.86
Middle 2.10 1.20 0.64 78.18 87.57 93.19
West 3.79 2.99 1.96 59.78 73.61 80.52
Nationwide 2.37 1.67 1.12 72.24 85.13 89.95Data source: UNICEF Beijing Office
Compulsory education has been implemented since 1986, aiming to establish nine-yeareducation (six years of primary and 3 year junior middle school). But in China, compulsoryeducation does education that is free of charge. It is common that parents pay a certainportion of school fees in addition to covering all the cost of textbooks and other educationrelated personal expenses, from the first year of primary education onward. In rural areas,the average cost for primary school students varies, ranging from 100 to 200 RMB yuan peryear – no small amount for a poor household living below the poverty line.
For a great number of rural children living in relatively poor areas, secondary education ismore difficult to obtain. Education costs for junior middle school students are much higherthan that at primary level, having an adverse affect on both the enrolment rate and the dropout rate in secondary education. Poor families are generally unable to support their childrento go to the junior middle school and a rural child would be considered lucky to continueschooling after the nine-year compulsory education because of the high cost of senior middleschools, not to mention colleges and universities.
- Child labour. According to Chinese law, hiring young people under the age of 16 is illegal.In practice, however, a large number of children participate in paid work. The UNICEFBeijing Office estimates that around 4.7 million children in China aged 15 are working, orone quarter of all children in this age group, of which 56 per cent are girls6. Anecdotalreports and various observations confirm the existence of child labour among those below15 years of age. The practice of nine-year compulsory education has had some positiveeffect in this respect by keeping children in schools. With the increase of the schoolenrolment rate, especially in primary schools, children aged 15 and below are increasinglystaying in school, reducing the likelihood of child labour. In China, adolescents aged 16 or17 are considered as “semi- labour”7 in official statistics if they are not students and do nothave disabilities.
6 In UNICEF Beijing Office report, 2000.7 In the official published China Statistics Yearbook, the 16 to 17 year-old is defined as semi-labour if heor she is not in school and is not disabled.
CHAPTER 7: CHILD WELL-BEING IN CHINA IN THE ERA OF ECONOMIC REFORMS
16
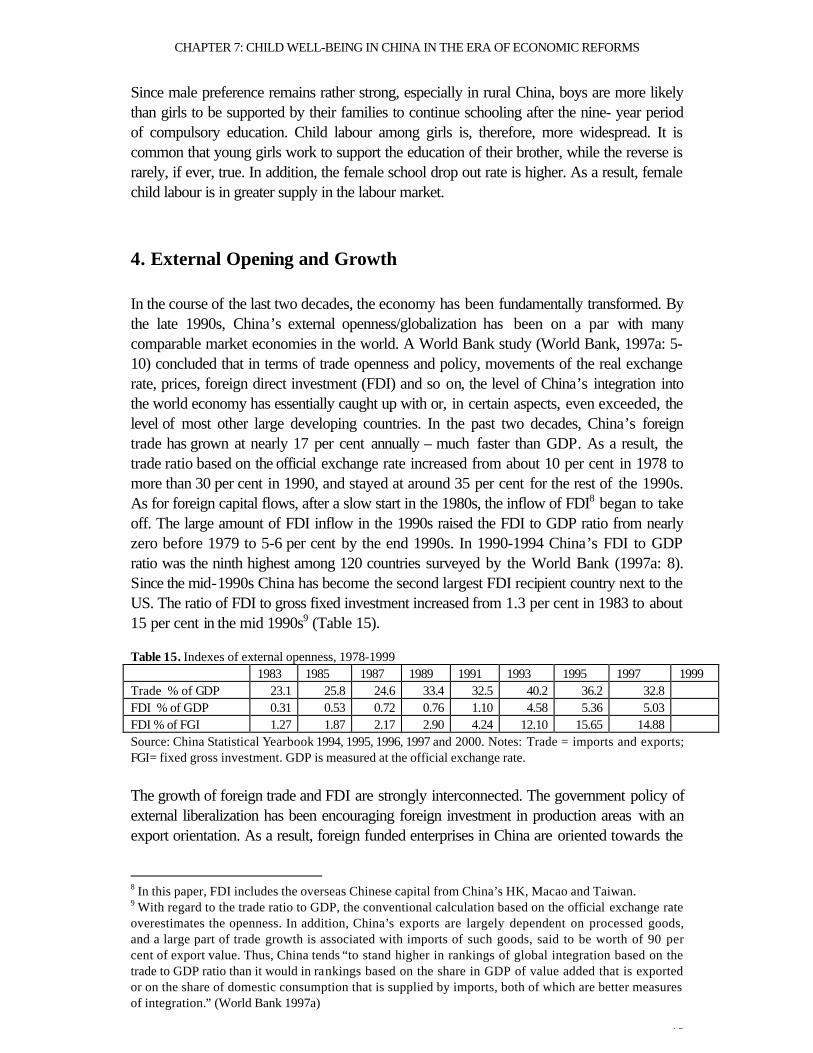
Since male preference remains rather strong, especially in rural China, boys are more likelythan girls to be supported by their families to continue schooling after the nine- year periodof compulsory education. Child labour among girls is, therefore, more widespread. It iscommon that young girls work to support the education of their brother, while the reverse israrely, if ever, true. In addition, the female school drop out rate is higher. As a result, femalechild labour is in greater supply in the labour market.
4. External Opening and Growth
In the course of the last two decades, the economy has been fundamentally transformed. Bythe late 1990s, China’s external openness/globalization has been on a par with manycomparable market economies in the world. A World Bank study (World Bank, 1997a: 5-10) concluded that in terms of trade openness and policy, movements of the real exchangerate, prices, foreign direct investment (FDI) and so on, the level of China’s integration intothe world economy has essentially caught up with or, in certain aspects, even exceeded, thelevel of most other large developing countries. In the past two decades, China’s foreigntrade has grown at nearly 17 per cent annually – much faster than GDP. As a result, thetrade ratio based on the official exchange rate increased from about 10 per cent in 1978 tomore than 30 per cent in 1990, and stayed at around 35 per cent for the rest of the 1990s.As for foreign capital flows, after a slow start in the 1980s, the inflow of FDI8 began to takeoff. The large amount of FDI inflow in the 1990s raised the FDI to GDP ratio from nearlyzero before 1979 to 5-6 per cent by the end 1990s. In 1990-1994 China’s FDI to GDPratio was the ninth highest among 120 countries surveyed by the World Bank (1997a: 8).Since the mid-1990s China has become the second largest FDI recipient country next to theUS. The ratio of FDI to gross fixed investment increased from 1.3 per cent in 1983 to about15 per cent in the mid 1990s9 (Table 15).
Table 15. Indexes of external openness, 1978-19991983 1985 1987 1989 1991 1993 1995 1997 1999
Trade % of GDP 23.1 25.8 24.6 33.4 32.5 40.2 36.2 32.8FDI % of GDP 0.31 0.53 0.72 0.76 1.10 4.58 5.36 5.03FDI % of FGI 1.27 1.87 2.17 2.90 4.24 12.10 15.65 14.88Source: China Statistical Yearbook 1994, 1995, 1996, 1997 and 2000. Notes: Trade = imports and exports;FGI= fixed gross investment. GDP is measured at the official exchange rate.
The growth of foreign trade and FDI are strongly interconnected. The government policy ofexternal liberalization has been encouraging foreign investment in production areas with anexport orientation. As a result, foreign funded enterprises in China are oriented towards the
8 In this paper, FDI includes the overseas Chinese capital from China’s HK, Macao and Taiwan.9 With regard to the trade ratio to GDP, the conventional calculation based on the official exchange rateoverestimates the openness. In addition, China’s exports are largely dependent on processed goods,and a large part of trade growth is associated with imports of such goods, said to be worth of 90 percent of export value. Thus, China tends “to stand higher in rankings of global integration based on thetrade to GDP ratio than it would in rankings based on the share in GDP of value added that is exportedor on the share of domestic consumption that is supplied by imports, both of which are better measuresof integration.” (World Bank 1997a)

HARNESSING GLOBALISATION FOR CHILDREN: A report to UNICEF
17
world market. The share of FDI enterprises in trade has increased rapidly and remainssubstantial. By the end of the 1990s, foreign funded enterprises accounted for nearly half ofChina’s total trade volumes (Table 16).
Table 16. Share of FDI-related imports and exports in the total, 1978-19991986 1988 1990 1992 1994 1996 1998 1999
Total trade 4.04 5.55 12.28 21.31 34.27 39.10 48.86(1-10)Imports 5.60 10.64 23.06 32.74 45.78 54.45 56.09Exports 1.88 5.18 12.58 20.44 28.69 40.71 43.52Source: MOFTEC: zhongguo waizi tongji (Ministry of Foreign Economic Relations and Trade: ChinaStatistics of Foreign Capital), 1998. (cf. Shen Kunrong, 1999: 18)
There is a broad agreement among scholars that the increase in external openness,unprecedented in the history of P.R.China has accelerated the growth experienced in theaftermath of the reforms. To a large extent the recent Chinese growth was export- and FDI-led (Table 3.3).
Table 17. Average annual growth rates %
1986-90 1991-95 1991-99GDP 7.9 12.0 10.4Primary industry 4.2 4.2 4.0Secondary industry 9.0 17.4 14.0Tertiary industry 9.4 10.0 9.2
Trade (imp.+ ex.) 10.6 19.5 13.5FDI (actually utilized) 17.2 36.1 19.9
Source: China Statistical Yearbook 2000
Numerous studies have suggested that greater openness plays a prominent role (WorldBank 1997a) among the factors that have a positive effect on growth such as education, highrate of investment financed by high domestic savings, physical infrastructure, and so on.External liberalization policies were quite successful in promoting trade and attractingadditional capital from abroad. The inflow of foreign investment has brought in thetechnology, management skills and other business know-hows that, through the spillovereffect and learning by doing, has played a positive role in raising total factor productivity andefficiency. Overall, there can be no denial that the rapid economic growth of the last 20years has benefited from the government policies of deregulation and external liberalization,which can be almost characterized as “single mindedly pro-growth approach”. The relativesuccess of these policies can also be attributed to other characteristics, mainly emphasizing agradual approach that allows the economy to avoid unnecessary shocks, long term foreigncapital investment rather than short term capital flow, and region-focused external openness.
4.1 Encouraging long term direct foreign investment
To encourage long term direct investment from abroad, the government has been selective inopening sectors and has employed financial, monetary and taxation tools at various stages(preferential policies in taxation, tariff, marketing, etc.). After 20 years of openness,however, the openness of the tertiary sector remained limited, while industries open to FDI

CHAPTER 7: CHILD WELL-BEING IN CHINA IN THE ERA OF ECONOMIC REFORMS
18
included almost every area in the primary and secondary sectors. As the country enters itsthird decade of reforms, the involvement of foreign capital in banking, insurance, and retailsales is still only at a limited and trial stage. Foreign capital has limited access to the domesticstock market (with the exception of specifically designed category B-shares).
During the reform period, FDI in China was mainly invested in the manufacturing sector. Bythe late 1990s, about 75 per cent of the total FDI was in industry, 23 per cent in services(mainly in real estate), and 1-3 per cent in the primary sector. Although the primary andservice sectors began to draw a greater proportion of foreign investment after 1997, thegeneral pattern of sectoral distribution of FDI has not changed.10
Compared to other developing countries, the sectoral pattern of FDI distribution in Chinahas certain unique features. First, the share of secondary sector in the total stock and inannual inflows of FDI is higher and, despite the faster growth of foreign investment intechnology and capital intensive manufacture in the 1990s, most foreign investment hasconcentrated on labour intensive processing and manufacturing, such as electronics, textiles,apparel, and other light industry products. Second, during the “real estate boom” in the early1990s, real estate took the largest portion, about two-thirds, of the total FDI in the tertiarysector. At the same time, and in contrast to other developing countries, FDI remains limitedin finance, insurance, commerce, trade, and information services. As mentioned above, thegovernment has yet to open these sectors to foreign investors. Third, the proportion of FDIin the primary sector is much lower than the average level in developing countries. As thecountryside in China continues to be dominated by small household farming on scattered andlimited land plots, agriculture remains unattractive to FDI.
4.2 Containing short-term capital flows
The government has, to date, shied away from freeing the exchange rate, and the Chinesecurrency remains unconvertible for capital accounts. During the Asian financial crisis in1997-98, this cautious approach was beneficial for the country, allowing it to avoideconomic volatility and to maintain stability and growth. The current pattern of foreign capitalinflow in China is such that the overwhelming part of it consists of long-term directinvestment.
Table 18 Structure of foreign capital inflows (actually utilized) in China %1985 1990 1995 1999
Loans 57.8 63.5 21.5 19.4FDI 35.7 33.9 77.9 76.6Other investment 6.4 2.6 0.6 4.0Source: China Statistical Yearbook 2000: 30
In the 1980s, the inflow of foreign capital was based on government credit guarantees andmainly took the form of loans. Indeed, loans accounted for 86 per cent of total foreigncapital in 1979-1982. In 1983-1985, although the proportion declined, the share of loans in
10 Calculated from zhongguo gongye fazhan baogao 1998 (China Industrial Development Report 1998),and zhongguo waizi tongji 1998 (China Statistics of Foreign Capital 1998), cf. Shen Kunrong 1999: 11)

HARNESSING GLOBALISATION FOR CHILDREN: A report to UNICEF
19
the total foreign capital inflow still accounted for 48 to 58 per cent. In 1986-1987 itincreased to 69 per cent. Entering the 1990s, especially since the acceleration of foreigncapital inflows in 1992-1993, the proportion of direct investment in total inflows grewrapidly, quickly surpassed loans, and became the dominant form of foreign capital inflow.
In the second half of 1997, the government took measures to counter the adverse impact ofthe Asian financial crisis. These measures included further reduction of tariffs on imports,opening new sectors for foreign investment (tourism and water transport, domesticcommerce, foreign trade, financial and communication sectors, etc.), adjustment of customduties on equipment imported by foreign funded enterprises, and other customs duty and taxrelief for foreign funded enterprises. These measures, to a large extent, helped to avoid alarge slide of FDI inflow into China after the Asian financial crisis.
4.3 Exchange rate policy as an instrument of export promotion
China has relied extensively on an undervalued exchange rate of its national currency topromote exports (Pomfret, 1997). The Bank of China purchased foreign currency to buildup its reserves, so that RMB remained very underpriced throughout the whole period ofreform. The ratio of Chinese foreign exchange reserves to GDP increased from 5 per cent in1980 to 16 per cent in 1998, while the ratio of reserves to monthly imports of goods andservices increased from 6 to 11 during the same period (World Bank, 2000b). For otherdeveloping countries, excluding those in East Asia, the ratio of reserves to GDP is typicallymuch lower (for the world as a whole it is only about 8 per cent).
As a result of these persistent efforts to keep the exchange rate low, Chinese domesticprices in dollar terms remained at a level of 20 to 25 per cent of US prices (for otherdeveloping countries this ratio is typically around 50 per cent), which in turn created obviousadvantages for Chinese exporters.
After the 1997 currency crises and devaluations in many Asian countries, China promisednot to devalue its currency. Such a stand was based on political rather than economicconsiderations. China tried to avoid competitive devaluations, which would make it evenmore difficult for other East Asian countries to endure the storm, even though the policy ofstable yuan involved obvious costs – in 1998 the rates of growth of Chinese exportsdropped from double-digits to zero. In 1999-2000, however, the strong growth of exportsresumed.
4.4 Promoting trade in processed and manufactured goods
In order to promote trade and investment, in 1984 the government allowed duty-free importof components and raw materials for use in export-oriented industries. This policy provideda powerful push to export-oriented processing industries. By 1991, the share of processedexports increased to 45 per cent of merchandise exports (Lardy 1994. table 5.1). Since theearly 1990s, similar policies combined with other preferential treatment have been offered toFDI, which further contributed to the accelerated growth of exports of manufactured andprocessed products. (table 3.5).

CHAPTER 7: CHILD WELL-BEING IN CHINA IN THE ERA OF ECONOMIC REFORMS
20
Table 19 Structure of external trade, % of total1985 1990 1995 1999
ExportsPrimary goods 50.6 25.6 14.4 10.2Manufactured goods 49.4 74.4 85.6 89.8
ImportsPrimary goods 12.5 18.5 18.5 16.2Manufactured goods 87.5 81.5 81.5 83.8Source: China Statistical Yearbook 2000: 31
4.5 East and coastal region: bias in the openness policy
The government’s external liberalization policy has been deliberately biased in favour of eastand coastal provinces. It can be said that open-door policies actually began with theestablishment of Special Economic Zones. Located in the southeastern coast across HongKong, Taiwan and Macao, the SEZs were set up to attract overseas capital and to test aseries of other external liberalization policies for possible implementation later in otherregions. Most of the openness policies proved to be successful, and were then eventuallyadopted by other regions along the east coast. Taking advantage of the coastal location andbetter physical infrastructure, the east part of China has benefited enormously fromopenness, and the development of the coastal cities and provinces has, in turn played a keyrole in China’s growth.
FDI has concentrated on the east coastal region, and moved only very slowly to the inlandand western regions. Similarly, eastern coastal regions have produced a large proportion ofChina’s exports. Not surprisingly, Guangdong and Fujian, where the first four SEZs werelocated, have topped others in terms of attracting FDI and export growth. In the late 1990s,the government began to pay particular attention for the development of the western regionsand even adopted a special programme of the development of western provinces. As aresult, FDI in the central and western regions increased somewhat, but, overall, the regionaldisparities have not narrowed down. Guangdong province alone originally took more thanhalf of the total FDI in China, and in 1997 it was still absorbing one quarter of total FDI.
Overall, even this brief review of the external liberalization policies shows that China hasbeen relatively successful in pursuing external openness. By implementing deregulation andexternal liberalization policies selectively and in preferred sequence, the government has to alarge extent managed to stimulate and maintain rapid economic growth. It is this rapideconomic growth in the past 20 years that raised the overall income of the population,including the poor.
5. External Liberalization Policies, Income Inequality, andPoverty
While having positive effects on growth, external openness in China has also had an impacton poverty by affecting income distribution. But the extent to which external liberalization has

HARNESSING GLOBALISATION FOR CHILDREN: A report to UNICEF
21
contributed, either positively or negatively, or both, to poverty reduction is not a clear-cutissue. The Chinese experience suggests that growth, while being a crucial precondition forthe elimination of poverty, is far from being a sufficient condition. One may even concludethat growth does not automatically reduce poverty without effective and focused anti-poverty measures.
Studies have shown that economic growth in the last four decades in 80 developingcountries in general was good for the poor: increases in average income have led toincreased incomes for the poor on an individual basis (cf. Dollar and Kraay, 2000). Butthere were large variations across countries and periods, and in China the story of the lasttwo decades seems less encouraging. First, in 1986, income inequalities in China started toincrease markedly, undermining the poverty reduction effect of growth of average income.Large parts of the Chinese population – in western/inland provinces, in rural areas, andespecially in rural agricultural (i.e. not industrial) production – did not experience a rise intheir living standards corresponding to rapid growth. Second, there emerged social groupsof the “new poor”, such as the unemployed in the urban areas, who do not have regularincome, and peasants in some rural areas who rely solely on income derived from farmingand for whom the growth of agricultural production no longer results in correspondingincreased incomes. These “new poor” are increasingly excluded from the growth process.
5.1 Uneven progress of poverty reduction over time
As discussed previously, the most remarkable progress in poverty reduction occurred in1978-1985, when the population in poverty – 250 million in 1978 – was halved in justseven years. In 1986-1993, however, progress slowed and, in some years, reversed,although the overall poverty population fell by some 40 million, to 80 million. To eliminateremaining poverty in 1994-2000 as planned by the government proved to be difficult.
The hugely uneven dynamics of poverty reduction (in terms of absolute number of peoplelifted from poverty each year) in the midst of continuous growth is most closely associatedwith the change of inequality. Before its reforms, China was known as a society of low-income inequality, where people lived a life “poor but equal”. This is no longer the case.Various studies, regardless of the measurement employed, conclude that inequality has beengrowing fast during the reforms. Today, the Gini coefficient in China stands at anunacceptably high level – 0.458.
Growth, however, was not always accompanied with increasing inequality during thereforms. Prior to the mid-1980s, rapid economic growth took place with no obvious rise ininequality. In 1981-1984, mean incomes increased by 12.6 per cent a year in real terms,while the Gini coefficient increased only very slightly, from 0.288 to 0.297. Unfortunatelythis pattern of growth did not continue, and the following years saw the persistent and rapidrise of inequality alongside growth. A World Bank study has characterized the post 1985growth pattern as “growth with inequality”, as opposed to the previous pattern of “growthwith equality” (World Bank, 1997b: 10). To state it plainly, increasing income inequalityexplains, to a large extent, the slow-down in poverty reduction after the mid 1980s.

CHAPTER 7: CHILD WELL-BEING IN CHINA IN THE ERA OF ECONOMIC REFORMS
22
Growth with equality was the result of the initial reforms before the mid-1980s. Theintroduction of the household responsibility system, which unleashed rural productivity,coupled with the substantial increase of agricultural product prices brought about aremarkable improvement of the living standards of peasants, who were, and still are, thelarge majority of the population. This process has been well documented in studies ofChina’s economic reforms. Poverty in China was, and is, largely a rural phenomenon, andrural income growth up to the mid 1980s was the primary precondition for the mostremarkable poverty reduction in the reform era.
It is difficult to associate the earlier progress of poverty reduction with externalopenness/globalization. External liberalization was in its infancy and had yet to produce anysignificant effect on income or inequality during this period. Neither trade nor the overalleconomy had much involvement with foreign capital. It was not until the late 1980s thatindustrial reform started to change the landscape of urban economic development, and itwas not until the early 1990s that the open door policy finally brought substantial inflows offoreign capital. In this period growth was sustained, income inequality increasedsubstantially, and poverty reduction continued to progress but not on the scale achieved in1978-1985.
5.2 Urban-rural and east-west divide
A number of factors have contributed to increased inequality. Two of the major factors arethe widening gap between rural and urban incomes, and the disparities between coastal andinterior regions.
From the early to the mid 1980s the rural-urban income gap narrowed. The best reductionof rural-urban income inequality was seen in this period and has never been repeated since.Since the early 1990s, for example, the rural-urban income divide has grown ever faster,and has now reached a level rarely seen in post-1949 history. (table 4.1)
Table 20 Household consumption RMB yuanYears All hhs Rural hhs Urban hhs Ratio (rural=1)
1978 184 138 405 2.91980 236 178 496 2.81985 437 347 802 2.31987 550 417 1089 2.61990 803 571 1686 3.01992 1070 718 2356 3.31994 1746 1118 3891 3.51996 2641 1768 5430 3.11998 2972 1895 6217 3.31999 3143 1918 6750 3.5Source: China Statistical Yearbook 2000: 70
Other measurements, such as per capita income or per capita consumption, show similarresults. The general trend of widening rural-urban income gap is unmistakable (cf. Knightand Song 1999; Cai Fang and Yang Tao 2000, for detailed analysis)

HARNESSING GLOBALISATION FOR CHILDREN: A report to UNICEF
23
At the same time, the disparities between the coastal and interior regions have beenwidening (World Bank, 1997b; CSY 2000), and interprovincial differences within eachregion are also very large. In 1997, seven provinces and provincial cities had per capitaGDP of more than 10,000 RMB yuan, in which Shanghai was on the top with 28,253 RMByuan, whereas 13 provinces had per capita GDP below 5,000 RMB yuan, includingGuizhou at the bottom with only 2,342 RMB yuan. (CSY 1998: 65) A sizeable proportionof the population lives in low per capita income provinces. A recent study divided China notinto the usual three regions of advanced east and the lagging central and backward west, butinto four ‘worlds’.11 It was reported that about a half of the Chinese population live in the“fourth world”, consisting mostly of the poorest, minority-concentrated, rural and peripheralareas in central and western China. The level of income in this group was below the poorestcountries in the world. Another recent study suggests that the time difference of provincesand provincial-level-cities being “modernized” is as large as 70 years, with Shanghai andBeijing likely to be the first in 2015 and 2018 respectively, and Guizhou and Tibet the last in2070 and 2090 respectively, more than 50-70 years later.12
The causes of growing rural-urban and regional disparities are numerous. Initial conditions,natural and human resources, and government policies have all favoured rapid growth incoastal and urban areas over the interior and rural areas. Various reform and opennesspolicies have been influential in shaping growth and distribution patterns. First, internalderegulation and the transition to a market-oriented economy. This began to allocateresources in a way that means returns become more responsive to natural and human capitalcomparative advantages. Second, the government’s external liberalization has intentionallyfavoured coastal and urban areas, by providing them with preferential treatment in foreigntrade and investment. Third, the fiscal system has been decentralized and theintergovernmental fiscal transfer scheme considerably weakened. The second and thirdpolicy changes have led to the narrowing of access to social services in the poorer provincesand regions because of lower revenue. The regional development pattern is the result ofthese policies. Over the reform period, east and coastal areas have become loci of rapid andwidespread growth of Township and Village enterprises (TVEs), booming manufacturing forexport, and concentrated foreign investment. (table 4.2)
Table 21 Regional structure of FDI in China before 1997 – percentageNumbers of projects Contracted FDI Actual FDI
East 82.1 88.5 88.0Middle 12.9 7.8 8.7West 5.0 3.7 3.3East: 12 provinces and cities of Beijing, Tianjin, Hebei, Liaoning, Shanghai, Jiangsu, Zhejiang, Fujian,Shandong, Guangdong, Hainan, Guangxi.Middle: 9 provinces of Shanxi, Inner Mongolia, Jilin,Heilongjiang, Anhui, Jiangxi, Henan, Hubei, and Hunan.West: 10 provinces and cities of Sichuan,Chongqing, Guizhou, Yunnan, Shannxi, Gansu, Qinghai, Ningxia, Xinjiang, and XizangSource: waijingmao bu: waizi tongji, 1998. from Shen Kunrong 1999, p.16
11 . Hu Angang, 2001: diqu yu fazhan: xibu kaifa xin zhanlue. (check)12 Chinese Academy of Sciences: “2001 nian zhongguo kechixu fazhan zhanlue baogao”, reported inBeijing Qingnianbao, March 2, 2001
CHAPTER 7: CHILD WELL-BEING IN CHINA IN THE ERA OF ECONOMIC REFORMS
24
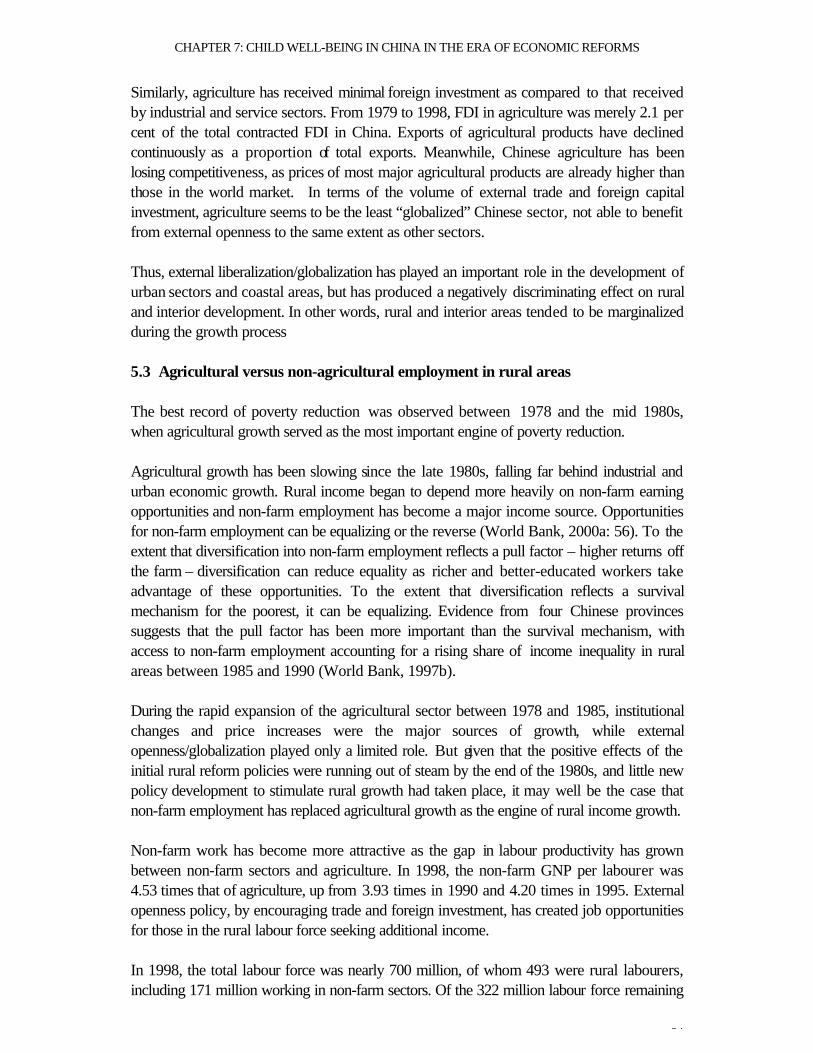
Similarly, agriculture has received minimal foreign investment as compared to that receivedby industrial and service sectors. From 1979 to 1998, FDI in agriculture was merely 2.1 percent of the total contracted FDI in China. Exports of agricultural products have declinedcontinuously as a proportion of total exports. Meanwhile, Chinese agriculture has beenlosing competitiveness, as prices of most major agricultural products are already higher thanthose in the world market. In terms of the volume of external trade and foreign capitalinvestment, agriculture seems to be the least “globalized” Chinese sector, not able to benefitfrom external openness to the same extent as other sectors.
Thus, external liberalization/globalization has played an important role in the development ofurban sectors and coastal areas, but has produced a negatively discriminating effect on ruraland interior development. In other words, rural and interior areas tended to be marginalizedduring the growth process
5.3 Agricultural versus non-agricultural employment in rural areas
The best record of poverty reduction was observed between 1978 and the mid 1980s,when agricultural growth served as the most important engine of poverty reduction.
Agricultural growth has been slowing since the late 1980s, falling far behind industrial andurban economic growth. Rural income began to depend more heavily on non-farm earningopportunities and non-farm employment has become a major income source. Opportunitiesfor non-farm employment can be equalizing or the reverse (World Bank, 2000a: 56). To theextent that diversification into non-farm employment reflects a pull factor – higher returns offthe farm – diversification can reduce equality as richer and better-educated workers takeadvantage of these opportunities. To the extent that diversification reflects a survivalmechanism for the poorest, it can be equalizing. Evidence from four Chinese provincessuggests that the pull factor has been more important than the survival mechanism, withaccess to non-farm employment accounting for a rising share of income inequality in ruralareas between 1985 and 1990 (World Bank, 1997b).
During the rapid expansion of the agricultural sector between 1978 and 1985, institutionalchanges and price increases were the major sources of growth, while externalopenness/globalization played only a limited role. But given that the positive effects of theinitial rural reform policies were running out of steam by the end of the 1980s, and little newpolicy development to stimulate rural growth had taken place, it may well be the case thatnon-farm employment has replaced agricultural growth as the engine of rural income growth.
Non-farm work has become more attractive as the gap in labour productivity has grownbetween non-farm sectors and agriculture. In 1998, the non-farm GNP per labourer was4.53 times that of agriculture, up from 3.93 times in 1990 and 4.20 times in 1995. Externalopenness policy, by encouraging trade and foreign investment, has created job opportunitiesfor those in the rural labour force seeking additional income.
In 1998, the total labour force was nearly 700 million, of whom 493 were rural labourers,including 171 million working in non-farm sectors. Of the 322 million labour force remaining

HARNESSING GLOBALISATION FOR CHILDREN: A report to UNICEF
25
in agriculture, 140 million were estimated as surplus. A large number of rural surpluslabourers are jobseekers outside villages at any given time. A considerable number of rurallabourers, mostly the young, are employed by export- oriented, labour-intensive, processingfactories especially those funded by capital from Hong Kong and Taiwan.
The contributions of small and medium-sized enterprises to growth and employment havebeen particularly significant. These enterprises currently account for over 90 per cent of thetotal number of enterprises, 60 per cent of total industrial output value, 40 per cent of totalprofits, 60 per cent of total exports, and 75 per cent of employment in urban areas. Inaddition, 80 per cent of rural labour working in non-farm sectors has been employed bythese enterprises. The advantage of small and medium-sized enterprises, especially in jobcreation, is well known. In the past 20 years, export-oriented processing and the flow ofFDI has boosted the expansion of small and medium-sized enterprises, which, in turn, havebecome an important source of employment.
Township and Village enterprises13 have accounted for a large number of small and medium-sized enterprises. In absolute numbers, employment in TVEs increased by about sevenmillion annually in the 1980s and about four million annually between 1991 and 1998. Butsince 1997, the labour force of TVEs has actually shrunk. Overall, the transformation offarm labour into wage earners has made a great contribution to rural income. (tables 4.3-4.5)
Table 22 Contribution of factors to the growth of rural income, 1978-97, % of totalTotal increased agricultural output value 26.44Increased purchasing prices of farm and sideline products 32.84Rise in number of rural labourers engaged in non-farm industries 35.07Other factors 5.65Source: Li Zinai, 2000: 33
Table 23 Structure of per capita net income of rural households1985 1990 1995 1998 1999
Productive income 367.7 657.4 1479.5 2039.6 2078.6Primary sector 298.3 510.9 996.5 1237.4 1180.0Secondary sector 29.5 70.7 287.2 498.9 564.3Tertiary sector 40.0 75.8 195.7 303.2 334.3Nonproductive income 29.9 29.0 98.3 122.4 131.7Source: China Statistical Yearbook 2000: 331
Table 24 Sources of rural income growth, 1997-1999
13 TVEs’ remarkable emergence and development during the reforms has been discussed widely (cf. Cheand Qian, 1998; Perotti, Sun and Zou, 1999; Wu and Cheng, 1999). In 1998, TVEs accounted for 61 percent of the increase of rural production, 28 per cent of total industrial output, 32 per cent of rural income,46 per cent of the increase in industrial production, and 35 per cent of export. (Reported by Bureau ofTVEs, Ministry of Agriculture, Dec. 7, 2000). By the late 1990s, employment in TVEs stood at 100 million.Since the beginning of reforms and before 1996, the growth rate of TVEs was more than 20 per centannually on average and over 40 per cent in some years, with two peak periods of 1984-1988 and 1992-1996. The annual growth rate of TVE employment was 12.4 per cent in the 1980s and 3.9 per cent in the1990s, or an average yearly growth of 7.7 per cent in the period of 1978-1998. (nonyebu ketizu , 2000)

CHAPTER 7: CHILD WELL-BEING IN CHINA IN THE ERA OF ECONOMIC REFORMS
26
1997 1998 1999Increase of per capita rural income, yuan 164 72 48Of whichfrom agriculture, yuan 73 -28 -53% 44.5 -38.9 -110.4
from non-farm, yuan 91 100 101% 54.5 139 210Source: from Sheng Laiyun, 2000: 7
5.4 The urban poor
Urban unemployment began to emerge following the restructuring of state ownedenterprises. By the end of the 1990s, an estimated 10 million urban workers had lost theirjobs. This resulted in income and welfare losses and urban poverty. According to aconservative estimate, by the end of the 1990s the number of urban residents living belowthe subsistence level was as high as 12 to 15 million. (CASS ketizu, 2000).
The emerging and growing poor population in the cities is a relatively new phenomenon,caused largely by unemployment. To be sure, increasing urban unemployment goes hand inhand with a substantial increase of wage labour as a proportion of all labour in thecountryside. Due to the rapid increase of wage labour, the overall labour force engaged innon-farm sectors has increased. From 1980 to 1998, while the proportion of the urbanlabour force in the total labour force increased from 25 to 30 per cent, that of the non-agricultural labour force increased from 31 to 50 per cent.14 The problem is that the increaseof the general size of wage labour is accompanied with job losses during the downsizing ofthe state owned enterprises, which accelerated after the mid 1990s. Such an industrialrestructuring under the name of “reducing employment and increasing efficiency” has pusheda large number of families of urban workers into, or close to the edge of, poverty.
14 xin zhongguo wushi nian tongji ziliao huibian (Statistics of Fifty Year Record of New China)

HARNESSING GLOBALISATION FOR CHILDREN: A report to UNICEF
27
6 Social Policies Affecting Child Wellbeing
Needless to say, the dynamics of poverty and the living conditions of the poor areassociated not only with government economic policies, but also with government socialpolicies. Overall, the Chinese government policies during market transition are clearlyfocused on growth and seem to be successful for this purpose so far. The same can hardlybe said with regard to its social policies. The record of child poverty reduction and theoverall welfare changes suggest that, in general, social policies have not been pursued withthe vigour necessary to address the issue of inequality. It has not, therefore, been able tosustain the broadly based growth pattern that emerged in the early stage of the reforms.
Market transition and external openness have been altering the institutions that supported theoperation of the previous centrally planned economy and the accompanying socialprovisions. With these institutions transformed, the government has been trying to fill theemerging vacuum. In particular, among the unprecedented number of pieces of legislationsthat have been adopted and put into effect, some are directly associated with the welfare ofchildren: the Law of Compulsory Education effected in 1986, the 1991 Law of Protection ofMinors and the 1994 Labour Law. These laws specify the rights of children and require thegovernment to protect them. According to these laws, all children over the age of six orseven should go to school and receive nine-year compulsory education with free tuition. It isprohibited to employ children under the age of 16 and, for those who do not continueeducation after finishing nine years of compulsory schooling, governments as well as varioussocial organizations and enterprises should provide (in accordance with actual situation)professional and skills training, helping them to prepare for employment; health organizationsand schools should provide children with necessary health care and carry out diseaseprevention work; and so on.
The irony is that while more and more laws are created, they are rarely put into practice.And when they are implemented, they often lag behind the problems that are emerging in arapidly changing social landscape. In a number of areas, the social safety net that existedbefore the reforms, when China was a centrally planned economy, actually deteriorated(access to health care and higher education for the poor, for instance). In other areas, thegovernment was not swift enough to adopt new programmes intended to deal with newsocial problems emerging from the transition itself (unemployment insurance is an obviousexample).
Overall, the spending of Chinese governments at all levels (national, provincial, and local)declined dramatically during the period of reforms. It has been said that cuts occurredmostly at the expense of defence, subsidies and budgetary financed investment, whileexpenditure for "ordinary government" as a percentage of GDP remained largely unchanged(Naughton, 1997). But government spending for social purposes as a percentage of GDPhas also declined substantially since the mid-1980s.
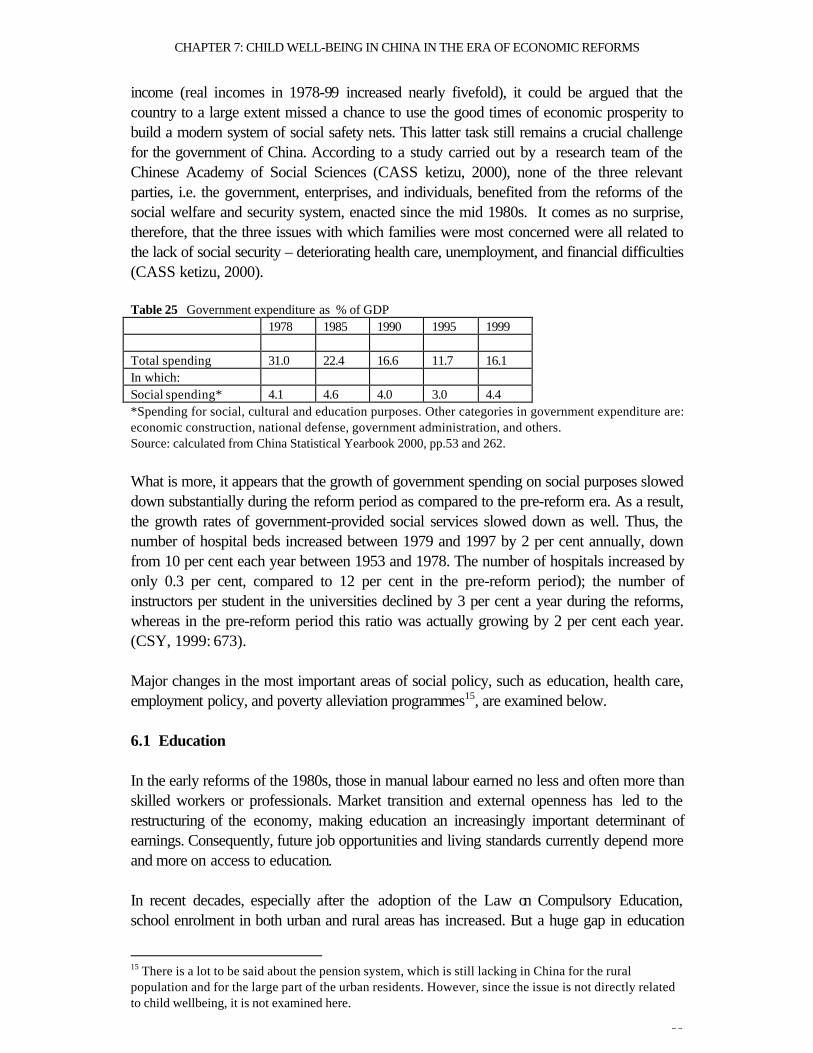
Only in recent years has there been a reverse in the downward trend in total governmentspending and government spending for social purposes as a percentage of GDP (table 25).Nevertheless, given the dramatic changes in the social structure and the rapid increase in
CHAPTER 7: CHILD WELL-BEING IN CHINA IN THE ERA OF ECONOMIC REFORMS
28
income (real incomes in 1978-99 increased nearly fivefold), it could be argued that thecountry to a large extent missed a chance to use the good times of economic prosperity tobuild a modern system of social safety nets. This latter task still remains a crucial challengefor the government of China. According to a study carried out by a research team of theChinese Academy of Social Sciences (CASS ketizu, 2000), none of the three relevantparties, i.e. the government, enterprises, and individuals, benefited from the reforms of thesocial welfare and security system, enacted since the mid 1980s. It comes as no surprise,therefore, that the three issues with which families were most concerned were all related tothe lack of social security – deteriorating health care, unemployment, and financial difficulties(CASS ketizu, 2000).
Table 25 Government expenditure as % of GDP1978 1985 1990 1995 1999
Total spending 31.0 22.4 16.6 11.7 16.1In which:Social spending* 4.1 4.6 4.0 3.0 4.4*Spending for social, cultural and education purposes. Other categories in government expenditure are:economic construction, national defense, government administration, and others.Source: calculated from China Statistical Yearbook 2000, pp.53 and 262.
What is more, it appears that the growth of government spending on social purposes sloweddown substantially during the reform period as compared to the pre-reform era. As a result,the growth rates of government-provided social services slowed down as well. Thus, thenumber of hospital beds increased between 1979 and 1997 by 2 per cent annually, downfrom 10 per cent each year between 1953 and 1978. The number of hospitals increased byonly 0.3 per cent, compared to 12 per cent in the pre-reform period); the number ofinstructors per student in the universities declined by 3 per cent a year during the reforms,whereas in the pre-reform period this ratio was actually growing by 2 per cent each year.(CSY, 1999: 673).
Major changes in the most important areas of social policy, such as education, health care,employment policy, and poverty alleviation programmes15, are examined below.
6.1 Education
In the early reforms of the 1980s, those in manual labour earned no less and often more thanskilled workers or professionals. Market transition and external openness has led to therestructuring of the economy, making education an increasingly important determinant ofearnings. Consequently, future job opportunities and living standards currently depend moreand more on access to education.
In recent decades, especially after the adoption of the Law on Compulsory Education,school enrolment in both urban and rural areas has increased. But a huge gap in education
15 There is a lot to be said about the pension system, which is still lacking in China for the ruralpopulation and for the large part of the urban residents. However, since the issue is not directly relatedto child wellbeing, it is not examined here.

HARNESSING GLOBALISATION FOR CHILDREN: A report to UNICEF
29
continues to exist between urban and rural children. By the late 1990s, primary schoolenrolment in the countryside was close to that in the cities, but the secondary schoolenrolment ratios were far lower in the countryside. Of the 15 per cent illiterate and semi-literate adults (aged 15 and over) in total adult population, the overwhelming majority areconcentrated in the countryside (CSY 2000: 103). School dropout is a common occurrencein poor rural villages. To receive nine-year compulsory education has never been a bigproblem in cities, but it has been difficult to obtain in the countryside. In areas of highpoverty, the situation has been even worse. According to a 1998 survey of 33 counties insix provinces of southwest China classified by the government as “nationally poor”, primaryschool enrolment was 80 to 98 per cent for children aged 7-12 years, and 50 to 85 per centthose aged 13-15 years. Only 14.3 per cent of all girls aged 15 years completed primaryschool education in some of the poor villages in these regions (Sheng Laiyun, 2000). In viewof the education gap between rural and urban areas, it is not an exaggeration to say that aperson’s educational attainment is very much dependent on whether they live in the rural orurban areas.
The disadvantage of rural children in education is the result of both the initial conditions andurban biased policies. Formally, nine-year compulsory education is tuition free and thegovernment is responsible for the expenditure. But fiscal decentralization has placed theresponsibility for financing education on local governments. The lower revenue of the poorand rural regions means that fewer funds are allocated to education, and the lack of funds istranslated into the inadequacy of teachers, facilities, classrooms, and overall lower quality ofeducation. Public expenditure on education per pupil was estimated as 3 to 5 times higherfor urban than for country children, and the gap has been widening. Education costs relativeto income (textbooks and school supplies that are not distributed free of charge) remainmuch higher for poor families and those in rural areas. Even with free tuition, these expensesare often beyond the reach of poor households.
The lag in education attainment limits the chance for children from low-income families totake opportunities created by reforms and openness when they grow up. A national ruralhousehold surveys reveals that it was difficult for illiterate rural labourers to increase theirearnings by taking advantage of non-farm jobs or economic opportunities. Of the total rurallabour force working in non-farm jobs, those with only primary education accounted for asmall proportion, and the majority of those who did manage to get a non-farm job workedmostly in unskilled and low paid jobs.
By contrast, rural labourers with secondary education are the most successful job seekersoutside agriculture (Sheng Laiyun, 2000). Therefore, to improve education in thecountryside is crucial for the improvement of future life prospect for rural children.
Public expenditures on education in China have been at a constant level, i.e. about 2.5 percent of GNP for the past 20 years. Although the government had committed itself toincrease public expenditure on education to 4 per cent of GNP by the end of the 1990s, thisdid not happen. The lack of real commitment to education in general and urban biasedpolicy in particular, especially in the 1990s, is likely to leave poor children more permanentlyout of the growth process, by impeding their future ability to find jobs to earn better incomes
CHAPTER 7: CHILD WELL-BEING IN CHINA IN THE ERA OF ECONOMIC REFORMS
30
and to improve capability.
6.2 Health careNo progress has been made towards universal health care during the reforms. Rather, theopposite is true. Access to high quality medical care increasingly depends on the ability ofthe patients to pay. Moreover, the gap in supply of medical services between urban andrural persists. Liberalization of medicine prices, increasing imports and production by foreignenterprises in China has made a greater diversity of drugs available, but has, at the sametime, sharply pushed up the prices. High cost of medical treatment has become the biggestbarrier to proper medical care for the population.
State sponsored health care systems in the cities have been in disarray since the reforms.There have been constant modifications intended to divide the responsibility for medical costamong the government, employers and individuals, but these modifications have stopped farshort of an alternative health care system which covers all urban residents, not to mention therural population. Health care services for children were never and are not provided by thegovernment free of charge, although the government and state enterprises once covered partof these costs for urban employees. The previous commune system of medical care that provided some minimal guarantees tothe rural population in fact collapsed with the elimination of the communes. Attempts torestore cooperative medical services in the countryside came to no avail, resulting in largerural populations who are not covered by any kind of medical insurance.
TVEs, even large ones, very rarely cover the medical expenses of their employees.Moreover, state enterprises that continue to employ over 100 million workers (and thatformally provide them coverage for all health care expenses) are now increasingly short ofmoney and refuse to reimburse medical costs that are, at the same time, becoming moreexpensive. The cost of medical services increased from 1993 to 1998 at a rate two to threetimes higher than the rate of the increase of the average wage (CASS ketizu, 2000).
Nevertheless, as the above data show, health conditions of children in China have in generalimproved over the 20 years of reform. This improvement has been, in large part, the resultof the increase in general incomes. Higher income enables both rural and urban residents tohave better access to food, clothing, and housing, which are the necessary materialconditions for the improvement of health. Higher incomes also helped to pay for medicaltreatment and drugs. But medical costs have increased far more rapidly than incomes. InChina today, where medical expenses fall entirely on individuals in cases of serious illness,rural families of even average income must either sacrifice health by not seeking medicaltreatment, or become deeply indebted or bankrupt, or both.
6.3 Employment policy
Workers in state owned enterprises have lost their job security as unemployment hasbecome an increasing threat to their livelihood. To a great extent, the advantage that urbanstate enterprises’ workers still enjoy comes from the residue of the central planning system.
HARNESSING GLOBALISATION FOR CHILDREN: A report to UNICEF
31
The relative deterioration of the living conditions of workers in state enterprises is linked toopenness policies. In an effort to attract foreign investment, the government has beenworking hard to create a “good investment environment”. The erosion of urban welfaresuggests that such an environment comes at the expense of labour standards in the stateowned enterprises, leaving little incentive to improve labour conditions for workers in theprivate sector, nor in the TVEs in the countryside. Foreign competition and efforts to attractforeign investment have put pressure on China’s labour market to keep labour costs low inorder to keep investors happy.
In the face of growing unemployment, new social provisions, such as unemployment benefitsand minimum living expenses, were put in place in urban areas in the 1990s. Theseprovisions, although not sufficient to compensate job losses, have helped to cushion thenegative impact of reforms and openness on job security for urban workers and theirfamilies to some extent. No similar measures in unemployment benefits, or in the area ofsocial safety nets in general, have ever been seriously attempted in the countryside. If there isone thing that came as a surprise to the “successful story” of China’s reforms and openness,it is how little progress China has made in terms of social welfare for the rural populationdespite the rapid growth and rising national income. Rural people are left entirely on theirown for survival and security, which makes them extremely vulnerable to risk andunexpected changes.
6.4 Poverty alleviation and relief policy
In 1999, after the minimum subsistence level programme (zuidi sheng huo bao zhang zhidu)was established in all cities and county townships, it was reported to reach only one-fifth toone-quarter of those who were actually qualified to receive its assistance. The poor financialsituation of the poorest counties did not allow them to allocate appropriate funding for thisprogramme. (CASS ketizu, 2000)
The problem of “return back to poverty (fan pin)” is now causing increasing concern. Therate of falling back into poverty in Guangxi province in 2000 was 15 per cent and as high as30 per cent in some areas. In the first half of 2000, one million rural residents fell back intopoverty in Anhui province alone.16 According to the report by the Office of PovertyAlleviation of the State Council, the average income of the rural poorest population remainsless than one third of average rural income, and the rural income gap between the better offand the worse off rural areas has been also widening.17
This is not to say that the government has been making less effort to alleviate poverty in the1990s than in the 1980s. In fact the government intensified its anti-poverty efforts andpursued its poverty alleviation programmes more vigorously in the 1990s. The ruralpopulation remains the main target for poverty alleviation programmes, but the vulnerabilityof small household farming in an uncertain market without social welfare protection andsafety nets tends to diminish the effectiveness of such remedies. Farmers and their families
16 Ban yue tan (By-Weekly Review), 2000, no.12.17 Xinhua News Agency, reported 2001, March 2

CHAPTER 7: CHILD WELL-BEING IN CHINA IN THE ERA OF ECONOMIC REFORMS
32
will face uncertain and, most likely, negative impacts on agriculture and rural incomes afterChina joins the WTO.
To sum up, external liberalization policy decisions have had mixed impact on the wellbeingof people, including children. Compared to the relative success of growth promotingeconomic policies, social and economic policies to offset the negative effects of somegrowth-oriented policies on income equality seem to have been rather weak. In this area, theproblem is not what the government has done, but what the government has not done, or notdone enough of, to maintain a broad based growth model for more equitable benefits for all.Similarly, the problem of the continuing existence of poverty and poor living conditionsamong children is not because of the lack of legislation, regulations, or programmes. Rather,the problem is the inadequate implementation of these regulations and programme and thelack of progress in creating a modern system of social protection for children consistent withthe rapid increase in average income experienced in China during the reform period.
The violations of child rights, such as child labour, that have occurred during years of unprecedented economic prosperity clearly indicate that the social safety nets for thepopulation, and for children in particular, did not keep pace with the impressive economicprogress of the last two decades.
7. Conclusion and Policy Implications
It has been proposed that redistributive policies should remain secondary in China’s povertyreduction strategy. China, it is suggested, should raise rural incomes through growth ratherthan through redistribution (World Bank, 1997b: 12) as excess redistribution measuresprovide disincentives that can suffocate growth. However, it is also widely recognized thatthe lack of growth in a particular country or region is associated with the low level ofinfrastructure and human capital. This is the case in rural and inland China. Because of thepaucity of necessary resources in poor areas, the improvement of infrastructure and humancapital in rural and poor areas is unlikely to happen without redistribution policies.Redistribution measures such as public expenditure on social services targeted towards thepoor and rural-interior areas are necessary both to promote growth and reduce inequality.
This paper has examined changes in child well-being, with the poverty issue as a centralfocus, in China during the time of reforms and openness. The economic gains in the processare there for everyone to see. However, it is not economic growth alone but also, andperhaps more importantly, the patterns of economic growth that make a difference in theliving standards of the vast majority of the population. Our tentative findings can besummarized as the follows.
First, China has indeed achieved a great deal in poverty reduction, in the sense that the sizeand proportion of the population in poverty has declined substantially in the past 20 years.This progress is largely due to rapid and widely spread economic growth that has raised thegeneral income level and improved the living conditions of the population including children.But there was no robust relationship between poverty reduction and external openness in the

HARNESSING GLOBALISATION FOR CHILDREN: A report to UNICEF
33
first half of the 1980s when the most remarkable progress was made. This wasdemonstrated by the fact that the most significant poverty reduction occurred in the periodof early reforms when openness and trade liberalization had yet to play a significant role ingrowth.
Second, the living conditions of a large part of the low income population, including theirchildren, have not improved to a degree consistent with the record increase in averageincome. The government had anticipated the elimination of poverty by the end of the 1990s.The reality is quite different. Poverty seems to have become more chronic and tenacious.Children in poor families lack access to basic education, health care and security, which notonly has a negative affect on their living conditions but also diminishes their future lifeopportunities. The persistence of poverty in the midst of rapid growth has two major causes:the sharp increase of income inequality, and the lack of efficient redistribution measures andmechanisms. In other words, the positive impact of growth via external openness on childrencould have been far greater, had more decisive measures and mechanisms been developedalong the way to prevent or at least to curtail inequality and to assist the poor.
Third, as inequality has reached a high level and continues to grow, the broadly basedgrowth pattern has been in jeopardy. A great number of children in poor families and poorregions are trapped in permanent disadvantage if not in absolute poverty, because thetrickle-down effect of urban and coastal biased growth was far from sufficient to benefit all.
We found explanations for negative consequences of reforms and openness in a number ofareas. First, the external openness policies have been biased in favour of cities over thecountryside, east-coastal over interior regions, and capital over labour. These policydecisions, while quite successful in promoting growth, have resulted in increasing inequality.Second, there is a lack of necessary coordination between economic policies and socialpolicies. Government efforts and policy implementation have been overwhelmingly focusedon growth, while insufficient attention has been paid to social problems such as inequality.As a result, poverty has persisted, social safety nets are slow to be established, and socialtensions have accumulated. For economic growth to be sustained for the purpose ofbenefiting the entire population, a more balanced development strategy is called for. Thefollowing measures are recommended:
First, market functioning needs to be improved and market imperfections should beeliminated. To a great extent, the impact of external liberalization on well-being and povertydepends on how well markets are able to allocate resources in such a way as to increasepublic welfare. A well-functioning market requires infrastructure support, relevantinstitutions, financial and labour market regulations, and effective law enforcement. While thecontribution of external liberalization to growth should be recognized, it should also beunderstood that external liberalization can push some people into poverty or increase theextent or depth of poverty under certain circumstances. Thus great care is required inderegulation and external liberalization to ensure that the market transition proceeds in a waythat minimizes poverty and maximizes positive gains for the vast majority of the population.
Second, employment should be put at the centre of government policies. In China, where
CHAPTER 7: CHILD WELL-BEING IN CHINA IN THE ERA OF ECONOMIC REFORMS
34
the size of the surplus labour pool is very large and still growing, one cannot over-emphasizethe importance of job creation. While employment is the single most important source ofincome for urban workers and their families, unemployment has become the most importantcause of urban poverty. Since job security has been taken away, more job opportunitiesmust be created to ensure the right to work stipulated by the Chinese Constitution.Moreover, a growing number of rural families derive an increasing share of family incomefrom non-farm employment. Needless to say, creation of jobs for the abundant rural labourforce is the important area of poverty reduction. One necessary component of an“employment-friendly development policy” is the encouragement of small and medium-sizedenterprises, including TVEs. The role of these enterprises in providing jobs is widelyrecognized. They can be internationally competitive, but the key to this competitiveness is, inthe longer run, better production efficiency. Until now the comparative advantage of many ofsuch enterprises, especially TVEs, depended largely on their low labour costs, i.e. low levelof labour standards, lack of pension and other social contributions, etc. It is now time for thegovernment to establish and enforce reasonable labour and social standards in theseenterprises for the sake of their long term development in the face of growing externalcompetition. Even if some of these enterprises produce insignificant or even zero revenue forgovernments, their function in job creation alone should warrant government support.
Third, the development of the rural economy should be on the list of priorities of thegovernment policy agenda. Rural growth has been proved to be more important in reducingpoverty than urban growth. As long as a large population remains in the countryside, thesignificance of rural growth in the improvement of well-being is unlikely to diminish. Giventhe low mobility of the rural population in the short and medium term, and if rural incomecannot be raised significantly, poverty reduction is unlikely to succeed even with fast growthin other sectors. Thus, external/globalization policies that are detrimental to agriculturalgrowth should be especially avoided. In this context, measures need to be taken to protectpeasants from the negative impact of China’s entry into WTO on agriculture and ruralincome.
Fourth, the current policy of “developing the west” should be continued. In order to correctto some extent the long existing bias in favor of east-coastal provinces, the government hasin recent years formulated a strategy of development in western regions. The strategy aimsto tap the resource potential of these vast regions by implementing preferential policies toencourage domestic and foreign capital, providing financial, technical and administrativeassistance to improve infrastructure, and encouraging westward movement of skills andmanagement. Although this recently enacted policy has yet to produce tangible results, it isabsolutely necessary and should be pursued unwaveringly. Fifth, policies to accelerate the establishment of social safety nets, to enhance welfareprovision and to extend such provisions to the countryside are urgently needed. Suchpolicies should work to upgrade social welfare provision that fell behind the increases inincome in the last two decades. It is socially unacceptable that high growth is notaccompanied by a higher level and a more universal provision of welfare. In particular,measures need to be taken to protect disadvantaged social groups, who remain quite largeand who, in the absence of special social policies, shoulder a disproportionate burden of the
HARNESSING GLOBALISATION FOR CHILDREN: A report to UNICEF
35
costs of market transition. Providing public goods is the government’s responsibility, andincludes maintaining laws, institutions, education, medical care, welfare, social security,infrastructure, and all that is necessary to ensure social order and social/individual safety.Insufficient supply or, even worse, shortage of public goods results in the loss of the basicsense of security. As the Chinese reform and openness experiences suggest, an abundanceof private goods cannot replace the scarcity of public goods. Time has come to re-examinethe policy of “letting a few get rich first” as the shortest way to make the whole country rich.It is indeed very questionable that there is a trade-off between equality and efficiency, buteven if there is, it is equality, not efficiency, that is currently in short supply.

CHAPTER 7: CHILD WELL-BEING IN CHINA IN THE ERA OF ECONOMIC REFORMS
36
REFERENCES
Cai Fang and Yang Tao. (2000) “cheng xiang shouru chaju de zhengzhijingjixue”(ThePolitical Economy of Urban-Rural Income Gap), zhongguo shehui kexue (China’s SocialSciences), No. 4:11-22
CASS ketizu (Project Team, Institute of Sociology, Chinese Academy of Social Sciences)of “China’s Social Security Systems” (2000). “zhongguo shehui baozhang zhidu gaige: fansiyu chonggou”(China’s Social Security System Reforms: Reflections and Re-Construction),shehuixue yanjiu (Sociological Research), No.6: 49-65
Che, Jiahua and Qian Yingyi (1998) “Institutional Environment, Community Government,and Corporate government: Understanding China’s township-Village Enterprises”, Journalof Law, Economics and Organization, 14,1: 1-23
Dollar, David and Aart Kraay (2000) Growth Is Good for the Poor, DevelopmentResearch Group, World Bank, March
Gustafsson, Bjorn and Wei Zhng (2000) “How and Why Has Poverty Changed in China: AStudy Based on Microdata for 1988 and 1995”, China Quarterly, 164.
Knight, John and Lina Song (1999) The Rural-Urban Divide. Economic Disparities andInteractions in China. London: Oxford University Press
Lardy, Nicholas. (1994) China in the World Economy, Washington DC: Institute forInternational Economics
Li Zinai (2000). “The Transfer of China’s Redundant Rural Labours”, World Economy &China. No.5: 32-45
Li Shi, Zhao Renwei and Zhang Ping (2000) “zhongguo jingji gaige zhong de shouru fenpeibiandong” (Changing Trends of Income Distribution during the Economic Reforms inChina), In Li Shi eds. Zhongguo jumin shouru fenpei shizheng fenxi (Positive Analysisof Distribution of Income in China), Beijing: Zhongguo shehui kexue wenxian chubanshe
Naughton, Barry (1997) “Economic Reform in China. Macroeconomic and OverallPerformance”, in D. Lee (eds.) The System Transformation of the TransitionEconomies: Europe, Asia and North Korea. Yonsei University Press, Seoul
Nongyebu ketizu (Project Team, Ministry of Agriculture). (2000). “21 shiji chuqi woguonongy jiuye ji shenyu laodoli liyong wenti yanjiu” (Rural Employment and the Utilization ofSurplus Labour in China in the 21st Century). Zhongguo congcun jingji (China’s RuralEconomy), No.5: 4-16
Perotti, Enrico, Laixiang Sun and Liang Zou. (1999) “State-Owned versus township and
HARNESSING GLOBALISATION FOR CHILDREN: A report to UNICEF
37
Village Enterprises in China”, Comparative Economic Studies, 41,2-3: 151-179
Pomfret, Richard (1997) “Growth and Transition: Why Has China’s Performance Been SoDifferent?”, Journal of Comparative Economics, Vol. 25, No 3, December 1997. Pp.422-440
Population Research Institute of CASS (1998) zhongguo renkou nianjian 1998 (ChinaPopulation Yearbook 1998), Beijing
Rural Social and Economic Survey Team (Rural survey team) of China State StatisticalBureau (2000) China Poverty Monitoring Report 2000. Beijing: tongji chubanshe
Shen Kunrong (1999). guoji zhijie touzi yu zhongguo jingji zengzhang (Foreign DirectInvestment and China’s Economic Growth), NERI Working Paper 99-003, NationalEconomic Research Institute, Beijing
Sheng Laiyun. (2000) “dui dangjin ji jinhou yige shiqi nongmin shouru zengzhang wenti desikao” (Current and Future Income Growth of Peasants), zhongguo nongcun jingji(China’s Rural Economy), No.11: 4-11
State Statistical Bureau (SSB). China Statistical Yearbook (CSY), Beijing: tongjichubanshe, various years
Urban Social and Economic Survey Team (urban survey team) of China State StatisticalBureau (2000) chengshi zhuhu diaocha qingkuang chouyang diaocha ziliao huibian(The Compilation of Urban Household Basic Sampling Survey). Unpublished.
Urban Social and Economic Survey Team (Urban survey team) of China State StatisticalBureau (1999) zhongguo chengshi pinkun jiance (China’s Urban Poverty Monitor).Unpublished.
World Bank (1992) China Strategies for Reducing Poverty in the 1990s. WashingtonD.C.
World Bank (1997a) China 2020. China Engaged. Washington D.C.
World Bank (1997b) China 2020. Sharing Rising Incomes. Washington D.C.
World Bank (2000a) World Development Report 2000/2001, Washington D.C
World Bank (2000b) World Development Indicators 2000. New York: OxfordUniversity Press.
Wu, Changqi and Leonard K. Cheng (1999) The Determinants of Export Performanceof China’s Township-village Enterprises, from the internet