chapter 7 - welcome to homepage of planning...
TRANSCRIPT

663
CHAPTER 7.1
INDUSTRY
7.1.1 In order to achieve a doubling of per capitaincome over the next decade, the Tenth Plan targetsa gross domestic product (GDP) growth rate of 8per cent per annum. The corresponding growthtarget for the industrial sector is 10 per cent. Thisrepresents a major step-up in view of the less than7 per cent growth during the last decade. A taskthat would have been quite daunting even undernormal conditions, becomes much more challengingdue to structural deformities and changes that arelikely to occur in the internal and externalenvironment.
comparative advantage based on the narrow staticinterpretation of relative factor endowments ofnations. Access, on a global basis, to moderntechnology, capital resources and markets is now amore critical determinant of internationalcompetitiveness.
7.1.4 Comparative advantage is today theaggregate sum total of technical, entrepreneurialand managerial capabilities of the constituent firmsof a country. Improvements in transport andtechnology make it possible to split businessprocesses and locate sub processes in differentcountries depending on the inherent cost advantagewhich they can derive from the investment climateand policy environment. Be that as it may, no countrycan isolate itself completely from the forces beingunleashed by a rapidly globalising community ofnations. A dynamic policy environment should not,however, be perceived as a looming threat since italso offers immense opportunities to capture muchmore affluent markets outside the country. It hasbeen estimated that developing countries couldrealise over $700 billion in the form of exportearnings if industrialised countries end theprotection of labour-intensive products. Potentialexport earnings of developing countries in textiles,clothing and other labour-intensive products aloneare estimated to exceed $500 billion if advancedindustrial countries open up their markets(UNCTAD, 2002).
The Emerging External Environment
• WTO • Regional Trading Blocs· Free Trade · NAFTA· Tariffs · EU· QRs · SAARC· FDI • Preferences for green
• Market access products and processes· Standards · Environment· Accreditation · Health· Certification · Safety
7.1.2 A highly competitive environment is rapidlyemerging, driven by rising economic and socialaspirations on the one hand and external conditionspredominantly World Trade Organisation (WTO)related market forces on the other. Other importantfactors emphasising the need for continuousimprovements in productivity and efficiency in theallocation of resources are: consumer demand forenhanced value in terms of cost and quality;consumer tastes and preferences shiftingperceptibly in favour of environment-friendlyproducts; and regulatory pressures for sustainableindustrial processes and practices based on lifecycle analysis of the impact on the environment.
7.1.3 Global integration of markets is alsochallenging the conventional concept of
Box 7.1.1Fortune 500 companies have started
sourcing initiatives in India
• ABB • GM• FORD • HP• SHARP • FIAT• CUMMINS • EMERSON ELECTRIC• GE • TOYOTA
• KODAK

TENTH FIVE YEAR PLAN 2002-07
664
7.1.5 India's inherent strength and comparativeadvantage lie in the presence of entrepreneurialacumen of the highest quality, an establishedscientific and industrial base, cheap, skilled English-speaking workforce and a large domestic market.The relocation, by large transnational companies,of their manufacturing base to India and sourcingof products from here by other Fortune 500companies is evidence of the bright future of Indianindustry.
7.1.6 Unless India is proactive in responding tothe imperatives of the changing environment, thereis a very serious danger that it would be left farbehind in today's race for the 'survival of the fittest'.In short, Indian industry has to discard its inward-looking approach and become outward-orientedand learn to operate in an unprotected,internationally competitive environment. Our dreamcan be translated into reality only if we see apparentthreats as genuine opportunities and exploit theirpotential. Industry and the Government have to workcollectively and in tandem to this end. The TenthPlan requires making a bold departure from the past.
OBJECTIVES OF INDUSTRY SECTOR
7.1.7 The contribution of industry to GDP is animportant indicator of a nation's progress in theprocess of structural transformation from a ruralagricultural society to a more urban industrialisedone. Further, an increase in per capita income isassociated with a rise in the share of industry alongwith a fall in the share of agriculture in nationalincome. In the early stages of industrialisation, whenper capita income is very low, the primary sectoroccupies a dominant position in the economicstructure. As capital and skills accumulate, bothproductivity and per capita income rise. Industry, inits broad sense of secondary sector, is followed oraccompanied by the services sector displacing therelative contribution of the primary sector.
7.1.8 It is significant to note that consumption ofmanufactured consumer goods is recognised asone of the most widely accepted measures ofstandard of living and of quality of life. Manufacturingindustry provides the driving force for stimulatingrapid economic growth. The growth rate of themanufacturing industry normally surpasses that ofthe agriculture and the service sectors. It is for thisreason that industry is considered the backbone ofan economy. It is in recognition of this specialimportance that raising industry's share in GDP isbeing ranked as the foremost objective for thissector in the Tenth Plan. The comparative cross-country position given in Table 7.1.3 amply justifiesthis objective. India's share in world industrial outputand exports is not commensurate with its size andpotential. Unless the pace of industrial growth isaccelerated, India is likely to be left behind by thelarger community of nations. It is perhaps pertinentto add that traditionally, the political stature of acountry has been commensurate with the size andstructure of its industry.
Box 7.1.2Manufacturing is moving to India
(multinational companies which have set upbase in India)
• TOYOTA • GM• MAKINO • HYUNDAI• FORD • KODAK
7.1.9 Participation in world trade is essential forIndia as it can yield multiple advantages. Risingexports can augment the availability of much-needed imports while also bridging the trade deficit.As a spin off, the concomitant requirements ofproductivity and quality of exportable manufacturedgoods would also raise our own standard of livingthrough the improved availability of diverse highquality products. Globally, trade is emerging as apowerful engine of economic growth and
Table 7.1.3Industry’s share(%) in GDP
Country Value added GNI/capas % of GDP ($) in 2000
Industry Services
India 27 46 460
China 49 34 840Malaysia 40 48 3380Indonesia 47 36 570Philippines 30 53 1040
Thailand 40 49 2010World Development Report 2002
GNI ( Gross National income) = GDP+ Net receipt ofprimary income from foreign sources

INDUSTRY
665
development. Manufactured products are generallytraded goods. Their demand also shows price andincome elasticity as a result of which the exportindustry, unlike agriculture, does not face majormarket constraints. Raising India's share in theworld exports of manufactured products is,therefore, the second important objective for theindustry sector in the Tenth Plan.
7.1.10 Free markets and competition are not apanacea for all the ills of the developing countries.Complex issues such as the elimination of regionalimbalances in industrial development, which hasdefied all solution in earlier Plans, need innovativealternatives, particularly in the absence of directintervention measures such as industrial licensingthrough which location of industry was sought tobe influenced earlier. The increasing gap betweendeveloped industrialised States and others couldhave serious implications for the country. This isparticularly true for the northeastern States, whichhave continued to lag behind the rest of the countryon account of their poor connectivity, inadequatelocal infrastructure and small size of their markets.Bringing about a balanced industrial developmentin the country is, therefore, proposed to be the thirdobjective for the sector.
7.1.11 Employment in India is skewed in favour ofthe agriculture sector which accounts for about 60per cent of total employment. As a consequence, thereis widespread unemployment and under-employmentespecially for skilled workers both in urban and ruralareas. Demographic projections suggest that about60 per cent of the population would soon be in the15-59 year age group, leading to a substantial increasein the workforce. Unless jobs are created in the moreproductive manufacturing sector, the unemploymentsituation could become quite alarming. Hence, thefourth objective for the industry sector in the TenthPlan is to create jobs for skilled workers throughindustrial growth.
STRATEGY FOR INDUSTRY SECTOR IN THETENTH PLAN
7.1.12 The Tenth Plan envisages acomprehensive and coherent strategy for attainingthese objectives. Deepening and widening ofeconomic reforms to create a positive investment
climate conducive to a dominant private sector role,including setting up state-of-the-art infrastructure,capacity building in industry in order to make itinternationally competitive, a level playing field witheffective and transparent rules of fair play,augmentation of financial resources and efficiency-enhancing policy instruments are the importantingredients of such a strategy. These have to beviewed in a holistic manner as they areinterdependent.
Creating a Positive Investment Climate
7.1.13 The industrial development strategy isbeing re-oriented towards enabling our vibrantprivate sector to reach its full entrepreneurialpotential, to contribute towards production,employment and income generation. Unless theeconomic environment is conducive to high levelsof private sector participation, there can be littleprogress in accelerating industrial development andgrowth. An inward-looking policy environment in thepast promoted import substitution with artificial propssuch as high tariff protection, quota restrictions,entry barriers etc. In order to ensure that thetransition from a closed to an outward-lookingeconomy is smooth and non-disruptive, well-conceived government interventions to dismantleexisting barriers to industrial growth andaccelerating new initiatives to create an enablingenvironment at par with the rest of the world areneeded.
7.1.14 Private initiative depends on a variety ofmarket-related factors and overarching macroeconomic policies. A conducive investment climaterequires a considerable widening and deepeningof economic reforms cutting across the Centre andStates and local bodies, including panchayati rajinstitutions (PRIs). These reforms must be aimedat ending rigidities in labour policies, reforming realestate laws, the security, transferability andenforceability of property rights, bankruptcy andforeclosure laws and easing restrictions on the inter-State movement of goods imposed by the EssentialCommodities Act, 1955, octroi checkposts and otherlocal levies/regulations. The agenda also coverspositive conditions required for a competitive marketeconomy like the establishment of an efficient world-class physical, financial and social infrastructure,

TENTH FIVE YEAR PLAN 2002-07
666
providing a level playing field and rules of fair playwhich require bold initiatives including removal ofartificial compartmentalisation of different sub-sectors. The Government also needs to addressthe issue of restrictions on market access, dumpingand predatory practices on the part of other players,especially the developed nations.
7.1.15 Tariff imposed by the industrialised countriesare substantially loaded against manufacturedimports from developing countries, making it moredifficult for them to undertake downstream processingactivities. The use of non-tariff measures, includinganti-dumping cases, social safeguards, technicalstandards and subsidies, have restrictedopportunities for developing countries. A re-balancingof the trading system to the mutual benefit of allcountries would require, among other things,improved access to developed markets and transferof technology to developing countries formodernisation leading to enhanced productivity andinternational competitiveness.
Capacity Building
7.1.16 While the inward-looking policyenvironment did play an important role in buildingup the country's diverse scientific, technological andindustrial base, it has outlived its utility. Largesections of our industry are characterised by plantsof sub-optimal sizes using outdated technologies.As a result, the productivity of capital and labour inIndian industry is comparatively low. Modernisationand technological upgradation is the foremostrequirement for competitiveness. The Tenth Plan
plans to give an impetus to the induction of cleanproduction technologies, processes and practices.
7.1.17 Raw materials and low technologyproducts dominate India's export basket today,accounting for over 80 per cent of the totalmanufactured exports. Against this, the worldaverage ranged between 43 per cent and 35 percent during 1985 to 1996. India’s high technologyexports have performed rather poorly and theirshare has risen by only 1.4 points compared to 7.6points for the world as a whole during the 1986 to1996 period. The ratio of high technology productsto total manufactured exports in the case of India isonly one-fifth of that of China and one-tenth of SouthKorea and Taiwan. Modernisation and technologicalupgradation would, therefore, lead to value additionand diversity, lending resilience to our exports.
World Class Infrastructure
7.1.18 The state of the country's infrastructure isfar from adequate. Public sector monopoly in theownership, control and management ofinfrastructure needs to give way to private financingof infrastructure projects to leverage the privatesector's resources and productive efficiency for thebenefit of all stakeholders - the service user, theservice provider and the Government. This has beendemonstrated with success all over the world.Although efforts are being made to augment qualityand coverage of all infrastructure, the policyframework to promote private initiative is not yetfully in place. However, the magnitude of the taskis too huge for the public sector to handle on its

INDUSTRY
667
own. Without public-private partnership in this field,the desired rapid industrial growth would bejeopardised. Some States, notably Maharashtra andAndhra Pradesh, have adopted innovative modelsfor providing state-of-the-art infrastructure. Not onlydo recent investor surveys accord higher ranks tothe investment climate in these states, but the flowof investment, including foreign direct investment(FDI), is greater. While there is no one model thatsuits all situations, the swiftness with which otherStates, especially the industrially-backward statesincluding those in the northeast, come up withsimilar initiatives will determine the pace of industrialgrowth. The Tenth Plan defines the policy paradigmfor infrastructure development in terms of modelsthat encourage efficiency and leverage resourcegeneration.
Augmenting the Resource Base
7.1.19 A considerably higher measure ofinvestible resources is required in order to achievethe industrial growth rate target of 10 per cent perannum. The augmentation of the resource baserequires action on several fronts. To begin with, thebleeding of the resource base in the form ofunproductive public sector undertakings (PSUs)needs to be checked. The closure of such PSUsneeds to be expedited. A number of roadblocks tothis process need to be removed.
7.1.20 Simultaneously, vast resources need to bereleased from areas of low productivity in the publicsector. This requires disinvestment of PSUs so thatour resources are released and transferred to moreefficient management. Taking into account the slowpace of disinvestment, the issue of managementof the public sector in the transition period assumesimportance.
7.1.21 The subsidy burden also needs to bedrastically reduced. The fertiliser sector and thepublic distribution system (PDS) together accountfor over Rs. 20,000 crore of subsidies. Powerfulvested interests in favour of their perpetuation needto be tackled. Bold steps are required in order tobring about an efficient pricing policy.
7.1.22 In order to mobilise additional resources,it is necessary to evolve a healthy Indian capital and
financial market in order to tap the vast savingspotential of the Indian household sector and transferit to industry through efficient financialintermediaries. Restoration of investor confidenceis an absolute necessity for augmenting theresource base. The recent financial sector scandalspoint to the need for utmost caution on the part ofthe regulatory institutions which have been set up.Corporate governance cannot be improved unlesscredible and transparent rules of behaviour areevolved and enforced by industry associations.
7.1.23 Serious attention must also be given to theissue of foreign investment (both portfolioinvestments and FDI). According to some estimates,a quadrupling of FDI is required in order to achievea 10 per cent industrial growth rate. FDI is not onlyan additional source of funds but the technology itbrings in and the market access it provides havevast implications for productivity and quality.
Efficiency Enhancing Initiatives
7.1.24 Efficiency enhancing policies call forallowing a free play of market forces during theTenth Plan. Unless genuine strategic concernsrequire otherwise, all internationally traded goodswould be priced on international parity. Prices ofnon-traded goods would reflect their true resourcecosts. Pricing based on the long-run marginal costof production should be a dominating feature insectors such as infrastructure services, power,municipal services etc. Market-based instrumentsand indirect policies would completely substitute directintervention and the command-and-control approach.
7.1.25 As progress from a regulated economy toa fully competitive economy would be necessarilyslow and time-consuming, market imperfectionswould require a greater role for the State as awatchdog and regulator at least in some importantsectors such as drugs and pharmaceuticals.
REVIEW OF THE NINTH PLAN
Major Initiatives
7.1.26 During the Ninth Plan, the major structuralchanges and modifications in sectoral policies were:delicensing of coal, lignite and petroleum (other than

TENTH FIVE YEAR PLAN 2002-07
668
crude oil), amendment of Mines and Minerals(Regulation and Development) Act, 1957, specialpackage for revival of export growth, repeal of theUrban Land (Ceiling and Regulation) Act, 1976,allowing buy-back of shares and liberalisation oftechnology imports.
7.1.27 Foreign equity up to 100 per cent wasallowed under automatic route for majorinfrastructure sectors and the time frame forconsideration of FDI proposals has been reducedfrom six weeks to 30 days. A Foreign InvestmentImplementation Authority has been set up in theDepartment of Industrial Policy and Promotion toprovide a single-point interface between foreigninvestors and the Government. Prior approval ofthe Government is not required for increase inthe amount of foreign equity within the approvedpercentage of foreign equity in cases in whichthe original project cost was up to Rs. 600 crore.The Government has taken steps for simplifyingforeign investment procedures, allowed foreigninvestment in new activities such as Global MobilePersonal Communication Systems besidessimplifying procedures for downstreaminvestment to foreign-owned Indian holdingcompanies. FDI up to 26 per cent under theautomatic route has been allowed in theinsurance sector subject to a licence from theInsurance Regulatory and Development Authority.Progressive liberalisation in the provisions relatingto investment are : foreign institutional investors(FIIs) can invest in a company under the portfolioup to 24 per cent of the paid-up capital of thecompany; and up to 100 per cent FDI is allowedin non-banking financial companies (NBFCs) ona case-to-case basis with the condition that aminimum of 25 per cent of their holding isdivested in the domestic market.
7.1.28 The Government's approach to PSUshad a three-fold objective: revival of potentiallyviable enterprises; closing down of those thatcannot be revived; and reducing its equity in non-strategic PSUs to 26 per cent or below. Interestsof workers will be fully protected through attractiveVRS and other measures. This programme hasalready achieved some initial successes. TheGovernment is also proposing to set up a National
Company Law Tribunal (NCLT) for sickcompanies. At present the process ofrehabilitation/winding up of PSUs is done throughthe mechanism of BIFR.
7.1.29 The Department of Heavy Industry hasundertaken restructuring of PSUs in line with theGovernment policy for reform of the public sector.Cases of 20 PSUs have been referred to theMinistry of Disinvestment for disinvestment/formation of joint ventures. Out of 49 PSUs underthe Department of Heavy Industry, 26 have beenreferred to the BIFR. Revival plans for 12 havebeen sanctioned by BIFR and are underimplementation. The BIFR has favoured windingup in the case of another seven, while the casesof the remaining seven are still being consideredby the BIFR.
7.1.30 Manpower rationalisation has beenadopted extensively to shed surplus manpower.Around 3,69,277 employees have opted for VRSsince introduction of this scheme in October, 1988to November, 2001, the benefits of the VRS forwhich the Government has provided financialsupport of about Rs. 1,100 crore over the lastnine years. The statutory dues of the employees,which have been pending for long, have also beencleared along with VRS benefits under theseparation scheme. The Government has alsoprovided additional support of about Rs. 500 crorefor VSS for around 10,000 employees.
7.1.31 Considering the market sentiments andrecent developments in the United States and othercountries relating to employees stock options etc.,it was decided to liberalise certain provisions of theCompanies Act, 1956. The Companies(Amendment) Ordinance, 2001 was promulgatedin October 2001 and has been replaced withCompanies (Amendment) Act, 2001.
7.1.32 The Export Promotion Industrial Park(EPIP), is a centrally sponsored scheme forproviding financial assistance to State Governmentsfor setting up and maintaining industrial parks withappropriate infrastructure for housing industrial unitswith export commitment. An expenditure of Rs. 250crore was approved by the Cabinet for setting up25 EPIPs in 25 States. The Central Government's

INDUSTRY
669
grant for EPIP would be 75 per cent of the capitalexpenditure, up to a limit of Rs. 10 crore in eachcase. So far the Government has approved 20proposals for setting up EPIPs in Punjab, Haryana,Himachal Pradesh, Rajasthan, Karnataka, Kerala,Maharashtra, Tamil Nadu, Andhra Pradesh, UttarPradesh, Gujarat, Bihar, Jammu and Kashmir,Assam, Madhya Pradesh, West Bengal, Orissa,Meghalaya, Manipur and Nagaland. Nine EPIPshave been completed so far, and other parks are invarious stages of implementation. Proposals fromthe other States are awaited.
7.1.33 The Critical Infrastructure Balance Scheme(CIBS) scheme envisages investment in areas ofcritical deficiency in the interest of export promotion.The balancing investment may inter-alia relate toinfrastructure in export intensive areas includingexport processing zones (EPZs), seaports andairports, improvement of feeder roads and effluenttreatment units etc. Since its inception, 44 projectshave been sanctioned in 16 States. Specific projectsassisted include construction of common facilitiesin the apparel export park at Gundapochampally,power supply to software unit in Export PromotionIndustrial Park at Bhubaneshwar, infrastructuredevelopment at Saharanpur, computerisation inEPZs at Kochi, Vishakhapatnam, Mumbai, Chennai,Falta, Kandla and Noida.
7.1.34 SEZs were set up with a view to enablinghassle-free manufacturing and trading activities forthe purpose of exports. The units in these zoneswill not be subjected to any pre-determined value-addition or export obligation. They shall be treatedas being outside the customs territory of the country.Sale in the domestic tariff area by the units in thesezones can only be done after payment of full Customsduty. A private sector SEZ covering an area of about3,500 hectares has been sanctioned at Pipavav inGujarat. Another private sector SEZ has beensanctioned at Tuticorin in Tamil Nadu. Besides, theexisting EPZs in Mumbai, Vizag, Kandla and Kochiare also being converted into SEZs.
7.1.35 For involving State Governments in theexport effort, a new scheme - Assistance to Statesfor Infrastructure Development for Export and AlliedActivities (ASIDE) - has been evolved for grantingassistance to the States for development of export-
related infrastructure on the basis of their exportperformance. The difference in the proposedscheme and the existing infrastructure-orientedschemes (e.g. CIBS, EPIP, EPZ, ExportDevelopment Fund-North East Region (EDF-NER)is that these schemes do not involve StateGovernments in decision-making. The proposedscheme is area-specific and not product-specific.States would use the money for complementaryexport-related infrastructure, such as roadsconnecting the production centres with ports,research and development (R&D) in State-specificproducts, development of cold chains for agroexports, development of minor ports, creation of newexport promotion industrial parks, human resourcedevelopment and developing marketinginfrastructure.
7.1.36 Many export incentives are not compliantwith the WTO framework and are being phasedout. Thus the instruments which were availableto neutralise the negative impacts of varioushandicaps in the form of higher capital costs,higher tariffs, transactions costs and unrebatedduties will no longer be available. Aggressiveefforts and systematic export marketingschemes like the Market Access Initiative (MAI),Agri Economic Zone (AEZs), SEZs have,therefore, been worked out. The MAI has beendevised to put in place an instrument which isnot only WTO compatible but would also mitigatethe negative effects of various handicaps facedby the exporters vis-à-vis their counterparts in thecompeting countries. The strategy would aim atachieving a double-digit growth rate in our exports(in dollar terms) on a sustained basis.
7.1.37 In October 2001, the Governmentincreased the duty drawback rate for 300 productgroups covering the textiles, leather and engineeringgoods sectors and removed the Duty EntitlementPass Book (DEPB) value cap on 4,000 items, whichwill also benefit the chemicals and plastic goods'industries. The step was undertaken as a one-timemeasure for promoting exports and the policy willbe reviewed. A Directorate General of Anti-Dumpingand Allied Duties was constituted in 1998 toinvestigate complaints of dumping and recommendthe amount of anti-dumping duties. A Task Force

TENTH FIVE YEAR PLAN 2002-07
670
was set up to prepare a common nomenclature at8-digit level for trade data on Customs and Excise.The collection, compilation, and dissemination oftrade statistics is now taking place with reduced timelag. Electronic filing and on-line processing of licenseapplications, on-line payment of duty drawback, andabolition of special import license (SIL), removal ofquantitative restrictions etc. have been effected.
7.1.38 Besides, the continuation of Growth Centreand Transport Subsidy scheme, a major policyinitiative by the Department of Industrial Policy andPromotion was the Northeast Industrial Policy(NEIP). A new industrial policy was announced forthe development of industrial infrastructure in thenortheastern region. The Transport SubsidyScheme was extended for a period of another sevenyears, up to 31 March 2007.
7.1.39 In the textile sector, several long-termand short-term measures were taken to minimisethe adverse effects of the external conditions onexports. These included concessions under thequota policy to reduce transaction costs forexports, resolving of the issue of DEPB rates forblended textiles and wool tops, revision in Duty-drawback rates, etc. Two new Plan schemes forpromoting textile exports were also formulated –Apparel Parks for exports for giving a thrust tosetting up of apparel units of internationalstandards and Textile Centre InfrastructureDevelopment Scheme for providing financialassistance for infrastructural facil i t ies atestablished textile growth centres.
7.1.40 The Technology Upgradation Fund Scheme(TUFS) was introduced to modernise the textilesector. All the sub-sectors of the textiles likespinning, weaving, knitting, processing, garmentmaking, cotton ginning and pressing and jute sectorare covered under the scheme. The TechnologyMission on Cotton (TMC) was established toimprove the productivity and quality of cotton so asto increase the income of farmers and makingquality cotton available to the textiles industry atcompetitive prices. The ginning and pressing units,which operate with obsolete technology, poor qualityof cotton and increased wastage are proposed tobe modernised either by capital subsidy under TMC
Scheme or by 5 per cent interest subsidy under theTUFS. The implementation of the National TextilesPolicy (NTxP), 2000 was also announced during thePlan period. It recommended, among other things,duty relief, concessions and special measure forprogrammes aimed at accelerating modernisationand growth of textile industries. It lays specialemphasis on modernisation of the weaving sectorby launching a programme for the induction of50,000 shuttle-less looms and 250,000 semi-automatic and automatic looms in the decentralisedpowerloom sector.
7.1.41 The Competition Bill, 2001 seeks to ensurefair competition in India by prohibiting trade practiceswhich cause appreciable adverse effect oncompetition in markets within India and, for thispurpose, provides for the establishment of a quasi-judicial body to be called the CompetitionCommission of India which shall also undertakecompetition advocacy for creating awareness andimparting training on competition issues.
REVIEW OF NINTH PLAN POLICY REFORMS
7.1.42 While formulating the Ninth Plan, severalareas were identified for urgent Government actionto realise a target of 8.2 per cent annual growthrate of industry. These were: disinvestment; closureof non-viable sick PSUs; removal of regionalimbalances in industrial development; review andrevamping of the BIFR mechanism; policy andprocedural reforms in the States; feedstock andpricing policy for fertilisers; review of the sugarpolicy, pharmaceutical pricing policy and small-scaleindustry (SSI) reservation (particularly for criticalexport-oriented industries such as toys, garmentsand leather goods) and review and modifications offood laws; and policy and fiscal measures fordeveloping the packaging industry for increasingexport of processed foods.
Foreign Direct Investment
7.1.43 Liberalised trade and an open door foreigninvestment policy ensure efficient allocation ofresources. India is an eminently attractivedestination for FDI in view of the stability of itsdemocratic polity, rule of law, steadily growingeconomy, low inflation rate, sizeable domestic

INDUSTRY
671
market, reservoir of skilled English speakingmanpower, well-developed social and economicinfrastructure, diversified industrial base and evolvedfinancial/capital market. According to the GlobalCompetitiveness Report, (World Economic Forum)India's current competitiveness ranking has movedup 6 notches from 42nd position in 1999 to 36thposition in 2001. The Report highlights licensing oftechnology, availability of suppliers the mediancorporate tax rates, export promotion and quality ofbusiness environment as some of India's positivefeatures. The share of emerging markets in inwardFDI has declined from 28 per cent in 1998 to thepresent 26.5 per cent, even though global FDI levelshave increased by 25 per cent in 1999 to reach $ 1trillion in 2000. India's share in total FDI flow todevelopment countries has been reported by the UNto be 1 per cent. While China gets FDI of roughly $40 billion a year, the flow to India remains $ 2 billion.FDI is driven more by economic environmentcomprising cost conditions, wage levels andindustrial capability, market size and infrastructureof export processing zones, than by directincentives or performance obligations.
7.1.44 Although a number of steps have beentaken to ensure a liberal FDI policy, there is scopefor substantial improvement in terms of bringing FDIunder the automatic route and expediting approvals.
Disinvestment of Central Public Enterprises
7.1.45 In 1998-99, the Government decided tobring down its shareholding in PSUs to 26 per cent(thus facilitating ownership changes, as wasrecommended by the Disinvestment Commission)in a majority of cases. The Government classifiedthe PSUs as strategic and non-strategic anddecided to retain majority holding in strategic PSUs.It was also decided that the interests of the workerswould be protected in all cases.
7.1.46 During the Ninth Plan, there had beensteady progress in the disinvestment of non-corePSUs. However, this has been linked with anassurance of job security for the employees orproviding opportunities for retraining andredeployment. The Disinvestment Commission setup in 1996 had earlier examined each of 58 PSUsreferred to it and advised the Government on the
extent of disinvestment feasible as well as the modeof disinvestment and the steps to be initiated. TheDisinvestment Commission had maderecommendations under five broad categories.These were: (a) strategic sale involving change inownership/management in 29 PSUs and trade saleof eight; (b) offer of sale of shares involving nochange in ownership/management in five PSUs; (c)deferment of disinvestments in eight PSUs and nodisinvestments in one; (d) closure/sale of assets infour PSUs; and (e) employee buy-out/strategic salein two. After the reconstitution of DisinvestmentCommission in July 2001, it has been decided thatall ̀ non-strategic' PSUs, including subsidiaries (butexcluding Indian Oil Corporation (IOC), Oil andNatural Gas Commission (ONGC) and GasAuthority of India Ltd or GAIL) will be referred tothe Commission for independent advice.
7.1.47 Since 2000-01, the Government pursuedthe policy of reducing its stake to below 26 per centin some non-strategic PSUs. There was increasingemphasis on strategic sales of and the entireproceeds from disinvestment/privatisation wasintended to be deployed in social sector,restructuring of PSUs and retirement of public debt.The salient features of the disinvestment policy in2000-01 are: to restructure and revive potentiallyviable PSUs; to close down those which cannot berevived; bringing down Government equity in allnon-strategic PSUs to 26 per cent or below, ifnecessary; to fully protect the interests of workers;to put in place mechanisms to raise resources fromthe market against the security of PSU assets forproviding an adequate safety net to workers andemployees; to establish a systematic policyapproach to disinvestment and privatisation and togive a fresh impetus to this programme by settingup a new Department of Disinvestment.
7.1.48 Accordingly the Government hasdecided to disinvest a substantial part of its equityin enterprises such as Indian Airlines, Air India,India Tourism Development Corporation (ITDC),Indian Petrochemicals Ltd. (IPCL), VideshSanchar Nigam Ltd. (VSNL), CMC, BharatAluminium Company Ltd (BALCO), HindustanZinc Ltd and Maruti Udyog Ltd. Where necessary,strategic partners would be selected through atransparent process.

TENTH FIVE YEAR PLAN 2002-07
672
7.1.49 The successfully privatised/disinvestedPSUs are: Lagan Jute Machinery CompanyLimited (LJMC), Modern Food Industries Limited(MFIL), BALCO, ; CMC, Hindustan TeleprintersLtd. (HTL); IBP Ltd., VSNL, nine hotels of ITDC,three hotels of the Hotel Corporation of India(HCI), Paradeep Phosphates Limited, Jessop andCo. Ltd. (subject to BIFR approval) and HindustanZinc Ltd.
7.1.50 Forty-seven PSUs (including a fewsubsidiaries) have been taken up for thedisinvestment between 1990-91 and 2001-02. Theproceeds realised amount to Rs. 26,738 croreagainst the target of Rs. 66,000 crore.
7.1.51 Out of these 47, strategic sales weredone in the case of only 12 companies. The totalface value of equity sold so far through strategicsale is Rs. 744.34 crore and the realisation ofthe order of Rs. 7,165 crore. The yearly benefitthat accrues to the public from these salesexceeds Rs. 824 crore. Considering the totalequity in Central PSUs or CPSUs (held by theCentral Government and the holding companies)as on 31 March 2000 is of the order of Rs. 78,484crore, equity sold through strategic sale so far isless than 1 per cent. If Rs. 7,165 crore could berealised by just selling 1 per cent of the total equity,the potential realisation by selling the total equityin all non-strategic CPSUs can be estimated atseveral lakh crores of rupees.
7.1.52 The emphasis on strategic sale, from1999-2000 onwards has started yielding excellentresults. The Price/Earning ratios obtained between1991 - and 1999, from sale of shares of highlyprofitable CPSUs ranged between 4.4 and 6.0whereas the P/E ratios obtained through strategicsales have been much higher, reaching up to 63 incase of the IBP disinvestment.
Closure of Non-revivable Sick PublicEnterprises
7.1.53 At present the process of rehabilitation/winding up of an PSEs is through the mechanism ofBIFR under SICA. BIFR examines various possibilitiesand approves revival plan for the sick PSUs orrecommend closure. The Companies (Amendment)
Bill, 2001, which will seek the establishment of theNCLT to address of sickness and bankruptcy hasbeen introduced in Parliament. The abolition of SICAbill was introduced in Lok Sabha in August, 2001. Asthese Bills get enacted the process of industrialrestructuring should become easier and faster.
Removal of Regional Imbalances in IndustrialDevelopment
7.1.54 The Growth Centres Scheme and TransportSubsidy Scheme were initiated as Centrally sponsoredschemes to promote industrialisation of backwardareas and promote industries in hilly, remote andinaccessible regions. The funding pattern of GrowthCentres envisaged an equity contribution of Rs. 10crore by the Centre, Rs. 5 crore by the concernedState, Rs. 4 crore (including Rs. 2 crore as equity)from financial institutions, Rs. 1 crore from nationalisedbanks and Rs. 10 crore as market borrowings. Thisadds up to Rs. 30 crore per Growth Centre. Of the 71identified Growth Centres, 68 have been approvedand of these 38 are functional and plot allotment hascommenced in 56. Two Growth Centres have beensanctioned for the Jammu and Kashmir and three inthe newly created States of Uttaranchal, Jharkhandand Chattisgarh. The respective State Governmentshave been asked to expedite progress on theremaining 16 Growth Centres. The non-performingGrowth Centres are in Orissa, Bihar, Andhra Pradeshand Pondicherry.
7.1.55 The implementation of the scheme hasbeen rather unsatisfactory. Too many GrowthCentres have been taken up at the same time,resulting in thin spread of resources. Besides, ithas not been possible to mobilise marketborrowings as envisaged in the original scheme.More importantly, industrially advanced Stateshave been able to mobilise financial andmanagerial resources and make good progress,whereas there has been not much progress inindustrially backward States/most backwardregions. Thus, instead of reducing regionalimbalances in industrial development, thescheme has only aggravated them.
7.1.56 Further, because of funds constraints,State Governments did not release funds to theimplementing agencies. After some mid-course

INDUSTRY
673
corrections, there has been an improvement in theimplementation of the scheme during the past twoyears. In order to overcome the difficulties faced inthe implementation of the scheme, it is proposed tomodify the Growth Centres Scheme by bringingchanges and allowing split location up to a maximumof three locations for hilly States and two for theother States. There is a proposal to transfer thescheme to the States along with funds.
The number of functional Growth Centres, duringthe last two years has increased from 26 to 38 andthe amount of Central assistance has increasedfrom Rs. 291 crore to Rs. 371 crore. The contributionof the State Government and their implementingagencies increased from Rs. 405 crore to Rs. 689crore in the same period. The number of industrialunits has also increased from 656 to 833, attractingcapital investment of Rs. 8,531 crore and creatingdirect employment for 28,233 persons, as on 31March 2002.
7.1.57 The Transport Subsidy Scheme wasintroduced in July 1971 to promote industries in hilly,remote and inaccessible areas of Jammu andKashmir, Himachal Pradesh, Sikkim, Andaman andNicobar Islands and Lakshadweep, the Darjeelingdistrict of West Bengal, eight hill districts of UttarPradesh and the northeastern States. Under thescheme, subsidy at rates ranging from 50 per centto 90 per cent on the transport cost incurred onmovement of raw materials and finished goods from/to designated rail heads/ports is provided to allindustrial units except plantations, refineries andpower generation units. The scheme works onreimbursement basis i.e. subsidy to eligible units isfirst disbursed by the States/ Union territoriesconcerned and the disbursement is claimed fromthe Centre.
7.1.58 The scheme has been extended up to 31March 2007 for the northeastern States and Sikkim.It was valid up to 31 March 2000 for other States. Aproposal to transfer the Transport Subsidy Schemeto States along with funds is under consideration ofthe Government.
7.1.59 Total disbursal under the scheme from 1April 1976 to 31 March 2002 is Rs. 706.77 crore.The major beneficiaries have been Himachal
Pradesh (Rs. 209 crore), Assam (Rs. 200.34 croreup to 31 March 2001), Jammu and Kashmir (Rs.29.34 crore) and the hill districts of Uttar Pradesh(Rs. 15.83 crore) besides the northeastern regionincluding Assam which received Rs. 403.36 crore.
7.1.60 The National Productivity Council (NPC)was asked to examine the impact of the schemeon the industrialisation process in the beneficiaryStates, including nature and pattern ofindustrialisation, size of unit, employmentgeneration and ancillarisation. The study coveredAssam, Himachal Pradesh, the hills districts of UttarPradesh, Jammu and Kashmir, Meghalaya,Mizoram, Nagaland for the 1989-90 to 1997-98period. The NPC study concluded that though therehas been industrial growth, it has been uneven. InHimachal Pradesh, the number of factories grew atan annual rate of 10.5 per cent, while Assam had amoderate growth of 1.59 per cent in number offactories, output (2.21 per cent) and employment(3.05 per cent). The employment generated bybeneficiary units in these remote, hilly andinaccessible areas is approximately for 25,600people. There has been expansion anddiversification in the units though ancillary units didnot develop significantly. There have been indirectbenefits also like infrastructure development andgeneration of income for the State Governmentsthrough other levies. The study also indicated theareas which require strengthening, in order toimprove implementation and reduce delays.
Review and Revamping of BIFR Mechanism
7.1.61 The present legal framework - the SICAunder which sick companies are referred to BIFRwas originally designed to provide sick companieswith assistance to allow them to restructure and tobe rehabilitated, thus forestalling closure and lossof employment. It has proved to be almostcompletely ineffective. It has provided unscrupulousmanagements with an extended period during whichall recovery action is stayed and the time gained inthe process is often used to siphon funds out ofsick companies making them un-revivable. Thisensures that companies that run into difficulties areinvariably driven into terminal sickness. At times,promoters may even perceive a benefit in pushinga company into sickness. Unfortunately, the Indian

TENTH FIVE YEAR PLAN 2002-07
674
financial and legal system lacks an effective systemfor enforcing recovery of debts through speedybankruptcy procedures with mechanism that wouldallow inefficient firms failing to service loans to bespeedily liquidated or taken over by a newmanagement. In order to solve the problem, theCompanies (Amendment) Bill 2001 was introducedin Parliament in August 2001 along with the Abolitionof Sick Industrial Companies (Amendment) Bill,2001.
Policy and Procedural Reforms in States
7.1.62 The process of liberalisation in theindustrial sector has advanced considerably at theCentre. Industrial licensing has been eliminated forall but six industries and the number of industriesreserved for the public sector has been reduced tothree. The remaining controls at the CentralGovernment level need to be reviewed for furtherliberalisation. Indian industry still suffers from aplethora of controls and regulations relating tomatters in the purview of State and these controlscumulatively impose a heavy burden of delay andeven harassment of entrepreneurs. A throughrevamping of these controls and procedures at theStates Government level would help create a climateconducive to Indian industry to flourish.
Feedstock and Pricing Policy for Fertilisers
7.1.63 With the introduction of Retention Pricecum Subsidy scheme (RPS), the country achievedself-sufficiency by the end of Ninth Plan to the extentof nearly 100 percent of urea and 85 percent incase of DAP. This price arrangement however hasencouraged the urea manufacturers to focus moreon claiming costs rather than controlling costs byenhancing production efficiency. The urea pricingpolicy parameter for VII and VIII pricing periods havebeen recommended by the Group of Ministers(GOM) headed by Deputy Chairman, PlanningCommission. Corresponding retention prices havebeen notified for most of the units. The ExpenditureReforms Commission (ERC) recommendation onrationalisation of fertiliser subsidy by introducinggroup based urea pricing is under examination alongwith other alternatives on a new urea pricing policy.In response to the import parity pricing of feedstock,a new pricing mechanism for hydrocarbons wasimplemented and oil companies started following
this from 9 July 2001. The NPK ratio which had gotdistorted to 10.0:2.9:1 during 1996-97 has sinceimproved to 6.9:2.9:1 in 1999-2000. It needs to bekept in mind that bio-fertilisers, micronutrients andorganic compost should remain an integral part ofbalanced fertiliser application and integrated nutrientmanagement. Use of these supplements needs tobe promoted by research, better marketing andcompetitive pricing.
Sugar Policy
7.1.64 The Government has taken a number ofimportant policy decisions as part of the reformprocess in the sugar sector. The sugar industry wassubjected to compulsory licensing at thecommencement of the Ninth Plan and wasdelicensed in September 1998. Some of thesedecisions are:
• Reduction of levy obligation of domestic sugarproducers from 40 per cent to 30 per cent witheffect from 1 April 2000, from 30 per cent to 15per cent from 1 February 2001 and from 15per cent to 10 per cent from 1 March 2002.
• Restructuring Sugar Development Fund Rules,1982 for providing loans at concessional ratesfor the rehabilitation of potentially viable sicksugar mills.
• The Government has also approved a proposalfor legislation to amend the SugarDevelopment Fund (SDF) Act,1982 for loansfor bagasse-based co-generation powerprojects, by-product utilisation and defrayingexpenditure on internal transport and freightcharges on export shipments of sugar. Thiswas being done to improve the viability of thesugar factories as also to augment the powergeneration in the country.
• Relaxation in controls on the sale of non-levy freesale sugar and substituting the monthly regulatoryrelease by quarterly regulatory release andallowing the sugar factories to sell up to 10 percent of the quarterly quota as additional quota.This has become effective from January 2002.
• Withdrawal of stockholding limits on wholesaledealers of sugar was done with effect from 7July 2000.

INDUSTRY
675
• Turnover limits on wholesale dealers wereabolished with effect from 20 August 2001.
• A notification under the Forward Contracts(Regulation) Act, 1952, allowing futures/forward trading in sugar was issued on 14 May2001.
Pharmaceutical Pricing Policy
7.1.65 The Pharmaceutical Policy, 2002, aims toensure abundant and good quality essentialpharmaceuticals at reasonable prices, strengthenindigenous capability for cost effective qualityproduction, reduce trade barriers and encourageR&D. Items appearing in the list of essential drugsissued by the Ministry of Health and Family Welfareand other items considered important on accountof their use in various health programmes, inemergency care etc. have been kept under the DrugPrice Control Order (DPCO) and will form the totalbasket from which selection of bulk drugs will bemade for price control. However, items like sera andvaccines and blood products have been excludedfrom DPCO. As per the new criteria, molecules witha turnover of less than Rs. 10 crore for the fiscalended March 2001 will not fall under DPCO, but adrug having a turnover between Rs. 10-25 croreand a single formulator having a market share ofover 90 per cent will be covered by the price controlorder. Further, a drug with a turnover of over Rs. 25crore and a single formulator and having a marketshare of over 50 per cent will be under price control.New drugs coming out of research from within thecountry would be off price control for the life of thepatent. It has been decided to permit up to 100 percent foreign equity under the automatic route so asto promote FDI. India, as a signatory to WTO, iscommitted to the introduction of a product patentregime in 2005. This will be a major change thatwill impact the Indian pharmaceutical industry. Theremay be a need for a review of the newly announcedPharmaceutical Policy 2002 to deal with thechanged scenario.
Review and Modification of Food Laws and Drugand Cosmetics Act
7.1.66 During the Ninth Plan, many provisionsof the food laws and their implementation strategyhave created hurdles in the way of growth and
development. The Prevention of FoodAdulteration Act, (1954) and Rules (1955) hasbeen a source of considerable harassment. Thestandards are unrealistic and there is moreemphasis on policing than on prevention ofadulteration. It has been recommended that thevarious food laws would need to be reviewed andsuitably modified at an early date. However, therehas been no appreciable progress in themodification of food laws. The Drugs andCosmetics Act, 1940 was reviewed so as toincorporate the provisions of World HealthOrganisation-Good Manufacturing Practices(WHO-GMP).
Policy And Fiscal Measures For ThePackaging Industry
7.1.67 The packaging industry for processedfoods, it has been observed, is yet to developand there is a wide gap between the indigenousand contemporary packaging practices of foodproducts. The cost of packaging is also very high.The Ninth Plan has recommended thatappropriate policy and fiscal measures be takento encourage scientific development of packagingindustry. However, there appears to be littleprogress towards this.
PERFORMANCE OF THE INDUSTRIAL SECTOR
7.1.68 The post-liberalisation period ischaracterised by three distinct phases ofindustrial activity. The first is the period after theannouncement of liberalisation of industrial andtrade policy in July 1991 till the start of rapidgrowth in 1993-94. The second phase recordeda high growth rate during 1993-94 to 1995-96.The third phase is one when industrial activityslowed down since 1996-97.
Growth Of Industry
7.1.69 The Ninth Plan proposed a target growthrate of 8.2 per cent (value added) for the industrysector. As against this, the actual growth rate(value added actual at factor cost) was 4.5 percent. The actual growth rates of various sub-sectors vis-à-vis targets at the start of the NinthPlan as well as revised targets after the Mid-Term

TENTH FIVE YEAR PLAN 2002-07
676
Appraisal are indicated in Table 7.1.5. The year-wise growth rates are shown in the Graph 7.1.6.
7.1.70 During the Ninth Plan period, a CompoundAnnual Growth Rate (CAGR) of 5 per cent in
industrial production was recorded compared to 7.3per cent during the Eighth Plan (Table-7.1.7). TheCAGR in manufacturing, mining and electricitygeneration during Ninth Plan were 5.3 per cent, 2.5per cent and 5.5 per cent respectively.
Table 7.1.5 : Value added growth rate in sub sectors of Industry in the Ninth Plan
Share of sub sectors Growth rate Revised targets Growth ratein 1999-2000(provisional) (value added) after Mid Term actual
at 1993-94 prices -target Appraisal (5 years) (value added)
Manufacturing 16.75 8.2 7.1 3.7
Electricity, Gas and Water 2.49 9.3 8.4 6.5
Mining 2.34 7.2 5.1 3.9
Construction 5.12 4.9 6.8 6.8
Table 7.1.7 : Annual growth rates of industrial production in major sectors of industry
(Base: 1993-94 = 100) (per cent)
Period Mining Manufacturing Electricity General
(Weight) (10.4) (79.4) (10.2) (100.0)
(11.5)* (77.1)* (11.4)* (100.0)*
1992-93 0.5 2.2 5.0 2.3
1993-94 3.5 6.1 7.4 6.0
1994-95 9.8 9.1 8.5 9.1
1995-96 9.7 14.1 8.1 13.0
1996-97 -1.9 7.3 4.0 6.1
1997-98 6.9 6.7 6.6 6.7
1998-99 -0.8 4.4 6.5 4.1
1999-2000 1.0 7.1 7.3 6.7
2000-01 3.7 5.3 4.0 5.0
2001-02 1.8 2.9 3.1 2.8
Compound Annual Growth Rate (CAGR) 1997-2002 2.5 5.3 5.5 5.0
Growth rates from 1994-95 onwards are based on IIP; Base : 1993-94=100 and those for earlier years are based on IIP;Base : 1980-81=100.*Relates to weights for IIP Base:1980-81=100

INDUSTRY
677
7.1.71 Table 7.1.8 shows the annual average rateof growth recorded in industry groups on use-basedclassification.
7.1.72 Industrial production, measured by theindex of industrial production (IIP), registered agrowth rate of 6.7 per cent in 1997-98. This highergrowth rate compared to previous year was onaccount of improved performance of the mining andelectricity sectors. In 1998-99, the industrial growthrate was merely 4.1 per cent because of poorperformance by the mining and manufacturingsectors. Use-based growth rate indicates thatgrowth in basic goods, intermediate goods andconsumer goods in 1998-99 declined to 1.6 per centand 6.1 per cent and 2.2 per cent respectively.Industrial production had shown a distinctimprovement (6.7 per cent growth) in 1999-2000.The improvement was particularly noticeable inmanufacturing and electricity generation.
7.1.73 The IIP registered a significantly lowergrowth rate of 5 per cent in 2000-01 compared toa growth rate of 6.7 per cent in 1999-2000. Growthrates also fell in both the manufacturing andelectricity sectors from 7.1 per cent and 7.3 percent in 1999-2000 to 5.3 per cent and 4 per centrespectively in 2000-01. However, the miningsector recorded a higher growth rate of 3.7 percent in 2000-01 compared to 1 per cent in 1999-2000. Trends in 2001-02 in overall industrialgrowth and by sectors suggest an all roundslowdown in industrial activity. A growth rate of2.9 per cent in the manufacturing sector in 2001-02 was recorded. Similarly, the electricitygeneration growth rate of 3.1 per cent was alsosignificantly lower than 4 per cent growthrecorded during the last year. The mining sectorgrowth of 1.8 per cent was also significantly lowerthan the 3.7 per cent recorded during the lastyear.
Table 7.1.8Growth Rates Of Industrial Production By Use-based Classification
(Base : 1993-94=100) (per cent)
Sectors (Weight) 1995- 1996- 1997- 1998- 1999- 2000- 2001-96 97 98 99 2000 01 02
Basic Goods 35.5 10.8 3.0 6.9 1.6 5.5 3.9 2.8
Capital Goods 9.3 5.3 11.5 5.8 12.6 6.9 1.8 -3.9
Intermediate Goods 26.5 19.4 8.1 8.0 6.1 8.8 4.7 1.6
Consumer Goods 28.7 12.8 6.2 5.5 2.2 5.7 8.0 6.0
of which (Consumer Durables) (5.4) (25.8) (4.6) (7.8) (5.6) (14.1) (14.5) 11.5
(Consumer Non-Durables) (23.3) (9.8) (6.6) (4.8) (1.2) (3.2) (5.8) 4.0
IIP (Index of Industrial Production) 100.0 13.0 6.1 6.7 4.1 6.7 5.0 2.8
Note : The indices are based on revised item wise weights.

TENTH FIVE YEAR PLAN 2002-07
678
7.1.74 Table 7.1.9 shows the annual average rateof growth recorded in industry groups at the twodigit level during the Eighth Plan and Ninth Planperiods.
7.1.75 The group-wise industrial growth rate(Table 7.1.9) indicate that five out of 17 industrygroups, accounting for 24.17 per cent share in IIP,recorded a CAGR of more than 8 per cent during1997-2002. Three groups, accounting for 19.28 percent share in IIP, recorded 6 to 8 per cent CAGRduring 1997-2002. Ten industry groups, accountingfor 35.9 per cent share in IIP, recorded less than 6per cent growth rate.
7.1.76 Basic metal and alloys, cotton textiles,wood and wood products, paper and paper productsand transport equipment experienced lower growth
rates in Ninth Plan compared to Eighth Plan period.Sectors like non-metallic mineral products, man-made fibre textile (except cotton), leather products,rubber, plastics and petroleum products, chemicaland chemical products achieved higher growth ratesin the Ninth Plan compared to Eighth Plan period.
Internal and External Factors for the Slowdown
7.1.77 The industrial slowdown is widespread,covering all broad sectors e.g. manufacturing,electricity and mining and all end use based groupssuch as capital goods, intermediate goods andconsumer goods (both durable and non-durables).The slowdown in domestic and global demandappeared to be a major factor constraining industrialgrowth. Another major reason has been the declinein investment, noticeably by private sector.
Table 7.1.9Trends in The Performance of Industrial Sub-Sectors
Annual Growth Rate (Per Cent)
Industry Industry Name Weight 1997- 1998- 1999- 2000- 2001- CAGR AverageCode in IIP 98 99 2000 01 02 1997- growth
2002 VIII Plan
20-21 Food Products 9.08 -0.40 0.70 4.20 10.12 -1.68 2.49 3
22 Beverages & Tobacco 2.38 19.40 12.90 7.60 4.32 12.18 11.17 11
23 Cotton Textiles 5.52 2.40 -7.70 6.70 2.91 -2.20 0.29 4
24 Wool, Silk & Man-made Fibre 2.26 18.50 2.80 11.90 5.81 4.40 8.53 0Textiles (Except Cotton)
25 Jute Textiles 0.59 16.90 -7.30 -0.90 0.76 -5.86 0.37 0
26 Textiles Products 2.54 8.50 -3.50 2.00 4.04 2.40 2.60 0
27 Wood & Wood Products 2.70 -2.60 -5.80 -16.20 2.86 -11.03 -6.79 4
28 Paper & Paper Products 2.65 6.90 16.00 6.30 -9.14 2.99 4.29 9
29 Leather & Fur Products 1.14 2.20 8.10 13.80 10.70 5.93 8.07 5
30 Chem. & Chem. Products 14.00 14.40 6.60 10.00 7.29 4.76 8.56 7
31 Rubber, Plastic, Petroleum 5.73 5.20 11.30 -1.10 11.81 11.08 7.55 3
32 Non-metallic Mineral Products 4.39 13.40 8.30 24.40 -1.18 1.37 8.89 6
33 Basic Metals & Alloys 7.45 2.60 -2.50 5.00 1.84 4.01 2.16 10
34 Metal Products & Parts 2.81 7.90 17.00 -1.20 15.02 -9.59 5.34 5
35-36 Machinery & equipment 9.57 5.80 1.50 17.70 7.29 1.02 6.51 6-8
37 Transport equipment 3.98 2.50 20.10 5.70 -1.96 6.83 6.40 13
38 Other Manufacturing Industries 2.56 -1.30 1.00 -16.00 11.65 8.86 0.35 1
Source : Central Statistical Organisation.Note : The indices from April 1998 onwards are based on revised weights.
INDUSTRY
679
7.1.78 The industrial deceleration was due to anumber of structural and cyclical factors such asnormal business and investment cycles, a lack ofboth domestic and external demand, continuing highreal interest rates, infrastructure bottlenecks inpower and transport, lack of reforms in land andlabour markets, inherent adjustment lags resultingfrom industrial restructuring through merger andacquisitions, and delays in establishing appropriateinstitutional and regulatory frameworks in some keysectors.
7.1.79 The difficulties caused by internalconstraints were exacerbated by the slow growthin the world economy, which contributed to asubstantial slowdown in manufactured exports.Further, the 11 September 2001 terrorist attacksand related events slowed down the recoverythrough lack of external demand and adverseimpact on air transport, communications andtourism.
Gross Capital Formation and Sanctions by AllFinancial Institutions
7.1.80 The CAGR of gross capital formation(GCF) at constant prices (1993-94 prices) duringthe first four years of the Ninth Plan was 7.92per cent compared to 7.38 per cent during 1993-97. The CAGR of GCF for the public sector atconstant prices during the first four years of theNinth Plan increased to 6.22 per cent comparedto 1.04 per cent during 1994-97. In the privatecorporate sector, the CAGR of GCF during thefirst four years of the Ninth Plan has beennegative at (-) 1.24 per cent compared toimpressive 18.91 per cent during 1993-97.
7.1.81 The fall in interest rates has been lowerthan fall in inflation in recent years. As a result, realinterest rates continue to remain high. Comparedwith a real prime lending rate of 2.4 per cent in 1994-95, it was around 7.3 per cent in 2001. The CAGRof sanctions by All Financial Institutions (AFIs)during the first four years of the Ninth Plan was21.21 per cent compared to 19.53 per cent in theEighth Plan. The CAGR of disbursement in thecorresponding periods were 14.30 per cent and21.28 per cent respectively.
Investment Intentions and Foreign DirectInvestment
7.1.82 A total of 14,969 Industrial EntrepreneursMemoranda (IEM) and 911 Letter of Intents (LOI)were filed between 1997 and October 2001.Investment intentions in terms of number under IEMreduced from a cumulative level of 25,307 duringthe Eighth Plan period to 14,969 during the NinthPlan. These 14,969 IEMs correspond to investmentof Rs. 3,91,292 crore and employment generationof 26.42 lakh. The reported implementation of IEM(out of 14,969) is however, only 1,931 numbersinvolving investment of Rs. 79,905 crore indicatingimplementation of only 12.9 per cent in terms ofnumber and 20 per cent in terms of investment.The 911 LOIs proposed an investment of Rs. 15,906crore and employment of 1.84 lakh.
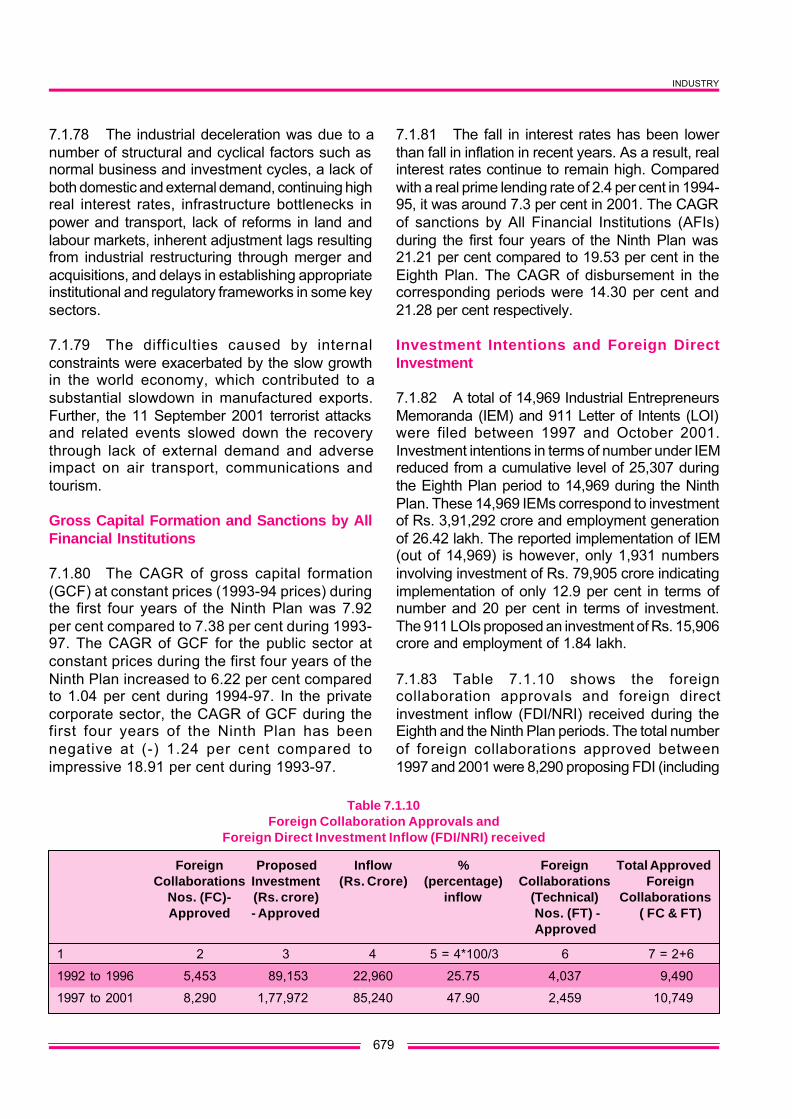
7.1.83 Table 7.1.10 shows the foreigncollaboration approvals and foreign directinvestment inflow (FDI/NRI) received during theEighth and the Ninth Plan periods. The total numberof foreign collaborations approved between1997 and 2001 were 8,290 proposing FDI (including
Table 7.1.10Foreign Collaboration Approvals and
Foreign Direct Investment Inflow (FDI/NRI) received
Foreign Proposed Inflow % Foreign Total ApprovedCollaborations Investment (Rs. Crore) (percentage) Collaborations Foreign
Nos. (FC)- (Rs. crore) inflow (Technical) CollaborationsApproved - Approved Nos. (FT) - ( FC & FT)
Approved
1 2 3 4 5 = 4*100/3 6 7 = 2+6
1992 to 1996 5,453 89,153 22,960 25.75 4,037 9,490
1997 to 2001 8,290 1,77,972 85,240 47.90 2,459 10,749

TENTH FIVE YEAR PLAN 2002-07
680
ADRs /GDRs/FCCBs) of Rs. 1,77,972 crore. Theactual inflow of FDI (including ADRs/GDRs/FCCBs)during the period was Rs. 85,240 crore as againstapproval for Rs.1,77,972 crore representing anoverall inflow of 47.9 per cent. A major change inquantum of foreign technology transfer proposals(i.e. not involving FDI) during the Ninth Plancompared to Eighth Plan is observed. Between 1997and 2001, only 2,459 technology transfer proposalswere approved compared to 4,037 numbers from1992 to 1996. This may be partly because of lackof willingness to transfer technology withoutownership control and costly technology importsmay also not be offering the benefits which wereavailable in restrictive environment.
Export
7.1.84 The CAGR of exports during the first fouryears of the Ninth Plan was 7.42 per cent comparedto 13.38 per cent during the Eighth Plan. The shareof manufactured goods in overall exports was 78per cent during the Ninth Plan vis-à-vis 75 per centduring the Eighth Plan. Engineering goodsconstitute 19 per cent within the manufacturedgoods. The growth of manufactured goods however,has been slower in the Ninth Plan compared to theEighth Plan. A medium term export strategy,unveiled in January 2002 to provide a quantum jumpto exports in the next five years, provides a mix ofmacro policies and sector-specific policies indicatingattainable goals. The CAGR of imports during firstfour years of the Ninth Plan was 6.6 per centcompared to 15.05 per cent during the Eighth Plan.The import of capital goods, which was 16.66 percent in 1997-98, declined to a level of 15.9 per cent
in 2000-01. The CAGR of capital goods importduring the first four years of the Ninth Plan periodwas (-) 3 per cent compared to 18.58 per cent duringthe Eighth Plan. A positive development during 2001-02 has been the reversal of the trend in import ofcapital goods which have increased by 6.6 per centduring April-October 2001. The share of importrelated to export items has been steady in the rangeof 15-16 per cent over the Ninth Plan period.
Employment Situation In The ManufacturingSector
7.1.85 Table 7.1.11 shows the employmentsituation in organised manufacturing in theprivate and public sectors. The organisedmanufacturing sector employs approximately 23-24 per cent of total manpower. The role of thepublic sector as a provider of employment hassharply reduced during the Ninth Plan period. Atthe same time, there was no appreciable growthin employment in the private sectormanufacturing. In terms of total numbers, theemployment has been stagnant in manufacturingsector from 1996 to 2000.
SECTORAL PROFILE OF THE TENTH PLAN
Iron and Steel Sector
7.1.86 The PSUs of the Ministry of Steel are: SteelAuthority of India Ltd. (SAIL), Rashtriya Ispat NigamLtd. (RINL), Sponge Iron India Ltd. (SIIL), HindustanSteelworks Construction Ltd. (HSCL), MECON Ltd.,Bharat Refractory Ltd. (BRL), MSTC Ltd., and FerroScrap Nigam Ltd. (FSNL).
Table 7.1.11Employment situation in Organized manufacturing
(in lakh)
Manuf. Manuf. Total Employment Employment Total % (percentage)(Private (Public Employment (in public (in private Employment Employmentsector) Sector) in manufacturing Sector) Sector) in organised in organised
Sector manufacturing
1991 44.81 18.52 63.33 190.57 76.77 267.34 23.69
1996 50.49 17.38 67.87 194.29 85.12 279.41 24.29
2000 50.85 15.31 66.16 193.14 86.46 279.60 23.66
Source : Economic Survey, 2001-02 Ministry of Finance

INDUSTRY
681
7.1.87 Some of the PSUs have had the advantageof capital restructuring in the Ninth Plan. The profitmargins of the private and public sector steel-making units were hit by the general economicslowdown resulting in depressed domestic demandand stagnant market conditions, protectionistmeasures in the developed countries, liberalisationof trade, removal of entry barriers, reduction inCustoms duty on imports of steel items etc. WhileRINL and SIIL have shown a relatively betterperformance, SAIL continues to make losses.Therefore, priority needs to be given to strategieswhich would ensure long-term as well as short-termprofitability of the PSUs. The removal of entrybarriers has attracted relatively large privateinvestment in the private sector. This could beattributed to liberalisation and policy reforms. Therewas a sudden spurt in investment during the firsthalf of the Ninth Plan. However, due to recessionduring the latter half of the 1990s, the investmentalready made as well as committed is not yieldingthe desired results.
7.1.88 The strategies relied upon during the NinthPlan included cost reduction, rightsizing ofmanpower, stabilisation of production, sale of idleassets, sale of non-core assets, identification andclosure of uneconomic units, focus on corecompetence, reduction in input-cost, ensuringmaximisation of output per unit, improvement inoperational efficiency, enhancement in productivityper man hour and achieving the optimum productmix.
7.1.89 Research and Development (R&D) in theiron and steel sector is carried out mainly by thesteel plants, national research laboratories andacademic institutions. Around Rs. 80 crore is spentannually on R&D, which is only about 0.2 per centof the total turnover of the steel Industry in thecountry as against approximately 3 per cent inadvanced countries. To encourage R&D activity inthe country, the Government has decided to spendup to Rs. 150 crore per year from the SteelDevelopment Fund (SDF) on R&D.
7.1.90 As the Indian economy is going through arecession, its adverse impact would be felt on theiron and steel sector. The growth of domesticdemand for finished steel during the Tenth Plan
could be at the modest rate of about 6.25 per cent.The apparent consumption of finished steel during2001-02 was estimated to be around 27 millionmetric tonnes (mmt). This is expected to rise to 38mmt by the terminal year of the Tenth Plan (2006-07). While imports would be confined to two milliontonnes (mt), the scope for exports depends uponthe competitiveness of Indian steel in theinternational market. The threat of dumping of steelin the domestic market could continue because offalling prices in the international market.
7.1.91 Due to general slowdown in the major steelconsuming sectors and restrictions imposed bymajor steel importing countries, there is excesscapacity in the domestic steel manufacturing sector.Therefore, no additional capacity is likely to becreated in the Tenth Plan, particularly in the hot rolledproducts.
Capital goods and Engineering Industry
7.1.92 The engineering industry comprises ofindustries manufacturing engineering goods suchas metal products, office machinery, electronicgoods etc., in addition to capital goodsmanufacturing industry. The capital goods industryas covered in the IIP comprises 53 industry sectors.The main sectors are machine-tools, industrialmachinery, electrical machinery, shipbuilding, dieselengines and commercial vehicles etc.
7.1.93 None of the industry sectors under capitalgoods attract any industrial licensing provisions and100 per cent FDI is allowed under the automaticroute.
7.1.94 During the first four years of Ninth Plan,the capital goods sector registered a CAGR of6.71 per cent. The sector grew at an impressivegrowth rate of 12.6 per cent in 1998-99. However,with the slackening of demand in different sectorsof economy, the growth rate reduced to merely1.8 per cent in 2000-01. The sector registered anegative growth rate of (-) 3.9 per cent during2001-02.
7.1.95 With the abolition of quantitativerestrictions on import of capital goods since 1991,and emphasis on modernisation in different

TENTH FIVE YEAR PLAN 2002-07
682
manufacturing sectors, the share of imported capitalgoods in gross fixed assets (GFA) increased from12.2 per cent in 1993-94 and touched a peak of 20.8per cent in 1995-96. This trend has, however,reversed since 1996-97. The share of importedcapital goods in GFA decreased to 17.6 per cent in1999-2000 within the overall manufacturing sector.The propensity to import in certain segment ofindustries like textiles, electrical machinery,automobile, auto-ancillary and leather products,however, have been very high. The share ofimported capital goods in these segment ofindustries varies in the range of 20-50 per cent.
7.1.96 The intensity of uses of importedequipment is on the lower side in chemicalsmanufacturing barring a few sectors like alkalies,plastic products and fertilisers. Indian industrialmachinery manufacturers have the capability tomanufacture a variety of unit equipments ofstringent specifications required for the chemicalindustry. Similarly, ferrous and non-ferrous metalmanufacturing industries largely depend onindigenous equipment except for some tailor-madeequipment.
7.1.97 Industry sector-wise FDI inflow (excludinginflows under non-resident Indian (NRI) directinvestment and inflows due to acquisition of sharesunder Section 5 of the Foreign ExchangeManagement Act (FEMA), 1999 indicate that inflowsto engineering sector between 1997-98 and 2000-01 has been to the tune of $ 1,607 millionrepresenting 19.02 per cent of FDI inflows. The FDIinflows in the electronics and electrical equipmentsector during first four years of the Ninth Plan hasbeen $ 1,258 million representing 14.89 per cent oftotal inflows. However, the increase in GFA in thecapital goods sector has not kept pace with themanufacturing sector.
7.1.98 The industry has undergone restructuringby phasing out certain lines of production andclosure of some unviable units. The machine toolssector has focused on certain specific areas andthere is increasing trend of segmentation in it.
7.1.99 Barring a few exceptions, PSUsmanufacturing capital goods have been facingserious competitive pressure and many of them
were referred to the BIFR. The process ofdisinvestment in many of these PSUs is underway. Bharat Heavy Electricals Ltd. (BHEL) hashowever, operated profitably despite stiffcompetition in the power equipmentmanufacturing sector. They have initiated topackage their equipments with limited financialparticipation also in line with global trends. The shareof Hindustan Machine Tools (HMT) in the machinetools sector reduced to 35 per cent in 2000-01. Thecompany is on the revival path and is in the processof being disinvested after financial restructuring in1997. The three issues concerning the capital goodsindustry are: (i) high cost structure of industrybecause of low level of production, lack ofspecialisation etc., something the industry wouldneed to address; (ii) need to encouragemodernisation and R&D to withstand competition;and (iii) unfavourable duty structure particularly zerocustoms duty on import of items for certain sectors.
Ship-building and Ship-repair Sector
7.1.100 There are 28 shipyards in the country, 19of them in the private sector. Four public sectorshipyards two under the Ministry of Shipping andtwo under the Ministry of Defence are capable ofbuilding large ocean-going vessels. The annualturnover of the shipbuilding and ship repair industryis approximately Rs. 2,000 crore and it employsaround 31,000 persons.
7.1.101 The two public sector shipyards under theMinistry of Shipping – Hindustan Shipyard Ltd.(HSL) and Cochin Shipyard Ltd. (CSL) – constitute25 per cent of the industry turnover, i.e. an annualturnover of approximately Rs. 450 crore. Theemployee strength in CSL, HSL and Hooghly Dockand Port Engineers Ltd. (HDPE) is approximately7,800. The three shipyards under the Ministry ofDefence – Mazgaon Dock Ltd. (MDL), GardenReach Shipbuilders & Engineers Ltd (GRSE) andGoa Shipyard Ltd.(GSL) – build a variety of shipsand vessels primarily for Indian Navy and CoastGuard.
7.1.102 The assessed production capacity of fourlarge PSUs constitute 95 per cent of the industryturnover. The present annual shipbuilding capacityin India is 0.15 million compensated gross tonnage

INDUSTRY
683
(CGT), vis-à-vis 20 million CGT globally. As such,the Indian shipbuilding capacity is less than one percent of the global capacity. The global shipping andshipbuilding industry have advanced considerablyin the last 10 years, while the Indian industry hasbeen stagnant. The trend is towards high capacitycontainerships, cargo ships, tankers so as toachieve competitiveness in tariff. These trends havenecessitated modernisation in ports as well asshipbuilding/repairing facilities. Despite providing acompetitive policy environment in India (i.e. statusof 100 per cent export-oriented units (EOU) to theship repair industry), the industry could not grow tothe expected levels. The main constraints seem tobe lack of infrastructural and managerial capacity.
7.1.103 The overall performance of theshipbuilding and ship repair industry during the NinthPlan has improved. As a matter of policy, emphasiswas given to ship-repair activity by the yards toimprove their financial performance. CSL has beena profit-making yard during the Ninth Plan period.The Hindustan Shipyard Ltd., however, could notimprove the performance even after financialrestructuring. The Committee of Secretaries hasrecommended the closure of the HDPE. Indianshipyards however, find it difficult to cope withcompetition from abroad, the main reasons beinglack of design-base, very high cost of productionand long delivery periods. Further, the shipbuildingindustry is cyclical in nature and, therefore, the shipbuilders usually undertake ship repair activitiesduring the downward trend in shipbuilding.
7.1.104 The main policy issues concerning theshipbuilding and ship repair sector arecontinuation of the Shipbuilding Subsidy Schemeand budgetary support for the R&D Scheme. TheShipbuilding Subsidy Scheme is meant for PSUsmanufacturing ocean-going vessels but is notdirectly linked to any specific objectives to beattained by the shipyards. The desirability ofcontinuation of this Subsidy Scheme would needto be looked into.
7.1.105 Classification societies are involved fromthe initial stage of ship design and shipbuilding asa third party certification agency. With the changingtechnological environment, increasing applicationof information technology and changes in safety
norms, it is imperative for shipyards to keep pacewith such developments to meet emergingclassification standards. The National Ship Designand Research Centre (NSDRC), Vishakapatnam,which was set up as a registered society becamefully operational in May 1993. NSDRC is presentlyinvolved in a diversified range of activities in theshipbuilding and marine industry. In the abovecontext, the society may primarily focus on theshipbuilding sector. The R&D Scheme in theshipbuilding sector may cover projects for industry-wide improvement in knowledge base,standardisation and skill development.
7.1.106 During the Tenth Plan, emphasis would begiven on productivity improvement in theshipbuilding sector and to have a more balancedapproach to the development of shipbuildingcapabilities in addition to business focus in shiprepair capabilities. There is a case for theprivatisation/disinvestment of public sectorshipyards to achieve these objectives.
7.1.107 To ensure long-term strategic/critical needsin shipping, investment in facilities creation inshipbuilding/ship repairs sector is desirable as thepresent capacities are at very low level. The workinggroup on Shipbuilding and Ship-repair Sector forthe Tenth Plan has envisaged an investment of Rs.2,200 crore (excluding investment in defencePSUs).
Automobile Sector
7.1.108 International majors in the automobilesector, who started operations in India immediatelyafter liberalisation, consolidated their operationsduring the Plan period. The industry witnessedstrengthening of segmentations and a very largenumber of new models were introduced. Theestablished manufacturers phased out some oldmodels and introduced new models. The sectorwitnessed changes in terms of design and state-of-the-art technology, giving confidence tomanufacturers to face international competition onthe home turf as well as to make their presence feltinternationally. Competition in the market as wellas increasing regulations relating to emissions andsafety norms have led to improvement in standardsin this sector
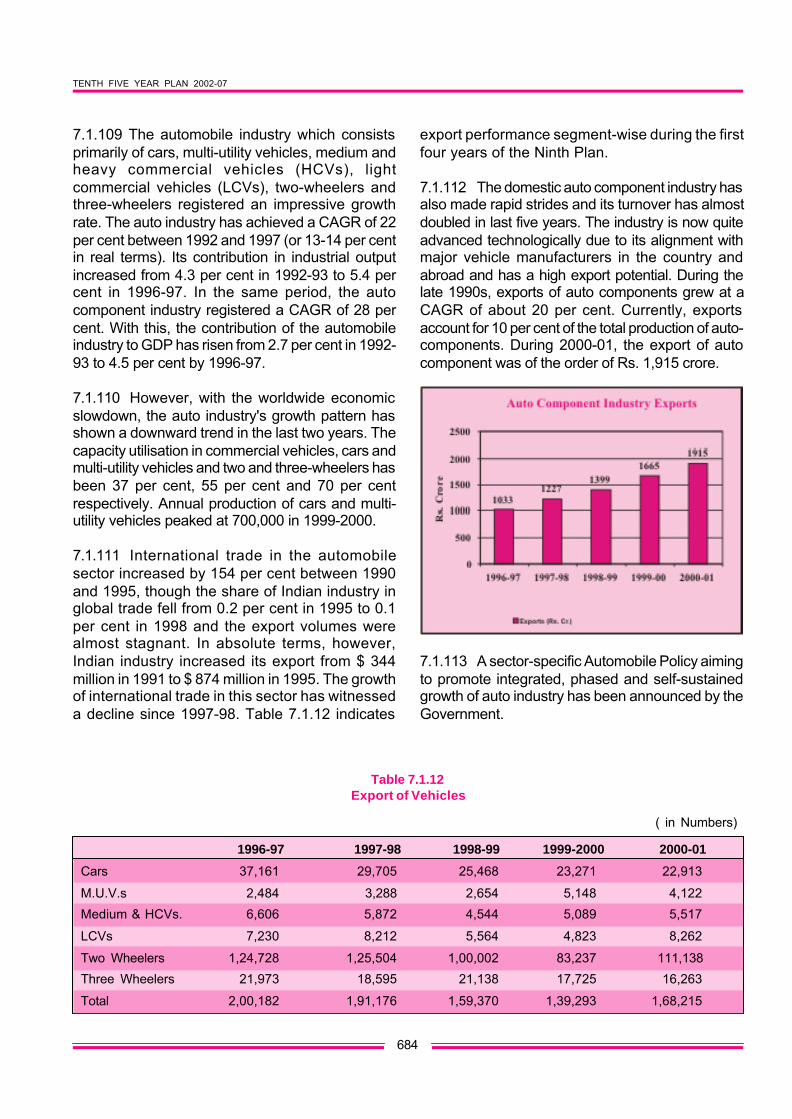
TENTH FIVE YEAR PLAN 2002-07
684
7.1.109 The automobile industry which consistsprimarily of cars, multi-utility vehicles, medium andheavy commercial vehicles (HCVs), lightcommercial vehicles (LCVs), two-wheelers andthree-wheelers registered an impressive growthrate. The auto industry has achieved a CAGR of 22per cent between 1992 and 1997 (or 13-14 per centin real terms). Its contribution in industrial outputincreased from 4.3 per cent in 1992-93 to 5.4 percent in 1996-97. In the same period, the autocomponent industry registered a CAGR of 28 percent. With this, the contribution of the automobileindustry to GDP has risen from 2.7 per cent in 1992-93 to 4.5 per cent by 1996-97.
7.1.110 However, with the worldwide economicslowdown, the auto industry's growth pattern hasshown a downward trend in the last two years. Thecapacity utilisation in commercial vehicles, cars andmulti-utility vehicles and two and three-wheelers hasbeen 37 per cent, 55 per cent and 70 per centrespectively. Annual production of cars and multi-utility vehicles peaked at 700,000 in 1999-2000.
7.1.111 International trade in the automobilesector increased by 154 per cent between 1990and 1995, though the share of Indian industry inglobal trade fell from 0.2 per cent in 1995 to 0.1per cent in 1998 and the export volumes werealmost stagnant. In absolute terms, however,Indian industry increased its export from $ 344million in 1991 to $ 874 million in 1995. The growthof international trade in this sector has witnesseda decline since 1997-98. Table 7.1.12 indicates
export performance segment-wise during the firstfour years of the Ninth Plan.
7.1.112 The domestic auto component industry hasalso made rapid strides and its turnover has almostdoubled in last five years. The industry is now quiteadvanced technologically due to its alignment withmajor vehicle manufacturers in the country andabroad and has a high export potential. During thelate 1990s, exports of auto components grew at aCAGR of about 20 per cent. Currently, exportsaccount for 10 per cent of the total production of auto-components. During 2000-01, the export of autocomponent was of the order of Rs. 1,915 crore.
7.1.113 A sector-specific Automobile Policy aimingto promote integrated, phased and self-sustainedgrowth of auto industry has been announced by theGovernment.
Table 7.1.12Export of Vehicles
( in Numbers)
1996-97 1997-98 1998-99 1999-2000 2000-01
Cars 37,161 29,705 25,468 23,271 22,913
M.U.V.s 2,484 3,288 2,654 5,148 4,122
Medium & HCVs. 6,606 5,872 4,544 5,089 5,517
LCVs 7,230 8,212 5,564 4,823 8,262
Two Wheelers 1,24,728 1,25,504 1,00,002 83,237 111,138
Three Wheelers 21,973 18,595 21,138 17,725 16,263
Total 2,00,182 1,91,176 1,59,370 1,39,293 1,68,215

INDUSTRY
685
7.1.114 The role of auto component manufacturerswho have simultaneously upgraded their facilitiesto meet the requirements would be changingsignificantly as the industry structure shifts fromcomponent level to sub-assembly level. This sectoris developing independently as well as it is gettingintegrated into supply chain of some internationalvehicle manufacturers. However, the overalldevelopment would be largely linked to the fortunesof domestic vehicle manufacturers.
7.1.115 India's exports are still dominated by rawmaterials and low technology items. Automobilesector exports is one worthwhile area representingmedium technology products.
7.1.116 Considering the prevailing technology andcompetitiveness of the sector, it would be desirableif a focused strategy promoting exports is formulatedon a priority basis. The estimated incrementalinvestment requirement in the auto sector and autocomponent sector during 2002-07 would beapproximately Rs. 1,539 crore and Rs. 6,592 crorerespectively on the basis of a GDP growth of 6.5per cent. If GDP grows at 8 per cent, the investmentrequirement in auto sector and auto componentsector during 2002-07 would be Rs. 1,654 croreand Rs. 10,136 crore respectively.
7.1.117 To keep pace on the regulation front inthe automobile sector, the Government has tosimultaneously modernise the existing regulatorysystems at the State level as well as amend theMotor Vehicles Act to introduce new provisionsto deal with the dynamic conditions. The roadtransport authorities would also require skillupgradation to understand and implement thenew regulations.
7.1.118 The upgradation of existing testing facilitiesmay be taken up on a priority basis. The Departmentof Heavy Industry may explore the possibility ofincreasing funding by the industry and if that doesnot materialise, the Government may considerrestricting its role to funding only and let themanagement of these facilities be the responsibilityof the industry. The creation of new facilities inphases with suitable scope, financial andmanagement structure may be finalised inconsultation with stakeholders.
7.1.119 Complex regulations for safety andenvironmental norms have been applicable inadvanced countries since the 1980s. AutomotiveResearch Association of India (ARAI) is working tointroduce safety and environmental norms at parwith norms in European countries. With liberalisationand the entry of international players, it becomesall the more essential that our national regulationsshould be updated in line with the latestdevelopments in technology. Out of the total of 114ECE regulations, about 35 Indian standards havebeen either partially or fully aligned, 36 are in theprocess of alignment and about 43 standards areyet to be taken up.
7.1.120 A projection of Rs. 350 crore of Planresources was made for setting up two new facilitiesand upgradation of existing testing facilities duringthe Tenth Plan. The Working Group on theAutomobile Sector also suggested the setting upof new facilities with participation from industry.
Fertilisers
7.1.121 Fertiliser is a critical input for maintainingor increasing agricultural production and itsimportance rests with the importance of agriculturein the Indian economy. Of the four major nutrientsNitrogen (N), Phosphorous (P), Potash (K) andSulphur (S) are lost through crops. Indian industrycaters to the requirement of the three: N, P and S.There is no conversion activity involved in case of Kexcept trading or mixing in the final stage of fertiliserproduction. About 58 percent of the domestic ureacapacity is based on Natural gas as feed stockwhereas naptha accounts for 29 percent and FuelOil (FO)/Low Sulphur Heavy Stock (LSHS), 13percent. On the pricing for the fertiliser units, onlyurea is, at the moment, under retention pricingscheme whereas phosphatic and potassic fertilizersare covered under a concession scheme.Government notifies the maximum retail price (MRP)of urea under the concession scheme, the indicativeMRP for decontrolled fertilisers, namelyDiammonium Phosphate (DAP), Muriate of Potash(MOP), and complexes. The MRP of single superphosphate (SSP) is left to be notified by the states.
7.1.122 The development of the Indian fertiliserindustry, even while remaining under the regime of

TENTH FIVE YEAR PLAN 2002-07
686
industrial licensing till 1991, has been phenomenaland largely due to the favourable price environmentin which industry was able to meet its increasingcost of production with reasonable assured returnon investment through a controlled pricemechanism. The farm gate price of fertilisers waskept low through fertiliser control order and industrywas insulated from the external competition. Abalance was struck between the interest of theindustry and that of the farmers by the Centralbudget absorbing the subsidy burden.
7.1.123 The move by the government to decontrolphosphatic and potassic fertiliser in 1992 did notsucceed as it was a partial decontrol and resultedin over-dose of controlled nitrogen nutrient (lowpriced) against lower dose of market priced (high)phosphatic and potassic nutrients. The long termadverse effect on the soil made it essential toprovide incentive to the farmers by way of subsidyon P & K again. So it is imperative that suitableinstruments are devised to encourage the desiredapplication ratio of N, P and K into the soil.
7.1.124 R&D effort in the sector remains poor,being less than 0.2 percent of the turnover. Themain consulting organisation of the sector, the publicsector Project & Development India Limited (PDIL),also a PSU is facing difficulty in maintaining profits.It is not able to maintain its R&D activities withoutgrant from the government. The company is alsonot able to earn profit on its activity of catalystproduction, though possibility of its profitabilityexists.
7.1.125 It would not be rational for fertiliser nutrientsto be subjected to taxation by various StateGovernments when Centre is providing subsidy toit. It amounts to transfer of centre's resources toStates through this channel and goes against thevery purpose of keeping the fertiliser pricesminimum to boost its consumption. So efforts shouldbe directed to ensure that the States desist fromtaxing chemical ferilisers.
7.1.126 While the industry has its main interest inincreasing sales of chemical fertilisers andmaximizing profits, nevertheless it holds a certainresponsibility towards educating the farmers onintegrated plant nutrient management system which
is very essential to avoid deterioration of soil healthbeyond recovery. Industry should also work outways to provide farmers with better products thatincrease their use efficiency like slow releasefertilisers. A decontrol of prices would acceleratesuch efforts.
7.1.127 There is need to increase production andmarketing of quality bio-fertilisers to farmers as acost effective way to reduce the requirement ofcostly chemical fertilisers. The Department hasachieved some measure of success through makingpublic sector units to undertake the task. Someincentive may be required to involve private sectorunits in the mission.
Drugs and Pharmaceuticals
7.1.128 The Indian drugs and pharmaceuticalsindustry ranks fourth in world wide accounting for 8per cent of world production by volume and 1.5 percent by value. From Rs. 730 crore in 1990-91, theproduction of bulk drugs touched Rs. 4,533 crorein 2000-01. The production of dosage forms rosefrom Rs. 3,840 crore in 1990-91 to over Rs. 15,000crore in 2000-01. This contribution is from the 250-odd large-scale units and about 8,000 small-scaleunits.
7.1.129 The Indian pharmaceutical industry hasbeen able to achieve global recognition as a lowcost producer. Pharma exports touched Rs. 8,730crore in 2000-01, according to the DirectorateGeneral of Commercial Intelligence and Statistics(DGCIS). India ranks 17th in terms of export valueof bulk actives and doses drugs. It exports drugs tonearly 200 countries including the highly regulatedmarkets of Europe, United States, Japan andAustralia. However, there has been an increase inthe imports of bulk drug indicating a weakness inthis area. The export-import policy and fiscal policycannot protect domestic industry because importcontrols relaxation is inevitable under WTO rules.Losing ground on the bulk drug may also lead toproblem for formulators.
7.1.130 One of the problems of the industry is thehigh rate of obsolescence due to rapid technologicaldevelopments resulting in the invention/discoveryof new organic molecules in the field of synthetic

INDUSTRY
687
drugs. The technological advancement also helpedin identifying the deficiencies/side effects of theearlier drugs. With the quick phasing out of drugsand introduction of product patenting, the industryis on the verge of losing all its advantages. Thechallenge for the industry today is a change in itsattitude towards innovative R&D. However, pastexperience reveals that joint projects/collaborationsbetween the private sector and governmentorganisations/laboratories did not yield encouragingresults, perhaps due to lack of interest from eitherside.
7.1.131 International trade in drugs andpharmaceuticals will require stringent control onquality and external markets may not be satisfiedwith the quality required by the Drugs ControlOrganisation (DCO). There are several standardswhich exporting companies have to comply with likeFood and Drug Administration (United States),Medicinal Control Agency (United Kingdom),Medicinal Control Council (South Africa), TGA(Australia). Indian products will at least have toconform to a minimum of WHO certification on goodmanufacturing practices. There is also a need toreduce the duplication of testing for new drugs asbeing made through Common TechnologicalDocument of the International Committee onHarmonisation (ICH) of technical requirements forRegistration of Pharmaceuticals for Human Use.
7.1.132 India is one of the signatories to the WHOCertification Scheme on the quality of pharmaceuticalproducts and good manufacturing practices (GMP).The provisions about the compliance with GMP arestipulated in Schedule M of the Drugs andPharmaceuticals Rules, 1945. The Central DrugStandards Control Organisation (CDSCO)guarantees various activities through their zonaloffices and monitors drug quality through nearly35,000 samples per year. While these are coveredunder Schedule M of the Rules, domestic companieshave to upgrade manufacturing facilities to matchthe WHO requirements. An order has been issuedthat upgradation should be completed by December2003. While the large and medium scale undertakingshave the resources to do this, nearly 20,000 small-scale formulators may not have the requiredcapability. It may, therefore, be necessary to providethem with soft loans or some grant.
7.1.133 Apart from the point of view of exports,the question of quality is no less important fordomestic consumption. The provisions of the Actsand Rules are implemented jointly by the Centreand the States. However, it has been found thatdrugs which are not permitted in one State getapproved in another State. While steps have beentaken for upgrading Schedule M requirements atpar with international standards, standards varyfrom State to State, putting companies upgradingthe schedule at a disadvantage as far as cost ofmanufacturing of drugs is concerned. This callsfor a centralised recommendation, a task that canbe undertaken by the CDSCO, as a central drugregulatory authority.
7.1.134 It has been found that there is a wide gapbetween regulation and implementation regardingthe quality of drugs. There is a need to strengthenthe State licensing authority through setting up anintelligence cell for campaigning against spuriousdrugs. The establishment of an independentregulatory authority that would deal with majorissues like drug pricing, quality control and licensingof drugs could be explored.
7.1.135 India's excellent expertise in developingnew and innovative processes for knownmolecules needs to be exploited in a greatermeasure. In view of the high obsolescence ofdrugs, priority needs to be given for the initiationof new drug development for diseases ofrelevance to the Indian population. Also, it is hightime that Indian companies venture into the globalmarket, taking the advantage of low cost R&Dand production by introducing globally competitiveproducts based on new molecules, new deliverysystems, etc. Investment in R&D by industry asa whole in India has been low, only around 0.6per cent of the turnover. This is because of thelow levels of profitability and comparatively smallsize of the companies. Investment in R&D by thecompanies, therefore, needs to be encouraged.Certain incentives for conducting R&D activitiesand operation of R&D fund under drugdevelopment promotion would be in order. The1999-2000 budget speech of the Finance Ministerhad an announcement of a corpus of Rs. 150crore for the Pharmaceutical Research andDevelopment Support Fund.

TENTH FIVE YEAR PLAN 2002-07
688
7.1.136 Prices of essential drugs have beencontrolled since a large segment of the populationis poor and health coverage by the State isinadequate. In view of this, regulation of drug pricesneeds to continue for some more years. This hasto be weighed against the long-term perspectivefor the pharmaceutical industry. One alternativewould be to encourage an increase in healthinsurance coverage. Simultaneously, the numberof drugs under price control needs to be reviewedperiodically and some removed from the list.
7.1.137 Public sector pharmaceutical units haveprovided considerable support in the growth of theindustry by putting up modern plants for themanufacture of bulk drugs at a reasonable cost.However, all the units have become sick, partly dueto the government policy of allowing smallformulators to take on a large part of production,late revision of prices, and partly due to theinfrastructure and managerial problems. Some ofthe units were earlier in the private sector and weretaken over by the Government after they becamesick. The revival package in case of Indian Drugsand Pharmaceuticals Ltd. has failed twice and thisindicates that such packages are not based oncorrect assumptions. The drug sector is notconsidered a strategic sector because of amplecompetition. Still, in the absence of any direct pricecontrol, PSUs can serve as an indirect way of pricestabilisation when prices are fully decontrolled.
Sugar
7.1.138 Sugar industry is the second largest agro-based industry in the country. About 45 millionsugarcane farmers, their dependents and a largeagricultural labour force, constituting 7.5 per centof the rural population, are involved in sugarcanecultivation, harvesting and ancillary activities.Besides, about 0.5 million skilled and semi-skilledworkers, mostly from the rural areas, are engagedin the sugar industry. The sugar industry in Indiahas been a focal point for socio-economicdevelopment in the rural areas by mobilising ruralresources, generating employment and higherincome, transport and communication facilities.
7.1.139 India has emerged as the largest sugarproducing country in the world, with a 15 per cent
share of the world's sugar production. However, theshare in international trade of sugar is only 0.05 percent. The sugar production in 2000-2001 was 18.34mmt as against a target of 18.0 mmt. However, thereis likely to be a marginal shortfall of production during2001-02 as against the Plan target. India has brokenthe conventional sugar cycle characterised by twoyears of high production followed by two years oflow production.
7.1.140 The area under sugarcane crop in Indiawas 1.71 million hectares (m. ha) in 1950-51 andhas increased to 4.32 m. ha in the 2000-01 season.Production of sugarcane increased from 57.05 mmtin 1950-51 to 299.20 mmt in 2000-01. The yield ofsugarcane rose from 33,422 kg per hectare in 1950-51 to 69,550 kg in 2000-01.
7.1.141 As on 30 September 2001, there were 506sugar mills in the country, of which 70 were not inoperation. The capacity in terms of annual sugarproduction of all the 506 mills was 16.82 mmt againstthe target of 19.8 mmt for 2001-02 (the installedcapacity of the 70 non-operational sugar mills until30 September 2001 was 1.107 mmt). Seventy sickpublic and private sector mills had been referred tothe BIFR.
7.1.142 The average annual installed capacity ofsugar factory in the country is 2,355 tonnes crushedper day (TCD), as compared to 10,307 TCD inThailand, 9,216 TCD in Australia, 9,168 TCD inBrazil and 6,877 TCD in South Africa. Considering
4.4%
4.8%
5.2%
6.7%
8.2%
8.8%
17.8%
17.4%
21.8%
2.9%
INDUSTRY
689
the need for achieving economies of scale andreduction in the cost of production, there is a needfor consolidation of capacity and vertical expansionof capacity.
7.1.143 Sugar production in India has beengenerally higher than the rate of growth of sugarconsumption. Consequently, there are hugeinventories. The projection for internal consumptionof sugar during the Tenth Plan period (taking thebase internal consumption figure of 15.5 mmt forthe 1999-2000 sugar season) has been calculatedat 21.3 mmt in 2006-07. This assumes a 6.5 percent GDP growth and a compound growth rate of4.9 per cent. The internal consumption has beenprojected at 23.8 mmt in 2006-07, when an 8 percent GDP and compound growth rate of 6.14 percent is assumed. The carry forward of stocks isestimated at 2.65 mmt in 2006-07. The likelyscenario of sugar production is projected as 21.3mmt during 2006-07 and it is estimated that 1.5 mmtof sugar could be exported every year during theTenth Plan period.
7.1.144 Emphasis needs to be placed onimprovement in sugarcane productivity that variesfrom 134 tonne/hectare in the sub-tropical regionto 188 tonne/hectare in the tropical region, ratherthan merely on increasing the area under sugarcanecultivation. The sugar industry should takenecessary steps to strengthen itself by focusing onmodernisation, technology upgradation,improvement of sugar quality, economies of scaleand by-product utilisation. R&D activities need tobe strengthened in the areas of clarification of caneuse, quick estimation of cane quality, production ofedible grade invert sugar syrup, and developingbiogas gasification technology etc. The manpoweremployed varies from one man/day to ten man/dayfor per tonne of sugar produced. Rationalisation ofmanpower should be done to reduce productioncosts. A study also needs to be undertaken to findout the reasons for a large number of sugar factoriesnot going in for modernisation-cum-expansion ofcapacity.
7.1.145 Adequate funds are available in the SugarDevelopment Fund (SDF) to give loans to sugarfactories at concessional rates of interest forundertaking modernisation-cum-expansion of
capacity and for rehabilitation of plant and machineryincluding refining for producing refined sugar for theinternational market. In spite of this, a large numberof sugar factories are operating at sub-optimal andunviable capacities. The main reasons of sicknessin the sugar industry appear to be the practice ofState Advised Prices (SAPs) for sugarcane, lowrealisation from the sale of molasses, fluctuationsin sugar production, non-availability of adequatecane and the uneconomic size of the mills and theiroutdated machinery and mismanagement.Adequate relief and concessions would be requiredfrom State Governments, banks and financialinstitutions for the revival of potentially viable sickmills. Assuming that the average cost of upgradationand optimisation is about Rs. 20 crore to Rs. 25crore, the total estimated investment will beapproximately Rs. 1,300 crore, of which Rs. 650crore could be from the SDF.
7.1.146 To improve the overall viability of the sugarindustry, suitable value addition to its by-productswill be necessary. Out of the three main by-productsof the sugar industry, the utilisation of bagasse andmolasses need immediate attention in terms ofvalue-addition. Bagasse-based cogenerationrequire relatively low capital investment, shortergestation period, and relatively lower cost ofgeneration as compared to conventional powerprojects. Some State Governments have alreadyframed policies to encourage bagasse-based powergeneration.
7.1.147 Molasses is obtained in the process ofsugar manufacture involving repeated crystallisationand centrifugation. Between 4.2 per cent and 4.5per cent molasses is produced from cane and it ispresently being used for the manufacture of alcoholand a host of alcohol-based downstream chemicals.Anhydrous alcohol/ethanol, being an environmentfriendly auto fuel, can be blended with gasoline andused as an auto fuel.
7.1.148 The utilisation of molasses for theproduction of ethanol would not only give value-addition to the by-product of the sugar industry, butit may also ensure better price stability and pricerealisation of molasses for sugar mills. This willimprove the viability of the sugar mills, which, inturn, will benefit the sugarcane grower, and

TENTH FIVE YEAR PLAN 2002-07
690
the economy, particularly the rural economy.However, considering the environmental-friendlycharacteristics of ethanol-blended gasoline as anauto fuel, the pricing of ethanol needs to be viewednot only in terms of financial cost-benefit analysisbut also of economic cost-benefit analysis.
Leather and Leather Goods
7.1.149 India ranks first among major livestockholding countries, with 19 per cent of bovine, 20per cent of goat and 4 per cent of sheep/lambpopulation and accounts for about 10 per cent ofglobal supplies of raw skins and hides. The annualavailability of 230 million pieces of hides and skinsis the main strength of India's leather industry, alarge part of which is in the unorganised sector.About 60-65 per cent of total production of leatherand leather products and substantial portion ofexports is accounted for by artisans, micro-enterprises and small-scale industries. The sectoris highly export-sensitive and faces threats fromecological ban criteria in the main markets.
7.1.150 The leather industry has been identified asone of the thrust areas for exports and the exportperformance of the leather sector has improvedconsiderably. Exports by the leather sectorincreased from Rs. 3,036 crore in 1991-92 to Rs.6,968 crore in 1999-2000 and further to Rs. 9,004crore in 2000-01.
7.1.151 An analysis of the trends of exportrealisation between 1984 and 2001 indicatesannual growth rates of 6.5 per cent for finishedleather, 5.9 per cent for footwear upper
components, 11.6 per cent for closed footwear,15 per cent for leather garments and 19 per centfor leather goods. Growth rates in the case offinished leather and footwear and componentsare not significantly high.
7.1.152 The export of the leather goods sectorregistered an increase of over 25 per cent perannum during the 1997-2000 period. Global sharein leather goods has registered a general increaseto 7.7 per cent. India is one of the top three playersin global trade in leather goods.
7.1.153 Eleven items in the leather sector havebeen de-reserved. These include semi-finishedleather, leather shoes and shoe components. Noindustrial licence will be required for setting up unitsto manufacture these items. For leather handicraftsand garments, the entitlement for duty free importof trimmings, embellishments and other items hasbeen increased from 2 to 3 per cent of FOB valueof exports.
7.1.154 Some of the major initiatives during theNinth Plan period were: changes in SSIinvestment limits, delicensing of integrated leatherprocessing units without export obligations, exportobligations being reduced from 75 per cent to 50per cent for the reserved sector, export of rawhides/skins, wet blue, crust and otherintermediates at 60 per cent duty, and, removalof QRs in the leather sector. The promotionalmeasures and schemes were: National LeatherDevelopment Programme (NLDP) LeatherTechnology Mission deliveries, TanneryModernisation Scheme, Indian LeatherDevelopment Programme, Market DevelopmentAssistance Scheme and establishing eco-testinglabs etc.
7.1.155 A Plan scheme the Indian LeatherDevelopment Programme (ILDP) was launchedduring the Ninth Plan for integrated developmentof the Indian leather industry at a total outlay of Rs.14.50 crore. This scheme provided the much-needed financial assistance to the tanneries for theirtechnological upgradation and better capacityutilisation and to undertake adequate pollutioncontrol measures. After the successful completionof Phase I of the United Nations Development
Export of Leather Goods in 2001-02($ Million )
• Finished Leather 457.37• Leather Footwear 394.19• Footwear Components 233.34
• Leather Garments 378.62• Leather Goods 406.52• Saddlery and Harness 35.50• Non-Leather Footwear 26.09
• Total 1,931.63

INDUSTRY
691
Programme (UNDP)-assisted NLDP, Phase II of theprogramme SIDE-NLDP has been initiated withfocus on poverty alleviation and sustained livelihoodand building linkages between the organised andunorganised sectors. Under this scheme,Decentralised Common Facility Centres (DCFC)and Design Studios for Leather Goods andFootwear have been set up in Kanpur, Delhi,Kolkata, Hyderabad and Bhopal.
7.1.156 Many segments of the Indian leatherindustry have remained reserved for the SSI sector.There is need to review policies limiting theinvestments in a sector relating to a globally tradedcommodity like leather. The leather footwear andproduct sector offers vast potential for employment,social empowerment and gender equity. Anemployment-driven policy framework for largeadditional investments could be a possible policydirection. Labour policies need to be changed. Anenabling trade and commerce policy to permitwarehousing and reshipment support for attractingraw hides and skins into India and an environmentpolicy for near-zero environmental risk would benecessary.
7.1.157 Strengthening, augmentation,modernisation and expansion through investmentgrants and credits as well as credit-backedinvestment support for SSI units would be required.Majority of the units under the SSI sector in the Indianleather industry need access to technologies, designsupport and skill upgradation of manpower base.Footwear, non-leather component, non-leatherfootwear, leather garment and leather goods sectorneed appropriate schemes for both modernisationand expansion. There is a need to expand thecapacity of the footwear industry in the organisedsector if India has to capture 14 per cent share ofglobal trade. This means that the footwearcomponent sector needs to be expanded by at leastten times and it calls for a planned expansion of thesector. SSI units are not often able to accesstechnology advancements. The SSI sector of theIndian leather industry would need at least aninvestment of Rs. 500 crore for modernisationduring the Tenth Plan period.
7.1.158 A special drive and mechanism would beneeded to attract FDI and encourage joint ventures.
Such investments would be ideal for the tanning,footwear components, non-leather materials andfootwear.
7.1.159 The Tenth Plan has identified 11 toppriorities for the sector. These are:
i) Employment-oriented policy promotion.
ii) Readjustments to the de-reservation process.
iii) Readjustments to the removal of QRs.
iv) Promotional measures for compliance to WTOregimes.
v) Modernisation of all sub segments.
vi) A human resource development mission.
vii) An environmental mission.
viii) R&D back up and support.
ix) FDI and large private investments.
x) Readjustments to the WTO framework, and
xi) Strategies for aggressive marketing.
Investments required for achieving these plans havebeen estimated at Rs 16,000 crore of which Rs.9,000 crore may need to be invested during theTenth Plan period.
Textiles and Jute
7.1.160 The textile industry is one of the largestand the most important sectors in the economy interms of output, employment generation and foreignexchange earnings. The Indian textile industrycontributes about 14 per cent to the nationalindustrial production and about 35 per cent to thetotal national export earnings. The spinning sectorhas performed well but the weaving and processingsector has not performed satisfactorily because oflack of modernisation. This has affected the exportof processed fabrics and other value-added itemssuch as made-ups and garments.
7.1.161 Cloth production increased from 31,958million sq. metres in 1995-96 to 40,256 million sq.metres in 2000-01 at an annual average growth rateof 4.72 per cent as against the target of 44,000million sq. metres in the terminal year of the NinthPlan. There is likely to be a shortfall in cloth

TENTH FIVE YEAR PLAN 2002-07
692
production vis-à-vis the Ninth Plan target. The shareof cloth production of the mill sector has decreasedfrom 6 per cent to 4 per cent over the same periodthe share of powerloom production has increasedfrom 54 per cent to 59 per cent. The spinning spindlecapacity has increased from 31.75 million in 1995-96 to 37.91 million in 2000-01. The production ofspun yarn has increased from 2,485 million kgduring 1995-96 to 3,160 million kg in 2000-01 at anaverage annual growth rate of 4.92 per cent. Theproduction of man-made filament yarn hasincreased from 493 million kg in 1995-96 to 920million kg in 2000-01. The decentralised hosierysector has shown a significantly higher annualgrowth rate of 6 per cent during the last five years.The textile exports including jute, coir andhandicrafts increased from $ 8.53 billion during1995-96 to $ 12.10 billion during 2000-01 as againstthe target of $ 20.17 billion in the terminal year ofthe Ninth Plan.
7.1.162 The production of textile machinerymanufacturing industries, which comprise 600units employing 30,000 workers, decreased fromRs. 1,500 crore to Rs.1,309 crore from 1995-96to 2000-01 against the target of Rs. 5,400 crorein the terminal year of the Ninth Plan. Themachinery manufacturing industries are exporting15 per cent of the annual production to over 50countries.
7.1.163 At present, the National TextileCorporation (NTC) has 119 mills controlled bynine subsidiary corporations of the holdingcompany. Eight out of the nine have been referredto the BIFR. NTC has identified 53 viable millsand 66 unviable mills. The Government proposesto modernise the viable mills and close/privatisethe unviable mills. The Draft RehabilitationScheme (DRS) proposing revival of 44 viable andclosure of 60 unviable mills was approved by theGroup of Ministers on an Action Plan for NTC.British India Corporation (BIC) has two woollenmills and two cotton subsidiary companies with3,799 employees. It has been making continuouslosses due to obsolete machinery, excessmanpower, shortage of working capital, etc.Winding up of the two cotton subsidiaries of BIChas been ordered. The Government has offeredVRS to all the employees in these mills. The
rehabilitation plan for BIC woollen mills is underconsideration of BIFR.
7.1.164 R&D activities in the textile sector has beencarried out by eight Textile Research Associations(TRAs), Central Sericulture Training and ResearchInstitute (CSTRI) of the Central Silk Board andtesting laboratories under Textile Committee. TheTRAs provide consultancy services to the textileindustry including their member mills, HRD trainingprogrammes, testing and certification activities inthe area of process control, energy conservation,balancing equipments for process optimisation,productivity improvement and reduction in wastageor rejection, etc. on need basis. Out of the 74 publiclyfunded testing laboratories, 17 are under the TextileCommittee and the rest are under TRAs andpowerloom service centres and a few otherinstitutions. The establishment of ISO 9000 QualityManagement System was formulated to encouragethe small and medium enterprises. Implementationof ISO 14000 Environmental Management Systemin the textile industry, especially in the processingunits, is a social responsibility proposed to beintroduced during Tenth Plan.
7.1.165 The Technology Upgradation FundScheme (TUFS) was introduced to modernise thetextile sector, which is critical for facing competitionfrom other textile producing countries like China,Taiwan, South Korea, Japan, etc. All the textile sub-sectors such as spinning, weaving, knitting,processing, garment making, cotton ginning andpressing and jute sector are covered under thescheme. Since inception of the scheme in April 1999till 31 January 2002, a total of 1,465 applicationswith investment proposals of Rs.13,747 crore havebeen filed for loans amounting to Rs. 7,910 crore.Out of this, Rs. 5,057 crore has been sanctioned to1,232 proposals and Rs. 3,282 crore has beendisbursed to 968 applicants.
7.1.166 The Technology Mission on Cotton (TMC)Scheme strives to improve cotton productivity andquality. In order to reduce contamination of cotton,modern infrastructure is provided in the marketyards and the programme on modernisation ofginning and pressing units has been taken up eitherby capital subsidy under TMC Scheme or a 5 percent interest subsidy under the TUFS. It is proposed

INDUSTRY
693
to modernise/develop about 200 market yards underthe Mini Mission-III and 350 ginning and pressingfactories under the Mini Mission-IV in the Tenth Plan.Fifty-one market yards and 150 cotton ginning andpressing factories were modernised during the NinthPlan.
7.1.167 The production of raw jute and mestaduring the terminal year of the Ninth Plan hasbeen estimated at 95-100 lakh bales of 180 kgeach as against the target of 108 lakh bales. Theproduction target of jute and mesta is placed at110 lakh bales for the terminal year of the TenthPlan, while the proposed target for jute goods is19.50 lakh mt against 14.35 lakh mt achievedduring 2000-01.
7.1.168 The UNDP-assisted National JuteDevelopment Programme concluded on 31 March1999. The second phase of the UNDP programmeunder the Country Cooperation Framework-I (CCF-I) known as the Fibres and Handicrafts Programme(FHAP) envisaging a total contribution of $ 7 millionby UNDP and Rs. 20 crore by the Government ofIndia has since been launched. The FHAP has fivesub programmes, one each in the areas of carpet,cane and bamboo, non-mulberry silks, wool andjute. The activities to be taken up under these subprogrammes focus on creating a demand pull andon increasing value addition by emphasising productdevelopment, product diversification, marketing andintroduction of new technologies. These includepromotion of fibre cultivation, support to non-government organisations (NGOs), implementationof strategic marketing plans, human resourcedevelopment, commercialisation of R&D efforts,indigenisation of machine manufacture, qualityassurance and biotechnology interventions, etc.
7.1.169 As the textile industry has a very largepotential for increasing employment opportunitiesin the country, the present labour laws need to bereviewed in the context of re-training and re-deployment of workers. Export led growth in textilesin a global market scenario is possible only withlarge investments in the key areas of industry,particularly in weaving, knitting, processing andapparel. The technology in these critical sub-sectorsof the textile industry needs immediate upgradationto international levels.
7.1.170 To enable the textiles and apparel industryto build world class manufacturing capacities toattain and sustain a pre-eminent global position andto withstand competition, a holistic, need-based andbalanced approach is proposed to be adopted whileformulating schemes and programmes for differentsegments of the industry. This approach will beparticularly important for the segments, which didnot get adequate attention in the past but are criticalto the growth of the textile industry. This wouldinvolve creation of a fair and competitiveenvironment and a rational fiscal policy regime toenable the industry to successfully compete on costand quality parameters in the international market.
7.1.171 The production targets envisaged in theterminal year of the Tenth Plan are 45,500 millionsq. meters of cloth, 4,150 million kg of spun yarnand 1,450 million kg of man-made filament yarn.The per capita availability of cloth would be 28.00sq. metres by 2006-07 as compared to 23.19 sq.metres in 2000-01 showing a growth of 3.19 percent. The export target for textiles and apparel isplaced at $ 32 billion by 2006-07 and $ 50 billion by2010. The employment in the textile industry isexpected to increase from 34.42 million persons to40.15 million persons by the terminal year of theTenth Plan. The employment in the allied industryis also expected to increase from 47.53 millionpersons to 50.75 million persons during the sameperiod.
Cement
7.1.172 The cement industry in India is, by andlarge, self-sufficient both in raw material availabilityand process technology as well as indigenoussources of plant and machinery. It is comparable tothe best in the world in respect of quality standards,fuel and power consumption and environmentalnorms. It has a high capacity utilisation andcontributes to 6 per cent of the world production.The industry employs 1,35,000 people, whilecreating a substantially higher proportion of indirectemployment through machinery manufacture,materials and services. The cement industry hasrecorded a CAGR of 8.4 per cent over the last twodecades and contributes 5 per cent of the CentralGovernment's excise revenues. Total decontrol andthe subsequent general liberalisation regime saw

TENTH FIVE YEAR PLAN 2002-07
694
the capacity of the industry rise to the current levelof 140 mmt. The industry comprises 120 large plantswith an installed capacity of 129.43 mmt and about365 mini plants (rotary and vertical shaft kiln or VSK)with an installed capacity of 11.10 mmt. Earlier, thepublic sector used to consume over 50 per cent ofthe total cement sold in India, but in the last decade,its share has come down to 35 per cent. Rural areasconsume less than 23 per cent of the total cementproduced.
7.1.173 The weighted average thermal energyconsumption in dry process plants in India hasreduced from 780 Kcal/kg clinker in 1995-96 to 750Kcal/kg clinker in 2000-01. Similarly, the weightedaverage electrical energy consumption in dryprocess plants showed a reduction from 104 to 91kWh/t cement during the same period. It is expectedthat the average thermal and electrical energyconsumption will further come down by 2006-07 dueto improvement in energy efficiency in the existingplants and new capacity addition with energyefficient technologies.
7.1.174 The Task Force for the Ninth Plan hadprojected a capacity of 135 mmt for the terminalyear of the Plan (2001-02). The industry hasreached a capacity of 140.53 mmt. Cementproduction also grew consistently during the Planperiod at CAGR of 6.25 per cent. Capacity utilisationfor large plants has been around 80 per cent andwith the privatisation of more public sector units,the capacity utilisation is likely to go up further. Theconsumption is estimated to touch 100 mmt by theend of the Ninth Plan with a growth of 6.03 per cent.The per capita consumption is lower than the worldaverage and offers scope for development andgrowth. Cement demand is expected to grow at 10per cent per annum.
7.1.175 The Indian cement industry has thepotential to double its exports of cement and clinkerand thus be a major player in the South-East Asianmarket. In fact, cement has been identified by theGovernment as an extreme focus item. Though theNinth Plan had set a target of 8 mmt of exports,exports are expected to be of the order of 5.15 mmtby the end of Plan period.
Overview• A one million tonne production employs 20,000
persons• The sector contributes 5 per cent Central
Excise• The sector has a 1.6 per cent weight in IIP• One per cent increase in GDP leads to a 1.2
per cent increase in cement production
Reasons for low exports• High input costs, domestic taxes, high energy
charges, poor export infrastructure• Tax as percentage of production cost is 60
per cent in India, 17 per cent in China, 0 percent in Malaysia
• Hike in limestone royalty
7.1.176 The critical requirements for the cementindustry are coal, power and infrastructure. Of atotal consumption of 15.73 mmt of coal in 2000-01,4.40 mmt was imported. Coal will continue to bethe dominant fuel for cement industry. However,petroleum coke, lignite and waste derived fuels willalso have a marginal presence. In fact, increaseduse of pet coke and lignite is likely in the future.Currently, over 40 per cent of cement production isfrom captive power plants using diesel, furnace oiland coal. The grid power supply system needsurgent overhaul for increased efficiency. Till gridpower is available in adequate quantity/quality andat proper price, generation of captive power and itstrading needs to be permitted without anyrestrictions.
7.1.177 In view of the location-specificcharacteristics of cement plants involving movementover long distances of raw materials and finishedproducts, railway is the ideal mode of transportation.However, only 38 per cent movement through railcould be achieved. Inland water transport is anenergy efficient and cheap mode of transport,particularly for those plants located near the coastalregions.
7.1.178 Ninety per cent of cement production inthe developed world is moved in the bulk form. Inthe case of India, this is less than 2 per cent. It isnecessary to provide an impetus to bulk cement

INDUSTRY
695
through incentives so that demand is created in themarket. There is also need for setting up bulkterminals. The growth of bulk cement is dependentupon the development and growth of Ready MixConcrete (RMC). The RMC industry's growth couldnot be maintained at the desired pace and has evenstarted to decline. Many RMC units have closeddown.
7.1.179 The mini cement plants set up in thecountry are based either on rotary kiln technologyor on VSK technology. Many small VSK plants havealso come up mainly in the SSI sector. Presently,only about 132 mini cement plants out of a total of365 units, with a capacity of about 11 mmt, arereported to be in operation, producing about 4 mmtof cement. Limitations of capacity fixed for minicement plants at the conceptual stage and financialassistance limits specially the term loans for projectsexecution, rising cost of fuel and its non-availabilityin case of VSK cement plants and absence ofrailway linkage, are issues of major concern. Highash content and poor quality of coal, poor quality ofelectrical power, lower realisation due to consumerpreference for branded cement, shortage of termloans for modernisation and expansion etc. aresome of the main impediments resulting in the poorperformance and growth of this sector.
7.1.180 The cement demand, based on a scenarioof 6.5 per cent GDP growth during the Plan, worksout to 142.6 mmt (including 6 mmt of exports) whichrequires a production capacity of 168 mmt. DuringTenth Plan , it is assumed that the demand may goup to 160.56 mmt at the targeted GDP growth of 8per cent for the economy. This requires a productioncapacity of 202.64 mmt at the present trend ofcapacity utilisation.
7.1.181 The additional capacity during the TenthPlan would be of the order of 62 mmt including 5mmt from mini cement plants. Around 10 mmtcapacity may come from greenfield cement plantsat a capital investment of Rs. 3,500 crore. Around35 mmt may come through modernisation andexpansion at a capital investment of Rs. 7,000crore. Another, 17 mmt capacity is likely to becreated due to technology upgradation/debottlenecking/ addition of fly ash and slag. In
order to cope with the total enhanced capacity of62 mmt, power infrastructure of 1,125 megawatt(Mw) will have to be created by Indian cementindustry. The capital investment for new captivepower generation will be of the order of Rs. 4,600crore. The capital investment for setting up coalwasheries of 3 mmt capacity would be aroundRs. 300 crore. The additional 5 mmt cementcapacity from mini cement plants would requirean investment of Rs. 1,000 crore. Further, theinvestment for developing supportinginfrastructure in the railways would be around Rs.1,200 crore. Thus, the total investment to bemade by the Indian cement industry during theTenth Plan is likely to be Rs. 17,600 crore.
Paper and Newsprint
7.1.182 The Indian paper industry has a totalturnover of more than Rs 10,000 crore and providesdirect employment to 200,000 people and indirectlyto another 100,000 persons. Industry contributesRs. 700 crore annually to the exchequer by way ofexcise duty.
7.1.183 Despite low per capita (4 kg) consumptionof paper and paper boards, the industry has madea steady progress in the last five decades. At presentthere are 515 registered pulp and paper mills withthe total installed capacity of about 5.1 mmt andproduction of about 3.2 mmt. The country isapproaching self-sufficiency in the manufacture ofmost varieties of paper and paperboards. Plantswith around one mt of capacity are closed primarilybecause of managerial, production, technicalmarketing and financial problems. The industrycontinues to operate with obsolete technology andthe required modernisation has not taken placeprimarily because of resource constraints. Further,clandestine imports and dumping of paper andpaper products from other countries has affectedthe health of the paper industry.
7.1.184 At present, about 60.8 per cent of the totalproduction is based on non-wood raw material and39.2 per cent on wood. The capacity utilisation ofthe industry is low at 60 per cent as about 194 papermills particularly small mills are sick/or lying closed.The total production of paper during 2001-02 isexpected to be 3.2 mmt.

TENTH FIVE YEAR PLAN 2002-07
696
7.1.185 The performance of the industry hassuffered due to inadequate availability and high costof inputs and power. Several policy measures wereinitiated in recent years to remove bottlenecks inthe availability of raw materials and for infrastructuredevelopment. Duty on pulp and waste paper, woodlogs/chips was reduced. Several fiscal incentiveshave also been provided, particularly to those millswhich are using non-conventional raw materials.
7.1.186 Import of paper and paper products havebeen growing over the years. The imports during2000-01 were to the tune of 0.152 mmt and areestimated to be 0.165 mmt in 2001-02. About 0.14mmt of paper was exported in 2000-01, mainly tothe neighbouring countries.
7.1.187 There are, at present, 64 newsprint mills(four in the Central public sector, two in the Statepublic sector and 58 in the private sector) with anannual installed capacity of about 1.204 mmt. Thecapacity utilisation of the newsprint industry is lowat 55 per cent. The total newsprint produced during2001-02 is estimated at 0.65 mmt as against aproduction of 0.63 mmt in 1999-2000.
7.1.188 The domestic demand for newsprint is metpartly from indigenous production and partly byimport. Free imports and low customs duty havemade the newsprint market competitive. There areno price or quantitative controls. Various policymeasures have been taken to improve productionand availability of newsprint. The industry has beendelicensed. Excise duty on newsprint has beenremoved.
7.1.189 The public sector Hindustan PaperCorporation Ltd. (HPC), has two papermanufacturing units - Nagaon Paper Mills (NPM)and Cachar Paper Mills (CPM) in Assam. It alsohas three subsidiaries, -- Hindustan Newsprint Ltd.(HNL) in Kerala, Nagaland Pulp and PaperCompany Ltd. (NPPC) in Nagaland and MandyaNational Paper Mills Ltd. (MNPM) in Karnataka.
7.1.190 Of the three subsidiaries, HNL is a profitmaking concern. There have been efforts to revivethe poor performing NPPC through financialrestructuring. The company was referred to BIFRand declared sick in August 1998. BIFR directed
the operating agency (i.e. Industrial DevelopmentBank of India) to explore the possibilities of changingthe management by way of joint venture/amalgamation/merger/sale, etc. A final decision isyet to be taken. MNPM has been closed with effectfrom 20 October 2000. The total liability of HPC(including those of MNPM and NPPC) as on 31March 2000 to the Government of India in terms ofloan and interest works out to Rs. 926.11 crore.
7.1.191 The performance of NEPA Ltd. has not beensatisfactory. Cabinet had, in principle, approvedprivate sector participation in the company andapproved financial restructuring before inviting bidsfor strategic sale. Financial restructuring of thecompany was done in March 2000. Theaccumulated losses of the company have risen toRs. 124.30 crore, while the paid up capital as on 31March 2000 is Rs. 105.39 crore. The company isstill before the BIFR because of further cash losses.
7.1.192 In spite of periodic recession, the Indianpaper industry is expected to continue to grow inthe next 10 years, and capacity expansion will haveto take place in existing mills and also in greenfieldprojects. The Indian paper industry would need togrow at the rate of 5 per cent per annum in the nextdecade and installed capacity is expected to bearound 7.5 mt by 2010.
7.1.193 Raw materials availability on a sustainedbasis will be a major constraint and both theGovernment and industry will have to evolve a long-term strategy regarding this. The elements of thestrategy would include: wasteland utilisation, R&Defforts on effective utilisation of indigenouslyrecovered waste paper, increased use of non-woodfibres and use of non-chlorine bleachingtechnologies.
7.1.194 In the next five to six years, stringentenvironmental regulations will virtually force theIndian paper industry to develop techniques forconservation of resources and reduction ofpollutants and also new treatment systems for end-of-the-pipe treatment and management of effluentproblems. Discharge of persistent organic pollutantssuch as organic halides and their control andmanagement will be one of the major challengesbefore the Indian paper industry.

INDUSTRY
697
Pesticides
7.1.195 Pesticides, a product of the chemicalindustry, finds an important role both in agricultureand public health service. In agriculture, it is requiredto prevent crop losses and for public health, it isused to control pathogens responsible forepidemics.
7.1.196 The per capita consumption of pesticidesin India is low in comparison to other countries. It isonly 0.45 kg per ha as compared to 13.35 kg perha in Italy, 9.18 kg per ha in Japan, 6.56 kg per hain South Korea and 0.58 kg per ha in the UnitedStates. However, India ranks 12th in agro-pesticidesglobally and second in Asia alone. The industry wasgrowing steadily till reports of the adverse effect ofa few pesticides resulted in an increased thrust onbio-pesticides. Still the demand of various types ofpesticides in the country is of the order of 43,380mt (technical grade).
7.1.197 The large domestic demand and marketprotection led to the setting up of plants in thecountry to reduce import dependence and spurredgrowth of the industry. The economic liberalisationinitiated in 1991 helped accelerate the growth ofthe sector. The three main economic measureswhich aided the industry are: removal of compulsorylicensing, removal of the mandate requiringreservation of 50 per cent of technical gradeproduced for use in formulation by the small-sectorand progressive reduction in import tariffs from 165per cent to a uniform duty of 35 per cent in 2000-01. It is now able to meet 95 per cent of the country'sdemand. With a capacity of over 128,900 mt, it isnow the largest manufacturer among South Asianand African countries with a turnover of Rs 3,200crore. It also caters to export market to a smallextent.
7.1.198 Insecticides account for 76 percent of thetotal domestic market. The main reasons forsignificantly lower usage of herbicides andfungicides in India are manual weeding and thefact that the tropical climate is more conducivefor the growth of insects as compared to herbs/fungi. However, growth in these two categoriesis at a much faster rate than in the insecticidescategory. The agro-climatic factor mostly
regulates the performance of the industry. Theleading crop, cotton, accounts for around 45percent of the domestic agrochemical market.
7.1.199 The industry is divided into 67 large units(ten of them multinational companies) in theorganised sector which takes care of all therequirement of the technical grade and over 400SSI units, which are engaged exclusively informulations. The only PSU in the sector isHindustan Insectside Limited (HIL), with threeunits. The financial health of the company is notbright and it started incurring losses since 1997-98 and performance has been deteriorating sincethen.
7.1.200 The critical success factor for the Indianagrochemical industry is low cost of production.The pesticide sector like drug is set for majorchange. Many pesticides would be banned orwould be replaced by better and cheaperalternatives. But to remain in the position largeinvestment in Research & Development isneeded. Institute of Pesticide Formulationtechnology (IPFT), set up by the GOI with theassistance of UNDP/UNIDO in May, 1991, isactively engaged in the areas of development ofnew, safer and environment-friendly pesticidesand formulations. It would be desirable that theInstitute gains confidence of the industry bydeveloping commercially viable new generationpesticide/ formulations and process technology.
7.1.201 The problems being experienced by thepesticide industry are sale of spurious pesticides,registration for export of pesticides and inadequatetesting facilities at the Regional/State TestingLaboratories. The State Directorates of Agriculturehave the administrative machinery to check thequality of pesticides at the manufacturing stage asalso pesticides stored at the premises of stockists.However, despite such checks, spurious pesticidesare reportedly sold in the market. In a number ofcases of testing of pesticide samples, the results ofthe Regional/State Testing Laboratories are atvariance with those of the Central InsecticidesLaboratory. This could be due to either non-availability of high-tech instruments or untrained/inexperienced staff. This issue needs to beaddressed.

TENTH FIVE YEAR PLAN 2002-07
698
7.1.202 The production and import of pesticidesrequires compulsory registration under theInsecticides Act 1968. The registration requiressubmission of authentic data on chemistry, bio-efficacy and residues, toxicity and packaging andlabeling with details on pesticide presence in water,soil, crop and the environment. The Act has beenamended providing for stringent punishment tooffenders and also removing certain difficultiesassociated with its administration andimplementation.
7.1.203 The enforcement of various provisions ofthe Act mainly rests with the State Governmentsand this requires licensing officers, appellateauthority, insecticide inspectors and insecticideanalysis (45 pesticides testing laboratories havebeen installed). A lot is desired in the implementationof various provisions of the Act. To curb marketingof spurious and duplicate pesticidal products, Stateshave been advised to constitute inter-statecommittees and conduct periodic checks.
7.1.204 In the next decade, manufacturingstandards are likely to be implemented morerigorously thereby ensuring that only plants withrecognised good manufacturing practices wouldexist. There is a need to train extension workersand staff in the proper application of pesticides.
7.1.205 In view of the ecological considerations andglobal concern about harmful impact of pesticideson the environment, the Government adoptedIntegrated Pest Management (IPM) as the cardinalprinciple and the main plank of plant protectionstrategy in the overall crop production programmes.The Government is a signatory to Agenda 21 ofUnited Nations Conference on Environment andDevelopment (UNCED), 1992 which has approvedand accepted IPM to reduce the use of pesticidesin agriculture. The Government has taken a numberof positive measures for the promotion of IPMamong the extension functionaries and farmers.Biological control is an important component of theIPM programme. However a more definite actionplan is to be drawn and implemented to achievethe goal.
7.1.206 Realising the importance of neem as asource of pesticides, the Government is promotingan UNDP-assisted project by way of technical
support for development and cleaner production ofneem products as environment-friendly pesticides.Neem-coated urea serves both as a slow releaseproduct as well as a pesticide. Due attention isrequired in promoting the product through PSUs infertiliser sector. Besides neem several other plants/herbs are traditionally being used as source ofpesticide. The practical viability of these sourcesneeds to be explored in view of the growing demandfor the eco-friendly biopesticides.
Chemicals
7.1.207 The chemical Industry is perhaps the mostdiversified of all industrial sectors, covering morethan 70,000 commercial products. The Indianchemical industry ranks 12th by volume in the worldproduction of chemicals. The export of chemicalsin 2000 was $ 2.8 billion, which accounts for almost14 per cent of the exports from the manufacturingsector and about 11.15 per cent of the country'stotal exports. Its contribution to the national revenueby way of custom and excise duties is about 20 percent. More than 60 per cent of the production of thesector comes from SMEs.
7.1.208 The industry faces many challenges in theliberalised environment. Drastic reduction inimport duties from more than 150 per cent to thepresent level of 30 per cent has made the marketextremely competitive. Setting up of massivecapacities by multinational companies inSingapore, Malaysia, South Korea, Taiwan andJapan have only made the competition more cutthroat. Added to that is the demand to improvequality and develop marketing strategies and skills.Adverse economies of scale of domesticcompanies vis-à-vis the multinational companiesfurther add to the disadvantages.
7.1.209 The units in the SME category, suffers fromhigher cost of production as the scale of operationis very small. Lack of coordinated research anddevelopment in these industries led to inconsistentproduct quality. In addition there are problems ofadequate finance. The Indian plants are notinternationally competitive due to lack ofmodernization and sub-optimal scale of operation.
7.1.210 As the Indian economy was a highlyprotected one, no large-scale R&D was undertaken.The industry would, therefore, have to invest huge

INDUSTRY
699
amounts of money in R&D to catch up with theinternational chemical industry. Fortunately, Indiahas developed scientific institutes and hence thereis no dearth of trained scientific human resources.The industry should equip itself to exploit the newlyemerging speciality chemicals that will graduallyreplace the existing chemicals that are hazardousand inefficient. In coming years these chemicals willfind an application in most of the daily use productsand compositions. At present, most of the specialitychemicals are being patented by developedcountries.
7.1.211 With the growing concern relating toenvironment, global players are closing operations.This has given developing countries like India theopportunity to emerge as prominent players in theglobal chemical market.
7.1.212 Availability of basic inputs (raw material),fuels and power at internationally competitive prices,implementation of VAT, bringing down the cost offunds for capital investment/working capital to theinternational levels, implementation of labour reformsand substantial development in infrastructureparticularly roads, ports and power supply are someof the measures which would go a long way inmaking the Indian chemical industry globallycompetitive.
7.1.213 The realisation of income from operationsin the case of the public sector Hindustan OrganicChemicals Limited (HOCL) was affected byrecession in the world market. Disinvestment ofHOCL is at an advanced stage.
7.1.214 The Chemical Weapons Convention(CWC) is a universal non-discriminatory multilateraldisarmament treaty which bans the development,production, acquisition, transfer, use and stockpileof all chemical weapons. India signed theConvention on 14 January 1993. The convention isbeing implemented by the Organisation for theProhibition of Chemical Weapons (OPCW)established in The Hague. The Institute for PesticideFormulation Technology (IPFT), under theDepartment of Chemicals and Petrochemicals, hasbeen participating in the proficiency tests conductedby the OPCW worldwide to assess the capabilitiesof laboratories. Laboratories are accredited if they
succeed in these tests. To be able to discharge theobligations under the Convention, each country isrequired to have a domestic legislation, which makesthe filing of correct information about variousactivities in schedule chemicals mandatory. TheCWC Act has been notified on 28 August 2000.
7.1.215 The dyestuff sector is one of the mostimportant segments of the chemical industry inIndia, having forward and backward linkages witha variety of industries like textiles, leather, paper,printing ink and food technology. The Indian dyestuffindustry has both small and big players. Fiscalconcessions granted to the small-scale sector inthe mid-eighties led to establishment of largenumber of units in the SSI sector. Today, nearly 95per cent of the total 1,000 chemical units arelocated in the unorganised sector. However,organised players constitute about 65 per cent oftotal dyestuff production in the country. Currently,the industry is in the midst of major restructuringand consolidation. With the shift in emphasis onproduct innovation, brand building andenvironmental friendliness this industry isincreasingly moving towards greater customerorientation. Even though India enjoys an abundantsupply of basic raw materials, it will have to buildup on technical services and marketing capabilitiesto face global competition and increase its shareof exports, though the dyes and dye intermediatesector already enjoys a positive trade balance withexports far in excess of imports.
Petrochemicals
7.1.216 The country has made rapid strides interms of production and consumption ofpetrochemicals. To remain competitive, in the wakeof lowering of tariff barriers, the industry is adoptingstate-of-the-art technologies and is producingquality petrochemical products of internationalstandards. This sector's yearly output isapproximately Rs 1,20,000 crore, which is 15 percent of the manufacturing sector's output. Its exportof about Rs 16,000 crore is 16 per cent of themanufactured products' exports and it contributesabout 20 per cent of the national revenue.
7.1.217 The domestic petrochemical industry hasbeen growing at the rate of 14-15 per cent perannum which is almost in line with the anticipatedgrowth rate of the Ninth Plan. Creation of additional

TENTH FIVE YEAR PLAN 2002-07
700
capacities to the tune of 3.61 mmt in respect ofmajor petrochemical has reduced importdependency of petrochemicals considerably.Capacity utilisation of the major petrochemical plantsat the commencement of the Ninth Plan was 73.3per cent which was based on their capacity andproduction at the end of 1996-97. It is anticipated togo up to 93.43 per cent by the end of terminal yearof the Plan.
7.1.218 Petrochemical projects commissionedduring the Ninth Plan are: the gas-based crackercomplex of GAIL at Auraiya (Uttar Pradesh) with anethylene capacity of 0.3 mmt per annum (mmta) ata cost of Rs 2,500 crore; expansion of IndianPetrochemical Ltd.'s (IPCL) existing gas-basedcracker capacity from 0.3 to 0.4 mmta and HDPE/LLDPE swing plant capacity from 0.16 to 0.22 mmta;naphtha-based cracker complex of HaldiaPetrochemicals Limited (West Bengal) with anethylene capacity of 0.42 mmta and otherdownstream polymer products; IPCL's secondphase of Gandhar (Gujarat) complex with anethylene capacity of 0.3 mmta and mono ethyleneglycol of 0.10 mmta; and Reliance Group's 1.4 mmtap-xylene and 0.6 mmta polypropylene plant at theirJamnagar refinery complex. Due to uncertainty onprice situation impacting profitability and return oninvestment, fresh investment to the extent requiredto meet the domestic demand did not materialise.
7.1.219 The Assam Gas Cracker Complex Limited(AGCL) is proposed to be set up as a joint ventureof the Assam Industrial Development Corporationwith Reliance Industries Limited (RIL). This projectwas mooted as a part of economic developmentplan under the Assam Accord. The progress of theproject is highly unsatisfactory.
7.1.220 The per capita consumption of plastics inIndia in 1995-96 was around 2 kg, which is waybelow the world average of 17 kg. The outlook forthe domestic plastic industry is quite bright. Givena good GDP growth and increasing purchasingpower of middle-income groups, the demand forplastic goods will grow at a very good rate. Despiteintermittent periods of sluggishness, the overalltrend remains very positive. With futureconsumption of polymers expected to grow by 15per cent and that of fibres and intermediates by 7-8per cent, the petrochemicals sector offers immense
opportunity for domestic as well as foreign players.The estimated demand growth is 12-13 per cent forthe Tenth Plan for polymers and over 6 per cent forsynthetic fibres for the Tenth Plan period.
7.1.221 The basic objective of the Central Instituteof Plastic Engineering and Technology (CIPET)is to train people in various disciplines of plastics,plastic processing, etc. for the plastic industry.Modernisation of CIPET facilities through WorldBank assistance has been implemented.
7.1.222 IPCL has been disinvested and liquidationof the Petrofils Cooperatives Limited is underprogress.
Atomic Energy
7.1.223 Activities of the Department of AtomicEnergy (DAE) under the Industry and Mineralssector primarily include manufacture of nuclear andstructural materials and control systems to build andoperate the nuclear power plants and managementof the back end of the fuel cycle. The programmeprofile ensures that there is a sustained and timelysupply of nuclear fuel and other materials for theoperating nuclear power plants and the plants thatare being built. This sector is also engaged in theproduction of equipment for radiation and isotopeproducts and services going to some importantsectors of our economy, like agriculture, food, andhealth, etc.
7.1.224 The PSUs under DAE are UraniumCorporation of India (UCIL), Indian Rare Earths (IRE)and Electronics Corporation of India Ltd. (ECIL),which meet the requirements of uraniumconcentrates, zirconium sponge and instrumentsand controls respectively.
7.1.225 The present nuclear power generationcapacity in the country is 2,720 megawatt (Mw). TheDAE plans to raise the capacity to 7,180 Mw by2009-10.
7.1.226 A majority of the programmes implementedin the Ninth Plan have achieved the goals set bythe DAE. The activities covered included:exploration for uranium, rare metal and rare earthand beach sand mineral resources; mining andprocessing of uranium ores and mineral sands;

INDUSTRY
701
fabrication of nuclear fuel and production of heavywater for nuclear power reactors; reprocessing ofthe spent fuel and waste management; andproduction of control and instrumentation equipmentfor nuclear power plants. Reprocessing of spent fueland irradiated thorium as well as wastemanagement of the nuclear fuel cycle constitutedthe front end of the nuclear power programme.Radioisotopes produced in the research reactors,Dhruva and CIRUS at Trombay after formulatinginto radio-pharmaceuticals, radio-labelledcompounds and radiation sources are supplied tovarious users for application in industry, agriculture,research and health care.
7.1.227 The present heavy water capacity isenough to take care of the country's power needduring the Tenth Plan. Need for capacity additionwill arise during the Eleventh Plan. During the TenthPlan, the expenditure will be mainly towards energysaving retrofits and renewal and replacements andaugmentation of plant capacities.
7.1.228 Increased fuel requirement will require newadditions during the Tenth Plan. The heavy watermoderated reactors (in operation or to be installed),would need addition in capacity for Zirconium FuelTubes through three related projects namely NewZirconium Oxide Plant, Zirconium Plant andZirconium Fuel Tube Plant.
7.1.229 To tide over the problem of limitedavailability of natural uranium reserves in the country,development of Fast Breeder Technology with MOXfuel and advanced heavy water reactors on U-233has been taken up in earnest. It would require newfuel fabrication facilities at existing site of NuclearFuel Complex (NFC) as well as new locations undertwo separate line of activities.
7.1.230 The major investment in Tenth Plan will befor the MOX Fuel Pin Fabrication Plant atKalpakkam, Fast Breeder Reactor ReprocessingPlant and Fabrication of prototype fast breederreactor (PFBR) Core assemblies.
7.1.231 In addition to above, DAE pursues theprogrammes based on application of radiationtechnology in the field of health care, food preservationand industrial sectors and has set up facilities underBoard of Radiation and Isotope Technology (BRIT) andCentre for Advanced Technology (CAT). Some newprojects have been added under these units apart fromcontinuing projects.
Tenth Plan Schemes and Outlay
7.1.232 The approved Tenth Plan outlay fordepartments/ministries covered under industrysector is given in Table 7.1.13 :
Table 7.1.13Tenth Plan Outlay
Sl. No. Name of the Ministry/Deptt. Outlay BS IEBRA. Industry
1 Steel 11,044.00 65.00 10,979.00
2 Fertilisers 5,900.00 1,050.00 4,850.00
3 Petroleum and Natural Gas (I&M) 7,614.81 0.00 7,614.81
4 Chem.and Petro-Chem. 3,044.00 300.00 2,744.00
5 Ind. Policy and Promotion * 2,000.00 2,000.00 0.00
6 Heavy Industry 2,063.00 700.00 1,363.00
7 Commerce 4,562.00 4547.00 15.00
8 & Public Enterprises 50.00 50.00 0.00
9 Textiles ( I&M) 1,980.00 1,900.00 80.00
10 # Consumer Affairs 55.00 55.00 0.00
11& Company Affairs 50.00 50.00 0.00
12 Food and Public Distribution (I&M) 10.20 10.20 0.00

TENTH FIVE YEAR PLAN 2002-07
702
Schematic distribution of outlay Department-wiseis at Annexure 7.1.1.
THE PATH AHEAD
7.1.233 Each element of the Tenth Plan strategyhas been translated into a set of actionable points.
7.1.234 Important new policy packages andprogramme initiatives being launched in the TenthPlan are described in chapters on specificsectors.
7.1.235 The success of the Plan is predicated uponglobal economic recovery, access to developed
markets, a level playing field, enforcement of rulesof fair play, additional financial resources and latesttechnologies for developing countries. Equallycritical is the enabling policy environment.
Simplification of Procedures
7.1.236 Investment decisions are todayhampered by a plethora of laws, rules andregulations at the Central, State and local levels.On the basis of a study conducted by theAdministrative Staff College of India (ASCI), theprocedures governing the setting up of industriesare being simplified.
.............Contd. Table 7.1.13
Sl. No. Name of the Ministry/Deptt. Outlay BS IEBR
13 Surface Transport 1,047.86 242.86 805.00(Shipbuilding and Ship repair Sector)
14 Atomic Energy 3,350.00 2,270.00 1,080.00
15 Bio technology 30.00 30.00 0.00
16 DSIR 25.00 25.00 0.00
17 Ocean Development 100.00 100.00 0.00
18 $ Supply
* NRF Expenditure up to 2001-02 was included
@ Outlays of National Test House are not included ( NTH was transferred from D/o Supply on 17.8.2001 to D/o ConsumerAffairs)
$ Deptt of Supply merged in Deptt of Commerce in 2001-02, the expenditure pertain to DGS&D and NTH
# The expenditure of NTH is not included as it was transferred in 2001-02 after allocation under D/ Supply& No Outlays in Ninth Plan
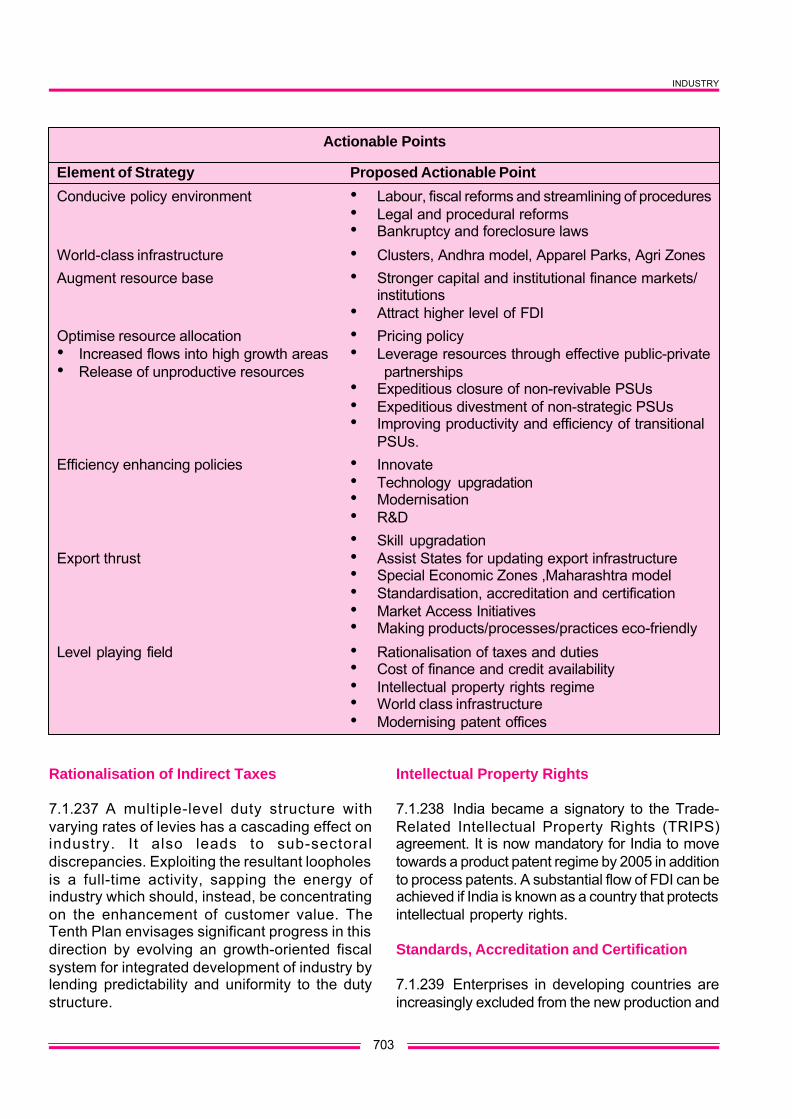
INDUSTRY
703
Actionable Points
Element of Strategy Proposed Actionable Point
Conducive policy environment • Labour, fiscal reforms and streamlining of procedures• Legal and procedural reforms• Bankruptcy and foreclosure laws
World-class infrastructure • Clusters, Andhra model, Apparel Parks, Agri ZonesAugment resource base • Stronger capital and institutional finance markets/
institutions• Attract higher level of FDI
Optimise resource allocation • Pricing policy• Increased flows into high growth areas • Leverage resources through effective public-private• Release of unproductive resources partnerships
• Expeditious closure of non-revivable PSUs• Expeditious divestment of non-strategic PSUs• Improving productivity and efficiency of transitional
PSUs.Efficiency enhancing policies • Innovate
• Technology upgradation• Modernisation• R&D• Skill upgradation
Export thrust • Assist States for updating export infrastructure• Special Economic Zones ,Maharashtra model• Standardisation, accreditation and certification• Market Access Initiatives• Making products/processes/practices eco-friendly
Level playing field • Rationalisation of taxes and duties• Cost of finance and credit availability• Intellectual property rights regime• World class infrastructure• Modernising patent offices
Rationalisation of Indirect Taxes
7.1.237 A multiple-level duty structure withvarying rates of levies has a cascading effect onindustry. It also leads to sub-sectoraldiscrepancies. Exploiting the resultant loopholesis a full-time activity, sapping the energy ofindustry which should, instead, be concentratingon the enhancement of customer value. TheTenth Plan envisages significant progress in thisdirection by evolving an growth-oriented fiscalsystem for integrated development of industry bylending predictability and uniformity to the dutystructure.
Intellectual Property Rights
7.1.238 India became a signatory to the Trade-Related Intellectual Property Rights (TRIPS)agreement. It is now mandatory for India to movetowards a product patent regime by 2005 in additionto process patents. A substantial flow of FDI can beachieved if India is known as a country that protectsintellectual property rights.
Standards, Accreditation and Certification
7.1.239 Enterprises in developing countries areincreasingly excluded from the new production and

TENTH FIVE YEAR PLAN 2002-07
704
trade patterns. This is linked to many structuralimpediments and supply-side obstacles.
7.1.240 Even where productive capacity isestablished, there are problems with accessingexternal markets, as products have to comply withmyriad technical standards, health and safetyrequirements set by the importing markets. TheTechnical Barriers to Trade (TBT) Agreement seeksto ensure that technical regulations and standardsdo not create unnecessary barriers to trade, but thisrequires countries to fully participate in the standard-setting processes, while having a full-fledgedinfrastructure and systems for certification,accreditation, metrology, and technical support andinformation services for industry.
7.1.241 Agreements reached by a member-countrywith another country or countries on issues relatedto technical regulations, standards or conformityassessment procedures also have considerableeffect on trade. Recently, Japan has entered into
such agreements with the European Union and theUnited States in a number of products. Theseagreements are permitted under the WTO andfacilitate considerable reduction in technical barriersto trade.
7.1.242 In order to be consumer-driven, IndianIndustry needs to be alert to emerging tastes andpreferences in the target markets. Concern forquality, health and safety (apart from changingfashion) is important. The application of eco-labelling and other environment qualityrequirements in textiles and clothing could affectthe textile industry in many developing countries.For example, following the ban on azo dyes inGermany in 1996, textile manufacturers in Thailandswitched to substitutes which involved additionalcosts estimated at 5 to 20 per cent. Textilemanufacturers in some other countries in the Asia-Pacific region, like India, encountered difficulties inobtaining substitutes. Small and mediumenterprises (SMEs) were slower to adjust to eco-labelling demands and found the costs ofadjustment difficult to absorb. Several of theseenterprises preferred to divert sales to the domesticmarket or other overseas markets which have noeco-labelling requirements.
7.1.243 In order to pre-empt such situations, aspecial area of focus needs to be quality control.Infrastructure in the nature of certification,accredited by acceptable professional agenciesneeds to be put in place. This may requireinstitutional tie-ups and transfer of knowledge, skillsand techniques. It is only on the basis of our abilityto align our standards of quality, health and safetywith emerging international requirements that wecan expect to be integrated with the world economy.The issue of harmonisation of standards deservesmuch greater attention on a multi-disciplinaryplatform comprising economists, health experts,toxicologists and technologists. The tendency is tokeep it in the domain of technologists.
Disinvestment
7.1.244 In the Tenth Plan, the Government wouldphase itself out as a producer of non-strategic goodsand services. The closure of non-viable PSUs andexpeditious disinvestment of others will release
Standards Setting
The Codex Alimentarius, which is a collection ofinternational food standards adopted by theCodex Alimentarius Commission, includesstandards for all the principal foods: processed,semi-processed or raw. To date, the CodexAlimentarius includes 4,821 standards. The mainpurpose of the standards is to protect the healthof consumers and to ensure fair practices in foodtrade. Standards are specified in the areas ofFood Standards for Commodities, Codes ofHygienic or Technological Practice, Pesticides,Limits for Pesticide Residues, Guidelines forContaminants, Food Additives and VeterinaryDrugs.
The pros and cons of our adopting thesestandards need to be analysed and debated.India seems to be losing out due to these non-tariff barriers although it possesses immensecomparative advantage in food processing. Thisis also true of the drugs and pharmaceuticalssector and automobile industry. Rigorouslyresearched preparation in this field can also helpus in WTO regime.

INDUSTRY
705
unproductive assets and direct them into moreefficient sectors with higher priority where they arelikely to leverage economic growth.
7.1.245 In view of the severe constraint of Planresources, voluntary separation schemes (VSS) andvoluntary retirement schemes (VRS) are plannedto be financed through commercial borrowing bythe PSU in the hope that they will be able to servicethe loans when their finances improve. PSUs in thetourism sector have set aside the proceeds ofdisinvestment for VSS/VRS corresponding to therequirement of the PSU being disinvested. In thetextiles sector, innovative ways have been found todeal with the vexed issue of closure of the NationalTextiles Corporation (NTC) mills located in the heartof Mumbai. An acceptable formula has been arrivedat for apportionment of the immense wealth lyinglocked up in sick textile mills in consultation withthe Maharashtra government and the local body.
Mechanism being contemplated in Companies Act,1956 as alternative to the abolition of Sick IndustrialCompanies Act (SICA), 1986 and the Board forIndustrial and Financial Restructuring (BIFR)
mechanism would considerably smoothen theprocess of disinvestment. Other measures arealso being contemplated to deal with the issue oftaking the public sector out of the jurisdiction ofthe BIFR until a more permanent solution isevolved. There are 250 Central PSUs, excludingsix insurance companies and two financialinstitutions. With an investment close to Rs.2,75,000 crore, the issue of managing thosePSUs where disinvestment will take considerabletime becomes important. It is proposed to bringthese PSUs under a new management culture.Important elements of the new culture aremodified memorandum of understanding (MoUs),global benchmarking, accountability andautonomy, induction of professional inputs,automatic listing/delisting as navaratnas andpreparation of a blueprint for survival on a case-to-case basis. The investment in State-level PSUsis also immense. According to the Ministry ofDisinvestment, the estimated investment in 835State-level PSUs is of the order of Rs. 200,000crore. The Tenth Plan envisages transfer of thosePSUs which are non-strategic and can be revivedto a more efficient management paradigm.
Table 7.1.14Disinvestment Transactions Completed Up To February 2002
Year No. of companies Target receipt for Actual receiptsin which equity sold the year (Rs. crore) (Rs. crore)
1991-92 47 2,500 3,038
1992-93 35 2,500 1,913
1993-94 – 3,500 Nil
1994-95 13 4,000 4,843
1995-96 5 7,000 362
1996-97 1 5,000 380
1997-98 1 4,800 902
1998-99 5 5,000 5,371
1999-00 2 10,000 1,829
2000-01 4 10,000 1,870.53
2001-02 10 12,000 5,632#
# Expected to be realised

TENTH FIVE YEAR PLAN 2002-07
706
Infrastructure
7.1.246 An efficient physical infrastructure is apre-requisite for industrial development. TheTenth Plan proposes new initiatives to effect asubstantial improvement in this area.Maharashtra and Andhra Pradesh havedeveloped innovative models of raising resources
through public-private partnerships (See Boxes).A special feature of these initiatives is theformation of special purpose vehicles (SPVs) witha major role for industry so as to ensure that theinfrastructure development is user-driven. Thisencouragement would also ensure thesustainability of assets created, something thatwas lacking in the previous Plans.
Maharashtra SEZ Policy
• A single empowered officer under supervisionand control of designated DevelopmentCommissioner for all no objection certificates(NOCs) for the State Pollution Control Board(SPCB).
• The DC also has the powers of LabourCommissioner
• Exemption to SEZ developers from all Statetaxes and duties and stamp duty.
• All SEZ units declared as public utility serviceunder the Industrial Disputes Act
• SEZ shall ensure the provision of adequatewater and power supply
• SEZ to function as self-governing autonomousmunicipal body.
Andhra Pradesh InfrastructureDevelopment Enabling Act, 2001
• Enable the performance of quasi-judicialfunctions
• Clearances provided within prescribed timelimits and non-statutory State level clearancesgiven automatically.
• Provides incentive to private sector participationin designing, financing , construction, O&M ofbankable infrastructure projects in the State.
• Comprehensive legislation for reducingadministrative and procedural delays.
• Detailed project delivery process andprocedures for reconciliation of disputes.
• Acquire land required for the project.
Table 7.1.15State Level Public Enterprises (SLPEs)
State Approx. No. Estimated total Net accumulated Approx. no. Approximateof SLPEs investment in loss (Rs. crore) of loss- no. of non-
SLPEs making SLPEs working SLPEs
All India 835 1,67,718 20,691 337 166of whichUttar Pradesh 45 24,753 3,110 N/A N/A
Gujarat 54 23,438 965 N/A N/AKarnataka 76 19,295 811 37 13
Maharashtra 65 19,186 N/A 43 17
West Bengal 82 18,241 5,068 59 6Punjab 53 12,425 847 25 23
Kerala 109 9,805 1,280 52 13Orissa 68 9,796 1,180 18 34
Madhya Pradesh 26 7,923 N/A 8 15Tamil Nadu 59 6,192 N/A N/A 12
Goa 12 4,869 730 N/A N/AAssam 42 3,649 2,792 28 10
Himachal Pradesh 21 3,143 369 12 2
N/A : Not AvailableSource : State Governments, Institute of Public Enterprises, Hyderabad and other sources

INDUSTRY
707
Foreign Direct Investment
7.1.247 In view of its non-debt creating and non-volatile nature with returns dependent on theperformance of the projects financed with it, FDI ispreferred over other forms of external finance. FDIalso facilitates international trade and transfer ofknowledge, skills and technology. This catalytic rolein itself can be very valuable in the Indian context.FDI has constituted between 1 per cent and 4 percent of gross fixed capital formation during the 1993-97 period. Capital formation has been, by and large,restricted to telecom and financial services.Compared to other countries, particularly China,India's performance in attracting FDI has beendismal. Streering Group headed by Mr. N.K. Singh,Member, Planning Commission, has studied thismatter and given a comprehensive set ofrecommendations. It is expected that the flow of FDI
will improve significantly as soon as theserecommendations are implemented.
Sectoral share of FDI (%)during August1991 to December 2001
Telecommunication 20.16Fuels (power and oil refinery ) 28.07of which power 13.80Computer Software 6.37Service Sector 6.14of which financial services 4.18Metallurgical Industries 5.61of which ferrous 2.7Food Processing Industries 3.33100 % =Rs. 2,73,577 crore
Source : SIA
Table 7.1.16Foreign Investment- Industry-wise Inflows
(As a percent of total)
Sector 1992-93 1993-94 1994-95 1995-96 1996-97 1997-98 1998-99 1999-2000 2000-01
Total Inflows (in $ million) 280 403 872 1,419 2,058 2,956 2,000 1,581 1,910
Chemical & 17 18 16 9 15 9 19 8 7Allied Products
Engineering 25 8 15 18 35 20 21 21 14
Financial Services 1 10 11 19 11 5 9 1 2
Electronics and 12 14 6 9 7 22 11 11 11
Electrical
Computers 3 2 1 4 3 5 5 6 16
Source : RBI
Table 7.1.17FDI as % share of total of Developing Countries
1989-94 1995 1996 1997 1998 1999 2000 2001(annual average)
Developing Countries (in billion $) 59.6 113.3 152.5 187.4 188.4 222 240.2 225.0
China 23.5 31.6 26.4 23.6 23.2 18.2 17 20.8
Brazil 2.5 4.9 6.9 10.0 15.1 14.1 13.9 8.9
South Korea 1.5 1.6 1.5 1.5 2.9 4.8 4.2 -
Malaysia 6.2 5.1 4.8 3.5 1.4 1.6 2.3 -
India 0.7 1.9 1.7 1.9 1.4 1.0 1.0 1.7

TENTH FIVE YEAR PLAN 2002-07
708
7.1.248 The objective of 8 per cent GDP growthrate with the given incremental capital output ratio(ICOR) and the projected level of domesticsavings seems to suggest that there is likelihoodof a savings to current account deficit of the orderof 2.2 per cent. This gap can be filled in by FDI.With the new initiatives in the areas ofinfrastructure investment and SEZs, it should bepossible to raise the level of FDI inflow from thepresent level of about $ 4 billion to $ 8 billion ayear during the Tenth Plan.
• Apparel Parks for Exports
• Textile centres infrastructure developmentscheme (TCIDS)
• Technology Upgradation Fund Scheme (TUFS)in Textile sector
• Assistance to States for development of exportinfrastructure and allied activities
• Market Access Initiative
• Research and development in the automotiveindustry
• Industrial Cluster Development Scheme
• Pharmaceutical Research and Development -Support Fund
• Agri Export Zones
• Leather Industry Development Programme
The details of these initiatives are given inAnnexure 7.1.2.
VILLAGE, SMALL AND FOOD PROCESSINGINDUSTRIES
7.1.251 This sector includes sub-sectors like small-scale industries (SSI), handlooms, handicrafts,powerlooms, sericulture, khadi, wool, coir industryetc. Over the years, this sector has emerged as adynamic and vibrant sector of the economy.
7.1.252 The VSI sector not only providesemployment to large number of people both in theurban and rural areas, but also contributessignificantly towards exports. Since it has themaximum local inputs in exports, it has a highervalue realisation from exports.
7.1.253 During the Ninth Plan, various initiativeswere taken to strengthen the SSI units throughtechnology upgradation, modernisation, enablingand encouraging them to enhance quality,introduction of modern management practices,providing marketing and other key inputs, increaseavailability of credit/loans from financial institutionsand banks against materials supplied, etc. Inaddition, SSI units were made aware about theimplications of the WTO regime, removal of QRs,
7.1.249 As anti-dumping appears to be becominga primary instrument of trade restriction, manySMEs in developing countries are unable to defendtheir interests. This is because of the complexitiesof the system and the cost of compliance ininvestigation proceedings. For example, forexporters to Canada and the United States, it is notunusual to incur costs well in excess of $ 500,000.As a result, small exporting firms in developingcountries are hardly able to take advantage of theprocedural and substantive rights theoreticallyavailable to them.
New Programme Initiatives
7.1.250 The following new initiatives are being takenup in the Tenth Plan:
Indicative Sectoral Annual FDI Targets
Sector FDI target($ billion)
1 Telecom 1.2
2 Power 1.0
3 Financial Services 0.8
4 LNG and Oil Exploration 0.6
5 Software and IT enabled services 0.5
6 Food and Beverages 0.4
7 Transportation 0.4
8 Textiles 0.3
9 Ports 0.3
10 Chemicals and Petrochemicals 0.2
11 Hotels and Tourism 0.2
12 Others 0.6
Total 6.5

INDUSTRY
709
reducing the list of items reserved for the sector,etc.
7.1.254 Two new schemes - the Credit GuaranteeFund and the Credit Linked Capital Subsidy scheme– were introduced. Adequate availability of moderninfrastructure facilities was sought to be ensuredby setting up Integrated Infrastructure DevelopmentCentres (IIDCs).
7.1.255 In the handlooms sector, greater emphasiswas laid on increasing market-oriented productionand value addition through design inputs andavailability of hank yarn at mill-gate prices.Powerlooms were included under the TUF andsetting up of Computer-Aided Design/Computer-Aided Manufacturing (CAD/CAM) centres, etc. Inthe handicrafts sector, promotional schemesfocussed on training and skill upgradation, designand technology improvement, supply of quality tools,strengthening of organisational support by settingup institutions like Institute of Carpet Technology,Bamboo Craft Development Institute, etc. was takenup. New schemes like the Deen Dayal Hath KarghaProtsahan Yojana (DDHPY) and AmbedkarHastashilpa Yojana were introduced for bothhandlooms and handicrafts.
7.1.256 In the sericulture sub-sector, promotionalschemes laid stress upon improving silkwormrearing practices, enhanced use of insecticides,introduction of new hybrid mulberry and multivoltinesilkworm races, improvements in silk reeling qualityand capacities by setting up modern reelingmachines and replacement of traditional matka andcharkha reeling. The focus in the unorganised woolsector was on improving productivity of wool persheep, better husbandry practices, improvement ofwool quality by setting up mini scouring plants,quality and testing facilities, improvements inweaving and designs, diversification to newproducts by mixing new fibres, angora andPashmina wool, etc.
7.1.257 Food processing industries wereencouraged by reducing excise duty on processedfood products and making new packaging materialsavailable, increasing the shelf life of processed foodproducts through R&D, setting up of quality testingand certification laboratories, providing
infrastructure facilities by setting up food parks,providing financial assistance for modernisation/expansion/technology upgradation, etc. A newbeginning has been made to adopt CodexAlimentarius Standards, and Hazard AnalysisCritical Control Point (HACCP) quality assurancesystems, total quality management, ISO-9000series standards, etc.
7.1.258 The policy measures taken up during theNinth Plan period would need to be furtherstrengthened as the VSI and food processingindustry sectors are more vulnerable to thepressures of competition arising from economicliberalisation, reduction in QRs and WTO-relatedmeasures. New policy measure would be requiredin the Tenth Plan to provide a level playing field atpar with the organised sector.
SMALL SCALE INDUSTRIES
7.1.259 Worldwide, SMEs are being recognised fortheir contribution to employment, innovation andeconomic dynamism. In the Indian context, SSI unitsare helping generate new jobs, supplying a widerange of products, contributing to exports, helping inmore equitable distribution of national income andemerging as outsourcing destinations. TheGovernment has been encouraging and supportingSSIs through policies for infrastructural support,technology upgradation, preferential access to credit,reservation of products for exclusive manufacture inthe SSI sector, preferential purchase policy etc.
7.1.260 By the end of March 2002, there wereover 3.4 million small scale industrial units in thecountry accounting for more than 40 per cent ofthe gross value of output in the manufacturingsector and about 35 per cent of the total exportsof the country. They provided employment to over19.2 million persons, which is second only toagriculture. During the Ninth Plan period, SSIscreated over 3.2 million jobs. Presently, there isno in-built component keeping record of functionalregistered SSI units. SSI units often shut downdue to unforeseen circumstances. The figuresprovided by District Industries Centres (DICs)may not include closed SSI units. Hence there isan urgent need to introduce a system of de-listingclosed registered SSI units.

TENTH FIVE YEAR PLAN 2002-07
710
7.1.261 A Study Group on the Development ofSmall Enterprises was set up under thechairmanship of Dr. S.P. Gupta, Member, PlanningCommission, to look into the problems of the SSIsector. The Study Group submitted an InterimReport in July 2000. After inter-ministerialconsultations on the Interim Report, the PrimeMinister announced a number of new policyinitiatives on 30 August 2000. Theseannouncements were followed by otherannouncements by the Ministry of Small-ScaleIndustry and Agro and Rural Industries (SSI&ARI).The final report of the Study Group was submittedin March 2001 and the recommendations are beingconsidered.
7.1.262 Indicative physical targets andachievements in respect of production, employmentand exports are given in Annexure 7.1.3 andAnnexure 7.1.4. Plan outlays and expenditure forthe Ninth Plan period, 2001-02 (Anticipated/Actual),Tenth Plan approved outlays and 2002-03 (BE) aregiven in Annexure 7.1.5.
7.1.263 Separate Ministries for Small ScaleIndustries and Agro and Rural Industries werecreated by bifurcating the Ministry of SSI&ARI. Thiswould help in giving boost to rural industrialisationand development of agro-based tiny units. Thescheme of Prime Minister's Rozgar Yojana (PMRY)would now be looked after by the Ministry of Agroand Rural Industries.
RESERVATION
7.1.264 Reservation of items for exclusiveproduction in the SSI sector was introduced in the1970s to ensure bulk production of consumerproducts and enhanced employment generation.Presently, there are 749 items reserved for the SSIsector. It has been found that though the SSI sectoris manufacturing around 8,000 items, the reservedlist items constitute around 15 per cent of the totalSSI production. Taking into account the WTOregime and economic liberalisation, the Study Grouprecommended continuation of reservation and de-reservation only in a phased manner so that theSSI units engaged in the production of reserveditems are not affected. It would be prudent to consultthe stakeholders while de-reserving items.
SMALL INDUSTRIES DEVELOPMENTORGANISATION
7.1.265 The Small Industries DevelopmentOrganisation (SIDO), under the Ministry of SmallScale Industries, is the nodal agency for assistingSSIs through technology, marketing, infrastructureand training support. It works with the Reserve Bankof India (RBI), Small Industries Development Bankof India (SIDBI) and commercial banks in makingcredit available to SSI units.
7.1.266 SIDO has set up a number of Tool Roomsto provide assistance for technological upgradation,technical consultancy and common service facilities
Package Announced By The Prime MinisterFor The SSI Sector
• Enhancement of excise duty exemption limitfor SSI units from Rs. 50 lakh to Rs.100 lakh.
• Increase in composite loan limit to Rs.25 lakh.• Coverage of loans up to Rs.25 lakh under the
Credit Guarantee Fund scheme.• Increase in project cost limit under the
National Equity Fund scheme to Rs. 50 lakh.• Credit linked capital subsidy at 12 per cent of
the cost of technological upgradation of SSIunits for modernisation of SSI units.
• The service and business related small scaleunits with a maximum investment limit ofRs.10 lakh would also be covered underpriority lending
• Enhancement of investment limit to Rs.500lakh for hi-tech and export oriented sectors.
• Technology Bank would be set up for SSIsector by strengthening the existingTechnology Bureau for Small Enterprises(TBSE) of SIDBI.
• One time capital grant of 50 per cent to SSIassociations for setting up international-leveltesting laboratories for SSI units.
• Preference to be given to tiny units whileorganising buyer-seller meets, vendordevelopment programmes and exhibitions.
• Conduct of Third Census on SSI.• Integrated Infrastructure Development
Centres (IIDC) scheme extended to all areas.

INDUSTRY
711
for design and production of quality toolings.Presently 10 Tool Rooms are functioning at Kolkata,Ludhiana, Jalandhar, Nagaur, Hyderabad,Bhubaneshwar, Jamshedpur, Ahmedabad, Indoreand Aurangabad. A new Tool Room and TrainingCentre has been set up at Guwahati. Mini ToolRooms would be set up in various States to help increating localised training and production facilities.
7.1.267 The Technology Upgradation andManagement Programme (UPTECH) was launchedin 1998 to take care of the modernisation andtechnological needs of the SSI clusters. Six clustershave been identified and diagnostic studies for thesehave been taken up. A major cluster developmentprogramme would be taken up during the Tenth Planperiod through the UPTECH Scheme. There areabout 350 important SSI clusters in the countryidentified by the Office of the DevelopmentCommissioner (SSI) and a few new clusters wouldbe taken up for development each year.
INTEGRATED INFRACTURE DEVELOPMENTCENTRES
7.1.268 The IIDC Scheme aims at augmenting theinfrastructural facilities in rural and backward areasto promote industrial development. This scheme hasbeen revamped in the Ninth Plan by removingcertain restrictive provisions and by providing liberalfinance to the northeastern region, including Sikkim,and Jammu and Kashmir. So far, 58 IIDCs havebeen approved and Central grant of Rs. 38.83 crorehas been released up to February 2001. Anadditional 50 centres are proposed to be taken upduring the Tenth Plan period.
PRIME MINISTER'S ROZGAR YOJANA (PMRY)
7.1.269 The PMRY, now under the Ministry of Agroand Rural Industries, makes institutional financeavailable to educated unemployed youths for settingup of business/industrial ventures. A number ofmodifications have been made during the Ninth Planperiod to make it more attractive, e.g. increase inthe age limit to 45 years for ex-servicemen, womenand disabled; reduction of minimum educationalqualification; enhancing the income limits andproject size; enhancing credit/loan portion forbeneficiaries in the northeast etc.
7.1.270 Since the inception of PMRY in 1993-94,against the target of 1.8 million beneficiaries (1993-94 to December 2001), 1.868 million beneficiarieswere sanctioned loans and Rs. 8,402 crore wasdisbursed to 1.433 million beneficiaries. For theTenth Plan period, the target of number ofbeneficiaries to be covered annually is proposed tobe increased from 0.22 million per year to 0.26million per year, so as to cover the backlog. Averagelending by banks to PMRY beneficiaries was Rs.53,632 per project/venture. It has been observedthat the number of beneficiaries to whom loans weredisbursed was around 34 per cent of the number ofapplicants. This is a huge gap and requirescorrective measures. Beneficiaries need to prepareeconomically viable project reports. The nationalaverage rate of repayment of loans of around 35-40 per cent is also a cause of worry. This needs tobe improved.
OTHER SCHEMES
7.1.271 The Ministry of SSI is also implementingother schemes like international cooperation,surveys, studies and policy research, Trade RelatedEntrepreneurship Assistance and Development forWomen (TREAD); National EntrepreneurshipDevelopment Board (NEDB); and Micro FinanceProgramme. The Ministry provides financialassistance to SSI entrepreneurs for participation inoverseas fairs to enable them to source technologyand access export markets. The Ministry hasentrusted a number of studies and surveys tovarious research, academic and training institutionson topics relevant to policy making. A package ofassistance of loans from financial institutions suchas SIDBI and Government grants is provided underTREAD to NGOs and groups of women to take upincome generating industry/service related activity.The NEDB has been set up to consolidate andcoordinate the syllabus for training and otheractivities of various institutes like the NationalInstitute of Entrepreneurship and Small BusinessDevelopment (NIESBUD), National Institute ofSmall Industry Extension Training (NISIET),Entrepreneurship Development Institute (EDI) etc.Under the micro finance programme, NGOs areprovided financial assistance to enhance theircapabilities to provide help to self-help groups totake up income generating activities.

TENTH FIVE YEAR PLAN 2002-07
712
7.1.272 Indicative physical targets andachievements in respect of production, employmentand exports are given in Annexure III. Plan outlaysand expenditure for the Ninth Plan period, 2001-02(Anticipated/Actual), Tenth Plan approved outlaysand 2002-03 (BE) are given in Annexure 7.1.5. Thesector is targeted to grow at 12 per cent per annumduring the Tenth Plan. To make this possible, it isnecessary that the concerns of the sector receivedue attention of policy makers.
7.1.273 Under the zero-based budgeting exercisecarried out by the Planning Commission, 89schemes being implemented by the Ministry ofSSI&ARI in the Ninth Plan were brought down to22 and 13 respectively for the Ministry of SSI andMinistry of A&RI. A large number of old schemeshave been eliminated and remaining schemes havenow become more focused, avoiding thin spreadof outlays/expenditure. SIDO was implementing 64schemes in the Ninth Plan, which were reduced to13 by weeding out, merging and regrouping.
NATIONAL SMALL INDUSTRIES CORPORATIONLIMITED
7.1.274 The National Small Industries Corporation(NSIC) Ltd. was established in 1955 to promote,aid and foster the growth of small industries. TheCorporation provides machinery on hire purchase,equipment on lease, raw material assistance,marketing inputs for domestic and exports, singlepoint registration, technical and managerialassistance, etc. The NSIC is also helping SSI unitsin marketing, enterprise building, training to promoteviable small industries all over the country,particularly in backward areas and in selected linesof production identified as priority areas for exports.
7.1.275 The NSIC is operating schemes like (i)Raw Materials Assistance Programme (ii) IntegratedMarketing Support Programme (iii) Marketing toGovernment and Tender Marketing (iv) export andexhibitions (v) setting up of software technologyparks and (vi) consortia formation.
7.1.276 Under the Raw Materials AssistanceProgramme, the Corporation purchases rawmaterials, components, sub-assemblies for and onbehalf of SSI units and allows them to take delivery
in small lots, as per their requirement and payingcapacity so as to clear the entire stock within 100days from the date of storage. The IntegratedMarketing Support Programme has been envisagedto meet financing requirements of SSI units arisingdue to deferred payment being made for sale ofgoods.
7.1.277 The NSIC has established five technicalservice centres at Okhla in Delhi, Rajkot, Howrah,Chennai and Hyderabad to provide technical andconsultancy services to SSI units. During the NinthPlan, against the target of Rs. 6,015 crore theCorporation's turnover was Rs. 4,074.90 crore. Itregistered profits up to 1999-2000. In 2000-01, theCorporation made an additional ad-hoc provisionof Rs. 41.11 crore over and above the normalprovision for bad and doubtful debts, which resultedin a loss for the year. The main reasons for this losswere additional provision to bring the Corporation'sfinances in line with the intrinsic values of itsinvestment, accumulated defaults of SSI unitstowards hire purchase financing, leasing ofmachinery, etc.
7.1.278 The Corporation is in the process ofbusiness restructuring and has adopted newstrategies like sectoral approach, identifying thegrowing sectors/industries, promotions oftechnology led interventions, networking withnational and international industry associations andmultilateral agencies to rejuvenate the Corporationwith a focus on improving profitability. It is makingall efforts to salvage the maximum it can fromdefaulting SSI units through legal and otherrecourse. Stress would need to be laid uponincreasing the internal and extra budgetaryresources (IEBR) of the Corporation so as toenhance the Plan outlays and extend theCorporation's coverage to more SSI units throughthe services/schemes under implementation in theTenth Plan period.
7.1.279 The Corporation is organising Tech Martsin collaboration with the Asia and Pacific Centre forTransfer of Technology. The NSIC is also helpingSSI units in technology transfer from abroad throughthe Technology Transfer Centre. An Internet portal(Technology Showcase) has been set up for sourcingtechnologies from international partner institutions.

INDUSTRY
713
COIR INDUSTRY
7.1.280 Coir industry ranks foremost among thetraditional cottage industries. It is a labour intensiveand export oriented industry. Coir Board is vested withthe responsibilities of promoting growth anddevelopment of coir industry, promotion of exports andexpansion of the domestic market through buildingbrand equity. The emphasis will be on greaterparticipation of private sector and State Governments.The Board implements a number of developmentalprogrammes aimed at higher utilisation of coconuthusk for industrial use particularly in the non traditionalareas providing scope for augmenting ruralemployment. The straegy is to focus on research anddevelopment for restructuring the production base withadoption of appropriate technology, reduction ofdrudgery, transfer of technology through skilldevelopment training, cluster approach indevelopment, environment protection and welfare ofall those who are engaged in this industry.
7.1.281 As part of modernisation of spinning sector,setting up of Integrated Coir Development Projects(ICDPs) has been taken up. In Kerala, 125 spinningunits and 46 defibring units are being set up. A sum ofRs. 5.35 crore has been released to the StateGovernments towards 20% central share. So far 81spinning units and 34 defibering units have beencommissioned. The ICDP for Tamil Nadu has beensanctioned at an estimated cost of Rs. 14.91 crore withCentral share of Rs. 2.91 crore. A total amount of Rs.0.84 crore has been released so far. A similar project atan estimated cost of Rs.4.65 crore has been sanctionedfor Karnataka. The scheme envisages setting up of 8new primary cooperative societies, modernisation andexpansion of 27 existing coir cooperatives and settingup of Common Facility Centres for yarn dyeing. Anamount of Rs. 0.53 crore has been released to Govt. ofKarnataka towards central share. The ICDP for westBengal has been sanctioned at an estimated cost Rs.0.13 crore for setting up of motorised spinning unitswith 50 motorised ratts.
7.1.282 Based on a study by the National Councilfor Applied Economic Research (NCAER), theminimum export price on coir and coir products hasbeen phased out. This step has made the exportsof coir products cost competitive and easier. Coirexports have shown consistent growth after removalof minimum export prices.
7.1.283 The Coir Board is implementing a schemeof Technology Transfer, Modernisation and CapacityBuilding in Indian Coir Sector with funding support
from UNDP to the tune of $ 8,46,000. Six coirclusters in Tamil Nadu, Andhra Pradesh, Karnatakaand Kerala have been identified. The rebate schemehas been abolished and the Market DevelopmentAssistance (MDA) scheme has been introduced toassist the coir cooperative societies.
7.1.284 Hindustan Coir is a model powerloom factoryestablished by the Coir Board in 1969 with a view todemonstrate the production of coir matting onpowerlooms to motivate other entrepreneurs to startsuch units. The factory produced 0.279 million sq.meters of powerlooms matting during 2000-01, valuedat Rs. 2.47 crore.. The factory has obtained ISO 9002certification by BVQ1 in 1997 and is the first powerloomfactory in the coir industry to get this certification.
7.1.285 Important achievements in R&D are:development of Coirret (a bacterial consortia) toreduce the period of retting and processing,conversion of coir pith into organic manure by usingPith Plus (a fungal spawn), development ofmotorised spinning ratt, development of semi-automatic loom to increase productivity andreduction of drudgery in weaving, setting up of ASTMlaboratory for testing coir geo-textiles, etc.
Tenth Plan Initiatives
• 12 per cent growth in coir and coir productsand exports during Tenth Plan
• Rapid growth of coir industry in non-traditionalStates and higher utilisation of raw materials
• To concentrate upon R&D and marketdevelopment activities
7.1.286 Under the zero-base-budgeting exercisethe number of schemes under the coir sub-sectorhave been reduced from 10 in the Ninth Plan toseven in the Tenth Plan. This exercise has madethe schemes more concerted and avoided thinspread of Plan outlays.
TEXTILE (VSI) SECTOR
Handlooms
7.1.287 Handlooms are a part of India's richheritage and exemplify the country's diversity andthe artistry of the weavers. It plays a very importantrole in the economy. This sector is estimated to

TENTH FIVE YEAR PLAN 2002-07
714
provide direct and indirect employment to about 2.52million weaver households and about 12.4 millionweavers and others engaged in weaving and alliedactivities in 2001-02. Due to effective Stateintervention through financial assistance andimplementation of various developmental andwelfare schemes, this sector has been able towithstand competition from the powerloom and millsectors. The sector contributes nearly 19 per centof the total cloth produced in the country and alsocontributes substantially to the country's exportearnings. Performance of the sub-sector is indicatedin Annexure 7.1.3.
of its principal raw material, namely, hank yarn.The Central Government has been making effortsto ensure regular supply of yarn to the handloomsector at reasonable prices through the HankYarn Obligation Scheme and supply of yarn atMill Gate Price through the National HandloomDevelopment Corporation (NHDC). The NHDChad supplied 16.79 million kg of yarn during 2000-01 to the handloom agencies. During 2001-02,the NHDC supplied 17.581 million kg of hank yarnup to February 2002.
7.1.291 As part of marketing support, financialsupport is provided to handloom organisations toparticipate in exhibitions/melas at Surajkund,Shilpgram-Udaipur, Craft Bazar - Madepura,Hyderabad, Taj Mahotsav and Dilli Haat. Financialassistance is also provided to State HandloomCorporations, Apex Federations, etc, to organisedistrict-level fairs, festivals and setting up of UrbanHaats in different parts of the country. So far 11Urban Haats have been sanctioned.
7.1.292 A group insurance scheme, healthpackage scheme, thrift fund scheme and workshed-cum-housing scheme etc. are being implementedas welfare measures and to provide better workingconditions to handloom weavers.
7.1.293 The DDHPY was initiated in 2000 as acomprehensive scheme for the development of thehandlooms sector. Under the scheme, financialassistance is provided to handloom organisationsfor components like basic inputs, infrastructuresupport, design input, publicity, marketing incentive,transport subsidy and strengthening of handloomorganisations. Grant is provided in the ratio of 50:50between Central and State Governments. In thecase of Sikkim, Jammu and Kashmir and thenortheastern States, the sharing ratio is 90:10. Forimplementing agencies where all the beneficiarymembers are scheduled castes/scheduled tribes/women/minorities, the grant portion would beshared in the ratio of 75:25. The assistance formarketing would be in the ratio of 50:50 betweenthe Central and State Governments in respect of allthe states. During 2000-01, Rs. 16.96 crore werereleased to 12 States and in 2001-02 up toDecember 2001 Rs. 26.04 crore were released.
Tenth Plan Initiatives
• Ensure better access to inputs like yarn, dyesand chemicals, design and credit
• Creation of a brand identity and positioningin international market
7.1.288 The handlooms sector is facing a numberof problems like obsolete technology and traditionalproduction techniques, high price of hank yarn,inadequate availability of inputs like standardiseddyes and chemicals in small packs, lack of newdesigns, inadequate training for upgradation of skillsetc. and inadequate marketing intelligence andfeedback. Besides, it suffers from disadvantageslike unorganised structure, weak financial base ofthe weavers and bureaucratisation/politicisation ofcooperatives.
7.1.289 The schemes/programmes for handloomsare weaver oriented. Concerted efforts are beingmade through the schemes to enhance theproductivity, income and socio-economic status ofweavers by upgrading their skills and providingessential inputs. Major schemes underimplementation are: Deen Dayal HathkarghaProtsahan Yojana, National Centres for TextileDesign, Enforcement of Handloom Reservation Act,Mill Gate Price Scheme, Handloom ExportPromotion, Workshed-cum-Housing Scheme,welfare schemes, marketing support and trainingand development.
7.1.290 The handloom sector is largelydependent on the organised mill sector for supply

INDUSTRY
715
7.1.294 Under the zero-base-budgeting exercise,the number of schemes under handlooms sub-sector has been reduced from 19 in the Ninth Planto eight in the Tenth Plan. This exercise has madethe schemes more focussed.
POWERLOOMS
7.1.295 The decentralised powerloom sectorcontributes in a major way in meeting the clothingneeds of the country. The powerloom industryproduces a wide variety of cloth, both grey as wellas processed, with intricate designs. It contributesaround 68 per cent of total cloth production of thecountry, excluding the cloth produced by non-SSI,weaving and hosiery/knitting units. This sector alsocontributes significantly to the export earnings byexporting made ups, ready made garmentsmanufactured from the powerloom cloth.
7.1.296 The estimated number of powerlooms inthe decentralised sector has increased from 0.639million in 1986 to 1.662 million as on 31 December2001. There are 13 Powerloom Service Centres(PSCs) functioning under the Textile Commissionerand 29 PSCs under the different Textile ResearchAssociations (TRAs). Two PSCs have been set upby the Governments of Andhra Pradesh andMadhya Pradesh at Hyderabad and Jabalpurrespectively. These PSCs have been establishedto provide inputs like technical consultancy, training,designs, technology information, etc, to thepowerlooms. Existing laboratories set up at thesePSCs to provide testing facilities to powerlooms arebeing upgraded and 14 such laboratories have beenupgraded. This programme would be continuedduring the Tenth Plan period also.
7.1.297 There is a need to modernise andstrengthen the existing PSCs by installing shuttle-less looms, Cop-changing/shuttle changing looms,Drop box looms, Dobby, Jacquard terry fabricweaving looms, prin winding machines, sectionalwarping machines, yarn and fabric testingequipment, chemical testing equipment etc. Twenty-one PSCs have been modernised during the NinthPlan period and this programme would be continuedduring the Tenth Plan to cover the remaining PSCs.Seventeen CAD centres have been set up. Uplinkingand downlinking of two CAD centres at Panipat in
Haryana by the North India Textile ResearchAssociation (NITRA) and at Solapur in Maharashtraby the Bombay Textile Research Association(BTRA) along with the National Design Centre, NewDelhi, has been completed.
7.1.298 There is an urgent need to modernise thepowerloom industry so as to enable it to face thecompetition which would come with the phasing outof the Multi Fibre Agreement (MFA) by December2004. Indian powerlooms would have to face toughcompetition from neighbouring countries like China,Bangladesh, Sri Lanka and also South Korea etc.The TUF scheme is being extended to coverpowerlooms. However, powerloom units are notcoming forward to take advantage of this schemein a large way. Also, the financial institutions wouldhave to provide adequate working capital after theunit has completed its modernisation. Normally,financial institutions are reluctant to provideadequate working capital and hence the scheme isnot picking up. There is need for setting up moderncloth processing facilities in powerlooms and toprovide new varieties of cloth like anti-crease, anti-wrinkle cloth etc. The Credit Linked Capital SubsidyScheme for the modernisation of the SSI sectorwould now also be available to the powerloomsector.
Tenth Plan Initiatives
• Technology upgradation of powerlooms
• Modernisation of powerloom service centresand testing facilities
• Welfare of powerloom workers
7.1.299 Under the zero-based budgeting exercise,the number of schemes under the powerlooms sub-sector have been reduced from eight in the NinthPlan to three in the Tenth Plan.
WOOL AND WOOLLEN DEVELOPMENT(UNORGANISED SECTOR)
7.1.300 The woolen industry in India is mainlylocated in Himachal Pradesh, Punjab, Haryana,Rajasthan, Uttar Pradesh, Maharashtra and Gujarat.Forty per cent of the woolen units are located inPunjab, 27 per cent in Haryana, 10 per cent in

TENTH FIVE YEAR PLAN 2002-07
716
Rajasthan while the remaining 23 per cent aresituated in other states. The organised sector,unorganised sector and the rural sector operatein a complementary manner towards meeting therequirements of different sections of the domesticmarket as well as exports. The organised sectorcomprises composite mills, combing units,worsted and non-worsted spinning units andmachine made carpet manufacturing units arecovered while the unorganised sector containshosiery and knitting, powerlooms, hand knottedcarpet units and independent dyeing/processinghouses.
7.1.301 The Central Wool Development Board(CWDB), Jodhpur, was set up in 1989 to harmonisevarious diversified interests of different sectors ofthe wool industry for the integrated development ofthe industry. The CWDB promotes growth anddevelopment of wool and woolen products throughvarious activities like market intelligence, marketingof wool and woolens, standardisation of wool andwoolen products, quality control, dissemination ofinformation, product diversification, advisinggovernment on policy matters, coordination etc.
7.1.302 For the development of angora wool a Rs.8.43 crore UNDP-aided project under UNDP-CCF1is being implemented. Rural unemployed youths andfarmers of the hill areas of Uttar Pradesh, HimachalPradesh, Darjeeling, Sikkim, etc, are beingencouraged to take up production and processingof Angora wool. The project aims at encouragingrabbit farming in remote hilly areas to increase theproduction of Angora wool to result in saving of foreignexchange and generation of new employment. TheBoard has provided funds to implementing agenciesof Himachal Pradesh, Uttar Pradesh and Sikkim forsetting up of germplasm centres under the UNDPprogramme. The Board has benefited 450 familiesduring the Ninth Plan period.
7.1.303 Under the Integrated Sheep and WoolDevelopment Project, the focus has been on breedimprovement, health coverage, productdevelopment, marketing assistance, training tosheep breeders in sheep, sheep husbandry andproductivity, etc. The Board has covered 3.875million sheep under this programme during the NinthPlan period.
7.1.304 The CWDB has set up wool testing centresat Bikaner, and Beawar in Rajasthan for providingtesting facilities to wool growers, merchants andthe industry. The Board has also set up mini woolscouring plants in Jammu and Kashmir, Gujarat,Himachal Pradesh, Maharashtra and Karnataka toprovide scouring facilities to small and cottageindustries engaged in the wool sector. The Boardhas set up a weaving and designing centre at Kullu,besides training centres, industrial service centres,wool testing facilities, etc. at other locations.
7.1.305 The Board is implementing a machineshearing-cum-training project to encourage the useof shearing machines and demonstrate machineshearing to enable sheep rearers to take up as aneconomically viable activity. The Board has set up10 market intelligence centres in the main woolmarkets. Information is collected with respect toprevailing market rates of wool and yarn, latesttrends and transactions of wool and woolenproducts on a weekly basis and disseminated towool growers, wool merchants and wool users.
7.1.306 The Board has sponsored 174 farmers/resource persons for imparting training in sheepmanagement/machine shearing/angora rabbitrearing. To promote wool and woolens and toprovide better marketing facilities to weavers, theBoard is implementing a Woolen Expo Scheme andhas organised 20 Expos. The Board has alsoprovided training to 255 weavers under the Weavingand Designing Training Programme during the NinthPlan. The Board is also printing a magazine WOOLWAYS for informing those in the trade abouttechnological advancements, market intelligence,etc.
7.1.307 Under the zero-based budgeting exercise,the number of schemes under wool developmenthave been reduced from 14 in the Ninth Plan to sixin the Tenth Plan.
Tenth Plan Initiatives
• Augmentation of availability of carpet gradewool, Angora and Pashmina and TechnologyUpgradation
• Integrated development and growth of wooland woolen in a Mission Mode

INDUSTRY
717
SERICULTURE
7.1.308 India is the only country producing all fourvarieties of silk -- mulberry, Eri, Tasar and Muga andit is the second largest producer of silk in the worldafter China. Sericulture is a labour-intensive, agro-based industry providing employment to about 6.25million persons. The Central Silk Board (CSB) looksafter the development and growth of sericulture,providing extension and R&D inputs to thesericulture industry. The Board covers areas likeresearch and technology development, seedmaintenance and production and development ofsericulture and silk industry.
7.1.309 Research institutes established under theCSB are functioning at Mysore (Karnataka),Berhampore (West Bengal) and Pampore (Jammuand Kashmir), all dealing with mulberry sericulture.The institute at Ranchi (Jharkhand) deals with Tasar,whereas the institute at Jorhat (Assam) is lookingafter R&D related to Muga. Post-cocoon R&Dactivities are carried out by the Central SilkTechnological Research Institute (CSTRI),Bangalore. The Silkworm Seed TechnologyLaboratory (SSTL), Bangalore (Karnataka), isengaged in seed maintenance and production. TheCentral Sericulture Germplasm Resource Centre(CSGRC) at Hosur (Tamil Nadu) is engaged insericulture germplasm related R&D and the SeriBiotech Research Laboratory (SBRL), Bangalore,undertakes R&D in areas related to developmentof new silkworm races.
7.1.310 During the Ninth Plan period, the target ofproduction of 20,600 mt of raw silk could not beachieved as the anticipated production wasexpected to be 17,980 mt by 2001-02. The mainreasons for the shortfall were lower demand formultivoltine silk and switching over to importedChinese silk, particularly for weft as well as warppurpose by handlooms and powerlooms. In view ofthe lower production cost of raw silk in China andthe growing international demand for silk, Indiashould take new initiatives in the Tenth Plan. Theseshould relate to: (i) achieving international standardsin all varieties of silk; (ii) improving R&D and effectivetransfer of technology; (iii) focus upon increasingbivoltine silk production and non-mulberry varietiesof silk; and (iv) encouraging cluster development
for reeling and weaving and strengthening linkagesbetween sericulture and textile industry. The TenthPlan strategies for sericulture have been formulatedtaking into account the above aspects.
7.1.311 The CSB provides quality silkworm seedsthrough the National Silkworm Seed Project(NSSP). During the Tenth Plan, the requirement ofsilkworm seeds would be higher than the presentcapacity of CSB and State Government silkwormseed production centres. There is need tostrengthen basic seed multiplication and trainingcentres, P2 seed farms, grainages under CSB andState Governments. Private entrepreneurs wouldbe encouraged to take up seed cocoon and diseasefree layings (DFLs) production. The seed productionactivity need to be made self sufficient without anysubsidy.
7.1.312 The CSB had formulated 36 catalyticdevelopment schemes for implementation in theNinth Plan to motivate States to increase productivityand quality and provide marketing support. Theseschemes have been reviewed under zero-basebudgeting and 11 schemes have been weeded out.The remaining 25 schemes have been reorganisedinto 12 schemes. These schemes are aimed atincreasing quality raw silk production, promotion ofdrip irrigation, enterprise development, creation ofimproved mulberry variety banks, etc.
7.1.313 Under the bivoltine sericulturedevelopment project taken up with the assistancefrom Japan International Cooperation Agency(JICA), a number of improved bivoltine breeds wereevolved of which bivoltine hybrids ( CSR (2 - 4 - 5),CSR (12 - 6), CSR (18 - 19), CSR (16 -1) and CSR(3 - 6)) were authorised for commercial use. Theseraces yielded high quality silk of 2/3A grade duringexperimentation.
7.1.314 The CSB signed an MoU with the NationalResearch Development Corporation (NRDC) forassisting in commercialisation of the evolvedtechnologies. Presently the CSB has offered around29 technologies to NRDC for patenting andcommercialisation. These include the silkworm beddisinfectants like Reshamkeet Oushadh, Vijetha,Resham Jyothi and Uzitrap which are found to beeffective in controlling various mulberry silkworm

TENTH FIVE YEAR PLAN 2002-07
718
diseases and have been put to large scalecommercial exploitation.
7.1.315 The UNDP has started a sub-programmeon development of non-mulberry silk (Tasar, Mugaand Eri) in Andhra Pradesh, West Bengal, Assam,Bihar, Orissa, Meghalaya and Nagaland under theFibres and Handicrafts Programme (FHAP) of CCF-1 in collaboration with the Government of India at atotal cost of Rs. 11.99 crore. Of this, the Governmentof India's share is Rs. 3.98 crore. This programmecovers increase of quality egg production andsupply, training and skill upgradation, technologicalsupport in pre-cocoon and post-cocoon processes,including reeling, spinning, etc. The programme isexpected to be completed by 2002-03.
7.1.316 The sericulture project of the MadhyaPradesh Government is being implemented incollaboration with the JBIC at an estimated cost ofRs. 748.80 crore. The Manipur Government is alsoimplementing a sericulture project from July 1998,at an estimated cost of Rs. 490.61 crore withfinancial assistance from JBIC.
7.1.317 During the Tenth Plan period, the CSBplans to focus upon the quality of raw silk by settingup quality certification systems for silkworm seed,cocoons and yarn as well as certification of exportproducts. There is need to promote the culture ofquality in every production process. The CSB hasalso proposed to take up market-linked productionplanning in the Tenth Plan period. Promotion ofmultivoltine based crossbreed mulberry sericulturewould be continued along with expansion of Eri andMuga silk. For Jharkhand, Chhattisgarh andUttaranchal more stress would be laid upon oakTasar sericulture along with normal Tasar. There isan urgent need to take up bivoltine mulberry hybridsilk production to meet warp demand and also totake up production of export-oriented silk powerloomproduction. Besides this, the CSB proposes to takeup new schemes/projects like integrated nutrientmanagement, integrated farming systems,development of new hybrid silkworm seeds, clusterdevelopment and assistance to States for specificprojects.
7.1.318 China is the major producer of silk andaccounts for 75 per cent of global production. China
also dominates exports of raw silk, silk yarn andsilk fabrics with a global share of around 93 per cent,43 per cent and 29 per cent respectively. The Indiansericulture industry is also facing a major problemof imports of cheaper silk. A lot of silk is also comingthrough illegal channels. This affects the prices ofraw silk in India, further building pressure uponcocoon prices and narrowing the margins offarmers/sericulturists.
7.1.319 The entry of China into the WTO providesopportunities as well as challenges to the Indiansilk industry. It would help India to improve its globalpositioning. It is generally believed that the Chinesesilk is highly subsidised and its products are sold atcheaper rates as compared to Indian silk. Underthe Subsidies and Countervailing Measures of theWTO agreement, China would have to regulatethese subsidies.
7.1.320 During the Tenth Plan period, there is anurgent need to adopt bivoltine sericulture on a largescale and to improve the quality of raw silk. Furtherdiversification into new products and taking up valueaddition in the silk industry would also be necessary.
Tenth Plan Initiatives
• Achieving international standards for silk• Improving R&D and effective transfer of
technologies to farmers/ reelers• Enhancing production of Tasar, Muga Eri silk• Enhancement of bivoltine silk production• Cluster development and improvement in
reeling and weaving• Strengthening linkages between producers of
silk and industry
HANDICRAFTS
7.1.321 The handicrafts sector is makingsubstantial contribution to the country's economyin terms of employment generation and foreignexchange earning through exports. Growth in thissector over the last few years has been encouraging(Annexure 7.1.3).
7.1.322 The developmental schemes underimplementation in the handicrafts sub-sector cover

INDUSTRY
719
various areas like training, design development,technology upgradation, market promotion,exhibitions and publicity, exports etc. Training isbeing provided to artisans for upgrading the skills ofexisting craftsmen as well as to un-skilled ones witha view to expanding employment and the productionbase of crafts for economic growth and revivinglanguishing crafts. Several studies have shown that70 to 80 per cent of the trainees get gainfulemployment.
7.1.323 Out of 196 departmental Basic TrainingCentres and 100 Advanced Training Centresproviding training for carpet weaving, 141 centreshave been closed. To help the artisans in Jammuand Kashmir, training centres in the State would becontinued during the Tenth Plan. For post-weavingoperations like washing and finishing of carpetsseven centres are providing training to artisans.Training is being provided to artisans for crafts likehand printed textiles, art metal-ware, cane andbamboo, wood-wares, etc, in various trainingcentres set up at important clusters of these crafts.
7.1.324 Regional Design and TechnicalDevelopment Centres (RDTDCs) are providingdesign and technical guidance in different crafts toartisans at Bangalore, Kolkata and Guwahati.Various design workshops and other activities arecarried out at these centres to make these crafts asuccess in the contemporary market, and help inpreserving traditional beauty of the crafts on thebasis of strong ethnic designs. Besides theseRDTDCs, Development Centre for MusicalInstruments at Chennai, Cane and BambooDevelopment Institute at Agartala, Institute of CarpetTechnology at Bhadohi and Metal HandicraftsCentre at Moradabad are undertaking research anddesign, developing technology, improving tools andequipment, developing new designs, prototypes,etc.
7.1.325 The Metal Handicrafts Service Centre(MHSC) at Moradabad provides common facilitiesfor silver plating, powder coating, lacquering, testingof metals and upgradation of skills of artisans. Thereare three departmental training centres, two atChennapatna and one at Tirupati (in AndhraPradesh) to provide training in lacquer ware craft.The Cane and Bamboo Development Institute at
Agartala is working on development of propertechniques for treatment and preservation of caneand bamboo handicrafts by using suitablechemicals, lacquer, etc, to protect them frominsects, fungus, etc. Other organisations likeCentral/State corporations, apex societies andvoluntary organisations are provided financialassistance to provide training in various crafts to (i)increase the production base of those crafts withhigh market demand, (ii) upgradation of skills, and(iii) to revive languishing crafts. An ApprenticeshipTraining Scheme is being implemented and around2,500 trainees are provided training by mastercraftsmen.
7.1.326 The Scheme of Market Meets has beenmodified to have a better and meaningful interactionwith artisans, NGOs, State Governments, exportersand traders. Marketing inputs are provided throughlocal level marketing workshops, national levelmelas, product promotion programmes, craftbazaars, local fairs and festivals, mini-handicraftexpos and national expos. Ample opportunities areprovided to artisans to market their products directlyto customers and get remunerative prices.
7.1.327 Under the scheme of Setting up UrbanHaats, 18 Urban Haats were to be set up during theNinth Plan period. So far, eight haats at Agra,Ahmedabad, Bhubaneshwar, Ranchi, Karnal,Jammu, Tirupati and Kolkata have been approved.This programme would be continued during theTenth Plan period and haats would be set up at primemarket locations and places of tourist interest.
7.1.328 Export promotion efforts of the office ofDevelopment Commissioner (Handicrafts) andExport Promotion Council for Handicrafts (EPCH)include participation in international fairs, organisingbuyer-seller meets and sponsoring Sales/Technicalcum Study teams to various countries.
7.1.329 Exports from handicrafts generally includescraft items of zari and zari goods, art metal ware,wood ware, hand printed textiles and scarves andembroidered and crocheted goods. Exports ofhandicrafts during the Ninth Plan period were tothe tune of Rs. 41,470 crore. During 2001-02, Rs.10,610 crore worth of handicrafts exports wereachieved and for the Tenth Plan a target of Rs.95,000 crore has been kept, indicating a growth of

TENTH FIVE YEAR PLAN 2002-07
720
over 23 per cent. Targets for estimated productionand employment for 2006-07, the terminal year ofthe Tenth Plan, are given in Annexure 7.1.4.
7.1.330 As a comprehensive database forhandicrafts is not available, the figures of productionand employment in handicrafts are derived from thefigures of handicraft exports. There is an urgentneed to strengthen the database for handicraft unitsand prepare a reporting mechanism/estimates forthe production and employment of handicrafts.
7.1.331 During 2001-02, a new scheme titledAmbedkar Hastshilp Vikas Yojana (AHVY) waslaunched with the following aim:
• Empowerment of artisans by making themactive entrepreneurs - cum - primarystakeholders in the process of developmentand bringing them to a visible platform for easyaccess to domestic and overseas markets.
• Effective collective participation of all membersinvolved in the production and marketingprocess for optimal growth in human resources,production, business and income.
• Organisation of artisans into community-basedenterprises, e.g., self-help groups /cooperativesocieties, etc.
7.1.332 Social security and welfare of artisans isanother area which is being given special attention.Schemes like workshed-cum-housing, healthpackage for artisans, group insurance, etc, arebeing implemented, which would also be continuedin the Tenth Plan period. A zero-based budgetingexercise has been carried out for the handicraftsand out of 27 schemes in the Ninth Plan period,only eight schemes would be taken up in the TenthPlan period. Most of the schemes have beenmerged, regrouped and two schemes have beenweeded out.
7.1.333 To give a boost to the handlooms andhandicrafts sector, a new model for marketing theirproducts has been envisaged in the Tenth Plan. Aweb-based marketing of VSI products has beenproposed to be taken up.
Tenth Plan Initiatives• To enhance India's share of handicrafts in
global market• Presentation of cultural heritage through
documentation and R&D• Adoption of integrated artisan centric
approach
FOOD PROCESSING INDUSTRIES
7.1.334 The Ministry of Food Processing Industriesis looking after the food processing industries andimplementing policies and plans relating to thesector. The food processing sector includes sub-sectors like grain processing, fruits and vegetableproducts, milk products, meat and dairy products,fish and fish processing, beverages, aerated drinks,etc. The food processing industry has been identified
Proposed Model for Marketing of VSI Products
• Web site to be created by marketing companywith stake holders like KVIC, DC(Handicrafts),Cooperatives, CAPART, NABARD, SIDBI,SBE, EXIM Bank and private sectormarketing/manufacturing organisations likeTatas, Hindustan Lever, Britannia, Amul,Wipro, Reliance, Zandu, Himalaya, etc.
• Common brand building programme forbrands like Indian Handicrafts, Sarvodaya,Khadi, etc. would be taken up. The websitewill describe the product and give detailsabout its specifications, geographical location,specialities, values etc. along withphotographs. This will be supported by a brick-and-mortar model of distribution.
• Depots, warehouses would be set up to sellproducts being marketed on the website andcustomers can make purchases online witha click of the mouse.
• The website would also help in design andethnic value presentation, collection andcollation of systematic product specifications,branding of products, information aboutexhibitions, expos, melas, buyer-seller meets,etc.
• Sales outlets of KVIC, KVIBs, ApexCooperative Societies, State Handlooms,Handicrafts Development Corporations,CAPART associates, private sectororganisations, exporters, etc, could be usedfor selling VSI products.

INDUSTRY
721
as a sunrise industry which can play a significantrole in increasing value addition in agricultural andhorticultural produce, diversification andcommercialisation of agriculture, reduction inwastage of horticulture produce by increasing theprocessing level, generating new employment andenhancing export earnings. The performance of thesector during the Ninth Plan period and proposedtargets for the Tenth Plan and figures relating tooutlays and expenditure are given in Annexure 7.1.4and Annexure 7.1.5.
7.1.335 Rice milling, processing of pulses andproduction of wheat flour and other wheat productsare the main activities in the grain processing sector.The Rice Milling Industries Regulation Act, 1958,has been repealed and no licence is required forthe manufacture of rice products. Nearly 12.5 mt ofwheat is converted into various wheat productsannually and the country has 820 functioning rollerflour mills with an installed capacity of 19.5 mt. Theproduction of bakery products is estimated to be inexcess of 37 lakh tonnes. The organised sectorproduces 65 per cent of breads and biscuits, whichaccount for 82 per cent of the total bakery products.Besides these, soft drinks, beer and alcoholic drinksare also a part of the food processing industry. ThePost Harvest Technology Centre at the IndianInstitute of Technology (IIT), Kharagpur, has coursesand conducts short term training programmes onHome Scale Food Processing and PreservationTechniques and Processing of Minor Millet.
7.1.336 India is the world's leading milk producingcountry and milk production is expected to touch81 mt in 2000-01 from 78 mt in 1999-2000. Indiaranks second in the production of fruits andvegetables. While in countries like Brazil, about 80per cent of the fruits and vegetables are processed,in India only 2 per cent of horticultural produce isbeing processed. About 30 per cent of is wasteddue to the lack of post-harvest processing facilities,cold storages and cold chains. This sector has vastpotential for increasing production, exports andemployment.
7.1.337 The schemes and programmes beingimplemented by the Ministry of Food ProcessingIndustries include development of infrastructuralfacilities, setting up/expansion/modernisation offood processing industries, meat processing,
poultry and egg processing etc. Schemes for fishprocessing include strengthening of traditionalfish processing, utilisation of low-value fish tomake value-added products, etc. The Ministryalso provides financial assistance for genericadvertisements, strengthening of backwardlinkages, setting up of cold storages, refrigeratedvans, etc.
7.1.338 Further, special emphasis is being laid onsupporting research and developmental activitiesfor food processing. Funds are being provided fordevelopment of traditional foods, new products,processes and packaging materials, utilisation ofby-products, etc. Financial assistance is providedto universities/technical colleges/research institutesto take up specific R&D projects. The Ministry hassponsored projects on gamma irradiation,development of standards for packaging of picklesin flexible materials, mushroom based extrudedfoods, etc. Financial assistance is being providedto human resource development institutions forcreating infrastructural facilities, laboratories, pilotplants, running of courses, etc.
7.1.339 The existing infrastructural facilities forfood processing industries are inadequate and needupgradation and modernisation. Facilities for qualitytesting and certification are not up to the standardsrequired for meeting the demands of the domesticas well as the highly competitive export markets. Inview of this, a number of Food Parks have beensanctioned and taken up by State/promotionalorganisations. During the Ninth Plan period, 27 FoodParks have been sanctioned and work on most ofthe sites is under completion at various stages. Inthe Tenth Plan, more Food Parks are proposed tobe created and corrective measures will be takenbased on the experience gained by the implementingorganisations.
Tenth Plan Initiatives• Promotion of investment, exports and
employment• Infrastructure and institution building• Promotion of new technologies; cluster
development approach• To increase food processing level to 10 per
cent in the Tenth Plan period from the presentlevel of 2 per cent

TENTH FIVE YEAR PLAN 2002-07
722
7.1.340 A draft National Food Processing Policyhas been formulated which envisages the creationof an enabling environment, a Development Fundfor Food Processing, a Food Processing Authority,infrastructural development and linkages at the farmlevel, etc. An approach paper on the proposedProcessed Food Development Act has beencirculated to various organisations for theircomments. All these efforts are aimed atharmonisation of the various laws for the foodprocessing industries sector and to bring all the lawsunder one authority. The Finance Minister hasannounced the constitution of Group of Ministers(GOM) for the purpose of ending the multiplicity ofregulations in food standards and the preparationof a modern integrated food law, harmonisation ofquality standards and setting up of an independentregulatory authority etc.
7.1.341 The Food Products Order (FPO), 1955,attempts to provide hygienic and quality foodproducts to the consumers. It is mandatory for allmanufacturers of fruits and vegetable products toobtain an FPO licence and to ensure good qualityproducts manufactured under hygienic conditions.The FPO is being amended at the instance of theCentral Fruit Products Advisory Committee, whichhas representatives of the Government, CentralFood Technology and Research Institute (CFTRI),Bureau of Indian Standards (BIS), Fruit andVegetable Processors Industry.
7.1.342 Codex Alimentarius Commission is aninternational body constituted by the Food andAgriculture Organisation (FAO) and World HealthOrganisation (WHO) to help in developing standardsfor food manufacturing and international trade bybringing together scientists, technical experts,Government bodies, consumers and industryrepresentatives. Codex standards are usedworldwide for ensuring safety and quality of food,for international trade negotiations as well as forsettling of disputes related to food processing. Amonitoring cell has been set up in the Ministry ofFood Processing Industries for dissemination ofinformation on Codex standards. Under the HACCPquality assurance system, which is based on thefood safety system, the Ministry provides grants upto 50 per cent (subject to a ceiling of Rs. 10 lakh),towards the cost of implementation of HACCP, Total
Quality Management (TQM) and obtaining ISO 9000certification, etc.
7.1.343 To enhance India's share in exports fromfood processing industries, there is an urgent needto adopt Codex standards. Domestic industry mayface practical difficulties initially in adopting thesestringent standards due to the non-availability ofhigh quality testing laboratories and standard rawmaterials and the prevalence of obsoletetechnology, etc. However, it would be useful for theindustry to focus on attaining the Codex standardsas early as possible.
7.1.344 The North Eastern Regional AgriculturalMarketing Corporation Ltd (NERAMAC) marketsfood products as well as other agro-based products.The administrative control of NERAMAC has beentransferred to the Department for the Developmentof the North East.
7.1.345 Under the zero-based budgeting exercise,the number of schemes under the Ministry of FoodProcessing Industries have been reduced from 24in the Ninth Plan to six in the Tenth Plan.
7.1.346 A study by NCAER commissioned by theMinistry points out that the growth in employmentin the food processing sector is likely to be 1.25 percent per annum during the Tenth Plan periodassuming a 6 per cent GDP growth. However, ifGDP growth is at 8 per cent per annum, theemployment in the sector is likely to increase 2.61per cent per annum. The estimated employmentas in 2001-02 is 7.55 million persons which is likelyto go up to 8.6 million persons at the end of theTenth Plan (assuming a 8 per cent GDP growth). Itis also estimated that the indirect employmentgeneration in the sector is 2.38 times the directemployment.
7.1.347 Statement showing the details of export ofprocessed food items during between 1996-97 and2001-02 (target) is given in Annexure 7.1.4.
THE PATH AHEAD
7.1.348 Taking into consideration the higherpotential for growth in the unorganised sector,mainly VSI and food processing sectors, in terms
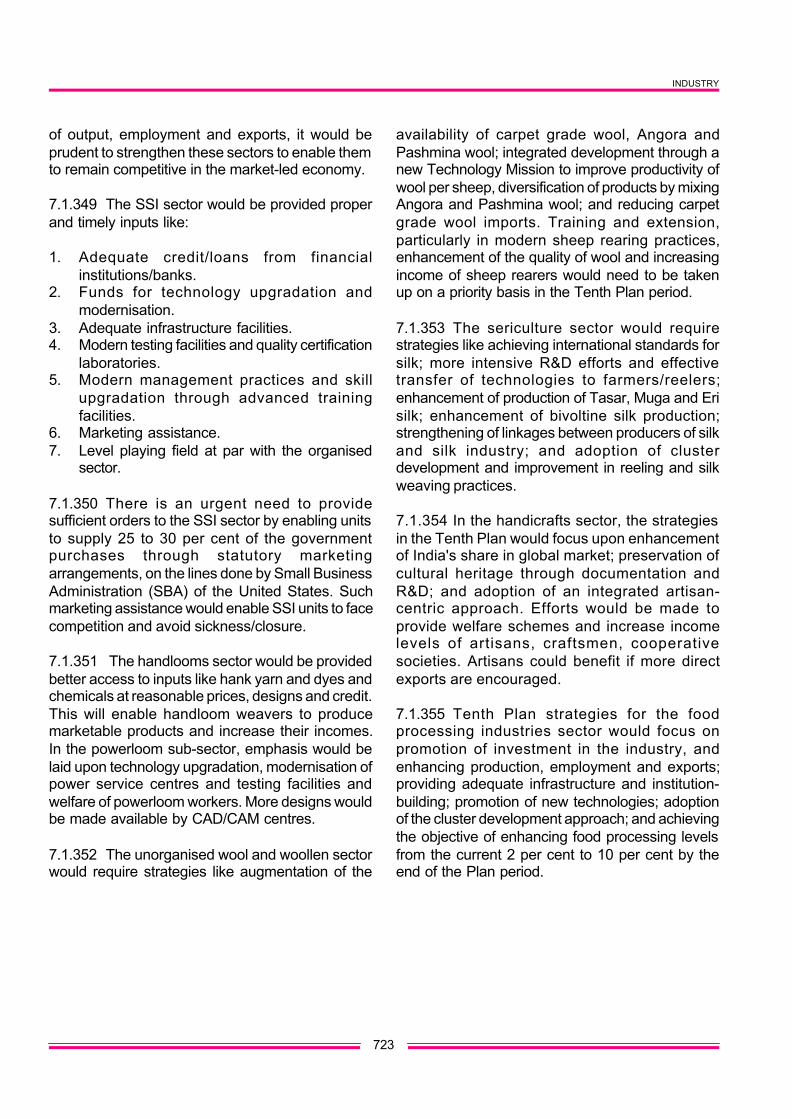
INDUSTRY
723
of output, employment and exports, it would beprudent to strengthen these sectors to enable themto remain competitive in the market-led economy.
7.1.349 The SSI sector would be provided properand timely inputs like:
1. Adequate credit/loans from financialinstitutions/banks.
2. Funds for technology upgradation andmodernisation.
3. Adequate infrastructure facilities.4. Modern testing facilities and quality certification
laboratories.5. Modern management practices and skill
upgradation through advanced trainingfacilities.
6. Marketing assistance.7. Level playing field at par with the organised
sector.
7.1.350 There is an urgent need to providesufficient orders to the SSI sector by enabling unitsto supply 25 to 30 per cent of the governmentpurchases through statutory marketingarrangements, on the lines done by Small BusinessAdministration (SBA) of the United States. Suchmarketing assistance would enable SSI units to facecompetition and avoid sickness/closure.
7.1.351 The handlooms sector would be providedbetter access to inputs like hank yarn and dyes andchemicals at reasonable prices, designs and credit.This will enable handloom weavers to producemarketable products and increase their incomes.In the powerloom sub-sector, emphasis would belaid upon technology upgradation, modernisation ofpower service centres and testing facilities andwelfare of powerloom workers. More designs wouldbe made available by CAD/CAM centres.
7.1.352 The unorganised wool and woollen sectorwould require strategies like augmentation of the
availability of carpet grade wool, Angora andPashmina wool; integrated development through anew Technology Mission to improve productivity ofwool per sheep, diversification of products by mixingAngora and Pashmina wool; and reducing carpetgrade wool imports. Training and extension,particularly in modern sheep rearing practices,enhancement of the quality of wool and increasingincome of sheep rearers would need to be takenup on a priority basis in the Tenth Plan period.
7.1.353 The sericulture sector would requirestrategies like achieving international standards forsilk; more intensive R&D efforts and effectivetransfer of technologies to farmers/reelers;enhancement of production of Tasar, Muga and Erisilk; enhancement of bivoltine silk production;strengthening of linkages between producers of silkand silk industry; and adoption of clusterdevelopment and improvement in reeling and silkweaving practices.
7.1.354 In the handicrafts sector, the strategiesin the Tenth Plan would focus upon enhancementof India's share in global market; preservation ofcultural heritage through documentation andR&D; and adoption of an integrated artisan-centric approach. Efforts would be made toprovide welfare schemes and increase incomelevels of artisans, craftsmen, cooperativesocieties. Artisans could benefit if more directexports are encouraged.
7.1.355 Tenth Plan strategies for the foodprocessing industries sector would focus onpromotion of investment in the industry, andenhancing production, employment and exports;providing adequate infrastructure and institution-building; promotion of new technologies; adoptionof the cluster development approach; and achievingthe objective of enhancing food processing levelsfrom the current 2 per cent to 10 per cent by theend of the Plan period.

TENTH FIVE YEAR PLAN 2002-07
724
Annexure 7.1.1
Ministry/Department-wise Ninth Plan Expenditure and Outlays for Tenth Plan (2002-07)
(in Rs. Crore)
Ninth Plan Ninth Plan Tenth PlanAnticipated
ExpenditureSl. Name of the Ministry/Deptt. Outlay BS Outlay BS Outlay BS IEBR
No. 1 2 3 4 5 6 7
A. Industry and Minerals
1 Steel 16,232.50 85.50 6,490.70 66.00 11,044.00 65.00 10,979.00
2 Fertilisers 11,013.00 1,043.00 4,177.54 993.79 5,900.00 1,050.00 4,850.00
3 Petroleum and Natural Gas (I&M) 8,386.02 0.00 1,378.26 0.00 7,614.81 0.00 7,614.81
4 ChemIcals & Petrochemicals. 6,760.00 171.00 3,406.44 187.02 3,044.00 300.00 2,744.00
5 Industrial Policy and Promotion * 1,923.75 1,923.75 1,482.00 1,482.00 2,000.00 2,000.00 0.00
6 Heavy Industry 2,027.00 551.00 1,923.74 916.75 2,063.00 700.00 1,363.00
7 Commerce 893.75 859.75 1,049.52 1,049.52 4,562.00 4,547.00 15.00
8 & Public Enterprises …. … 8.00 8.00 50.00 50.00 0.00
9 Textiles ( I&M) 331.01 331.01 652.09 616.22 1,980.00 1,900.00 80.00
10 # Consumer Affairs 28.37 28.37 30.36 27.02 55.00 55.00 0.00
11& Company Affairs …. …. 50.00 50.00 0.00
12 Food and Public Distribution (I&M) 1.80 1.80 15.88 15.88 10.20 10.20 0.00
13 Surface Transport 161.80 161.80 166.03 120.03 1,047.86 242.86 805.00( Shipbuilding and Ship repairSector)-M/o Shipping
14 Atomic Energy (I&M) 1,218.50 850.00 905.04 815.00 3,350.00 2,270.00 1,080.00
15 Bio technology 6.30 6.30 3.61 3.61 30.00 30.00 0.00
16 DSIR 21.50 21.50 11.00 11.00 25.00 25.00 0.00
17 Ocean Development 84.23 84.23 72.03 72.03 100.00 100.00 0.00
18 $ Supply 22.19 22.19 31.11 31.11
Total 49,111.72 6,141.20 21,803.35 6,414.98 43,128.81 13,598.00 29,530.81
B. VSI Sector
1 SSI & ARI 3,330.00 2,813.00 2,855.00 2,295.00 3,449.00 3,065.00 384.00
2 Textile ( VSI) 1,083.50 1,083.50 1,203.00 1,203.00 1,600.00 1,600.00 0.00
3 Food Processing Ind. 235.04 235.04 195.68 195.68 650.00 650.00 0.00
* NRF Expenditure up to 2001-02 was included@ Outlays of National Test House are not included ( NTH was transferred from D/o Supply on 17.8.2001 to D/o Consumer
Affairs)$ Deptt. of Supply merged in Deptt of Commerce in 2001-02, the expenditure pertain to DGS&D and NTH# The expenditure of NTH is not included as it was transferred in 2001-02 after allocation under D/ Supply& No outlays in Ninth Plan

INDUSTRY
725
Annexure 7.1.2
Initiatives in the Tenth Five Year Plan ( 2002-07)
1 Apparel Parks for Exports
Name of the scheme Apparel Parks for Exports
Concerned Ministry Ministry of Textiles
Nature of Scheme New centrally sponsored scheme - already approved
Objective of the Scheme The scheme is in pursuance of the National Textile Policy, 2000 to give a focusedthrust to setting up of apparel manufacturing units of international standards atpotential growth centres and to give fillip to domestic production to meet competitionfrom imports and to enhance exports so as to achieve the target of $ 50 billion by2010 as envisaged in the Policy.
Details of the Scheme 1. The State Government or an undertaking sponsored by the Government (thedesignated agency) will provide land free of cost for establishing the park ofsufficient size. (The size of an apparel park may be approximately 150-250acres, but this can be determined on the merits of a case)
2. The location of the apparel park will be such that it is conducive to theestablishment of state-of-the-art manufacturing units, has access to ports,airports, rail heads etc., easy availability of raw materials and has a reasonablelevel of infrastructural facilities.
3. The designated agency will provide infrastructural facilities like power, water,roads, (including approach roads to the park), sewerage and drainage,telecommunications and other facilities for the park. Such facilities shall be ofhigh standards to ensure that the units established in the park are able to functionefficiently.
Funding pattern under The Central Government will give as a grant to the tune of 75 per cent of the capitalthe scheme expenditure incurred by the State Government on the infrastructural facilities of the
Apparel Park, while the remaining 25 per cent will be borne by the agency. Thisgrant shall be limited to a maximum of Rs.10 crore.
The Central Government will also provide a maximum grant of Rs.5 crore for settingup of an effluent treatment plant, crèche/s, any multi-purpose centre/hall formarketing /display etc. (These facilities are required to enable the units to meetemerging labour/social/environmental standards).
The Central Government will provide a grant up to 50 per cent of the cost of anytraining facility created in the park subject to a maximum of Rs.2 crore.
Project Approval Committee The project proposals shall be considered by a Project Approval Committee (PAC)headed by Secretary (Textiles). Other members will be Advisor (Industry) in thePlanning Commission, AS&FA, Ministry of Textiles, Textile Commissioner, arepresentative from Department of Expenditure with Joint Secretary, Ministry ofTextiles as Member Secretary. The Committee will approve and sanction theproposals received from the agencies for the establishment of 'parks' to monitortheir implementation and to evaluate the progress and achievement under thescheme.
The agencies seeking assistance under the scheme will prepare feasibility studiesand detailed project reports. Only those proposals which are approved will be eligiblefor assistance under the scheme. While approving the proposal, care will be takento see that the location of the park is conducive to meet the objectives of the scheme.

TENTH FIVE YEAR PLAN 2002-07
726
While considering the proposals, due weightage shall be given to the potential of thepark for attracting investments, employment generation and upgradation in technology.
Extent of Central Assistance The Central assistance for each park would be limited to Rs.17 crore (i.e.Rs.10crore for infrastructure facilities, Rs.5 crore for ETP and common facilities andRs.2 crore for training facilities
Budgetary provision 2002-03 -Rs.10 crore, Tenth Plan - Rs.75 crore
Status of Implementation Five Apparel Parks have been approved in principle by the Planning Commission.These are located at (i) Surat (Gujarat) (ii) Tronica City (Uttar Pradesh)(iii) Visakhapatnam (Andhra Pradesh) (iv) Bangalore (Karnataka) and(v) Thiruvananthapuram (Kerala) . In a recent Cabinet decision, the limit of fiveapparel parks has been removed.

INDUSTRY
727
2 Textile Centres infrastructure development scheme (TCIDS)
Name of the scheme Textile Centres Infrastructure Development Scheme (TCIDS)
Concerned Ministry Ministry of Textiles
Nature of Scheme Centrally sponsored scheme - already approved
Objective of the Scheme To improve infrastructure facilities at potential textile growth centres and, therefore,removing bottlenecks in exports.
Details of the Scheme • The scheme shall cover investments, which are in the nature of exigencies,which could not be foreseen as part of the annual Plan scheme proposals.Broadly, the scheme covers investments required for quicker and strategicremoval of bottlenecks and for general export facilitation. The investment mustreflect its linkage to export promotion.
• Balancing investment may, inter alia, relate to construction of roads, provisionof testing facilities etc.
• Under the scheme funds can be given to Central/State Government Departments/Public Sector Undertakings/other Central/State Government's agencies/recognised industrial association or entrepreneur bodies for development ofinfrastructure directly benefiting the textile units. The fund would not be availablefor individual production units.
Funding pattern under The Central assistance will be generally limited to 50 per cent of the criticalthe scheme components of the project subject to a maximum of Rs. 20 crore for a particular
centre.
Project Approval Committee An Empowered Committee under the chairmanship of Secretary (Textiles). Acommittee would be duly constituted by the concerned State/UT / agency/PSU toimplement and monitor each of the approved proposals. A representative of Ministryof Textiles would be included in the Committee.
Performance evaluation The performance of the TCIDS scheme as a whole will be evaluated annually by anappropriate authority or agency to be decided by the Empowered Committee of theScheme.
Extent of Central assistance A maximum of Rs. 20 crore for a particular centre.
Budgetary provision Annual Plan 2002-03-Rs.15 croreTenth Five Year Plan - Rs. 75 crore
Status of Implementation The proposal has not been received
Annexure 7.1.2 Contd...

TENTH FIVE YEAR PLAN 2002-07
728
3 Technology Upgradation Funds Scheme (TUFS)
Name of the scheme Technology Upgradation Fund Scheme (TUFS)
Concerned Ministry Ministry of Textiles
Nature of scheme Central sector scheme - Already approved
Objectives of the Scheme To provide a focal point for modernisation efforts through technology upgradation inthe industry.
Details of the scheme This scheme was introduced in 1999 as an instrument for modernisation andtechnology upgradation and covers all sub-sectors of textiles like spinning, weaving,knitting, processing, garment making, cotton ginning and pressing and the jutesector. Under the TUF Scheme, generally only new machinery will be permitted.However, machinery with a minimum residual life of 10 years, import of secondhand machinery will also be eligible subject to maximum expired life (vintage) of 5years as reckoned from the year of manufacture. Investment in land and factorybuilding including renovation, effluent treatment plant (ETP), water treatment plantfor captive industrial use, captive power generation will be eligible to the extentnecessary for the plant and equipment to be installed for technology upgradationand the total of such investments will not normally exceed 25 per cent of the totalinvestment in such plant and machinery.
Funding Pattern under The main feature of the TUF Scheme would be a 5 per cent reimbursement on thethe Scheme interest actually charged by the identified financial institutions on the sanctioned
projects. To modify the scheme to make it more investor-friendly, the weaving sectorcan now avail either 5 per cent interest reimbursement or 12 per cent of upfrontcredit linked capital subsidy for SSI units.
Project Approval Committee The Inter-ministerial Steering Committee under the chairmanship of Secretary(Textiles) lays down norms for monitoring and appraisal mechanism for effectiveimplementation of the scheme on a macro-basis. Secretaries of the Department ofExpenditure, Ministry of Commerce, Ministry of Industry, Department of Banking,Addl. Secretary and Financial Adviser, Ministry of Textiles, Adviser, PlanningCommission, Textile Commissioner, Jute Commissioner, Deputy Governor, RBI,Chairmen of IDBI, SIDBI, IFCI are the prominent members of the Committee inaddition to other trade bodies.
Budgetary Provision 2002-03 - Rs.250 croreTenth Plan - Rs.1,270 crore.
Status of implementation Up to 31 May 2002, 1,654 textile units have applied for loans amounting toRs.14,365.26 crore. Out of this, 1,419 proposals for loans amounting to Rs.5,226.59crore had been sanctioned and an amount of Rs. 3,607.37 crore has already beendisbursed for 1,134 units. The fund requirement under this scheme has essentiallybeen from the mill sector with SSI sector having only limited access to benefits ofthe scheme.
Annexure 7.1.2 Contd...
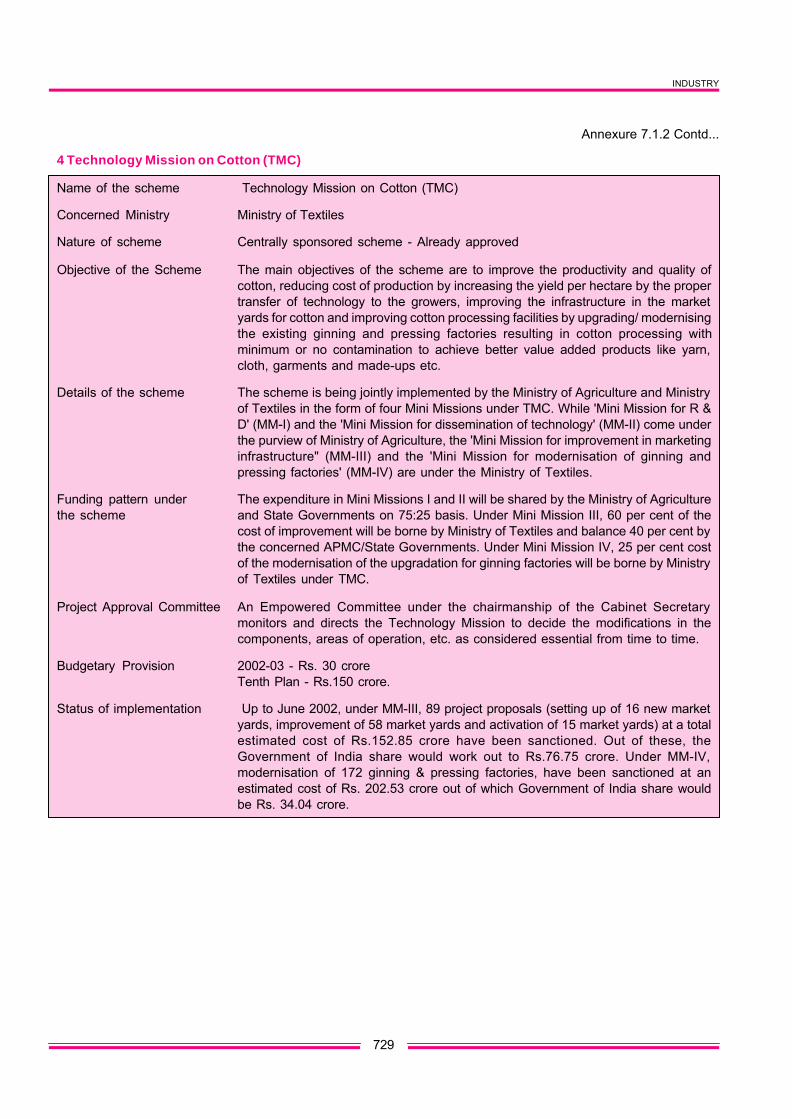
INDUSTRY
729
4 Technology Mission on Cotton (TMC)
Name of the scheme Technology Mission on Cotton (TMC)
Concerned Ministry Ministry of Textiles
Nature of scheme Centrally sponsored scheme - Already approved
Objective of the Scheme The main objectives of the scheme are to improve the productivity and quality ofcotton, reducing cost of production by increasing the yield per hectare by the propertransfer of technology to the growers, improving the infrastructure in the marketyards for cotton and improving cotton processing facilities by upgrading/ modernisingthe existing ginning and pressing factories resulting in cotton processing withminimum or no contamination to achieve better value added products like yarn,cloth, garments and made-ups etc.
Details of the scheme The scheme is being jointly implemented by the Ministry of Agriculture and Ministryof Textiles in the form of four Mini Missions under TMC. While 'Mini Mission for R &D' (MM-I) and the 'Mini Mission for dissemination of technology' (MM-II) come underthe purview of Ministry of Agriculture, the 'Mini Mission for improvement in marketinginfrastructure" (MM-III) and the 'Mini Mission for modernisation of ginning andpressing factories' (MM-IV) are under the Ministry of Textiles.
Funding pattern under The expenditure in Mini Missions I and II will be shared by the Ministry of Agriculturethe scheme and State Governments on 75:25 basis. Under Mini Mission III, 60 per cent of the
cost of improvement will be borne by Ministry of Textiles and balance 40 per cent bythe concerned APMC/State Governments. Under Mini Mission IV, 25 per cent costof the modernisation of the upgradation for ginning factories will be borne by Ministryof Textiles under TMC.
Project Approval Committee An Empowered Committee under the chairmanship of the Cabinet Secretarymonitors and directs the Technology Mission to decide the modifications in thecomponents, areas of operation, etc. as considered essential from time to time.
Budgetary Provision 2002-03 - Rs. 30 croreTenth Plan - Rs.150 crore.
Status of implementation Up to June 2002, under MM-III, 89 project proposals (setting up of 16 new marketyards, improvement of 58 market yards and activation of 15 market yards) at a totalestimated cost of Rs.152.85 crore have been sanctioned. Out of these, theGovernment of India share would work out to Rs.76.75 crore. Under MM-IV,modernisation of 172 ginning & pressing factories, have been sanctioned at anestimated cost of Rs. 202.53 crore out of which Government of India share wouldbe Rs. 34.04 crore.
Annexure 7.1.2 Contd...
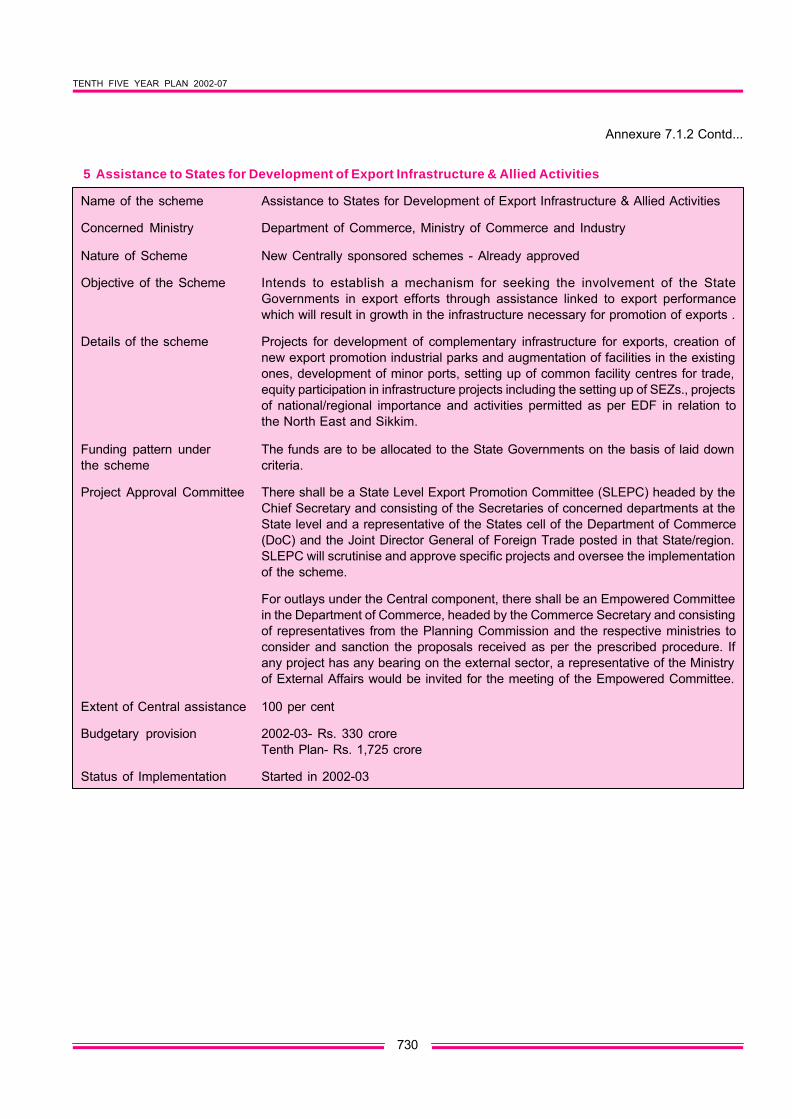
TENTH FIVE YEAR PLAN 2002-07
730
5 Assistance to States for Development of Export Infrastructure & Allied Activities
Name of the scheme Assistance to States for Development of Export Infrastructure & Allied Activities
Concerned Ministry Department of Commerce, Ministry of Commerce and Industry
Nature of Scheme New Centrally sponsored schemes - Already approved
Objective of the Scheme Intends to establish a mechanism for seeking the involvement of the StateGovernments in export efforts through assistance linked to export performancewhich will result in growth in the infrastructure necessary for promotion of exports .
Details of the scheme Projects for development of complementary infrastructure for exports, creation ofnew export promotion industrial parks and augmentation of facilities in the existingones, development of minor ports, setting up of common facility centres for trade,equity participation in infrastructure projects including the setting up of SEZs., projectsof national/regional importance and activities permitted as per EDF in relation tothe North East and Sikkim.
Funding pattern under The funds are to be allocated to the State Governments on the basis of laid downthe scheme criteria.
Project Approval Committee There shall be a State Level Export Promotion Committee (SLEPC) headed by theChief Secretary and consisting of the Secretaries of concerned departments at theState level and a representative of the States cell of the Department of Commerce(DoC) and the Joint Director General of Foreign Trade posted in that State/region.SLEPC will scrutinise and approve specific projects and oversee the implementationof the scheme.
For outlays under the Central component, there shall be an Empowered Committeein the Department of Commerce, headed by the Commerce Secretary and consistingof representatives from the Planning Commission and the respective ministries toconsider and sanction the proposals received as per the prescribed procedure. Ifany project has any bearing on the external sector, a representative of the Ministryof External Affairs would be invited for the meeting of the Empowered Committee.
Extent of Central assistance 100 per cent
Budgetary provision 2002-03- Rs. 330 croreTenth Plan- Rs. 1,725 crore
Status of Implementation Started in 2002-03
Annexure 7.1.2 Contd...

INDUSTRY
731
6 Market Access Initiative
Name of the scheme Market Access Initiative
Concerned Ministry Department of Commerce, Ministry of Commerce and Industries
Nature of the scheme Central sector scheme - Already approved
Objective of the scheme To put in place an instrument which is not only WTO compatible but would alsomitigate the negative effects of various handicaps faced by the exporters vis-à-vistheir counterparts in the competing countries.
Details of the scheme To identify the priorities of research relevant to trade and commerce and sponsorresearch studies consistent with the priorities, arranging for wide disseminationand discussions on the result of such studies, trade promotion organisation formarket survey/studies, assist exporters and export trade councils in participation ininternational departmental store promotion programmes, promotion of India, Indianproducts and Indian brands. State Government efforts in carrying out export potentialsurvey of the State for identified product groups would also be supplemented.
Funding pattern under Central assistance ranging from 50 to 80 per centthe scheme
Project Approval Committee Empowered Committed under Secretary (Commerce)
Budgetary provision Annual Plan 2002-03 Rs. 42 croreTenth Five Year Plan - Rs. 552 crore
Status of implementation Initiated in 2001-02
Annexure 7.1.2 Contd...

TENTH FIVE YEAR PLAN 2002-07
732
7 Research and Development in Automotive Industry
Name of the scheme Research and Development in Automotive Industry
Concerned Ministry Department of Heavy Industry, Ministry of Heavy Industries and Public Enterprises
Nature of the scheme Central Scheme
Objective of the scheme To strengthen the testing and certification facilities.
Details of the scheme 1. The proposed scheme envisages partnership with industry.
2. In addition to the upgradation of existing facilities, two new facilities - one in thenorth and one in the south - are proposed to be set up in the Tenth Plan formeeting the requirements of safety and environmental regulations.
3. Besides, some new testing facilities are required to be set up. These include'life cycle testing' and 'world class test track' which are not there at present.
4. Increased allocation from the existing automotive cess fund created for R&D ofautomotive industry would be made available.
Project Approval Committee SFC / EFC as applicable
Budgetary provision Annual Plan 2002-03 Rs. 25 croreTenth Five Year Plan - Rs. 150 crore
Status of implementation Existing automotive research institution like the Automotive Research Associationof India (ARAI) are being supported.
Annexure 7.1.2 Contd...

INDUSTRY
733
8 Industrial Cluster Development Scheme
Name of the scheme Industrial Cluster Development Scheme
Concerned ministry Deptt. of Industrial Policy and Promotion , Ministry of Commerce and Industry
Nature of the scheme Central sector scheme
Objective of the scheme • The scheme aims to pick the industrial clusters with high growth potential. Themain emphasis of the scheme would be on the making strategic interventions toconvert static local efficiency into dynamic competitiveness.
• The scheme makes it possible to have intervention for each cluster to be need-based and specifically designed.
Details of the scheme 1 The main emphasis of the scheme would be on making strategic interventionsto convert static local efficiency into dynamic competitiveness by:
• creating conducive conditions for the development of inter-firm cooperation;
• promote innovation and collective learning by creating a suitable customisedinfrastructure support and service network;
• promoting product design and development through focused support andassociation with specific R&D Institutions;
• assist the units in developing/setting up common facilities like raw materialdepots, testing facilities, design centres, information hub, etc.
• assisting appropriate technology transfer, information sharing and qualityimprovement.
2 The services offered would also include organisation of fairs and exportpromotion, client rating, waste management, pollution control, qualitycertifications, product promotion, product testing, information sharing, trainingand HRD, product innovation and R&D support.
Funding pattern under Share of Central Government will be limited to 75 per cent of the project cost. Thethe scheme remaining 25 per cent have to be financed by other stakeholders of the respective
cluster. The release of funds shall be project-specific. The central assistance wouldbe in the form of grant.
Project Approval Committee An Apex Committee, chaired by Secretary (IP&P) is proposed for scrutinising theproposals received and giving approvals on a project to project basis.
Budgetary provision Annual Plan 2002-03 Rs. 45 croreTenth Five Year Plan - Rs. 675 crore
Status of Implementation Process of approval of competent authority has been initiated
Annexure 7.1.2 Contd...

TENTH FIVE YEAR PLAN 2002-07
734
9 Pharmaceutical Research & Development - support Fund
Name of the scheme Pharmaceutical Research & Development - support Fund
Concerned Ministry Department of Science and technology
Nature of Scheme Central Scheme
Objective of the Scheme Encouraging R&D in the pharmaceutical sector in a manner compatible with thecountry's needs and with particular focus on diseases endemic or relevant to Indiaby creating an environment conducive to channelising a higher level of investmentinto R&D in pharmaceuticals in India.
Details of the Scheme In order to strengthen the pharmaceutical industry's research and developmentcapabilities and to identify the support required by Indian pharmaceutical companiesto undertake domestic R&D, a Committee was set up in 1999 by the Department ofChemicals and Petrochemicals (DCPC) by the name of Pharmaceutical Researchand Development Committee (PRDC) under the Chairmanship of Director General,CSIR.
The PRDC had recommended inter-alia ,the setting up of a Drug and PharmaceuticalResearch and Development Support Fund (PRDSF).
M/o Finance had agreed to allocate Rs.150 crore as a Plan Fund for creation ofR&D fund.
Funding pattern under Corpus fund -Rs 150 crore - to be allocatedthe Scheme
Budgetary provision Corpus fund -Rs 150 crore - ( one time) to be allocated
Annexure 7.1.2 Contd...

INDUSTRY
735
10 Agri Export Zones (AEZ)
Name of the scheme Agri Export Zones
Concerned ministry Ministry of Commerce
Nature of the scheme The scheme was announced in Export import Policy 2002-07
Objective of the scheme To promote agricultural export from the country and remunerative returns to thefarming community in a sustained manner.
AEZs are being set up for end-to-end development for export of specific productsfrom a geographically contiguous area.
Details of the scheme 1. AEZs are identified by the State Government, who evolve a comprehensivepackage of services provided by all State Government agencies, State agricultureuniversities and all institutions and agencies of the Union Government forintensive delivery in these zones.
2. Such services which are managed and coordinated by State Government includea provision of pre/post harvest treatment and operations, plant protection,processing, packaging, storage and related R&D etc.
3. The Agricultural Products Export Development Authority (APEDA) willsupplement, within its schemes and provisions, efforts of State Governmentsfor facilitating such exports.
Funding pattern under the Central scheme - Financial support to APEDAscheme / Extent ofassistance Units in AEZ would be entitled for all the facilities available for exports of goods in
terms of provisions of the respective schemes.
Annexure 7.1.2 Contd...

TENTH FIVE YEAR PLAN 2002-07
736
11 Leather Industry Development Programme
Name of the scheme Leather Industry Development Programme
Concerned ministry Department of Industrial Policy and Promotion
Nature of the scheme Central sector scheme
Objective of the scheme Modernisation of all sub-segments of leather industry, attract FDI , environmentalmission and manpower development and development of leather clusters.
Funding pattern under the 100 per cent Central sector schemescheme / Extent ofassistance
Annexure 7.1.2 Contd...

INDUSTRY
737
Annexure 7.1.3
Performance of the VSI Sector Production, Employment and Exports
S. Sub-Sector (Scheme) Unit Ninth Plan Actual Achievement Tenth Plan TargetNo. 1997-98 1998-99 1999-00 2000-01 2001-02 2002-03 2006-07
(Anti.) TerminalYear
(A) Production
1 Small Scale Industries. Rs. crore 462641 520650 572887 609024 690522 624363 1401939
2 Coir Fibre 000 Tonnes 296 334 356 364 375 390 435
3 Handloom Cloth Mill. Sq m 7603 6792 7352 7506 7579 7875 10000
4 Powerloom Cloth Mill. Sq m 20951 20690 23187 23803 25273 24360 132821
5 Raw Silk M. Tonnes 15236 15544 15214 15857 18395 21900 26450
6 Handicrafts Rs. Crore 10411 12175 13916 16340 18677 22765 47204
7 Raw Wool Mill kg. 44.74 45.50 46.50 47.00 47.50 47.50 49.00
(B) Employment
1 Small Scale Industries Million persons 16.7 17.2 17.9 18.6 19.3 20.1 23.7
2 Coir Industries Million persons 0.43 0.46 0.48 0.53 0.54 0.56 0.65
3 Handlooms Million persons 12.4 12.4 12.4 12.4 12.4 12.0 12.0
4 Powerlooms Million persons 3.8 4.0 4.1 4.2 4.2 4.25 4.5
5 Sericulture Million persons 6.057 6.141 6.364 5.400 5.573 5.825 6.003
6 Handicrafts Million persons 5.292 5.424 5.560 5.700 5.841 6.010 6.770
7 Wool Develop. Million persons 0.3 0.5 0.5 0.5 0.5 0.5 0.7(unorganised sector)
(C) Exports
1 Small Scale Industries Rs. Crore 44437 49481 53975 59978 65000 73600 126000
2 Coir Industries Rs. Crore 239 292 303 314 325 450 700
3 Handlooms Rs. Crore 1855 2008 1892 2127 2200 2950 4500
4 Powerlooms Rs. Crore 8418 8915 9915 10200 11000 NA NA
5 Silk Rs. Crore 1060 1251 1756 2480 2530 2650 4050
6 Handicrafts Rs. Crore 6458 7072 8060 9271 10610 12732 17000

TENTH FIVE YEAR PLAN 2002-07
738
Annexure 7.1.4
Physical Performance of the Food Processing Industries (FPI) Sectorproduction and Exports
S. Sub-Sector (Scheme) Unit Ninth Plan Actual Achievement Tenth Plan TargetNo. 1997-98 1998-99 1999-00 2000-01 2001-02 2002-03 2006-07
(Anti.) TerminalYear
Production
1 Fruit & Vegetable Lakh tonne 9.10 9.40 9.80 9.90 10.50 11.00 14.00Products
2 Milk Products Lakh tonne 720 750 780 801 849 890 1100
3 Soft Drinks Mill. Bottles 4920 5670 230 6450 6600 6800 7500
4 Fish Products Mill. Tonne 5.39 5.26 5.65 5.95 6.29 6.50 7.00
5 Meat & Meat Products 000' Tonne 3600 3809 3875 3950 4200 4350 4900
6 Eggs Mill Nos. 30000 31000 32000 32500 33000 33445 35500
7 Broiler Mill. Nos. 450 500 550 600 700 750 950
Exports
1 Fruit & Vegetable Rs. crore 762 706 994 1346 1265 1340 2050
2 Animal Products Rs. crore 908.30 851.70 905.00 1637.10 1440.00 1600 2300
3 Rice (both Basmati Rs. crore 3370.00 6279.40 3125.80 2943.30 3500.00 3850 5500& non-Basmati)
4 Marine Products Rs. crore 4697.00 4626.80 5116.60 6443.80 5800.00 6000 8350
5 Walnuts Rs. crore 56.40 68.90 60.50 109.90 85.00 90 135

INDUSTRY
739
Annexure 7.1.5
Plan Outlay/Expenditure of VSI and EPI Sector (Sub-Sector/Scheme-Wise)
(Rs. crore)
S. Sub-Sector Ninth Plan Actual Expenditure Ninth Tenth PlanNo (Scheme) 1997-98 1998-99 1999-00 2000-01 2001-02 Plan 2002-03 2002-07
(anti.) (Expdr) TerminalYear
I M/o SSI
1 SIDO 132.53 203.29 251.41 279.55 407.00 1273.78 313.00 1975.00
2 NSIC (Budgetary Support) 132.17 148.00 161.90 149.35 111.33 702.75 117.00 564.00( 28.50) (27.30) (27.12) (34.21) (25.42) (142.55) (32.00) (180.00)
3 Other Schemes 0.76 1.14 1.84 0.69 0.58 5.01 5.00 45.00
Total: SSI (IEBR) 265.46 352.43 415.15 429.59 518.91 1981.54 435.00 2584.00(103.67) (120.70) (134.78) (115.14) (85.91) (560.20) (85.00) (384.00)
II M/o A&RI
1 Coir Industry 12.48 8.88 12.50 13.84 11.60 59.30 18.00 115.00
2 PMRY 94.83 135.46 189.46 200.98 193.50 814.23 169.00 750.00
Total: A&RI 107.21 143.34 201.96 214.82 205.10 873.53 188.00 865.00
III M/o Textiles (VSI)
1 Handlooms 97.00 81.50 80.92 101.45 111.11 471.98 140.00 625.00
2 Powerlooms 2.89 3.63 9.32 6.87 6.00 28.71 12.00 60.00
3 Handicraft 45.97 49.20 52.81 66.66 87.00 301.64 88.00 425.00
4 Sericulture 49.48 63.49 67.00 78.19 116.08 374.24 87.50 450.00
5 Wool & Woolen Dev. 5.09 4.52 5.06 3.76 8.00 26.43 8.00 40.00
Total Textiles (VSI) 200.43 202.34 215.11 256.93 328.19 1203.00 415.50 1600.00
IV M/o FPI
1 Food Processing Industries 22.87 30.00 37.79 50.00 55.00 195.66 75.00 650.00

TENTH FIVE YEAR PLAN 2002-07
740