chapter 9 nitrogen - unm digital repository
TRANSCRIPT
Chapter 9 NITROGEN
Contents NITROGEN ........................................................................................................................ 1 9.1 Introduction ................................................................................................................... 1 9.2 The nitrogen cycle......................................................................................................... 2 9.3 Nitrogen isotope fractionation ...................................................................................... 3
9.3.1 Nitrogen fixation .................................................................................................... 4 9.3.2 Mineralization ........................................................................................................ 4 9.3.3 Assimilation ........................................................................................................... 5 9.3.5 Denitrification ........................................................................................................ 6
9.4 The characteristic δ15N value of various materials ....................................................... 6 9.4.1 Plants and soil ........................................................................................................ 7 9.4.2 Other terrestrial reservoirs ..................................................................................... 8 • Fertilizers ................................................................................................................. 8 • Rain .......................................................................................................................... 8 • Fossil fuels ............................................................................................................... 8 9.4.3 Nitrogen in the oceans ........................................................................................... 9
9.5 Nitrogen isotope ratios in animals .............................................................................. 11 9.5.1 Compound specific studies .................................................................................. 13
References ......................................................................................................................... 15
Sharp, Z.D. Principles of Stable Isotope Geochemistry
9-1
Chapter 9 NITROGEN 9.1 Introduction Nitrogen is a trace phase in rocks and the major component of air. Estimates for the distribution of nitrogen between the major reservoirs ‒ rocks, air, terrestrial ‒ vary wildly, with some compilations suggesting that 98% of nitrogen is hosted by rocks (Hübner, 1986) to about ½ in rocks, with the remainder in the atmosphere (McDonough and Sun, 1995)1. Regardless of this discrepancy, there is roughly equal amounts of organic matter-hosted nitrogen in plants, soil, and the ocean (Hübner, 1986). Although minor in abundance, organic nitrogen is of tremendous importance, because almost all nitrogen isotope fractionation occurs by metabolic or metabolically-related processes. Over the eons, this has led to a range of nitrogen isotope compositions that span well over 100‰. Even in the mantle, the substantial range of δ15N values has been attributed by some to subduction of surficial material (Beaumont and Robert, 1999; Marty and Dauphas, 2003). The two stable isotopes of nitrogen are 14N and 15N, with a 14N/15N ratio in air of 272. Because the ratio is constant, air nitrogen is taken as our standard given by2
( )( )15 14
1515 14
AIR
N Nδ N (‰ vs AIR) 1 1000
N Nsample
= −
9.1.
A reference gas of N2 from air is easily made by removing CO2 and water from air cryogenically, and removing O2 by reaction with copper oxide. The remaining gas will be N2 with a trace of Ar. Solid reference samples are also available from NIST and the IAEA (Appendix 1). Nitrogen is a trace element in rocks, and because nitrogen isotope ratios have traditionally been some of the most difficult to measure, nitrogen isotope geochemistry has not been thoroughly embraced by the geochemical community. Analytically, nitrogen is difficult to transfer in vacuum lines, because it cannot simply be frozen with liquid nitrogen. Instead, it needs to be adsorbed on zeolite-filled cold fingers. Also, at low nitrogen levels, even small leaks will compromise an analysis. Contamination with CO will have a drastic effect on measured δ15N ratios due to the interference at mass 29 (13C16O). Many analytical problems have been eliminated with the coupling of the elemental analyzer and mass spectrometer, which allows for combustion and analysis of N-bearing compounds to be made in continuous flow mode (Bebout et al., 2007, see section 2.8.3). Nitrogen analyses of many solids can now be made rapidly and with little
1 The very high estimate for nitrogen in the mantle is not in agreement with contemporary models for how the volatile elements were delivered to a newly-forming Earth.
2 In the agricultural literature, the δ15N value is defined as ( )( )
15
1515
AIR
at % Nδ N(AIR ‰) 1 1000
at % Nsample
= −
, which
is nearly, but not quite, identical to the definition in equation 9.1.
Chapter 9. Nitrogen
9-2
effort (except at low concentrations). This has raised the status of nitrogen as an important isotopic tracer, especially for pollution studies and within the biological community. It must be stressed however, that for nitrogen dissolved in water, sophisticated wet-chemical procedures are generally required to convert the nitrogen-bearing ion ( ( )+
4NH , ( )−3NO , etc.) to a solid form suitable for analysis (Kendall, 1998),
although exciting new methods that employ bacterial denitrification have drastically simplified the procedure (Sigman et al., 2001; Coplen et al., 2004). 9.2 The nitrogen cycle Nitrogen forms a number of oxidation states from +5 ( )−
3NO to -3 ( )+4NH . A
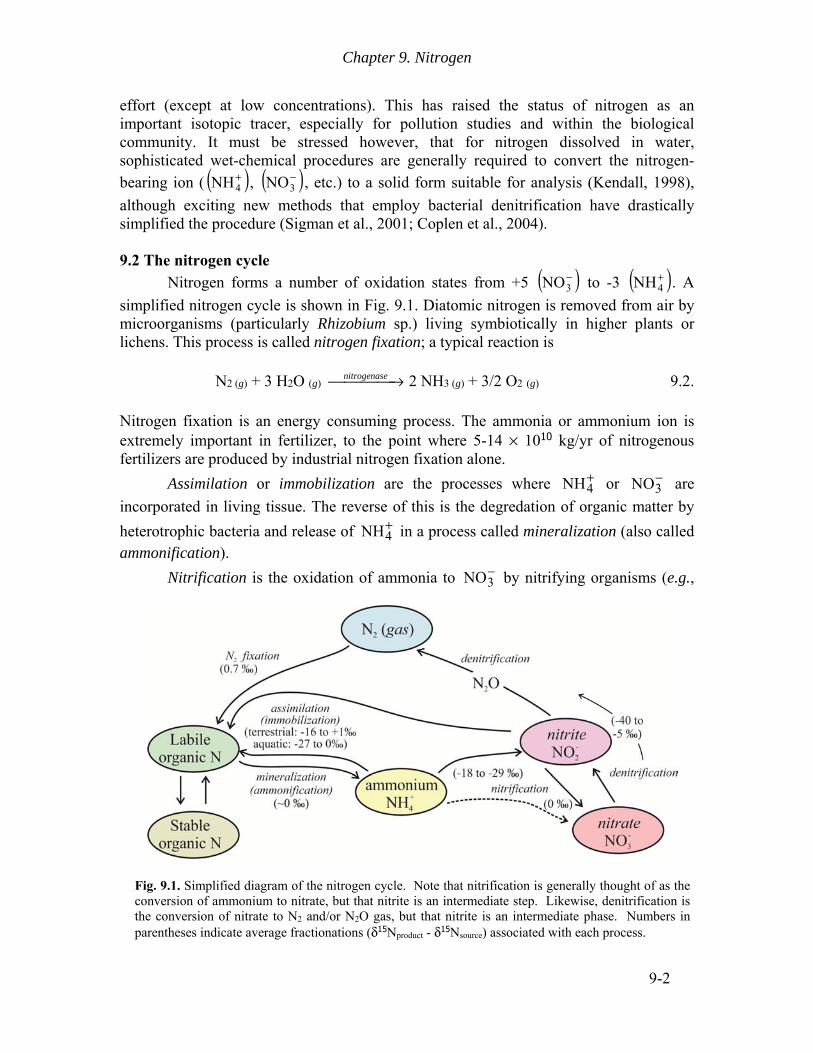
simplified nitrogen cycle is shown in Fig. 9.1. Diatomic nitrogen is removed from air by microorganisms (particularly Rhizobium sp.) living symbiotically in higher plants or lichens. This process is called nitrogen fixation; a typical reaction is N2 (g) + 3 H2O (g) nitrogenase⎯⎯⎯⎯→ 2 NH3 (g) + 3/2 O2 (g) 9.2. Nitrogen fixation is an energy consuming process. The ammonia or ammonium ion is extremely important in fertilizer, to the point where 5-14 × 1010 kg/yr of nitrogenous fertilizers are produced by industrial nitrogen fixation alone. Assimilation or immobilization are the processes where +
4NH or −3NO are
incorporated in living tissue. The reverse of this is the degredation of organic matter by heterotrophic bacteria and release of +
4NH in a process called mineralization (also called ammonification). Nitrification is the oxidation of ammonia to −
3NO by nitrifying organisms (e.g.,
Fig. 9.1. Simplified diagram of the nitrogen cycle. Note that nitrification is generally thought of as the conversion of ammonium to nitrate, but that nitrite is an intermediate step. Likewise, denitrification is the conversion of nitrate to N2 and/or N2O gas, but that nitrite is an intermediate phase. Numbers in parentheses indicate average fractionations (δ15Nproduct - δ15Nsource) associated with each process.

Sharp, Z.D. Principles of Stable Isotope Geochemistry
9-3
chemotrophic bacteria). Nitrification is the two-step process given by a first oxidation, such as Nitrosomonas, +
4NH → −2NO and a second step Nitrobacter, −
2NO → −3NO .
Oxygen comes from both H2O and O2 for this nitrification process. Nitrification is an energy-releasing process and is used by organisms as an energy source. A typical reaction sequence is (Kaplan, 1983) NH3 +3/2 O2 → HNO2 +H2O 9.3a KNO2 + ½ O2 → KNO3 9.3b. Denitrification is the process whereby −
3NO and −2NO are converted to N2O and
ultimately N2 gas by anaerobic bacteria, some fungi and aerobic bacteria. Denitrification accompanies degradation of organic matter, e.g. glucose, 5 C6H12O6 + 24 −
3NO + 24 H+ → 30 CO2 + 42 H2O + 12 N2(g) 9.4. Denitrification tends to occur in deeper layers of soil or in poorly aerated soils where p(O2) is low. In the ocean, denitrification is most active in stagnant water masses and where p(O2) is low. Correspondingly, denitrification increases with depth in the ocean. Atmospheric N2 would be exhausted in 100 million years, if it were not for denitrification processes. 9.3 Nitrogen isotope fractionation The nitrogen isotope fractionations attending the various processes shown in Fig. 9.1 are difficult to quantify because most of the transformations are metabolically driven and therefore kinetically controlled. They are not equilibrium reactions. As we have seen for biologically-mediated carbon reduction and will see in Chapter 10 for sulfate reduction, the magnitude (and even sign) of fractionation can be highly variable, depending upon the availability of nutrients and reaction rates. For example, nitrification, given by the multi-step transformation organic nitrogen → +
4NH → −2NO → −
3NO may have different isotopic fractionations associated with each step, and within each step the fractionations can be variable, depending on ambient conditions. The δ15N value of the product nitrate will be anywhere from -12 to -29‰ lighter than the ammonium from which it forms (Kendall, 1998). Nitrogen isotope fractionation occurs during the transformation from the reactant to the product. The most significant fractionation effects in the low temperature nitrogen system are going to be kinetic. Following the idea for equilibrium fractionation, we can use the α terminology, recognizing that the fractionations are not equilibrium and do not follow basic thermodynamic rules. In this form, αp-s = Rp/Rs, where R = 15N/14N and p and s are the products and the substrate source of nitrogen (e.g., Kendall, 1998). Equilibrium fractionation in stable isotope geochemistry is often reported as 1000lnα, where 1000lnαa-b is very similar to δa - δb (section 2.6). Because nitrogen isotope fractionations in nature are generally kinetically controlled, it is common to see fractionations reported using the ‘enrichment factor’ notation ε, given by

Chapter 9. Nitrogen
9-4
ε = 1000 (α-1) 9.5a. The use of an ε signifies that there is no suggestion of a reversible equilibrium process. Regardless of the subtleties that these different equations might convey, in practice they are the same. The ε and Δ values are almost identical (Kendall, 1998). The enrichment factor is also sometimes given by
δ δ
ε 1000δ 1000
p r
r
− = +
9.5b,
where δp and δr are the delta values of the product and reactant, respectively. These two definitions of ε are not identical, but very close, except when δs values are very large (e.g., in 15N-enriched tracer experiments). ε is also nearly identical to δp - δs or Δ15Nproduct
– reactant. To be consistent with the rest of this book, we will use the simple difference between the δ values of the products and reactants, in which Δ15N ≈ ε. 9.3.1 Nitrogen fixation Nitrogen fixation is generally considered as a single process in terms of isotopic fractionation, because δ15N values are measured on the product plant or bacterium, regardless of the pathway from N2 (g) to organic matter. Nitrogen isotope fractionation associated with fixation is generally small. Hoering and Ford (1960) measured fractionations (δ15Nfixed – δ15NAir) ranging from +3.7 to -2.2‰ (n = 4) and considered the average fractionation between atmospheric N2 and fixed nitrogen in organic matter to be near 0‰. A compilation by Fogel and Cifuentes (1993) ranges form -3 to +1‰; one by Hübner (1986) gives an average value of -0.7 ± 1.6‰ (Fig. 9.2). The scatter does not indicate some sort of analytical error or uncertainty, but rather that real variations in fractionation for this and all other pathways exist. 9.3.2 Mineralization The fractionation associated with the breakdown of organic matter to soil ammonium is small (Δ = 0±1‰). As pointed out by Kendall (1998), mineralization is defined by some researchers as the breakdown of organic matter and conversion to nitrate. Under such circumstances, fractionations can be large and variable, but the differences are not due to the mineralization step itself, rather the nitrification of ammonium to nitrate.
Fig. 9.2. Fractionation associated with N2 fixation. The average value is 0.72‰ (meaning that the organisms have δ15N values less than 0‰).

Sharp, Z.D. Principles of Stable Isotope Geochemistry
9-5
9.3.3 Assimilation Assimilation by microorganisms causes a strong and variable discrimination, favoring 14N (Fig. 9.3). There is no appreciable difference between assimilation of +
4NH , −2NO , and −
3NO . Higher plants show much smaller fractionations, averaging only -0.25‰ (δ15Nplant – δ15Nassimilant). A compilation of data for ammonium assimilation by aquatic algae spans a very large range between -27 to 0‰ (Fogel and Cifuentes, 1993). The wide range of delta values can be modeled in terms of kinetic processes where rates are controlled by the availability of nitrogen, enzymes responsible for NH3 fixation, and diffusion of NH3 through the cell walls. Velinsky et al. (1991) found that ammonium assimilation in anoxic waters was strongly dependent on +
4NH
concentrations. In waters with +4NH
concentrations of 40μM, the fractionation between particulate organic matter and +
4NH was modeled to be -20 to -30‰. In waters with concentrations of only 9μM, fractionations were -5 to -15‰. 9.3.4 Nitrification Nitrification is a two step process from +
4NH through −2NO and
finally −3NO (Equation 9.3). The
second part of the reaction (Equation 9.3b −
2NO → −3NO ) is quantitative,
meaning all nitrite is converted to nitrate, and so there can be no nitrogen
Fig. 9.3. Nitrogen isotope fractionation during assimilation by microorganisms. On the basis of limited data, the fractionation is similar regardless of whether ammonium, nitrate, or nitrite is the assimilant. Data from (Hübner, 1986).
Fig. 9.4. Depth profile and dissolved nitrate concentration and δ15N value in a depth profile from the eastern tropical North Pacific Ocean. As nitrate is converted to N2, the nitrate concentration decreases and its δ15N value increases, because the δ15N value of the evolved N2 gas is ~40‰ lighter. The data are modeled assuming Δ15NNO3-N2 of 30, 40 and 50‰ as shown by curves through isotope data. After Cline and Kaplan (1975).

Chapter 9. Nitrogen
9-6
isotope fractionation associated with this step. Published estimates for the fractionation of ammonium to nitrite (Equation 9.3a) range from -18 to -29‰, with the nitrite (and ultimately nitrate) having lower δ15N values than the ammonium precursor. The fractionation depends on the proportions of ammonium and nitrate after reaction. Obviously, if all ammonium is converted to nitrate in a ‘closed system’, then the δ15N value of the nitrate will be identical to that of the original ammonium reservoir. 9.3.5 Denitrification Laboratory experiments give a Δ15N N2 gas – dissolved nitrate value of -17 to -20‰. Measured fractionations from soil samples are often less, between -12 to -14‰ (e.g., Blackmer and Bremner, 1977). Mariotti et al. (1982) found the fractionation Δ15N N2O
– NO2- to range from -33‰ to -11‰. Cline and Kaplan (1975) measured the concentration and δ15N values of dissolved nitrate in a water column from the eastern tropical North Pacific Ocean. They were able to model the variations in δ15N values in terms of diffusion theory if the Δ15N N2
(gas – dissolved nitrate) value is -40‰ (Fig. 9.4). Denitrification has large isotope fractionation effects due to the ‘distillation’ of N2 gas. In shallow aquifers, N2 gas produced by denitrification can be lost by diffusion to the atmosphere. This is a classic Rayleigh fractionation process with a large coefficient of fractionation. If a large amount of N2 is produced, the nitrogen isotope composition of the remaining nitrate can change significantly. Figure 9.5 illustrates the magnitude of this effect. It also shows how we can use nitrogen isotopes to evaluate the amount of nitrate that has been removed from a system. In a contaminated aquifer, this obviously is an important tool for water quality studies. 9.4 The characteristic δ15N value of various materials Now that we have the chemistry and fractionation factors for a number of chemical transformations involving nitrogen, it should be a relatively straightforward task to make sense of the variability and range of δ15N values of the different reservoirs. For example, from Figure 9.1, it is clear that the fractionation between N2 gas and labile
Fig. 9.5. Variations in the δ15N values of dissolved nitrate and N2 gas from water wells from the Kalahari desert. The data can be modeled by Rayleigh fractionation process, with a Δ15N value between N2 gas (product) and dissolved nitrate (reactant) of -35‰. When only a small amount of nitrate remains, its δ15N value gets extremely heavy, while the sum of the N2 approaches the original nitrate value. Solid lines are instantaneous nitrate value; dashed lines are total N2 value for a given proportion of N2 produced. After Heaton (1986).
Sharp, Z.D. Principles of Stable Isotope Geochemistry
9-7
organic nitrogen is close to zero. So we should expect that nitrogen-fixing plants3 have δ15N values close to zero, and indeed, this is the case. Especially when growing in nitrate-poor soil (so that the only source of nitrogen is N2), nitrogen fixing plants have δ15N values that are within 2‰ of air (Shearer and Kohl, 1986). As shown below, we can use similar logic to explain the δ15N values of a number of different reservoirs. 9.4.1 Plants and soil Nitrogen-fixing plants have δ15N values close to zero. Other plants cannot fix N2 and instead incorporate nitrogen by assimilation of +
4NH or −3NO from soil. The δ15N
values of plants are strongly dependent on those of the soil, which are in part controlled by the plants. In order to predict the δ15N value of plants it is necessary to know the range of δ15N values of soil and the mechanisms of uptake from the soil. δ15N values of soil range from -10 to +15‰, with most soils between +2 and +5‰ (Kendall, 1998). The positive values are loosely tied to a preferential loss of 14N during decomposition of particulate nitrogen sources. Unfortunately, specific factors controlling soil δ15N values are complex and defy quantification. Even the source of extracted nitrogen are variable: tree roots preferentially assimilate soil nitrate while microorganisms tend to incorporate soil ammonium (Nadelhoffer and Fry, 1988). Nevertheless, some general guidelines can be established. • Denitrification is most intense in poorly drained or poorly oxidized soils, as nitrate-
consuming organisms become active only when oxygen levels are low. The subsequent loss of N2 gas – the product of denitrification – increases the δ15N value of any remaining nitrate (Fig. 9.5).
• Soils with abundant leaf litter tend to have lower δ15N values than in surrounding regions with less foliage. An explanation for this trend is that the preferential uptake of 14N by plants results in higher δ15N values of the soil. In heavily vegetated areas, the 15N-depleted plant material is returned to the soil as leaf litter.
• Anthropogenic activity can strongly affect the δ15N of soil. In one study, the average δ15N value of cultivated soils are 5.0±3.5‰ compared to 6.8±6.4‰ for uncultivated soils, due to addition of nitrogenous fertilizers with low δ15N values (Hübner, 1986). In some soils, there are variations with depth, while in others, no such correlation is found. Factors include drainage, total N-content of soil and precipitation rate.
In nitrogen-limited soils, the δ15N value of plants is close to that of the soils, as no discrimination is possible. In nutrient-rich soils, the fractionation between plants and dissolved inorganic nitrogen can be several per mil. Trees tend to have slightly lower δ15N values than soil due to the negative fractionation during assimilation. Heterotrophic fungi, on the other hand, may have δ15N values higher than those of the soil (Högberg, 1997). Overall, tree leaves have a range of δ15N values of -8 to +3‰ (Peterson and Fry, 1987). There is a strong global-scale variation in the δ15N values of soils that is related to the mean annual precipitation and mean annual temperature (Fig. 2 in Amundson et al.,
3 Nitrogen fixing plants are those that are able to assimilate N2 gas directly. In fact, nitrogen fixation is a symbiotic relationship with bacteria that live on the roots, but the isotopic effect is the same, nevertheless.

Chapter 9. Nitrogen
9-8
2003), although the trends cannot be explained in terms of only a few simple processes. 9.4.2 Other terrestrial reservoirs • Fertilizers Fertilizers generally have a δ15N range of -4 to +4‰, the low values related to an atmospheric N2 source. Organic fertilizers range from +6 to +30‰, related to the processes occurring in animal wastes (Kendall, 1998). The δ15N value of animals increases by ~3‰ at each higher trophic level (see section 9.5). The most important factor for this increase is the excretion of isotopically light urine. Therefore, there is an enrichment in 15N from plants to animals. Animal waste gets further enriched in 15N by subsequent volatilization of isotopically light ammonia. • Rain The sources of nitrogen in rain are volatilization of ammonia, nitrification and denitrification of soils and anthropogenic sources. Hoering first measured the δ15N values of +
4NH and −3NO in rain from the roof of the chemistry laboratory at the University of
Arkansas, USA (Hoering, 1957). He found that, although there was significant variability in the δ15N value of each component (δ15N +
4NH = -0.1 to 9.0‰; δ15N −3NO = -7.2 to
+3.4), the fractionation between the two phases could be explained in terms of a kinetic fractionation between ammonium and nitrate. The range of δ15N values of nitrate in rain has since been found to cover a range of ~ -10 to +9‰. Heaton (1986) gives an average of -5‰ (for South Africa) while a compilation by Kendall (1998) ranges from ~-3 to +9‰, with a strong mode at 0 to +2‰. In general, ammonium is lighter than nitrate by several per mil. The measured fractionation between +
4NH and −3NO in rain is dependent
on the concentrations of the ions in precipitation. Variations from site to site are huge, because inputs can be so different. Pure air has δ15N values of 3NH and 2NO of -10.0 ± 2.6‰ and -9.3 ± 3.5‰, respectively (Hübner, 1986). The effects of mixing different reservoirs are clear when just a few ‘endmember’ sources are considered. Barnyard-derived 3NH has a δ15N value of +25‰, NOx from automobile exhaust is ~ +3.7‰, and fumaroles from southern Kamchatka have δ15N values of (NH4)2SO4 as low as -31‰ (Hübner, 1986). Freyer (1978) measured δ15N values of +
4NH in rain water of -12.0 ±
1.9‰ from Jülich Germany. Published values of +4NH in rain water range from -9.7 to
+6.9. Not surprisingly, variations can be large between storms and even within individual storms, because the sources of nitrogen – fossil-fuel burning, ocean denitrification, etc. – themselves have a large range of δ15N values. Peterson and Fry’s average estimate (1987) for precipitation are -18 to +8‰ for +
4NH and -15 to +3‰ for −3NO .
• Fossil fuels Peat and coal average +0.8‰ with a standard deviation of 1.6‰, ranging up to 6.3‰ (Hoering, 1955; Wada et al., 1975; Stiehl and Lehmann, 1980), similar to modern peats and bogs. Crude oils are generally in the range of +1.0 to +6.7‰, while natural gas

Sharp, Z.D. Principles of Stable Isotope Geochemistry
9-9
has far more variation (-10.5 to 14.4‰) (Hoering and Moore, 1958). The δ15N value of natural gas changes quite drastically with the distance of migration from its source. An example from north Germany shows a systematic increase from -8.7 to +18.0‰ as migration distances increase, likely due to Rayleigh fractionation attending denitrification (Stahl, 1977). 9.4.3 Nitrogen in the oceans The fact that the δ15N values of most ocean materials are positive is easily explained in terms of the nitrogen cycle in the ocean. Nitrogen is one of the most important limiting nutrients in the ocean, so that productivity is limited by availability of metabolically available nitrogen4. The major inputs are river runoff, rain and fixation of molecular N2 by marine blue-green algae (Fig. 9.6). Outputs or sinks of nitrogen in the ocean include burial in sediment and denitrification. We assume that the nitrogen cycle is balanced, with inputs equaling outputs, but how variable this is over time is not known. The fluxes of each exchange path are shown in Fig. 9.6. It is clear that the average values are not known well enough to quantify. Even more intractable is an attempt to quantify isotopic mass balance because the δ15N values of each source are quite variable, as are the fractionations accompanying transfer from one reservoir to another.
4 Nitrogen and phosphorus are strongly correlated with a nitrogen/phosphate ratio of ~15. Both nutrients become exhausted at the same time. The constant ratio is probably tied to a biochemical feedback mechanism. If dissolved nitrate levels become low, nitrogen-fixing blue green algae will produce nitrate, restoring the biochemical ratio. If nitrate values become high, non-nitrifying organisms would have an advantage, consuming nitrate disproportionately, again driving the ratio back to its balanced state.
Fig. 9.6. Nitrogen system for the oceans. Sources and sinks (and their fluxes in 1012 gm-N2/yr) are shown as normal and italicized text, respectively. δ15N values of ocean materials are in bold text. Data from following sources: (Kaplan, 1983; Macko et al., 1984; Berner and Berner, 1987; Peterson and Fry, 1987; Fogel and Cifuentes, 1993).

Chapter 9. Nitrogen
9-10
In spite of the uncertainties, several gross features are apparent. The major fractionation in the global ocean cycle occurs during denitrification, with N2 being strongly depleted in 15N relative to its source. All other sources and sinks are associated with rather small fractionation effects (see Fig. 9.1). Clearly loss of light N2 back to the atmosphere will result in a positive average δ15N value of the ocean. The positive δ15N value of organic material in sediments is retained during subduction, seen both in rocks (Bebout and Fogel, 1992) and volcanic fumaroles sourced in oceanic sediments (Fischer et al., 2002).
There is significant spatial variation in the δ15N value of dissolved nitrate. In the Eastern North Pacific Ocean, δ15N values range from +6.5‰ in the Antarctic
Diamonds
MORB
Soils organic matter
Plants
Felsic rocks
Petroleum
Natural gas
NH4
NO3
Animals
Volcanic gases
-20 -10 0 10 20δ15N (‰ vs AIR)
Atmosphere N2
NO3-
NH4+
Meteorites to 50‰
Fertilizer (inorganic)to 30‰ (organic)
Deep ocean nitrateOcean POM
increasing trophiclevel
Fig. 9.7. Average δ15N values for common reservoirs.
Sharp, Z.D. Principles of Stable Isotope Geochemistry
9-11
intermediate water mass (at depth), up to +18.8‰ in the active denitrification zone (Cline and Kaplan, 1975).
Overall, average δ15N values of various reservoirs are shown in Fig. 9.7. These data are a compilation from many sources. There are always unusual samples that have higher or lower values (Coplen et al., 2002), but the figure should serve as a guide for average ranges that are commonly found for each material.
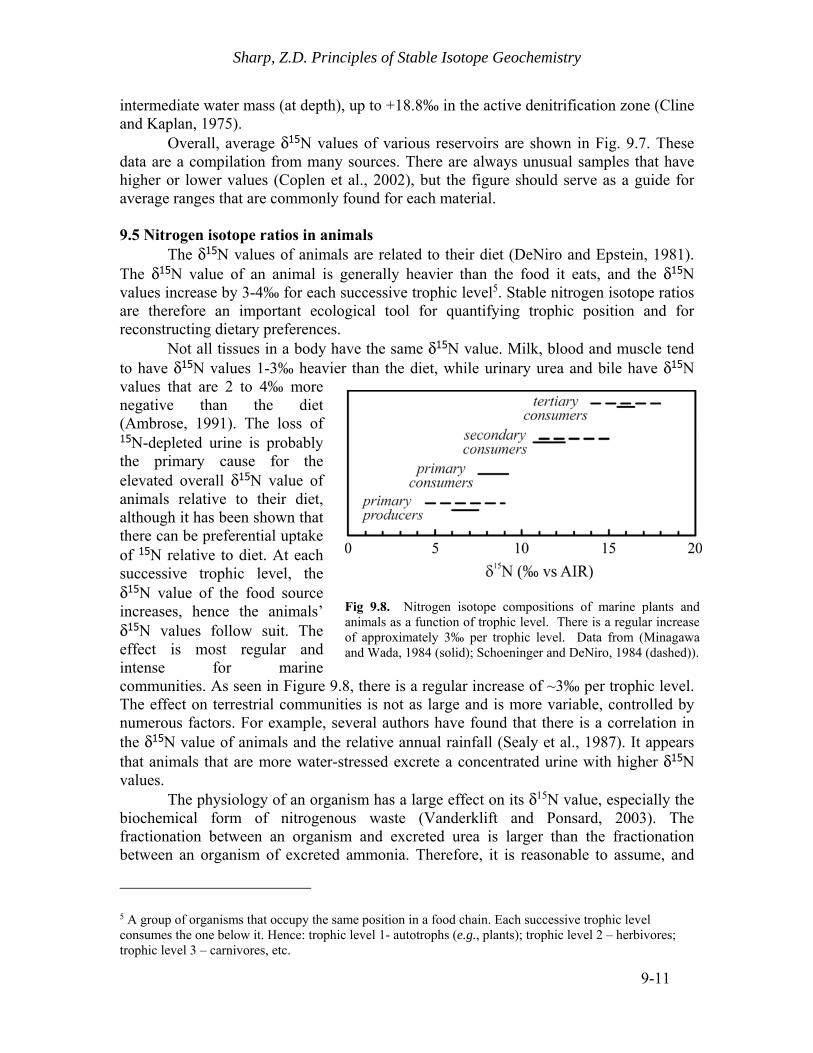
9.5 Nitrogen isotope ratios in animals The δ15N values of animals are related to their diet (DeNiro and Epstein, 1981). The δ15N value of an animal is generally heavier than the food it eats, and the δ15N values increase by 3-4‰ for each successive trophic level5. Stable nitrogen isotope ratios are therefore an important ecological tool for quantifying trophic position and for reconstructing dietary preferences. Not all tissues in a body have the same δ15N value. Milk, blood and muscle tend to have δ15N values 1-3‰ heavier than the diet, while urinary urea and bile have δ15N values that are 2 to 4‰ more negative than the diet (Ambrose, 1991). The loss of 15N-depleted urine is probably the primary cause for the elevated overall δ15N value of animals relative to their diet, although it has been shown that there can be preferential uptake of 15N relative to diet. At each successive trophic level, the δ15N value of the food source increases, hence the animals’ δ15N values follow suit. The effect is most regular and intense for marine communities. As seen in Figure 9.8, there is a regular increase of ~3‰ per trophic level. The effect on terrestrial communities is not as large and is more variable, controlled by numerous factors. For example, several authors have found that there is a correlation in the δ15N value of animals and the relative annual rainfall (Sealy et al., 1987). It appears that animals that are more water-stressed excrete a concentrated urine with higher δ15N values. The physiology of an organism has a large effect on its δ15N value, especially the biochemical form of nitrogenous waste (Vanderklift and Ponsard, 2003). The fractionation between an organism and excreted urea is larger than the fractionation between an organism of excreted ammonia. Therefore, it is reasonable to assume, and
5 A group of organisms that occupy the same position in a food chain. Each successive trophic level consumes the one below it. Hence: trophic level 1- autotrophs (e.g., plants); trophic level 2 – herbivores; trophic level 3 – carnivores, etc.
Fig 9.8. Nitrogen isotope compositions of marine plants and animals as a function of trophic level. There is a regular increase of approximately 3‰ per trophic level. Data from (Minagawa and Wada, 1984 (solid); Schoeninger and DeNiro, 1984 (dashed)).

Chapter 9. Nitrogen
9-12
supported by measurements of natural samples, that urea-excreting organisms have a larger trophic level effect than those which primarily excrete ammonia. The combination of δ15N and δ13C values have been used in well over 100 publications to investigate trophic ecology of birds and mammals (Kelly, 2000). Combined δ15N-δ13C values from prehistoric bone collagen are a valuable tool for distinguishing different populations and constraining a communities’ diet. To a first degree, we can state that the δ15N values are controlled by the trophic level of diet and the δ13C values are controlled by the relative dietary proportions of C3 and C4 plants. Communities subsisting mainly on an animal diet will inherit the δ13C value of their prey, perhaps with a subtle offset towards higher values (DeNiro and Epstein, 1978). Figure 9.9 shows a compilation for a number of North American Native American communities. The combined carbon and nitrogen isotope values are easily explained in terms of assumed diet, and place constraints on diet in cases where ambiguities exist. For example, the Western Anasazi have the lowest δ15N values and highest δ13C values. It can be concluded that they had a maize-based diet6 with only minor animal consumption (Martin, 1999). The Southern Ontario communities (Schwarcz et al., 1985) had a diet consisting of C3 plants and animals that consumed C3 plants. The elevated δ15N values relative to the Anasazi community indicate at least a partial animal diet. The highest δ15N
6 Maize is a C4 plant. See Chapter 7 for a more thorough discussion of C3-C4 plants.
Fig. 9.9. δ13C and δ15N values of bone collagen from Native American communities. a) Western Anasazi, S. Utah (A.D. 1 - 1300) b) Nantucket Island, Mass. (A.D. 1000 - 1600) c) N.W. coast Haida and Tlingit salmon fishers (historic) d) S. California coastal (A.D. 1400 - 1800) e) Plains Arikara, South Dakota (A.D. 1650 - 1733) f) S. Ontario, Middle Woodland period (A.D. 1 - 400) g) Modern Chicago, USA.
See text for details. Compilation and references from Martin (1999) and Schoeller et al. (1986).

Sharp, Z.D. Principles of Stable Isotope Geochemistry
9-13
values are found in the Northwest coastal communities that consisted in large part on salmon (Schoeninger and Moore, 1992). Salmon are at a high trophic level, and this is reflected in the isotope data of the salmon-eating community. The effect of trophic level on the δ15N values of animals has been used for a large number of studies addressing different questions. The breadth of this field is illustrated in a study by Fogel et al. (1997) where the recognition that a nursing infant is technically at a higher trophic level than her mother was used to determine the duration of nursing by
prehistoric people. Fig. 9.10a shows the δ15N values of the fingernails of a mother and her infant from birth through weaning. The δ15N value of the infant rises after birth to a value ~3‰ higher than the mother. Once the child is weaned, the diet of the two individuals is more-or-less the same, and the higher δ15N value of the infant is soon lost. This concept was then used for two ancient populations, where the δ15N values of individuals were measured as a function of age (Fig. 9.10b). In both populations, weaning occurs between one and two years. 9.5.1 Compound specific studies The isotopic variations seen in individual amino acids are far larger and provide significantly more information than data from bulk samples alone. For example, some amino acids, such as glutamic acid, show an 8‰ increase in δ15N value with each higher trophic level. In contrast, phenylalanine shown only a 0.4‰ increase with each trophic level (Chikaraishi et al., 2014). This is because the transamination/deamination processes
Fig. 9.10. a: δ15N value of nursing mother and infant. Infant reaches a 3‰ higher δ15N value, which disappears after weaning. b: Native American infants from pre- and post-historic sites, USA. Note different x-axis. After Fogel et al. (1997).

Chapter 9. Nitrogen
9-14
of glutamic acid always result in cleaving of the carbon-nitrogen bonds, whereas phenylalanine is converted to tyrosine without cleaving of these bonds. The result is that glutamic acid records the increase in δ15N values of the host (fractionation), whereas, the δ15N value of phenylalanine cannot change as it moves up into higher trophic levels. The effect is clearly seen in Fig. 9.11. Two food webs were studied: one marine and the other terrestrial. The marine food web has a constant δ15N value for phenylalanine and a regular increase in the δ15N of glutamic acid with increasing trophic level. The terrestrial foodweb has a 1-1 correlation between phenylalanine and glutamic acid for each trophic level and a distinct jump to higher glutamic acid values as trophic levels increase. The marine samples suggest a linear food chain with each successive trophic level having essentially identical δ15Nphenylalanine values, whereas the large range of δ15Nphenylalanine values in the terrestrial foodweb suggest that individual species within a given trophic level exploit specific and different food resources (Chikaraishi et al., 2014). The overall δ15N values of an organism are the sum of all nitrogen-bearing compounds, whereas different amino acids single out processes that are unique to their different chemical behavior during metabolism.
Fig. 9.11. Crossplot of the δ15N values of isolated amino acids phenylalanine and glutamic acid from a marine (left) and terrestrial (right) food web. The δ15N values of each food web show an ~8‰ jump with trophic level (from crosses to circles to triangles, squares, etc.). The marine food web has a constant phenylalanine value suggesting a linear and common food chain, whereas individuals in the terrestrial food web have distinct phenylalanine values indicative of distinct food sources at each successive trophic level. After Chikaraishi et al. (2014).

Sharp, Z.D. Principles of Stable Isotope Geochemistry
9-15
References Ambrose, S.H. (1991) Effects of diet, climate and physiology on nitrogen isotope
abundances in terrestrial foodwebs. Biological Abstracts Vol. 91, Iss. 2, Ref. 20363. 18, 293-317.
Amundson, R., Austin, A.T., Schuur, E.A.G., Yoo, K., Matzek, V., Kendall, C., Uebersax, A., Brenner, D. and Baisden, W.T. (2003) Global patterns of the isotopic composition of soil and plant nitrogen. Biological Abstracts Vol. 95, Iss. 3, Ref. 30880. 17, doi:10.1029/2002GB00190.
Beaumont, V. and Robert, F. (1999) Nitrogen isotope ratios of kerogens in Precambrian cherts: a record of the evolution of atmosphere chemistry? Precambrian Research 96, 63-82.
Bebout, G.E. and Fogel, M.L. (1992) Nitrogen-isotope compositions of metasedimentary rocks in the Catalina Schist, California: Implications for metamorphic devolatilization history. Geochimica et Cosmochimica Acta 56, 2839-2849.
Bebout, G.E., Idleman, B.D., Li, L. and Hilkert, A. (2007) Isotope-ratio-monitoring gas chromatography methods for high-precision isotopic analysis of nanomole quantities of silicate nitrogen. Chemical Geology 240, 1-10.
Berner, E.K. and Berner, R.A. (1987) The Global Water Cycle. Prentice-Hall, Inc., Englewood Cliffs, NJ.
Blackmer, A.M. and Bremner, J.M. (1977) N-isotope discrimination in denitrification of nitrate in soils. Soil Biology & Biochemistry 9, 73-77.
Chikaraishi, Y., Steffan, S.A., Ogawa, N.O., Ishikawa, N.F., Sasaki, Y., Tsuchiya, M. and Ohkouchi, N. (2014) High-resolution food webs based on nitrogen isotopic composition of amino acids. Ecology and Evolution 4, 2423-2449.
Cline, J.D. and Kaplan, I.R. (1975) Isotopic fractionation of dissolved nitrate during denitrification in the eastern tropical North Pacific Ocean. Marine Chemistry 3, 271-299.
Coplen, T.B., Hopple, J.A., Böhlke, J.K., Peiser, H.S., Rieder, S.E., Krouse, H.R., Rosman, K.J.R., Ding, T., Vocke, R.D.J., Révész, K.M., Lamberty, A., Taylor, P. and DeBièvre, P. (2002) Compilation of Minimum and Maximum Isotope Ratios of Selected Elements in Naturally Occurring Terrestrial Materials and Reagents. United States Geological Survey, Reston, p. 98.
Coplen, T.B., Bohlke, J.K. and Casciotti, K.L. (2004) Using dual-bacterial denitrification to improve δ15N determinations of nitrates containing mass-independent 17O. Rapid Communications in Mass Spectrometry 18, 245-250.
DeNiro, M.J. and Epstein, S. (1978) Influence of diet on the distribution of carbon isotopes in animals. Geochimica et Cosmochimica Acta. 42, 495-506.
DeNiro, M.J. and Epstein, S. (1981) Influence of diet on the distribution of nitrogen isotopes in animals. Geochimica et Cosmochimica Acta 45, 341-351.
Fischer, T.P., Hilton, D.R., Zimmer, M.M., Shaw, A.M., Sharp, Z.D. and Walker, J.A. (2002) Contrasting nitrogen isotope behavior along the Central America margin: implications for the nitrogen balance of the Earth. Science 297, 1154-1157.
Fogel, M.L. and Cifuentes, L.A. (1993) Isotope fractionation during primary production, in: Engel, M.H., Macko, S.A. (Eds.), Organic Geochemistry. Plenum Press, New

Chapter 9. Nitrogen
9-16
York, pp. 73-98. Fogel, M.L., Tuross, N., Johnson, B.J. and Miller, G.H. (1997) Biogeochemical record of
ancient humans. Organic Geochemistry 27, 275-287. Freyer, H.D. (1978) Seasonal trends in NH4+ and NO3- nitrogen isotope composition in
rain collected at Jülich, Germany. Tellus 30, 83-92. Heaton, T.H.E. (1986) Isotopic studies of nitrogen pollution in the hydrosphere and
atmosphere; a review. Chemical Geology 59, 87-102. Hoering, T. (1957) The isotopic composition of the ammonia and the nitrate ion in rain.
Geochimica et Cosmochimica Acta 12, 97-102. Hoering, T.C. (1955) Variations in N-15 abundance in naturally occurring substances.
Science 122, 1233-1234. Hoering, T.C. and Moore, H.E. (1958) The isotopic composition of the nitrogen in
natural gases and associated crude oils. Geochimica et Cosmochimica Acta 13, 225-232.
Hoering, T.C. and Ford, T.H. (1960) The isotope effect in the fixation of nitrogen by Azotobacter. Journal of the American Chemical Society 82, 376-378.
Högberg, P. (1997) 15N natural abundance in soil-plant systems. New Phytologist 137, 179-203.
Hübner, H. (1986) Isotope effects of nitrogen in the soil and biosphere, in: Fritz, P., Fontes, J.C. (Eds.), Handbook of Environmental Isotope Geochemistry. Elsevier, Amsterdam, pp. 361-425.
Kaplan, I.R. (1983) Stable isotopes of sulfur, nitrogen and deuterium in Recent marine environments, in: Arthur, M.A., Anderson, T.F., Kaplan, I.R., Veizer, J., Land, L.S. (Eds.), Stable Isotopes in Sedimentary Geology. SEMP Short course, Columbia, pp. 2-1 - 2-108.
Kelly, J.F. (2000) Stable isotopes of carbon and nitrogen in the study of avian and mammalian trophic ecology. Canadian Journal of Zoology 78, 1-27.
Kendall, C. (1998) Tracing nitrogen sources and cycling in catchments, in: Kendall, C., McDonnell, J.J. (Eds.), Isotope Tracers in Catchment Hydrology. Elsevier, Amsterdam, pp. 519-576.
Macko, S.A., Entzeroth, L. and Parker, P.L. (1984) Regional differences in nitrogen and carbon isotopes on the continental shelf of the Gulf of Mexico. Naturwisenschaften 71, 374-375.
Mariotti, A., Germon, J.C., Leclerc, A., Catroux, G. and Létolle, R. (1982) Experimental determination of kinetic isotope fractionation of nitrogen isotopes during denitrification, in: Schmidt, H.-L., Förstel, H., Heinzinger, K. (Eds.), Stable Isotopes, Proceedings of the 4th International Conference. Elsevier, Jülich, pp. 459-464.
Martin, S.L. (1999) Virgin Anasazi diet as demonstrated through the analysis of stable carbon and nitrogen isotopes. Kiva 64, 495-513.
Marty, B. and Dauphas, N. (2003) The nitrogen record of crust-mantle interaction and mantle convection from Archean to Present. Earth and Planetary Science Letters 206, 397-410.
McDonough, W.F. and Sun, S.-s. (1995) The composition of the Earth. Chemical Geology 120, 223-253.
Minagawa, M. and Wada, E. (1984) Stepwise enrichment of 15N along the food chains:

Sharp, Z.D. Principles of Stable Isotope Geochemistry
9-17
Further evidence and the relation between δ15N and animal age. Geochimica et Cosmochimica Acta 48, 1135-1140.
Nadelhoffer, K.J. and Fry, B. (1988) Controls on natural nitrogen-15 and carbon-13 abundances in forest soil organic matter. Soil Science Society of America Journal 52, 1633-1640.
Peterson, B.J. and Fry, B. (1987) Stable isotopes in ecosystem studies. Annual Review of Ecology and Systematics 18, 293-320.
Schoeller, D.A., Minagawa, M., Slater, R. and Kaplan, I.R. (1986) Stable isotopes of carbon, nitrogen and hydrogen in the contemporary North American human food web. Ecology of Food and Nutrition 18, 159-170.
Schoeninger, M.J. and DeNiro, M.J. (1984) Nitrogen and carbon isotopic composition of bone collagen from marine and terrestrial animals. Geochimica et Cosmochimica Acta 48, 625-639.
Schoeninger, M.J. and Moore, K. (1992) Bone stable isotope studies in Archaeology. Journal of World Prehistory 6, 247-296.
Schwarcz, H.P., Melbye, J., Katzenberg, M.A. and Knyf, M. (1985) Stable isotopes in human skeletons of southern Ontario; reconstructing palaeodiet. Biological Abstracts Vol. 91, Iss. 2, Ref. 20363. 12, 187-206.
Sealy, J.C., Van Der Merwe, N.J., Thorp, J.A.L. and Lanham, J.L. (1987) Nitrogen isotopic ecology in southern Africa: Implications for environmental and dietary tracing. Geochimica et Cosmochimica Acta 51, 2707-2718.
Shearer, G. and Kohl, D.H. (1986) N2-fixation in field settings: Estimations based on natural 15N abundance. Australian Journal of Plant Physiology 13, 699-757.
Sigman, D.M., Casciotti, K.L., Andreani, M., Barford, C., Galanter, M. and Bohlke, J.K. (2001) A bacterial method for the nitrogen isotopic analysis of nitrate in seawater and freshwater. Analytical Chemistry 73, 4145-4153.
Stahl, W.J. (1977) Carbon and nitrogen isotopes in hydrocarbon research and exploration. Chemical Geology 20, 121-149.
Stiehl, G. and Lehmann, M. (1980) Isotopenvariationen des Stickstoffs humoser und bituminöser natürlicher organischer Substanzen. Geochimica et Cosmochimica Acta 44, 1737-1746.
Vanderklift, M.A. and Ponsard, S. (2003) Sources of variation in consumer-diet δ15N enrichment: a meta-analysis. Oecologia 136, 169-182.
Velinsky, D.J., Fogel, M.L., Todd, J.F. and Tebo, B.M. (1991) Isotopic fractionation of dissolved ammonium at the oxygen-hydrogen sulfide interface in anoxic waters. Geophysical Research Letters 18, 649-652.
Wada, E., Kadonaga, T. and Matsuo, S. (1975) 15N abundance in nitrogen of naturally occurring substances and global assessment of denitrification from isotopic viewpoint. Geochemical Journal 9, 139-148.