chapter 9: phase diagrams - ivut.iut.ac.irivut.iut.ac.ir/content/546/lectures/chapter 09.pdf ·...
TRANSCRIPT
Department of Materials Engineering at Isfahan University of Technology
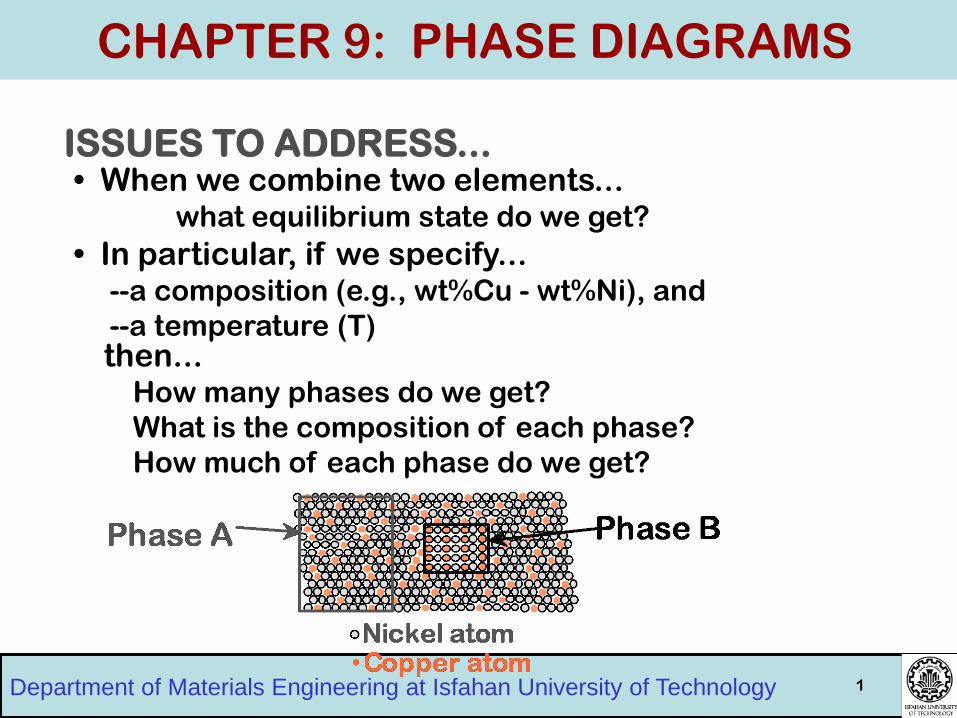
ISSUES TO ADDRESS... • When we combine two elements... what equilibrium state do we get?
• In particular, if we specify... --a composition (e.g., wt%Cu - wt%Ni), and
--a temperature (T)
1
then... How many phases do we get?
What is the composition of each phase?
How much of each phase do we get?
CHAPTER 9: PHASE DIAGRAMS

Department of Materials Engineering at Isfahan University of Technology 2
• Solubility Limit: Max concentration for
which only a solution
occurs.
• Ex: Phase Diagram:
Water-Sugar System
Question: What is the
solubility limit at 20C?
Answer: 65wt% sugar. If Co < 65wt% sugar: sugar
If Co > 65wt% sugar: syrup + sugar.
• Solubility limit increases with T: e.g., if T = 100C, solubility limit = 80wt% sugar.
Adapted from Fig. 9.1,
Callister 6e.
THE SOLUBILITY LIMIT

Department of Materials Engineering at Isfahan University of Technology 3 3
• Components: The elements or compounds which are mixed initially
(e.g., Al and Cu)
• Phases: The physically and chemically distinct material regions
that result (e.g., a and b).
Aluminum-
Copper
Alloy
Adapted from
Fig. 9.0,
Callister 3e.
COMPONENTS AND PHASES

Department of Materials Engineering at Isfahan University of Technology 4
• Changing T can change # of phases: path A to B.
• Changing Co can change # of phases: path B to D.
• water-
sugar
system
Adapted from
Fig. 9.1,
Callister 6e.
EFFECT OF T & COMPOSITION (Co)

Department of Materials Engineering at Isfahan University of Technology 5
• Tell us about phases as function of T, Co, P.
• For this course: --binary systems: just 2 components.
--independent variables: T and Co (P = 1atm is always used).
• Phase
Diagram
for Cu-Ni
system
Adapted from Fig. 9.2(a), Callister 6e. (Fig. 9.2(a) is adapted from Phase Diagrams of Binary Nickel Alloys, P.
Nash (Ed.), ASM International,
Materials Park, OH (1991).
PHASE DIAGRAMS

Department of Materials Engineering at Isfahan University of Technology 6
• Rule 1: If we know T and Co, then we know: --the # and types of phases present.
• Examples:
Cu-Ni
phase
diagram
Adapted from Fig. 9.2(a), Callister 6e. (Fig. 9.2(a) is adapted from Phase Diagrams of Binary Nickel Alloys, P.
Nash (Ed.), ASM International,
Materials Park, OH, 1991).
PHASE DIAGRAMS: # and types of phases

Department of Materials Engineering at Isfahan University of Technology 7
• Rule 2: If we know T and Co, then we know: --the composition of each phase.
• Examples:
Cu-Ni
system
Adapted from Fig. 9.2(b), Callister 6e. (Fig. 9.2(b) is adapted from Phase Diagrams of Binary Nickel Alloys, P. Nash (Ed.), ASM
International, Materials Park, OH, 1991.)
PHASE DIAGRAMS: composition of phases
Department of Materials Engineering at Isfahan University of Technology 8
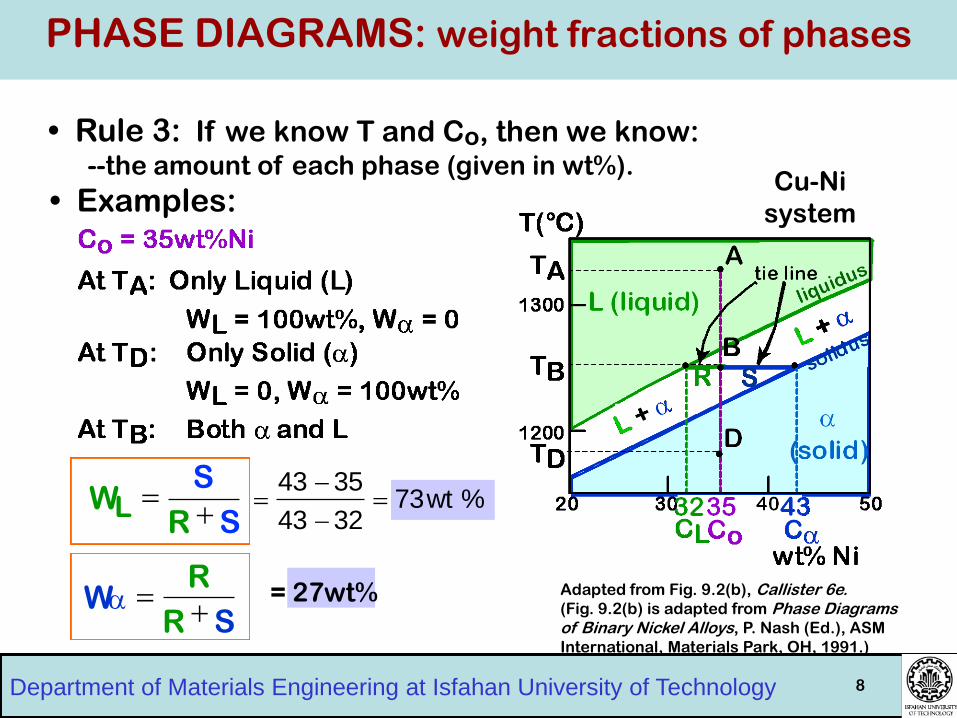
• Rule 3: If we know T and Co, then we know: --the amount of each phase (given in wt%).
Cu-Ni
system • Examples:
WL S
R S
Wa R
R S
43 35
43 32 73wt %
= 27wt% Adapted from Fig. 9.2(b), Callister 6e. (Fig. 9.2(b) is adapted from Phase Diagrams of Binary Nickel Alloys, P. Nash (Ed.), ASM
International, Materials Park, OH, 1991.)
PHASE DIAGRAMS: weight fractions of phases

Department of Materials Engineering at Isfahan University of Technology
• Sum of weight fractions:
9
• Conservation of mass (Ni):
• Combine above equations:
WL Wa 1
Co WLCL WaCa
• A geometric interpretation: moment equilibrium:
1Wa
solving gives Lever Rule
WLR WaS
THE LEVER RULE: A PROOF

Department of Materials Engineering at Isfahan University of Technology 10
• Phase diagram: Cu-Ni system.
• System is: --binary i.e., 2 components:
Cu and Ni.
• Consider Co = 35wt%Ni.
Cu-Ni
system
EX: COOLING IN A Cu-Ni BINARY

Department of Materials Engineering at Isfahan University of Technology 11
• Ca changes as we solidify.
• Cu-Ni case:
• Fast rate of cooling: Cored structure
• Slow rate of cooling: Equilibrium structure
First a to solidify has Ca = 46wt%Ni.
Last a to solidify has Ca = 35wt%Ni.
CORED VS EQUILIBRIUM PHASES
Department of Materials Engineering at Isfahan University of Technology 13
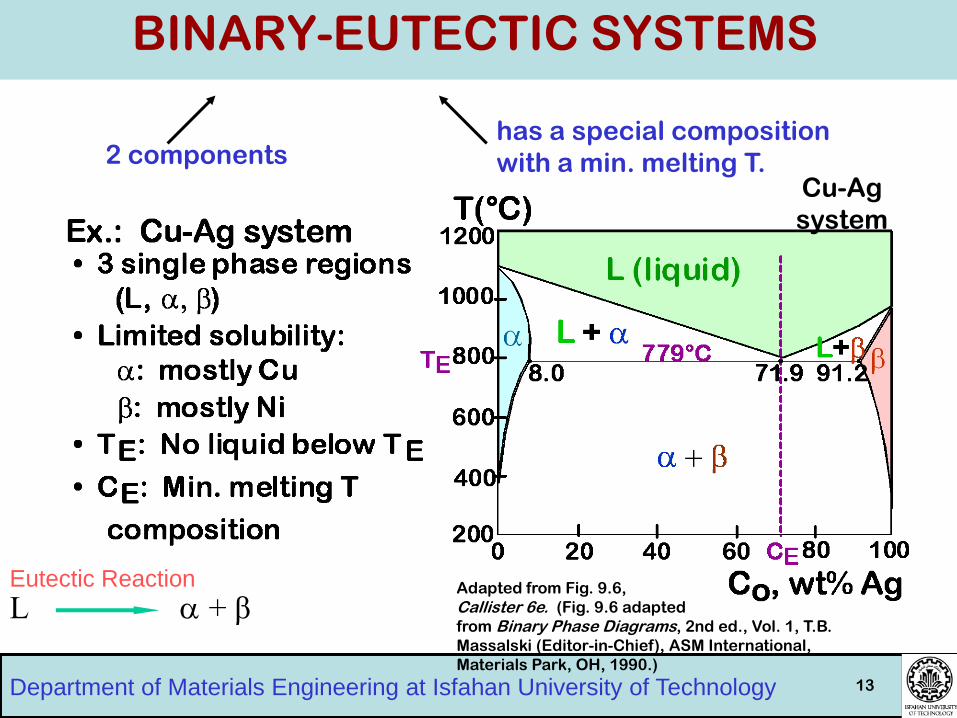
2 components has a special composition
with a min. melting T.
Adapted from Fig. 9.6,
Callister 6e. (Fig. 9.6 adapted
from Binary Phase Diagrams, 2nd ed., Vol. 1, T.B.
Massalski (Editor-in-Chief), ASM International,
Materials Park, OH, 1990.)
Cu-Ag
system
BINARY-EUTECTIC SYSTEMS
L a + β Eutectic Reaction

Department of Materials Engineering at Isfahan University of Technology 14
• For a 40wt%Sn-60wt%Pb alloy at 150C, find... --the phases present:
a + b
--the compositions of
the phases:
Pb-Sn
system Adapted from Fig. 9.7,
Callister 6e. (Fig. 9.7 adapted
from Binary Phase Diagrams, 2nd ed., Vol. 3, T.B.
Massalski (Editor-in-Chief), ASM International,
Materials Park, OH, 1990.)
EX: Pb-Sn EUTECTIC SYSTEM (1)

Department of Materials Engineering at Isfahan University of Technology
• For a 40wt%Sn-60wt%Pb alloy at 150C, find... --the phases present: a + b
--the compositions of
the phases:
Ca = 11wt%Sn
Cb = 99wt%Sn
--the relative amounts
of each phase:
15
Pb-Sn
system
Adapted from Fig. 9.7,
Callister 6e. (Fig. 9.7 adapted
from Binary Phase Diagrams, 2nd ed., Vol. 3, T.B.
Massalski (Editor-in-Chief), ASM International,
Materials Park, OH, 1990.)
EX: Pb-Sn EUTECTIC SYSTEM (2)

Department of Materials Engineering at Isfahan University of Technology 16
• Co < 2wt%Sn
• Result: --polycrystal of a grains.
Adapted from Fig. 9.9,
Callister 6e.
MICROSTRUCTURES
IN EUTECTIC SYSTEMS-I
Department of Materials Engineering at Isfahan University of Technology 17
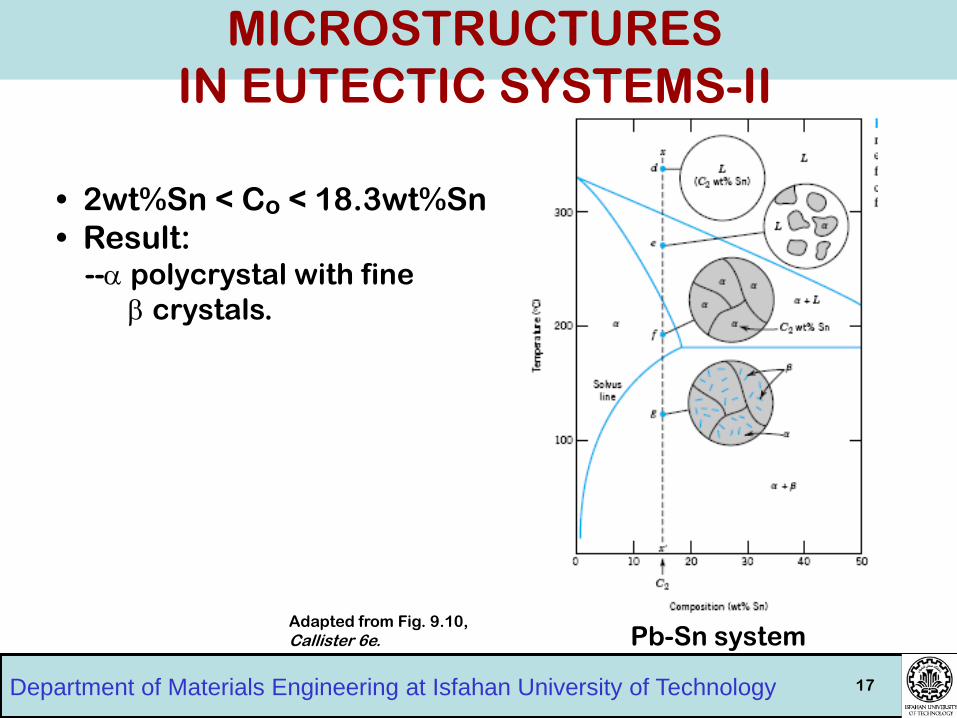
• 2wt%Sn < Co < 18.3wt%Sn
• Result: --a polycrystal with fine
b crystals.
Pb-Sn system Adapted from Fig. 9.10,
Callister 6e.
MICROSTRUCTURES
IN EUTECTIC SYSTEMS-II

Department of Materials Engineering at Isfahan University of Technology 18
• Co = CE
• Result: Eutectic microstructure
--alternating layers of a and b crystals.
Pb-Sn
system
Adapted from Fig. 9.11,
Callister 6e.
Adapted from Fig. 9.12, Callister 6e. (Fig. 9.12 from Metals Handbook, Vol.
9, 9th ed., Metallography and Microstructures, American Society
for Metals, Materials Park, OH, 1985.)
MICROSTRUCTURES
IN EUTECTIC SYSTEMS-III

Department of Materials Engineering at Isfahan University of Technology 19
• 18.3wt%Sn < Co < 61.9wt%Sn
• Result: a crystals and a eutectic microstructure
Adapted from Fig. 9.14,
Callister 6e.
MICROSTRUCTURES
IN EUTECTIC SYSTEMS-IV

Department of Materials Engineering at Isfahan University of Technology 20
Adapted from Fig. 9.7,
Callister 6e. (Fig. 9.7
adapted from Binary Phase Diagrams, 2nd
ed., Vol. 3, T.B. Massalski
(Editor-in-Chief), ASM
International, Materials
Park, OH, 1990.)
MICROSTRUCTURES
IN EUTECTIC SYSTEMS-IV
Department of Materials Engineering at Isfahan University of Technology 21
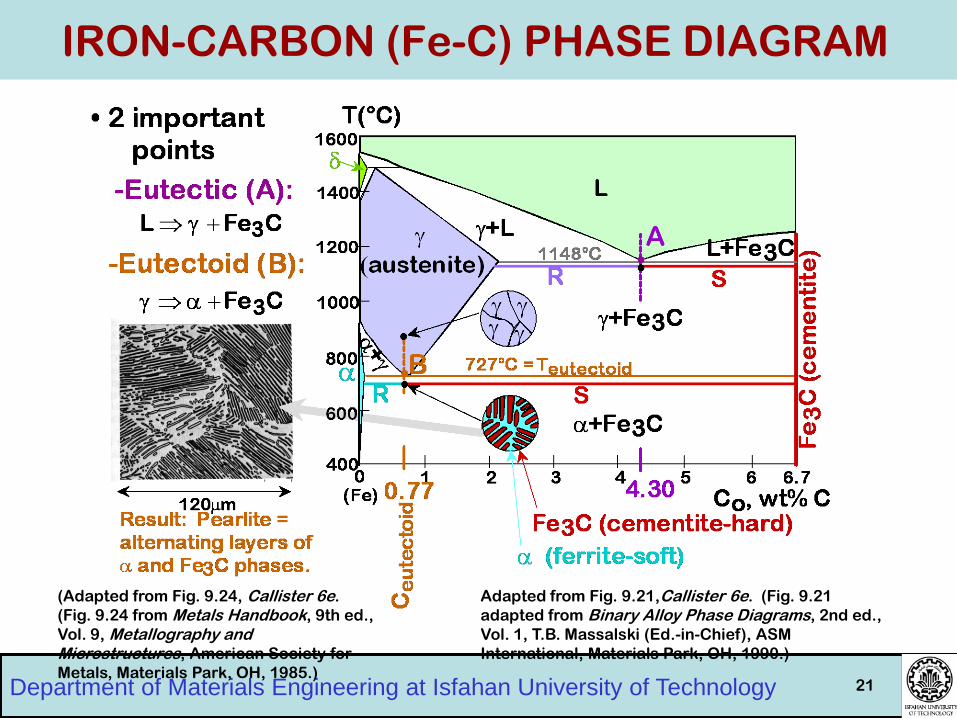
Adapted from Fig. 9.21,Callister 6e. (Fig. 9.21
adapted from Binary Alloy Phase Diagrams, 2nd ed.,
Vol. 1, T.B. Massalski (Ed.-in-Chief), ASM
International, Materials Park, OH, 1990.)
(Adapted from Fig. 9.24, Callister 6e.
(Fig. 9.24 from Metals Handbook, 9th ed.,
Vol. 9, Metallography and Microstructures, American Society for
Metals, Materials Park, OH, 1985.)
IRON-CARBON (Fe-C) PHASE DIAGRAM

Department of Materials Engineering at Isfahan University of Technology 22
Adapted from Figs.
9.21 and 9.26,Callister 6e. (Fig. 9.21 adapted
from Binary Alloy Phase Diagrams, 2nd
ed., Vol. 1, T.B.
Massalski (Ed.-in-
Chief), ASM
International, Materials
Park, OH, 1990.) Adapted from
Fig. 9.27,Callister 6e. (Fig. 9.27 courtesy Republic Steel Corporation.)
HYPOEUTECTOID STEEL
Department of Materials Engineering at Isfahan University of Technology 23
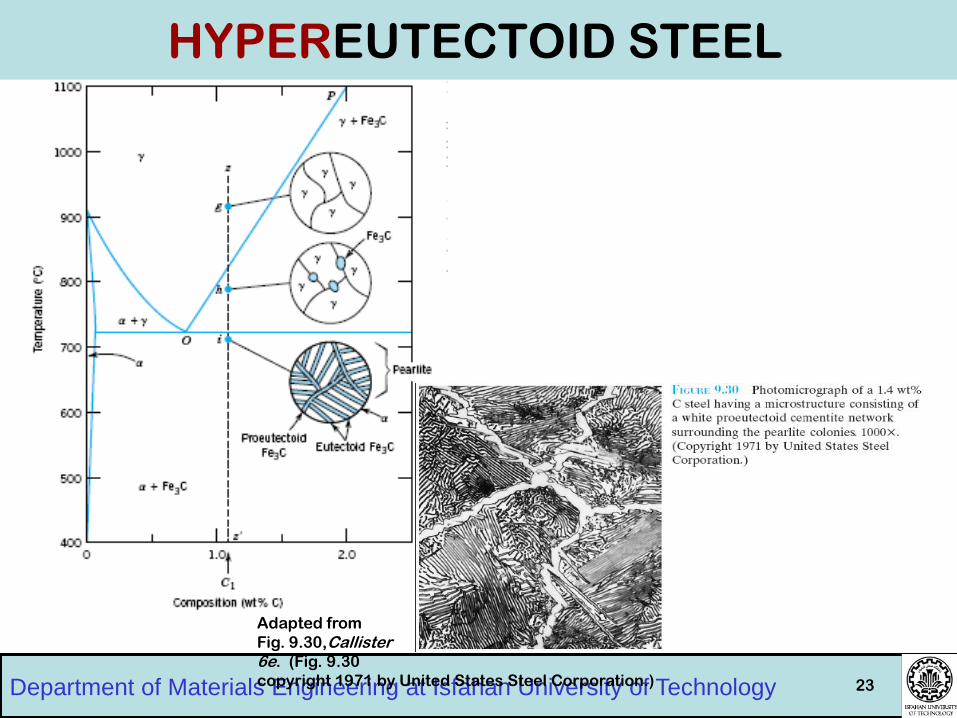
Adapted from
Fig. 9.30,Callister 6e. (Fig. 9.30
copyright 1971 by United States Steel Corporation.)
HYPEREUTECTOID STEEL

Department of Materials Engineering at Isfahan University of Technology
Example
99.65% Fe -0.35%C

Department of Materials Engineering at Isfahan University of Technology 25
• Phase diagrams are useful tools to determine:
--the number and types of phases,
--the wt% of each phase,
--and the composition of each phase
for a given T and composition of the system.
• Alloying to produce a solid solution usually
--increases the tensile strength (TS)
--decreases the ductility.
• Binary eutectics and binary eutectoids allow for
a range of microstructures.
SUMMARY