chapter - ii - information and library network...
TRANSCRIPT

C H A P T E R - II

LINEAR CHAIN MIXEDVALENT NICKEL(II) AND COPPER(II) COMPLEXES OF
BIS(9,10-PHENANTHRENEDIONEDIOXIME) AND BIS(BENZOQUINONEDIOXIME).
ELECTRICAL CONDUCTIVITY AND E.S.R. STUDIES OF THE COMPLEXES IN
SOLID STATE.
2.1 INTRODUCTION:
2.1.1 General View of the Properties of Linear Chain Mixed Valence
Transition Metal Complexes.
Solids with strongly uni-dimensional structural and
electronic interactions have attracted much attention from
chemists and physicists in recent times. The crucial features
resulting from the co-operative phenomenon of these molecular
solids are unusually quasi-metals, electrical conductors and
interesting optical and magnetic behaviour. Coordination
complexes containing direct metal-metal (M-M) interactions forming
chains fall into this category of solid compounds. These can be
classified into mainly two types.
1. Complexes containing discrete units like dimeric complexes
and metal clusters. This class of complexes contain a discrete
number of directly interacting metal atoms.
2. Linear chain complexes which contain an infinite array of
directly interacting metal atoms arranged in linear chain
throughout the crystal lattice.
39

In general the planar or nearly planar units can stack one
above the other resulting in columnar stacked compounds (Fig.2.1)
gAs d metal complexes are known to adopt stable square planar
structure with D symmetry, this group of complexes are widely
studied under this title. The interactions in these complexes are
interpreted by many different theories. But mainly they are found
to have either purely electrostatic interactions or Metal-metal
(M-M) overlap. P. Day discussed the electrostatic approach of
intramolecular interactions as being due to crystal field effects
3 4
of neighbour molecules in the stacks, where as Rundle , Miller
and Ingraham discussed the orbital overlap model on the grounds
of band formation (Fig.2.2) . Krogman ' suggested that bonding
within the metal atoms of chain could be strengthened if
electrons were removed from the upper part of the band between
metal atoms in the stack by partial oxidation of the metal ions.
This partial oxidation can be a chained by treating the compounds
with anions. This kind of partial oxidation results in the
mixedvalent systems of the type class III B of Robin-Day scheme.
The existence of M-M interactions can be mainly judged from
X-ray crystal structure determination and also from spectroscopic
measurements, magnetic behaviour, electrical conductivity and
solubility data of these complexes. Yamada in single crystal
electronic spectrum of these complexes observed a strong
perpendicularly polarised band in the low energy region. It is
attributed due to the presence M-M bond l to the plane of the
molecule. Later it is showed that the presence of low energy band
40

Fig.2.1 Planarunits stacking into columnar stacks. (Ref.l)

8Fig.2.2 Diagrammatic representation of the band structure in d
metal-atom chain compounds. Effect of (A) decreasing
inter-metallic distance, (B) partial oxidation, and (c)
alternating anion-cation chain. Shaded portion
indicates filled band. (Ref.l)
kl

is a conclusive evidence for M-M interactions along the
. 10-12stack.
gAs d square planar complexes are diamagnetic the magnetic
behaviour of these complexes are much less informative. Where as
the conductivity studies in solid state revealed that these
complexes usually fall into the semiconductors range, with
electron delocalisation along M-M chain. Partial oxidation of
these complexes increased the conductivity. These solids show
extremely low solubility due to the presence of M-M bond in the
. . . . . 13-16solid state.
40
Keller in his article discussed in detail about the
preparation and structural chemistry of these mixedvalent systems
Containing infinite linear arrays of non bridged transition
metals. The earliest recognised stacked square planar complexes
are bis glyoxemat.es of nickel(ll), pal ladium( 11 ) and platinum.
Ni(dpg) I and Pd(dpg) I are golden Olive needle type crystals.
Their electrical conductivity and other spectroscopic1 8
characterisation have been done by Cowie et al It is found the
crystals show at least 10 times greater conductivities than the
pressed pellets along M-M stack. Using Resonance Raman
spectroscopy it is found that in these complexes iodine is present
as I and metal is assigned 2.33 integral oxidation state. The
polyiodide salts of the complex formed by partial oxidation showed1 8
good increase in the conductivity. The effect of inter planar
spacing on the charge transfer characteristics of partially
oxidised samples is discussed in M bis(benzoquinone dloxime).
43

In the case of metallo-phthalocyanin complexes it is found that
19
upon oxidation the electron is removed from ligand IT-orbital.
In such cases assignment of integral oxidation state (IOS) to
the metal atom is questionable. Substitution on the macrocyclic
rings resulted in increased conductivity due to Increased
intermetallic spacing in M-porphyrins (M = Ni, Pt).
Detailed literature survey revealed that even though the
synthesis of the nickel complexes 9,10-phenanthrenedionedioxime
25
has been reported long time back , there was no further work
reported on these complexes. It is to be noted that pqdH has
more provision for 17-delocal isation compared to dpg and bqdH due
to the absence of bulky substituents and also with a large ring
system, it should have more electrical conductivity.
2.1.2 E.S.R. STUDY OF THE STACKED COMPOUNDS
E.s.r. studies are most widely used alternative to draw some
conclusions about the structure in the absence of X-ray
diffraction data in the transition metal complexes. Since these
gstacked systems are mostly of (d ) configuration they are all
e.s.r. inactive and much Information is not obtained. But upon
oxidation of these complexes, a single sharp line is observed,
which may be due to the free delocalIsation of electron, as in the
case of organic radicals. Hence usually a paramagnetic guest
species is introduced into these systems and structural
information is deduced by studying the e.s.r. spectra of the
44

paramagnetic probe in the host lattice. Since copper(II) can
take square planar geometry easily upon coordination with the
N-donor ligands like phthalocyanine and bls(a,3-dlonedloximes), it
can be used as a paramagnetic probe. The spin Hamiltonian
parameters obtained can be used to establish the metal ligand bond
nature. The copper(II) Ion with a [CuN ] chromophore in e.s.r.
shows a four line pattern. Each line is again split into 9
lines. All four sets of 9 lines will be of same Intensity
indicating the four equal or nearly equal nitrogen donor atoms
surrounding the copper(II) ion.
In explaining the complex hyperfine structure observed in the
e.s.r. spectra, it is assumed that each of the four ligand atoms
has availed 2s, 2p , 2p and 2p orbitals for the formation of•x *y Kz
2molecular orbitals (MO) with the 3dz orbitals of the copper atom.
Since the square planar complexes have D symmetry, the following
22are the anti-bonding wave functions (Fig.2.3).
45
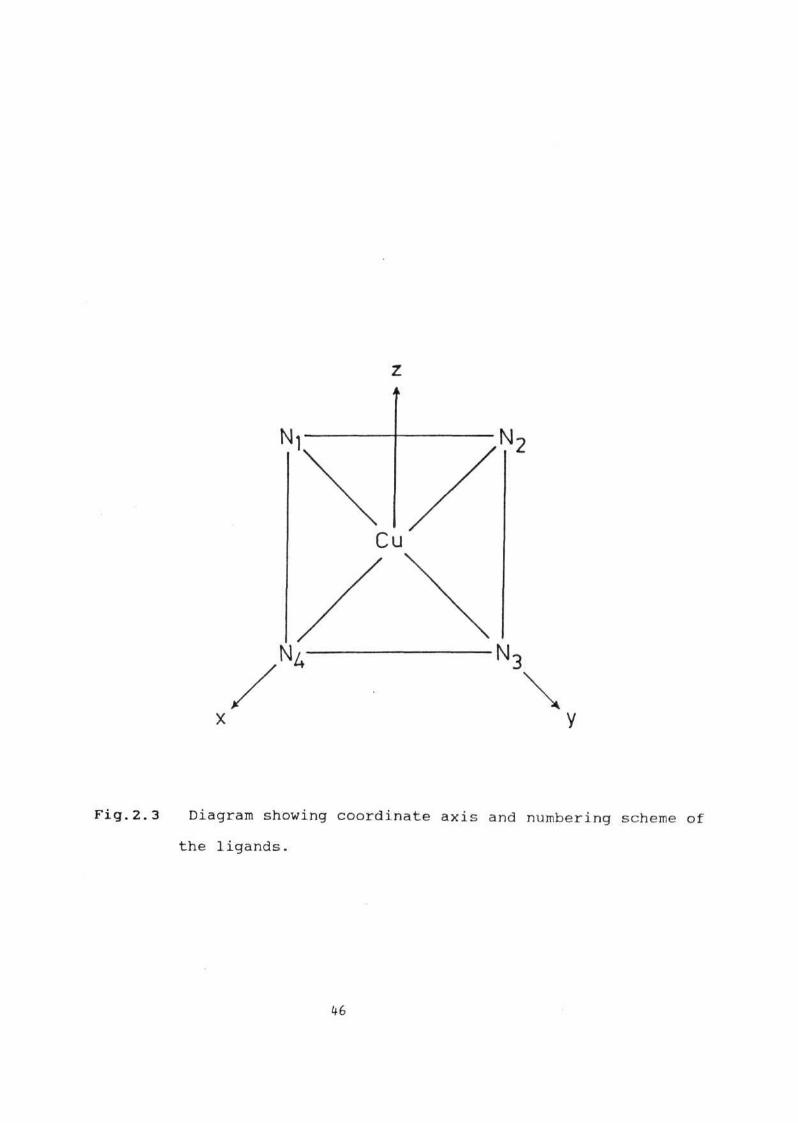
Fig.2.3 Diagram showing coordinate axis and numbering scheme of
the ligands.
46

where a 0. and 0 2 are the coefficients which express the covalent
character of the <r-bondlng, in plane and out of plane n-bondlng
respectively. The other symbols have their usual significance.
A spin Hamiltonian reflecting the four fold axial symmetry is
given by
0 is the Bohr magneton, A , B are copper hyperfine
interaction constants, Q is the copper quadruple interaction
constant, A and B,, are nitrogen hyperfine constants.
By applying these antibonding wave functions to the
Hamiltonian mentioned above from the e.s.r. parameters obtained
a,a',0,0' coefficients can be calculated.
With these ideas we have synthesised the Ni(pqdH) and
Ni(pqdH) I, and investigated the complexes in detail. In addition
prepared Cu(pqdH)?, Cu(bqdH) and copper doped Ni(pqdH)?,
Ni(bqdH) in different concentrations. A detailed e.s.r. studies
done on these compounds is also discussed in this chapter.
47

2.2 EXPERIMENTAL
2.2.1 Chemicals:
The starting materials for the preparation of ligands are
bought from Aldrich or Fluka. Other solvents and common chemicals
were of reagent grade or better quality. All the organic solvents
24
are purified by standard procedures described in Vogel . Ether is
stored over sodium, pyridlne over potassium hydroxide pellets
dimethyl formamide is vacuum distilled in dry nitrogen atmosphere
and stored over 4A molecular sieves.
2.2.2 Preparation of Ligands:
pqdFLand bqdH are prepared according to the procedures
1 ? 1—? ?described in the previous chapter experimental sections
2.2.3 Preparation of bis(9,10-Phenanthrenedionedioximato)Ni(11):
Ni(pqdH)
Ni(pqdH) is prepared according to the literature
procedure25. It is obtained as brown flaky material, which is
insoluble in all most, all non co-ordinating solvents. Sparingly
soluble in pyridine. Hence recrystallisation of the complex is not
possible.
Yield = 807.
48

2.2.4 Preparation of partially Oxidised Ni(pqdH) and Ni(III)
Complex of pqdH_:
860 mg (0.026 mol) of Ni(pqdH)2is oxidised with 6 gm (0.47
moles) of triply sublimed molecular iodine, by refluxing It in
o-dichloro benzene for 12 hours.
During the first attempt a large amount of (more than 3/4 of
starting material) black, crystalline residue is left out. Only a
small amount of partially oxidised NHpqdHKI is obtained upon
cooling from the mother liquor.
The residue was found to be a Ni(III) complex based on e.s.r.
data. However the preparation was not reproducible, further
attempts to prepare this complex resulted in mostly unreacted
material.
2.2.5 Preparation of bis(9,10-phenanthrendionedioximato)Cu(II):
Cu(pqdH)2):
500 mg(2.9xio"3 mol) of CuCl . 2H 0 dissolved in 100 ml of dry
distilled methanol and this is added to 1 gm (4.2x10* moles) of
hot(60°c) ligand solution in methanol drop wise and the brown
flaky precipitate obtained is washed with hot methanol and dry
ether. Dried over vacuum at 80 c.
Yield : ca.80%.
49

2.2.6 Preparation of Copper doped Ni(pqdH)_:
1%, 5%, 10%, 25%, 50% by molar ratio (Table 2.1) copper
doped Nl(pqdH)? complexes are prepared by mixing mixed metal
solution Cu/Niwlth ligand solution. The preparation procedure is
exactly same as in the case of Nl(pqdH) preparation. The brown
flaxy material obtained is dried in vacuum at 80 C and used for
further investigation.
2.2.7 Preparation of bis(benzoquinonedioximato)Ni(11):Ni(bqdH)
125 mg of (5.26 x 10 4 mol) of NiCl 6H 0 dissolved in 25 ml
of ethanol. This is added drop wise to the hot solution of 250 mg
-3(1.8 x 10 mol) of bqdH dissolved in 50 ml of ethanol. The
black micro crystalline product obtained is not soluble in non
coordinating solvents hence the recrystal1isatIon is not
attempted.
Yield ~ 50%
2.2.8 Preparation of Bis(benzoquinonedioximato)Cu(11):
When Cu(bqdH) is prepared similar to Ni(bqdH) , the solid is
not precipitated out. Hence 125 mg (7.3 x 10~4 mol) of CuCl 2H 0
is dissolved in 25 ml of distilled water and this solution is
-3added to 250 mg (1.8 x 10 mol) of ligand solution in methanol
solution hot condition. The black crystalline product obtained is
used without further recrystalllsatlon.
50

2.2.9 Preparation of Copper dopped Ni(bqdH)_:
IV,, 10%, 25%, 50% (by molar ratio) copper doped Ni(bqdH) are
prepared by mixing the mixed metal solution of Cu/Ni to hot ligand
(bqdH_)solution in methanol.(table 2.1) The brown poly
crystalline material obtained is washed several times with hot
methanol and then with ether. Dried In vacuum. Yield was only
45*/..
2.2.10 Preparation of Pellets for Electrical Conductivity
Measurements:
Pressed pellets of approximately 10 mm thickness are prepared
with dry powder complex. These pellets are coated with silver
metal for contact and electrical conductivities are measured using
four probe method in d.c. voltage.
2.2.11 Physical Measurements:
E.s.r. measurements are carried with variable temperature on
JEOL FE 3X spectrometer equipped with variable temperature
cryostat.DPPH is used as a standard for calibration (g = 2.0035).
I.R. spectra for solid complexes are by KBr pellets using Perkin
Elmer-I.R.1310 spectrophotometer. Electronic spectra are measured
using Schimadzu 200S UV-Vlslble spectrophotometer.
51

Table 2.1 : Details of the composition of the metals mkxed in
different copper doped complexes
Complex
IV. Cu/Ni
5% Cu/Ni
10*/. Cu/Ni
25% Cu/Ni
50V. Cu/Ni
CuCl2 2H20
mg
1.8
8.95
17.9
51.2
89.5
N1C12 6H20
mg
247. 1
237. 1
224.7
204.0
124.8
Ligand
(pqdH2/bqdH2)mg
500
500
500
500
500
52

Photo acoustic spectra (P.a.s) are recorded on PARC photo
acoustic spectrometer using Mg C0_ as a standard diluent.
2.2.12 Computer Simulations:
The previously described computer program (Chapter 1.2.5) Is
used, for e.s.r. simulation which includes the ligand hyperfine
interactions in first order. The simulation of copper doped
Ni (II) complexes of pqdH and bqdH , Including ligand hyperfine
interactions needed 4 hr of computer time on IBM PC (XT)
2.3 RESULTS AND DISCUSSION:
2.3.1 Electronic Spectra of Ni(pqdH) ):
The solid P.a.s spectrum of Ni(pqdH) (fig.2.4) showed 3
bands in the visible region (350 - 800 nm), at 22.2 kK, 19.6 kK
and 16.0 kK. In the literature most of the electronic spectral
discussion of stacked compounds is centered on the presence of a
low energy band at 18-20 kK. The presence of this band In
Ni(dmg)9 solid spectrum and disappearence in solution is
attributed by some authors to 3d 2 - 4P transition with some3 z z
3d 2 - II b, mixing, due to M-M interactions in the solid. But.z lu
Day argued that this band is a result of electrostatic crystal
field interaction between neighbouring intramolecular transition
dipoles. It is emphasised that the presence of M-M interaction Is
not essential for this band to be observed. According to Anex and
53

350 450 550 650
WAVELENGTH (nm)750
Fig .2 .4 P . a . s . spectrum of Ni(pqdH)
54

Krlst the presence of this low energy band Is due to a side
effect of stacking but not essentially due to M-M Interaction. In
addition to the band at ~ 20 kK an Intense band at ~ 50 kK Is
proposed by Ohashl et al in single crystal Ni(dmg)? as due to
intermetallic charge transfer transition. As Ni(pqdH) is
Insoluble in non coordinating solvents, the solution spectrum
could not be studied, hence the band seen in solid p.a.s. spectrum
of this compound at ~ 20 kK (19.6 kK) can not be unambiguously
assigned M-M interactions in the solid.
2.3.2 Electrical Conductivity Studies of Partially Oxidised Ni(pqdH)
The electrical conductivity data of the partially oxidised
samples of Ni(pqdH) are given in the Table 2.2. the data reveal
that all these compounds are in semi-conductor ranged 303 K. The
partial oxidation with molecular iodine did not improve
conductivity like in Ni(dpg) I and Pd (dmg),,^21. In light of the
dependency of the conductivity on M-M interactions, the excess
conductivity showed by Ni(dpg) Ix over Pd(dpg) Ix (Table 2.3)" is
surprised as the M-M distances in both complexes are exactly same
and the metallic reading only differ by 0.16 A. Where as the
difference in conductivity between Ni(dpg) I and Nl(bqdKl
stress upon the fact, that ligand orbitals play an important role
in the conductivity behaviour. Increased II delocal i sat ion and
absence of bulky substituents on the ligands should Increase
conductivity allowing more electron delocallsatlon as seen in the
case of Ni(TMBP)I0 3 3 over Ni (0MTBPH2) I 33.21 In such cases
9,10-phenanthrenedionedioxlme should be a better ligand over dpg.
55

Table 2.2 : Conductivity at temperature 303 K and 10 V in pressed
pellets of ~ 1 mm thickness
Compounds Current in Conductivity
amperes -^
Ni(pqdH) 11.9 x 10 9 1.45 x 10 9
Ni(pqdH) 25.5 x 10"1 2.8 x 10~8
Ni(111)residue 85.2 x 10~7 8.5 x 10~7
56

Table 2 3: Single Crystal D.C. Conductivities at 300 K
S=solvent
57
Compound
Nl(dpg)2
Ni(dpg)2I
Pd(dpg)2I
Ni(bqd)2
N i ( b q d ) 2 l 0 0 1 8
Ni(bqd)2I0 5 ? S
Pd(bdq)2I0 5S
Conductivity
< 8 x 10
2.3-11 x l0" 3
7.7-4 .7 x 10"4
<9 x 10~9
<9 x 10~9
1.8-11 x 10~6
7.8-8.1 x 10"5

But that Is not the case observed In electrical conductivity of
Ni(pqdH) I compound Ni(dmg) I . The possible explanation can be
obtained from the fact that the conduction In the pressed pellets
depends more on contact between particles of the powder along with
intra particle conduction. In the absence of X-ray diffraction
data, we could not confirm the amount of iodide and also there by
the extent of oxidation. In the case of Ni(bqd)_I show veryc. 0 . U1 o
less conductivity, than in Ni(bqd)_I- __. Thus the poor
conductivity observed in partially oxidised Ni(pqdH) I may be due
to the powder nature and insufficient oxidation.
2.3.3 E.s.r. Studies of Ni(pqdH) I :
Partially oxidised Ni(pqdH) I shows a sharp signal (Fig.2.8)
at g = 2.011, like in other reported partially oxidised
pp
complexes. This can be due to the lattice defects. The sharp
signal is the characteristic property of high spin exchange
interaction energy.
2.3.4 E.s.r. Studies of Ni(III ) complex of pqdH :
The crystalline black residue left in the reaction mixture,
in e.s.r. study revealed the presence of Nickel(III) species
(Fig.2.9). The three different g va1ues,(Table 2.4) shows that
the spectrum is rhombic in nature. The spectrum looks similar to
29
that reported by Kruger and Holms
This product is readily soluble In pyridlne. The frozen
58

Table 2.4 X-band e.s.r parameters
59
Compound
PartiallyoxidisedNi(pqdH)2
Residue
Residue in
pyr idine
Cu(PqdH)2
Cu(bqdH)
Temp.K
298
298
128
298
298
g
2.011
gj = 2.071
g2 = 2.035
g3 = 1.994
g|( = 1-915
g = 2.026
g = 2.054
« , - 2 - 1 6 7
g = 2.054
A
A (N) = 20.0 x 10"4 cm"1
A = 173.1 x 10~4 cm"1
A = 28.77 x 10~4 cm"1

solution (128 K) pyrldlne adduct of this compound gives an axially
symmetric e.s.r. spectrum (Fig.2.10). The quintet super hyperfine
on parallel line Is similar to that observed In spectrum of
29
dipyrldlne adducts reported for other Ni(II I) complexes . The2
analysis of g values ( g > g ) of this complexes shows that a d
ground slate is required for these conditions of the spectrum.
The A values (~ 20 G) are close to earlier reported Nickel(111). 30-37
complexes.
2.3.5 Electronic Spectra of Cu(pqdH)2 and Cu(bqdH)
The electronic spectra of Cu(pqdH) recorded (400-850 nm) in
Nujolmull shows a broad band at around 22.2 kK (Fig.2.5). In
the p.a.s. spectrum (Fig2.6) this compound is showing another band
at 20.6 kK in addition to 22.2 kK peak. Cu(bqdH) Nujolmull
spectrum (400-850 nm) showing (Fig.2.7) a weak shoulder at - 22 kK
and another at 20.0 kK. These two transition energies are similar
to the earlier reported values for many compounds of this type.
These transition energies (~ 20 kk) and (~ 22 kK) are attributed
2 2 2 2due to B,, < B. and E < B, electronic transitions.
lq lg g lg
2.3.6 E.s.r. Studies of Cu(pqdH) and Cu(bqdH)
The room temperature X-band e.s.r. spectrum of solid
Cu(pqdH) shows a broad isotropic signal (Fig.2.11) at g = 2.054.
This is a typical spectrum of magnetically concentrated copper(II)
complexes.
60

Fig.2.5 Deconvoluted electronic spectrum of Cu(pqdH) in Nujol
mull, showing component bands; experimental
spectrum; —————calculated spectrum.
61

350 450 550 650WAVELENGTH (nm)
750
Fig.2 .6 P . a . s . spectrum of Cu(pqdH)
62

Fig.2.7 Electronic spectrum of Cu(pqdH)2 in Nujol mull
63
Microcystalline cu(pqdH) unlike its analogous pqdHL complex
showed a resolved hyperfine with 2 parallel lines (Fig 2.12.a) and
other two merged in perpendicular portion. The larger g value
and larger difference in A and A values (Table 2.4) confirms the
d 2_ 2 ground state. There Is no nitrogen super hyperfinex —y
observed in the spectrum. This resolution of the spectrum
disappears upon grinding resulting in a broad line spectrum.(Fig
2.12.b) This well powdered sample upon storage form fine needle
shaped, golden coloured crystals- Under going solid state
crystalline. These crystals do not show any e.s.r. signal in
X-band at room temperature. However, the behaviour of the complex
has to be established in detail.
2.3.7 E.s.r. Studies of Copper doped Ni(pqdH) and (bqdH) at
different Concentrations
Copper could be doped in various concentrations into the
nickel host lattice, in the Ni(pqdH) and (bqdH) complexes. Both
the complexes exhibit similar e.s.r. behaviour at X-band at. room
temperature, showing that they are analogous compounds.
10% copper doped samples of Cu Ni(pqdH) and 25% Cu Ni(bqdH)
showed a well resolved 4 line pattern with nitrogen super
hyperfine splitting at X-band (Fig.2.13,14). There is no change
in e.s.r. parameters upon cooling to low temperatures. The
simulated values of the e.s.r. parameters are given in Table 2.4.
The analysis of e.s.r. parameters g|( > g^, A(| >> A (Table 2.5)
show that the spectrum is arising due to axially symmetric square
64

Fig.2.8 X-band e.s.r. spectrum of partially oxidised
Ni(pqdH)2Ix at 298 K.
65

Fig.2.9 X-band e.s.r. spectrum of residue showing Ni(III
species at 129 K.
66

Table - 2.5 : E.s.r. parameters of copper doped Nickel complexes.
67
— 1cm
Complex g(| g A Cu A Cu A N A N
Cu Nl(pqdH)2 2.128 2.033 0.0193 0.0027 0.0014 0.0017
Cu Ni(bqdH) 2.129 2.033 0.0196 0.0027 0.0014 0.0017

Fig.2.10 Frozen solution X-band e.s.r. spectrum of residue in
pyridine at 128 K.
68

Fig.2.11 X-band e.s.r. spectrum of Cu(pqdH)2 at 298 K,
69
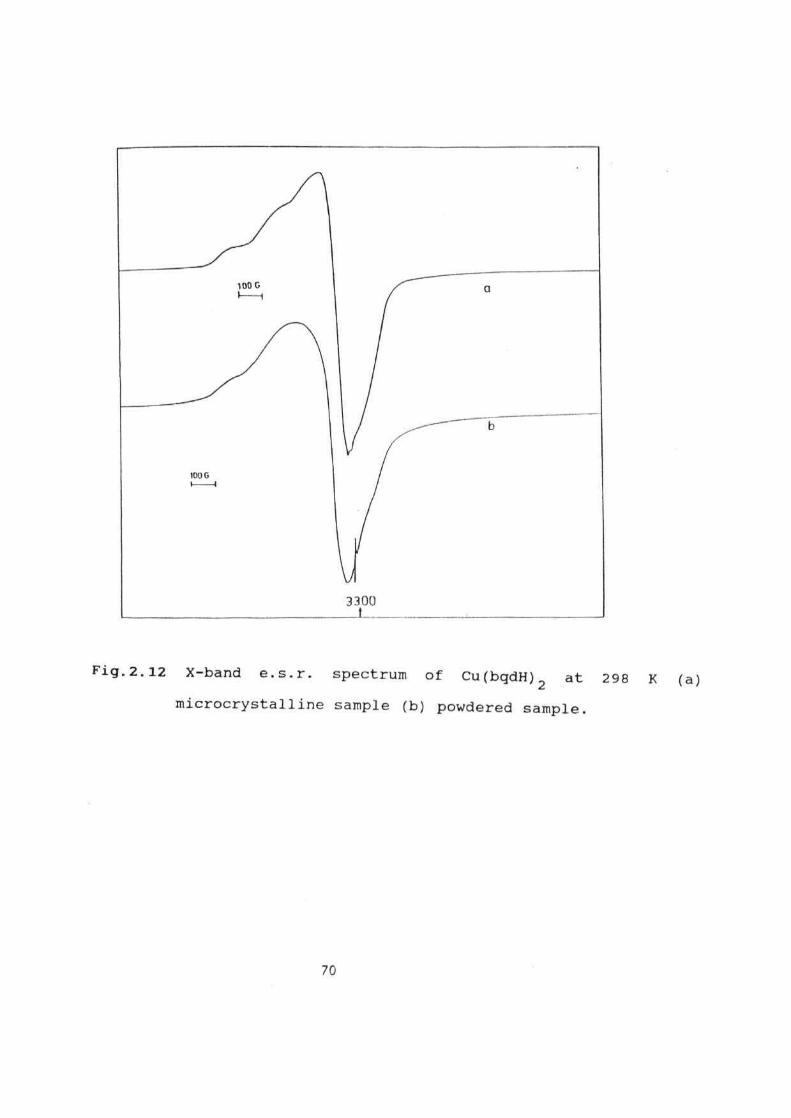
Fig.2.12 X-band e.s.r. spectrum of Cu(bqdH) at 298 K (a)
microcrystalline sample (b) powdered sample.
70

Fig.2.13 X-band e.s.r. spectrum of 10% Cu doped Ni(pqdH) at
298 K.
experimental spectrum
simulated spectrum
71

Fig.2.14 X-band e.s.r. spectrum of 25% Cu doped Ni(bqdH) at
298 K.
experimental spectrum
simulated spectrum
72
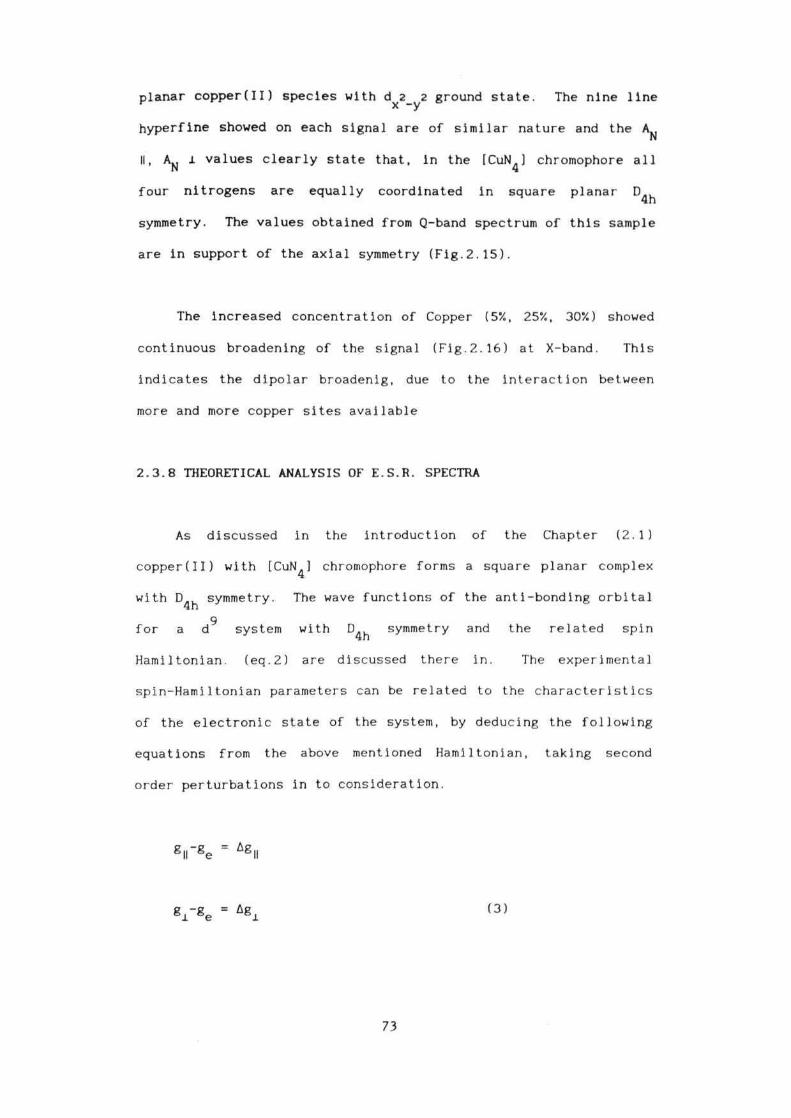
planar copper(II) species with d 2 2 ground state. The nine linex -y
hyperfine showed on each signal are of similar nature and the A..N
II, AN 1 values clearly state that, in the [CuN ] chromophore all
four nitrogens are equally coordinated in square planar D
symmetry. The values obtained from Q-band spectrum of this sample
are in support of the axial symmetry (Fig.2.15).
The increased concentration of Copper (5%, 25%, 30%) showed
continuous broadening of the signal (Fig.2.16) at X-band. This
indicates the dipolar broadenig, due to the interaction between
more and more copper sites available
2.3.8 THEORETICAL ANALYSIS OF E.S.R. SPECTRA
As discussed in the introduction of the Chapter (2.1)
copper(II) with [CuN ] chromophore forms a square planar complex
with D symmetry. The wave functions of the anti-bonding orbital
9for a d system with D symmetry and the related spin
Hamiltonian, (eq.2) are discussed there in. The experimental
spin-Hamiltonian parameters can be related to the characteristics
of the electronic state of the system, by deducing the following
equations from the above mentioned Hamiltonian, taking second
order perturbations in to consideration.
73
(3 )

Fig.2.15 Q-band e.s.r. spectrum of 10% Cu doped Ni(pqdH) at
298 K.
7k

Fig.2.16 X-band e.s.r. spectrum of 50% Cu doped Ni(pqdH) at
298 K.
75

where g = 2.0023 is the free electron g-value. The significance
of the various terms in the above equations are briefly discussed
below.
E , E_, E« and E are the energies of the appropriate molecularJ. £ %J 4
76
These quantities measure the deviation of the proposed
g-values from the free electron value. In an electronically
non-degenerate state (L = 0) the g-anisotropy arises due to mixing
of the excited state in to the ground state by spin-orbit
interaction. Using perturbation theory, and retaining only terms
in the first power of the interaction, these equations are given
by
(4)
(5)
where

orbitals and A Is the spin-orbit coupling constant. (-828 cm for
copperll). K and K are the covalency reduction factors which
are functions of the overlap integral, S and a quantity T, which
is related to the orbital angular momentum matrix elements of the
ligand part of the molecular orbitals
9since A is negative for d system, equations (4) and (5) imply
that g and g will be greater than ge. g deviates from g due
to mixing of the I d 2 2 > state and g deviates from g due to& ' x -y °i e
mixing of I d > and I d > states into the ground state6 ' xz ' yz
derived from I d >. The deviation is proportional to the1 xy
spin-orbit coupling constant and is inversely proportional to the
energy separation between the ground state and the respective
excited states connected by the spin-orbit interactions. Equation
(6) implies that the anisotropy is reduced by covalent
delocalisation. It may be noted that spin-orbit coupling due to
ligand atoms is negligible due to the much smaller values of A (N
or 0).
(ii) A is the Fermi contact interaction constant and it is an
isotropic term contributing equally to A and A . This
interaction arises due to the presence of unpaired electron (spin)
2 2density, d> , (o), at the nuclei. <f> . (0) can be either dueJ spin spin
77
(6 )

to S contribution (4 S in the case of Cu) to the HOMO via
configuration Interaction or, more importantly, due to core
polarisation. In simple terms polarisation of the inner S-shells
takes place because the unpaired electron in 3d orbital ( A spin)
repels one of the two electrons (the A spin electron) in the
S-shell less than the other. In other words the exchange
interaction between the electrons having identical spin ( A Or a)
leaves a net 0 spin density at the nucleus. The contact
contribution is given as
where g and g are electronic and nuclear Lande factors and /3e r e
and (3 are electronic and nuclear Bohr magnetons respectively.
For convenience, we define
It is clear that in the free atom or ion (i.e, in the absence of
covalency) accurate calculation for A = -Pk. Both 'P' and 'K'
can be obtained for atoms by unrestricted Hartree-Fock .Accurate
calculations for molecules are more involved and approximation
methods like X-ct have been used for the purpose with some
78
(7)
(8)
(9)
( 1 0 )

39success.
iii) AD is the dipolar contribution to hyperfine splitting and is
primarily responsible for the anisotropy in the observed
splittings. Its value depends on the d-orbital containing the
unpaired electron (For the present case/d 2_ 2 ground slate) we
have
2Here again, covalency reduces the anisotropy due to the factor (3
(<1) in equation (11), and also due to the reduction in the value
of P. P is reduced by covalency because the d-orbital becomes more
diffuse due to reduction in effective nuclear charge of the metal.
iv) A and A are the first order corrections to the
hyperfine splitting due to spin-orbit interaction. These
correlations are related to the g- anisotropy by the following
equation.
2.3.9 Interpretation of e.s.r. parameters:
Using equation (3) the bonding parameters for the Cu
Ni(pqdH) complex listed in Table 2.5 have ben calculated and are
tabulated in the Table 2.6. As mentioned in the earlier part of
79
( 1 1 )
( 1 3 )
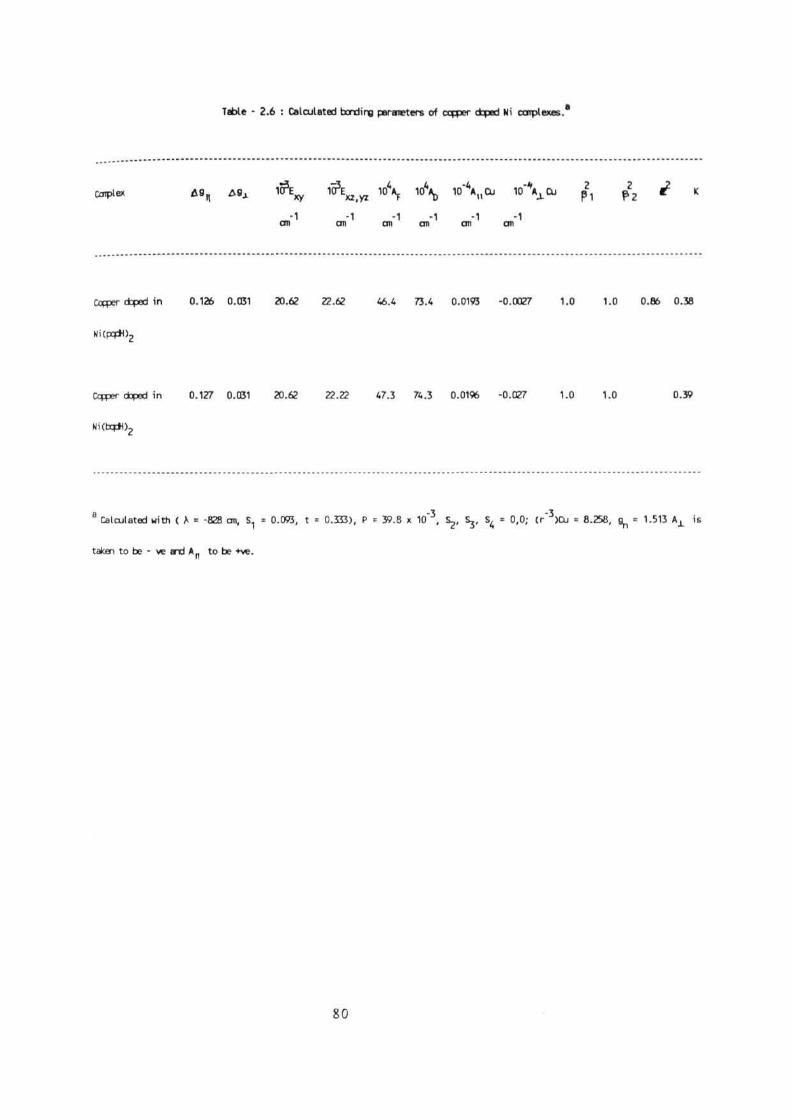
Table - 2.6 : Calculated bending parameters of copper doped Ni carpi exes.8
80

the discussion &.&? a n d c represents the c-bondlngs in plane and
2out of plane parameters respectively. If 0 = 1.0, the
2corresponds to total plane n bonding if |3 = 0.5, it is totally
covalent in nature. The values obtained in the present system,
£ =1.0 shows more ionic nature a bonding. From the total ionic
character in in plane n bond is clear that there is electron
delocalisation in out of plane TT bonding in the present case. The
large value of Ap (0.007 cm" ), than A (0.004 cm" ) shows that
the anisotropic contribution in the hyperfine interaction is more
than the isotropic part (A ).
The difference in A (193 G) and A (27 G) iS in accordance
with the above discussion. The K value (0.38) is also similar to
that observed in the usual copper(I) square planar complexes.
2.4 CONCLUSIONS:
1. The pratially oxidised Ni(pqdH) I complexes are falling in
to the semi conductors range.
2. E.s.r. studies of copper doped Ni(pqdH) and (bqdH)
complexes confirms the square planar geometry of these complexes.
81

2.5 Abbreviations:
dpg : diphenylglyoxime
dmg : dimethylglyoxlme
pdqH : 9,10-Phenanthrenedionedioxlme
bqdH9 : benzoquinonedioxime
TMBP : tetramethylbenzoporphyrin
OMTBP : 1,4,5,8,9,12,13,16-octamethyltetrabenzoporphyrln
82

2.6 REFERENCES:
1. Thomas, T.W.; Underhill, A.E. Chem. Soc. Rev., 1972, 1, 99.
2. Day, P. Inorg. Chem. Acta. Rev., 1969, 3, 81.
3. Rundle, R.E. J. Phys. Chem., 1957, 61, 45.
4. Miller, J. Chem. Soc, 1965, 713.
5. Ingraham, L.L. Acta. Chem. Scan. 1966, 20, 283.
6. Krogman, K. Angew. Chem. Internat. edn. 1969, 8, 35.
7. Krogman, K. ; Dodel, P.;Hansen, H.D. prog. VHI Internat.
conf. coord, chem.ed. Gutman, V. p.157.
8. Robin, M.B.; Day, P. Adv. Inorg. Chem. Radio. Chem., 1967,
10, 247.
9. Yamada, S. J. Am. Chem. Soc, 1951, 73, 1579.
10. Anex, B.C; Krist, F.K. J. Am. Chem. Soc, 1967, 89, 6114.
11. Day, P.; Orchand, F.F.; Thomson, J.; Williams, P. J. Chem.
Phys. 1965, 43, 3763.
12. Ferguson, J. Chem. Phys. 1961, 34, 611.
13. Sharpe, A.G.; Wakefield, D.B. J. Chem. Soc, 1957, 281.
14. Banks, C.V.; Barnum, D.W. J. Am. Chem. Soc, 1958, 30, 3579.
15. Rundle, R.E.; Banks, C.V. J. Phys. Chem. 1963, 67, 508.
16. Banks, C.V.; Anderson, S. J. Am. Chem. Soc,1962, 84, 1486.
17. Rundle, R.E.; William, D.E.; Whoelaner, G. 1959, 81, 755.
18. Cowie, M.; Gleizes, A. J. Am. Chem. Soc, 1979, 101, 2921.
19. Schram, C.J.; Staja Kovic, D.R.; Hoffman, B.M.; Marks, T.J.
Science 1978, 200, 47.
20. Brown, L.D.; Kalina, D.W.; Mcclure, M.S. J. Am. Chem. Soc,
1979, 101, 2937.
83

21. Phillips, T.E.; Hoffman, B.M. J. Am. Chew. Soc, 1977, 99,
7704.
22. Ray, R.K. Polyhedron, 1989, 8, 7, and references therein.
23. Bleany, B. ; Stevens, K.W.H. Rept. Progr. Phys. 1953, 16,
108.
24. Vogels "Text book of Practical Organic Chemistry", Furniss,
B.S.; Hannaford, A.J.; Rogers, V.; Smith, P.W.G. Tatchell,
A.R. ed. ELBS. 1978.
25. Walter, C. Gazz. Chem. Ital., 1936, 66, 5911.
26. Ohashi, Y.; Hanazaki, K.; Nagkurt, S. Inorg. Chem., 1970, 9,
2551.
27. Inoue, M. ; Inoue, M.B. Inorg. Chem., 1986, 23, 37.
28. Zhukhoovistski, V.B.; Kidekel, M.L.; Dyumael, K.M. Russ.
Chem. Rev., 1985, 54, 144.
29. Kruger.H.J.; Holms.R.H. Inorg. Chem. 1987,24,3645.
30. Lappin, A.G.; Murray, C.K.; Margerun, D.W. Inorg. Chem.,
1978, 17, 1630.
31. Kirvan, G.E.; Margerum, D.W. Inorg. Chem., 1985, 24, 3245.
32. Subak, E.J.; Loyolan, Jr. V.M.; Magerum, D.W. Inorg. Chem.,
1985, 24, 4350.
33. Pappenhagen, T.L; Kemady, W.R.; Bowers, C.P.; Margerum, D.W.
Inorg. Chem. , 1985, 24, 4356.
34. Kimura, E. ; Sakonaka, A. ; Machide, R. ; Kodama, M. J. Am.
Chem. Soc, 1982, 1041, 4251.
35. Yamashita, M. ; Nonaka, Y. ; Kidai, S. ; Hamane, Y. ; Aokl, R.
Inorg. Chem. Ada, 1981, 52, 43.
36. Cooper, D.A.; Higgins, S.J.; Levason, W. J. Chem. Soc
Dalton Trans. 1983, 2131.
84
37. Evans, J.; Lavason, W. ; Peroy, R.J. J. Chem. Soc. Dalton
Trans. 1990, 3691.
38. Goodman, B.A.; Raynor, J.B. Adv. Inorg. Chem. Radio Chem.,
1970, 13, 134.
39. Rajasekharan, M.V.; Bucher, R.; Delss, E. ; Zoller, L. ;
Salzer, A.K.; Moser, E. ; Weberk, J.; Ammeter, J.H. J. Chem.
Soc. , 1983, 105, 7516.
40. Keller, H.J. 'Mixed Valence Compounds', Ed. Brown, D.B. NATO
Advanced Study Institutes series, D. Reidel Publishing
Company, USA, 1979, 58, 387.
85