chapter ii plan and procedure of the studyshodhganga.inflibnet.ac.in/bitstream/10603/19575/4/chapter...
TRANSCRIPT

CHAPTER – II PLAN AND PROCEDURE OF THE STUDY
2. Introduction
The plan is an overall scheme or programme of research. It includes an outline of
what the investigators will do from writing the hypotheses and their operational
implications to the final analysis of data (Kerlinger, 2010).A well thought plan of action in
advance, followed by a systematic execution, brings out fruitful results. This helps the
researcher to proceed directly without confusing with the concomitant events. Anything to
be done properly must be planned beforehand. Research is not a haphazard task, but it
requires proceeding in a definite direction done with definite intention of taking a specific
problem and trying to find out solution in a scientific manner. In any scientific
investigation the accuracy of results depends upon the accuracy and reliability of the data.
The sanctity of data is the sheet anchor of any research work as it is the data to
which research owes its success. In a research study, the investigator has to describe the
technique he used for collection of data for his investigation. The reliability and validity of
the tools used and the method he adapted in drawing out the sample of the study is
required to be discussed. Also the researcher has to explain the procedure of
administrating the tools and their scoring. Finally it also includes determining the
techniques as to how the data has been analyzed and conclusions reached at.
This chapter is confined to the description of the plan and procedure under the
following steps:
Methodology
Population and Sample
Tools Used

69
Procedure of Data Collection
Scoring Procedure
Statistical Techniques Used
2.1 Methodology
The researcher used Descriptive Survey Method for measurement, classification,
analysis, comparison and interpretation of data. Descriptive research involves collecting
data in order to test hypothesis or to answer questions concerning the current status of the
subject of the study (Gay, 1996).
It has following characteristics:
i. Involve hypotheses formulating and testing
ii. Use the logical method of inductive-deductive reasoning to arrive at generalizations.
iii. Often employ methods randomization so that error may be estimated when population
characteristics are inferred from observations of samples.
iv. Variables and procedures are described as accurately and complete as possible so that
the study can be replicated by other researchers.
Descriptive research may be classified into three subgroups i.e. survey studies,
inter-relational studies and developmental studies. The researcher selected the survey
research method. Survey research is a useful tool for educational fact-finding. An
administer, a board of education, or a staff of teacher can learn a great deal about a school
system or a community without contacting every child, every teacher and every citizen
(Kerlinger, 2010).
The present study utilizing descriptive survey method endeavours to analysis
learning styles in relation to emotional intelligence, self-concept and achievement
motivation of senior secondary school students in Himachal Pradesh.

70
2.2 Population and Sample
The primary purpose of research is to discover principles that have universal
application, but to study a whole population to arrive at generalizations would be
impracticable, if not impossible. In order to make it practicability, the process of sample
plays a key role in the whole research work. Sampling, therefore, is the process of
selecting a few (a sample) from a bigger group (the sample population) to become the
basis for estimating or predicting prevalence of an unknown piece of information, situation
or outcome regarding the bigger group. As sample is the miniature part of the population,
it does not only save time, energy and money of the investigator but it also helps him to
study the problem in hand intensively. Moreover, study of some phenomena from the
population would lead to the collection of mass of data whose analysis would be slow and
tedious. The analysis of large quantity of data may involve a number of errors which
would make the study useless. The adequacy of the sample depends upon our knowledge
of the population as well as method used in drawing the sample and the fairness in the
sample can be secured by giving every member of the population a specifiable change of
appearing in it. The accuracy of the representation depends upon the size of the sample not
by the number of the members but number of independent selection made by them. The
size and procedure of selecting a sample for determining the validity of any research
study; a detail description of these has been given in the present chapter. The investigator
has tried as far as possible to take all possible care to ensure that the sample of the
research study becomes a true representative of the population under study.
A population may consist of persons, objects, attributes, qualities, behaviour of
people, answer to several of items of a test, the behaviour of inanimate objects such as
cites, families, opinions and the like. It is a well-defined group to which the researcher
71
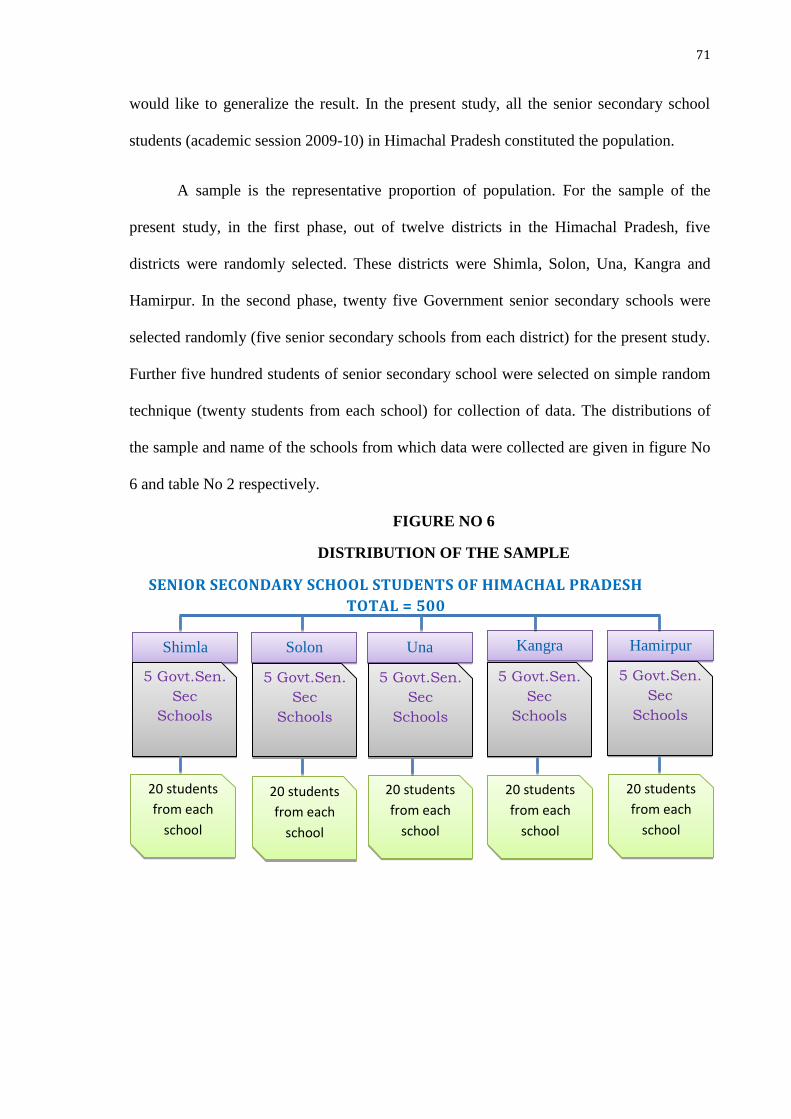
would like to generalize the result. In the present study, all the senior secondary school
students (academic session 2009-10) in Himachal Pradesh constituted the population.
A sample is the representative proportion of population. For the sample of the
present study, in the first phase, out of twelve districts in the Himachal Pradesh, five
districts were randomly selected. These districts were Shimla, Solon, Una, Kangra and
Hamirpur. In the second phase, twenty five Government senior secondary schools were
selected randomly (five senior secondary schools from each district) for the present study.
Further five hundred students of senior secondary school were selected on simple random
technique (twenty students from each school) for collection of data. The distributions of
the sample and name of the schools from which data were collected are given in figure No
6 and table No 2 respectively.
FIGURE NO 6
DISTRIBUTION OF THE SAMPLE
SENIOR SECONDARY SCHOOL STUDENTS OF HIMACHAL PRADESH
TOTAL = 500
Shimla Solon Una Kangra Hamirpur
5 Govt.Sen.
Sec
Schools
5 Govt.Sen.
Sec
Schools
5 Govt.Sen.
Sec
Schools
5 Govt.Sen.
Sec
Schools
5 Govt.Sen.
Sec
Schools
20 students
from each
school
20 students
from each
school
20 students
from each
school
20 students
from each
school
20 students
from each
school

72
TABLE NO – 2
NAMES AND NUMBERS OF SENIOR SECONDARY SCHOOL STUDENTS
FROM WHERE DATA WERE COLLECTED
Serial No Name of
Districts Name of the Senior Secondary Schools
No. of
Students
I
SHIMLA
1. Government Senior Secondary School,
Summer Hill.
20
2. Government Senior Secondary School,
Lalpani.
20
3. Government Senior Secondary School,
Phagli.
20
4. Government Senior Secondary School,
Boileauganj.
20
5. Government Boys Senior Secondary
School, Shimla.
20
II
SOLON
1. Government Senior Secondary School,
Kalhog.
20
2. Government Senior Secondary School,
Kandaghat.
20
3. Government Senior Secondary School,
Kanaid.
20
4. Government Senior Secondary School,
Mahadev.
20
5. Government Boys Senior Secondary School,
Solon.
20
III
UNA
1. Government Senior Secondary School,
Bhagaretu.
20
2. Government Senior Secondary School,
Dauladpur.
20
3. Government Senior Secondary School,
Hroli.
20
4. Government Girls Senior Secondary
School, Una.
20
5. Government Boys Senior Secondary
School, Una.
20

73
IV
KANGRA
1. Government Senior Secondary School,
Kathog.
20
2. Government Senior Secondary School,
Sunhet.
20
3. Government Senior Secondary School,
Gahallaur.
20
4. Government Senior Secondary School,
Jawalamukhi.
20
5. Government Senior Secondary School,
Mahadev.
20
V
HAMIRPUR
1. Government Senior Secondary School,
Bhoranj.
20
2. Government Boys Senior Secondary
School, Hamirpur.
20
3. Government Girls Senior Secondary
School, Hamirpur.
20
4. Government Senior Secondary School,
Dugha.
20
5. Government Senior Secondary School, Rail. 20
Total Five
Districts Twenty five Senior Secondary Schools 500
2.3 Tools Used
In order to collect data from the selected sample, following standardized tests were
used. Among these, Memletices Learning Styles Inventory was adopted by the researcher.
i. Memletices Learning Styles Inventory by Sean Whiteley (2003) was adopted by
researcher in Hindi version to measure learning styles (visual learning style, aural
learning style, verbal learning style, physical learning style, logical learning style, social
learning style and solitary learning style) of senior secondary school students.
74
ii. Mangal Emotional Intelligence Inventory by S. K. Mangal and Shubhra Mangal (2004)
was used by the researcher to measure emotional intelligence of senior secondary school
students.
iii. Self-concept Questionnaire by Raj Kumar Saraswat (2007) was used by the researcher to
measure self-concept of senior secondary school students.
iv. Sharma Academic Achievement Motivation Test by T. R. Sharma (1984) was used by
the researcher to measure achievement motivation of senior secondary school students.
A brief description of tools as follows:
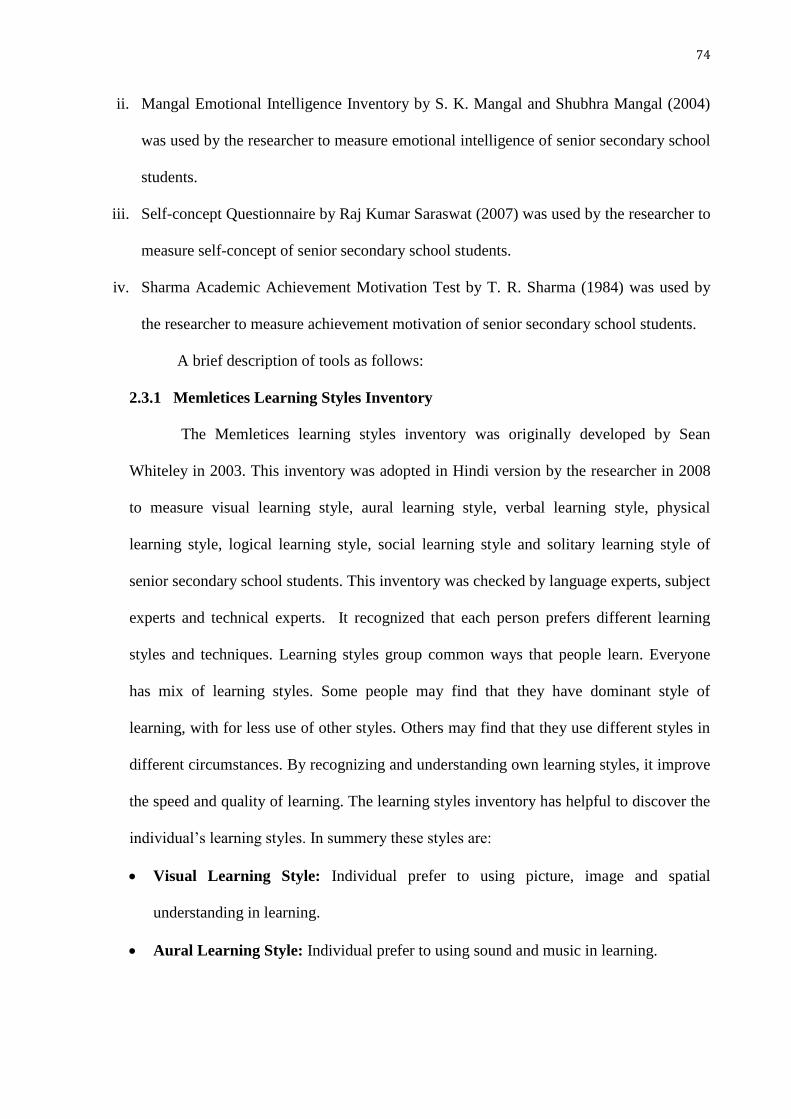
2.3.1 Memletices Learning Styles Inventory
The Memletices learning styles inventory was originally developed by Sean
Whiteley in 2003. This inventory was adopted in Hindi version by the researcher in 2008
to measure visual learning style, aural learning style, verbal learning style, physical
learning style, logical learning style, social learning style and solitary learning style of
senior secondary school students. This inventory was checked by language experts, subject
experts and technical experts. It recognized that each person prefers different learning
styles and techniques. Learning styles group common ways that people learn. Everyone
has mix of learning styles. Some people may find that they have dominant style of
learning, with for less use of other styles. Others may find that they use different styles in
different circumstances. By recognizing and understanding own learning styles, it improve
the speed and quality of learning. The learning styles inventory has helpful to discover the
individual‟s learning styles. In summery these styles are:
Visual Learning Style: Individual prefer to using picture, image and spatial
understanding in learning.
Aural Learning Style: Individual prefer to using sound and music in learning.
75
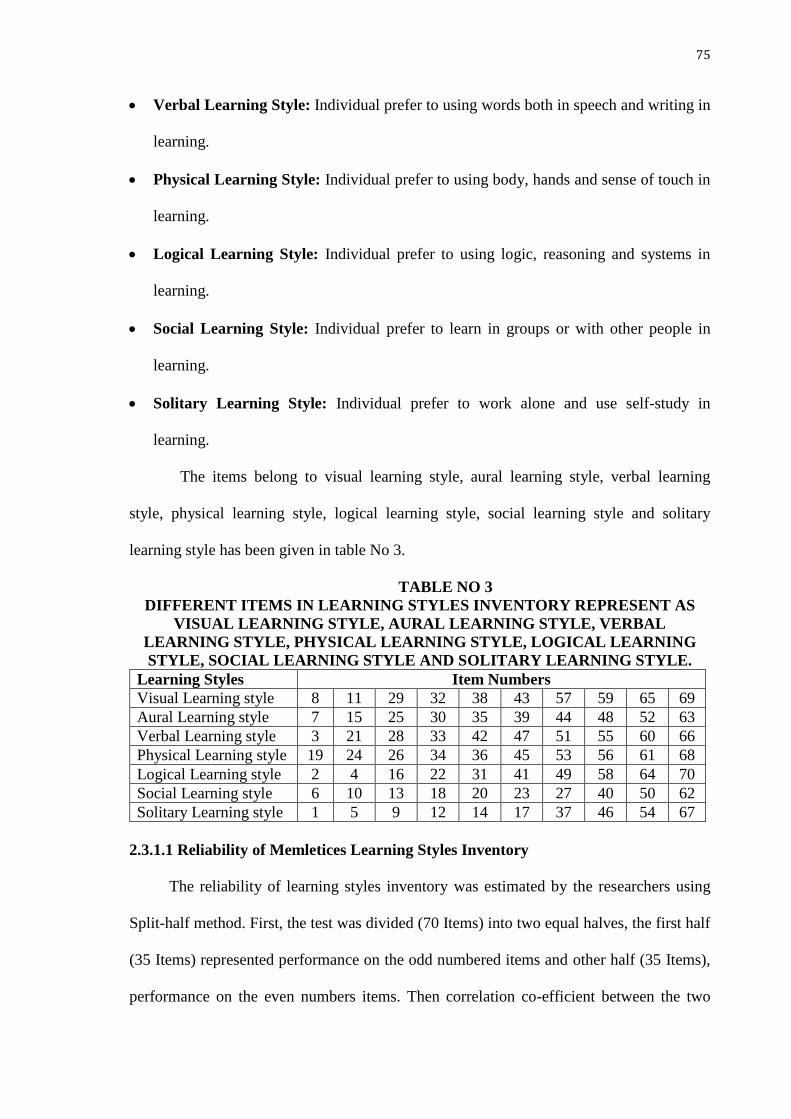
Verbal Learning Style: Individual prefer to using words both in speech and writing in
learning.
Physical Learning Style: Individual prefer to using body, hands and sense of touch in
learning.
Logical Learning Style: Individual prefer to using logic, reasoning and systems in
learning.
Social Learning Style: Individual prefer to learn in groups or with other people in
learning.
Solitary Learning Style: Individual prefer to work alone and use self-study in
learning.
The items belong to visual learning style, aural learning style, verbal learning
style, physical learning style, logical learning style, social learning style and solitary
learning style has been given in table No 3.
TABLE NO 3
DIFFERENT ITEMS IN LEARNING STYLES INVENTORY REPRESENT AS
VISUAL LEARNING STYLE, AURAL LEARNING STYLE, VERBAL
LEARNING STYLE, PHYSICAL LEARNING STYLE, LOGICAL LEARNING
STYLE, SOCIAL LEARNING STYLE AND SOLITARY LEARNING STYLE.
Learning Styles Item Numbers
Visual Learning style 8 11 29 32 38 43 57 59 65 69
Aural Learning style 7 15 25 30 35 39 44 48 52 63
Verbal Learning style 3 21 28 33 42 47 51 55 60 66
Physical Learning style 19 24 26 34 36 45 53 56 61 68
Logical Learning style 2 4 16 22 31 41 49 58 64 70
Social Learning style 6 10 13 18 20 23 27 40 50 62
Solitary Learning style 1 5 9 12 14 17 37 46 54 67
2.3.1.1 Reliability of Memletices Learning Styles Inventory
The reliability of learning styles inventory was estimated by the researchers using
Split-half method. First, the test was divided (70 Items) into two equal halves, the first half
(35 Items) represented performance on the odd numbered items and other half (35 Items),
performance on the even numbers items. Then correlation co-efficient between the two
76
sets of scores was calculated by applying Spearman Brown Formula. The reliability co-
efficient of the test was 0.907. For determining the total test reliability, researcher used
alpha_ KR- 21 formula and it was found that 0.9147.
2.3.1.2 Validity of Memletices Learning Styles Inventory
Content validity was calculated by the researcher for this test. For this purpose the
learning styles test was given to the experts in the field of psychology and education. They
were requested to read and judge the items. Finally the content validity of learning style
inventory was estimated by evaluating the relevance of the items in relation to
instructional objectives and actual subject matter studied.
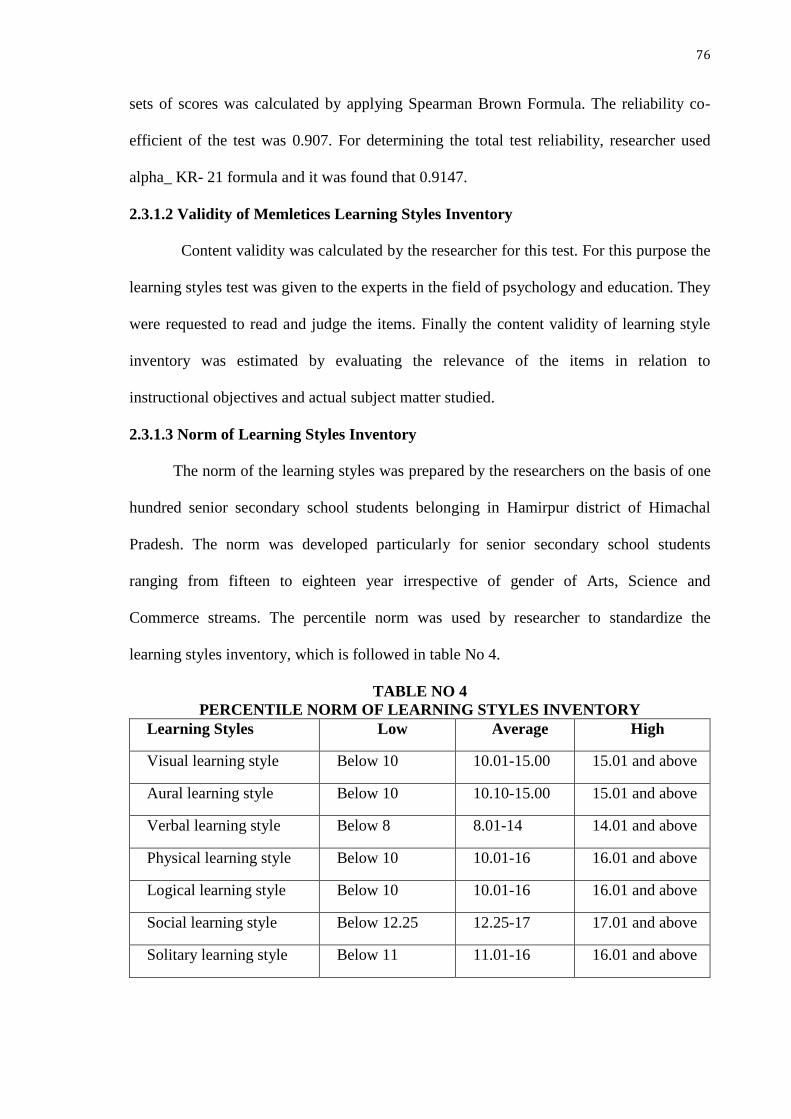
2.3.1.3 Norm of Learning Styles Inventory
The norm of the learning styles was prepared by the researchers on the basis of one
hundred senior secondary school students belonging in Hamirpur district of Himachal
Pradesh. The norm was developed particularly for senior secondary school students
ranging from fifteen to eighteen year irrespective of gender of Arts, Science and
Commerce streams. The percentile norm was used by researcher to standardize the
learning styles inventory, which is followed in table No 4.
TABLE NO 4
PERCENTILE NORM OF LEARNING STYLES INVENTORY
Learning Styles Low Average High
Visual learning style Below 10 10.01-15.00 15.01 and above
Aural learning style Below 10 10.10-15.00 15.01 and above
Verbal learning style Below 8 8.01-14 14.01 and above
Physical learning style Below 10 10.01-16 16.01 and above
Logical learning style Below 10 10.01-16 16.01 and above
Social learning style Below 12.25 12.25-17 17.01 and above
Solitary learning style Below 11 11.01-16 16.01 and above

77
2.3.2 Mangal Emotional Intelligence Inventory
Mangal‟s emotional intelligence inventory was developed and standardized by
S. K. Mangal and Shubhra Mangal (2004). This test was intended to measure emotional
intelligence of sixteenth and above age group of school, college and university students, in
respect to four aspects of emotional intelligence namely, intra-personal awareness
(knowing about one‟s own emotions), inter-personal awareness ( knowing about other
emotions), intra-personal management (managing one‟s own emotions) and inter-personal
management ( managing other emotions). It has one hundred items, twenty five each from
the four areas to be answered by yes or no. while constructing items for each of these
areas, due care was taken to make use of the simple language and provide will-defined
purposeful statements to the respondents for the assessment of their emotional intelligence.
2.3.2.1 Reliability of Mangal Emotional Intelligence Inventory
The reliability of this inventory was examined through three different methods
namely, split-half method using Spearman-Brown prophecy formula, K-R formula (20)
and test-retest method (after a period of four weeks). The reliability coefficients derived
through these tests are given in the table No 5.
TABLE NO 5
RELIABILITY OF EMOTIONAL INTELLIGENCE INVENTORY
Methods Used N Reliability Coefficient
Split half 600 .89
K-R formula (20) 600 .90
Test-retest 200 .92
2.3.2.2 Validity of Mangal Emotional Intelligence Inventory
The validity of the emotional intelligence inventory has been established by
adopting two different approaches: factorial and criteria related approach.

78
Factorial Approach: For adopting factorial approach inter-correlations among the four
areas of the inventory were calculated. The derived correctional matrix is presented in the
table No 6.
TABLE NO 6
CORRELATION MATRIX OF THE FOUR AREAS OF THE EMOTIONAL
INTELLIGENCE INVENTORY
(N = 600: 300 males and 300 females)
Intra
Personal
Awareness
Inter
Personal
Awareness
Intra
Personal
Management
Inter
Personal
Management
Intra
Personal
Awareness
- .716 .501 .437
Inter
Personal
Awareness
.716 - .452 .480
Intra
Personal
Management
.501 .452 - .476
Inter
Personal
Management
.437 .480 .476 -
Table no 6 reveals that correlations among four areas of inventory vary from .437
to .716 (after testing these correlations at the .01 level – 2 tailed, it was found that all were
significant). Thurston‟s centroid method of factor analysis was employed and after the
extraction of second centroid factor from the first residual matrix, it was amply proved that
the four areas of emotional intelligence inventory are quite interrelated and inter-
dependent among themselves.
Criterion related approach: Two different external measures used for criterion related
approach were (a) Adjustment Inventory for college students developed by A. K. P. Sinha
and R. P. Singh and (b) Emotional Maturity Scale developed by Yasvir Singh and Mahesh
Bhargava. In both these measures the lower scores tend to represent favorable result i.e.
good adjustment and higher level of emotional maturity while in the case of emotional
79
intelligence inventory it goes in the opposite direction i. e. providing lower level of
emotional intelligence.
The validity coefficients (the Product Moment Correlation coefficients obtained
between total scores on Emotional Intelligence Inventory and Adjustment Inventory as
well as Emotional Maturity Scale) obtained through these two measures has been given in
the table No 7.
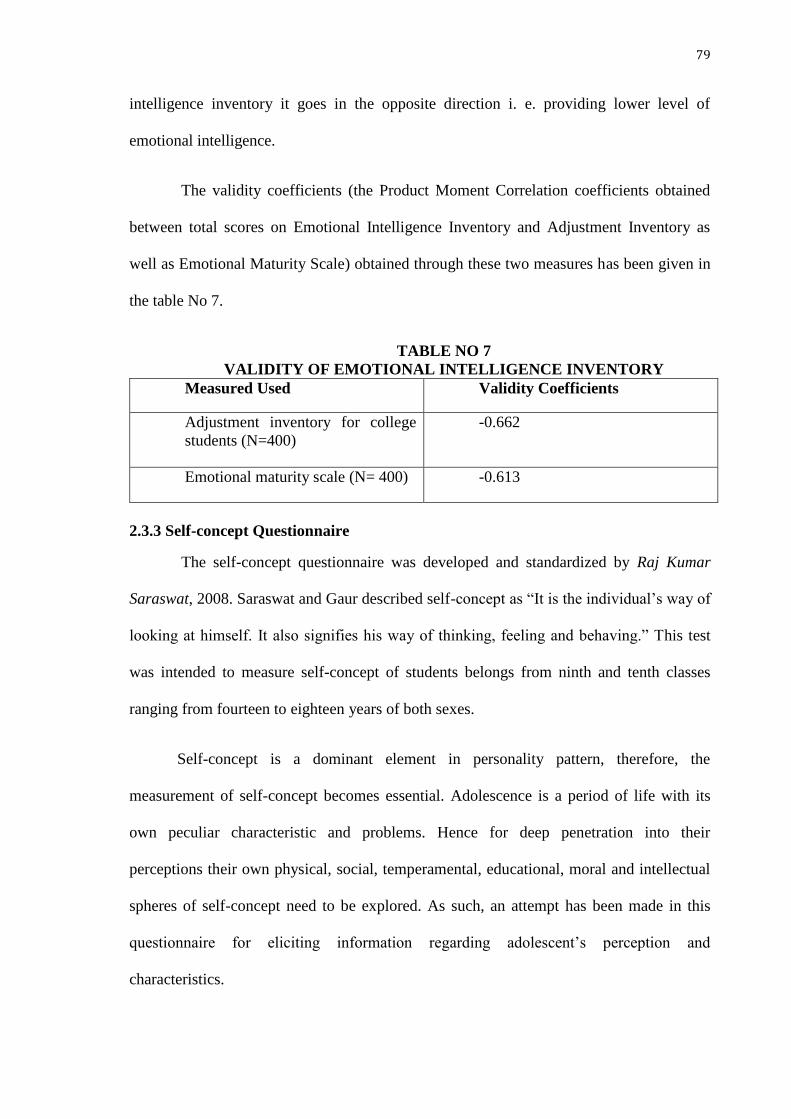
TABLE NO 7
VALIDITY OF EMOTIONAL INTELLIGENCE INVENTORY
Measured Used Validity Coefficients
Adjustment inventory for college
students (N=400)
-0.662
Emotional maturity scale (N= 400) -0.613
2.3.3 Self-concept Questionnaire
The self-concept questionnaire was developed and standardized by Raj Kumar
Saraswat, 2008. Saraswat and Gaur described self-concept as “It is the individual‟s way of
looking at himself. It also signifies his way of thinking, feeling and behaving.” This test
was intended to measure self-concept of students belongs from ninth and tenth classes
ranging from fourteen to eighteen years of both sexes.
Self-concept is a dominant element in personality pattern, therefore, the
measurement of self-concept becomes essential. Adolescence is a period of life with its
own peculiar characteristic and problems. Hence for deep penetration into their
perceptions their own physical, social, temperamental, educational, moral and intellectual
spheres of self-concept need to be explored. As such, an attempt has been made in this
questionnaire for eliciting information regarding adolescent‟s perception and
characteristics.
80
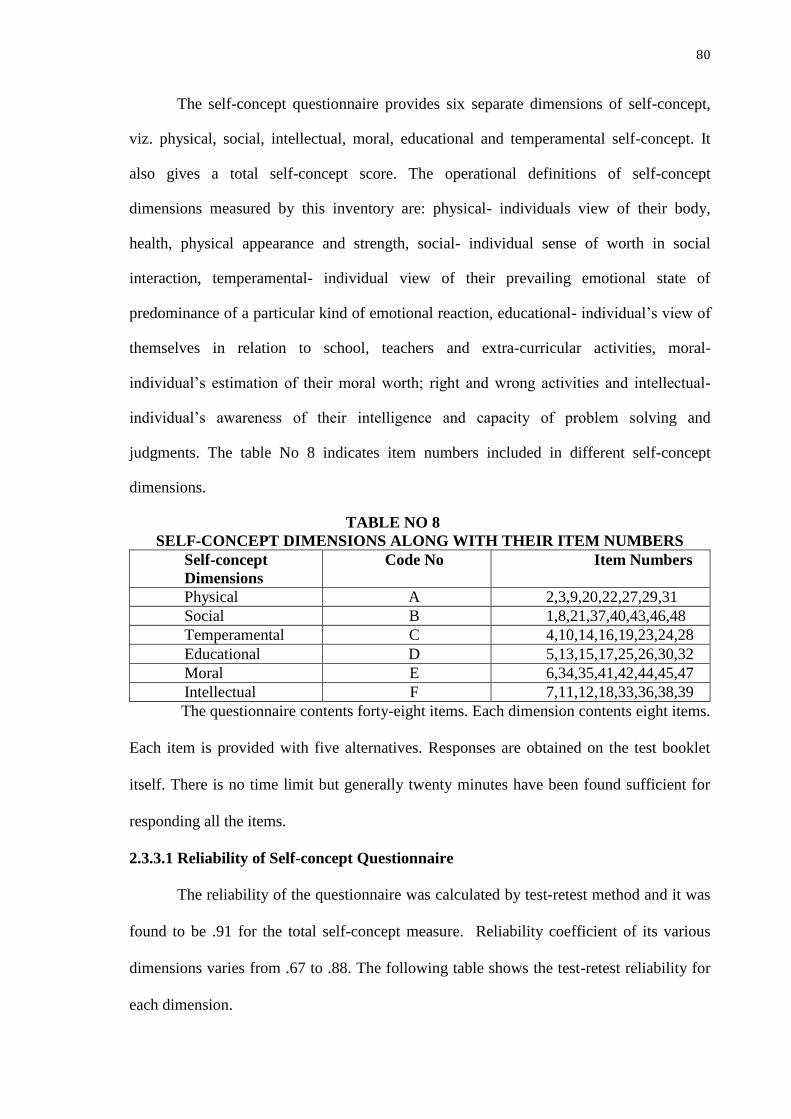
The self-concept questionnaire provides six separate dimensions of self-concept,
viz. physical, social, intellectual, moral, educational and temperamental self-concept. It
also gives a total self-concept score. The operational definitions of self-concept
dimensions measured by this inventory are: physical- individuals view of their body,
health, physical appearance and strength, social- individual sense of worth in social
interaction, temperamental- individual view of their prevailing emotional state of
predominance of a particular kind of emotional reaction, educational- individual‟s view of
themselves in relation to school, teachers and extra-curricular activities, moral-
individual‟s estimation of their moral worth; right and wrong activities and intellectual-
individual‟s awareness of their intelligence and capacity of problem solving and
judgments. The table No 8 indicates item numbers included in different self-concept
dimensions.
TABLE NO 8
SELF-CONCEPT DIMENSIONS ALONG WITH THEIR ITEM NUMBERS
Self-concept
Dimensions
Code No Item Numbers
Physical A 2,3,9,20,22,27,29,31
Social B 1,8,21,37,40,43,46,48
Temperamental C 4,10,14,16,19,23,24,28
Educational D 5,13,15,17,25,26,30,32
Moral E 6,34,35,41,42,44,45,47
Intellectual F 7,11,12,18,33,36,38,39
The questionnaire contents forty-eight items. Each dimension contents eight items.
Each item is provided with five alternatives. Responses are obtained on the test booklet
itself. There is no time limit but generally twenty minutes have been found sufficient for
responding all the items.
2.3.3.1 Reliability of Self-concept Questionnaire
The reliability of the questionnaire was calculated by test-retest method and it was
found to be .91 for the total self-concept measure. Reliability coefficient of its various
dimensions varies from .67 to .88. The following table shows the test-retest reliability for
each dimension.

81
TABLE NO 9
TEST-RETEST RELIABILITY OF THE SELF-CONCEPT QUESTIONNAIRE
Code
No
Self-concept Dimensions No of Items Reliability Coefficients
A Physical 8 .77
B Social 8 .83
C Temperamental 8 .79
D Educational 8 .88
E Moral 8 .67
F Intellectual 8 .79
Total 48 .91
2.3.3.2 Validity of Self-concept Questionnaire
Expert opinions were obtained to establish the validity of the questionnaire. 100
items were given to twenty five psychologists to classify the items into the category to
which it belongs. Items of highest agreement and not less than 80% of agreement were
selected. Thus the content and construct validity were established.
2.3.4 Sharma Academic Achievement Motivation Test
Sharma academic achievement motivation test was developed and standardized by
T. R. Sharma (1984). This test was intended to measured academic achievement
motivation of fifteenth and above students. This test has thirty-eight items, which was
divided as positive and negative items. For positive items one mark was awarded if
response (√) was given in A box and zero for B box. For negative items one mark was
awarded if response (√) was given in B box and zero for A box. The score of thirty three
or above represented as high achievement motivation and the score of twenty five or
below stated as low achievement motivation of students.
2.3.4.1 Reliability of Academic Achievement Motivation Test
The reliability of the achievement motivation test was determined by three
methods i.e. Split-half, Rational Equivalence and Test-Retest method. The reliability of
split-half method was established with the total N = 100. The score of odd items was 1355
and an even item was 1400. The reliability of split-half test was found to be 0.53 and
82
whole test was 0.697. The reliability of rational equivalence method was found that r
=0.75. The reliability of test-retest method was found to be 0.795 for boys (298) and 0.80
for girls (301).
2.3.4.2 Validity of Academic Achievement Motivation Test
Three types of validities – content, criterion and construct, were established. The
item of the test was selected on the basis of pooled judgment of nearly forty exports in the
field of testing. This sufficed for content validity. For criterion validity, on the basis of
considered judgments of class teachers, twenty students; ten low on achievement
motivation and ten high on achievement motivation were administered this test under
standardization. Significant differences (t = 6.30) were found in the mean test-scores of the
two groups. For construct validity, SK Boys = -0.4315, SK Girls = -0.4189 and Ku Boys =
0.2280, Ku Girls = 0.3612 were represented normally distributed score in the test.
2.4 Procedure of Data Collection
The investigator visited the schools personally for the collection of necessary data.
The researcher took the prior permission of the Head teacher of the schools for data
collection and then discussed with heads of the respective schools and sought the
permission from them for data collection.
At the time of administration of the test, necessary steps were taken into
consideration. Necessary precautions were taken in such school. After being satisfied with
the arrangement, the investigator instructed the students to do assignment carefully. Before
the students attempted at the tests, instructions were made clear with regard to each test
used in the study. They were also informed that their academic career would not be
affected as it was only an exercise for research purpose and their responses would keep
strictly confidential.
83
Then the tools were given to the students one after another but not simultaneously.
They were given sufficient time for answering the tests. The researcher was collected the
tools individually. Hence the researcher was given thanks to the students for attempting
the questions sincerely and thanks staffs for their co-operation in the school.
2.5 Scoring Procedure
2.5.1 Scoring Procedure of Memletices Learning Styles Inventory
The memletices learning styles inventory classified into seven categories. These
are visual learning style, aural learning style, verbal learning style, physical learning style,
logical learning style, social learning style and solitary learning style containing each ten
items. The total learning styles inventory was containing seventy items. Each item has
provided three alternatives i.e. Disagree (0), Agree (1), and Complete Agree (2) having
zero mark for disagree, one mark for agree and two marks for complete agree. The
summation of the scores of every item of each learning styles was represented as preferred
learning style of the individual. Same scoring procedure was applied for each item.
2.5.2 Scoring Procedure for Emotional Intelligence Inventory
The scoring procedure of this inventory has been done with the help of stencil. The
mode of response to each of the item of the inventory is in the form of a forced choice i. e.
either yes or no, indicating complete agreement or disagreement with the proposed
statement respectively. In the present emotional intelligence inventory the items having
the response „yes‟ and „no‟ are for the lack of emotional intelligence. Similarly, there are
an items having „no‟ response provides clue for the presence of emotional intelligence and
„yes‟ for its absence.
For scoring one mark is to be provided for the response indicating presence of
emotional intelligence and zero for the absence of emotional intelligence. The list of the
responses of the terms indicative of the presence or absence of emotional intelligence is
provided here in table No 10.
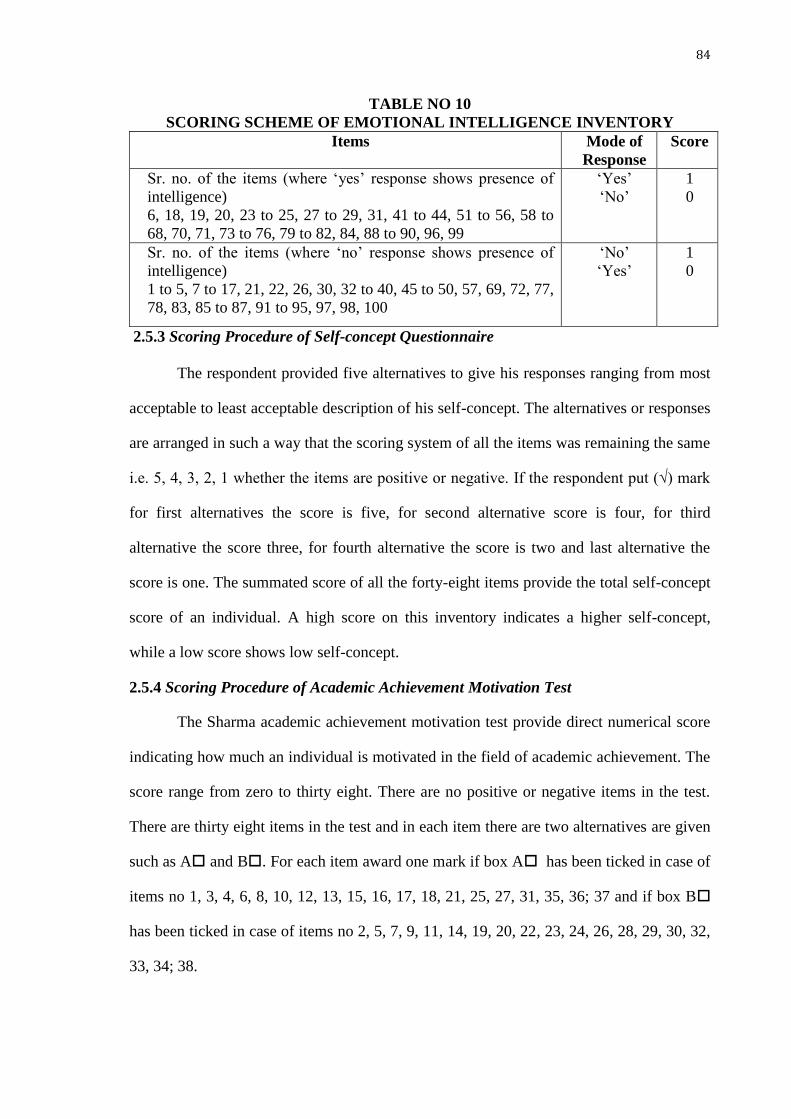
84
TABLE NO 10
SCORING SCHEME OF EMOTIONAL INTELLIGENCE INVENTORY
Items Mode of
Response
Score
Sr. no. of the items (where „yes‟ response shows presence of
intelligence)
6, 18, 19, 20, 23 to 25, 27 to 29, 31, 41 to 44, 51 to 56, 58 to
68, 70, 71, 73 to 76, 79 to 82, 84, 88 to 90, 96, 99
„Yes‟
„No‟
1
0
Sr. no. of the items (where „no‟ response shows presence of
intelligence)
1 to 5, 7 to 17, 21, 22, 26, 30, 32 to 40, 45 to 50, 57, 69, 72, 77,
78, 83, 85 to 87, 91 to 95, 97, 98, 100
„No‟
„Yes‟
1
0
2.5.3 Scoring Procedure of Self-concept Questionnaire
The respondent provided five alternatives to give his responses ranging from most
acceptable to least acceptable description of his self-concept. The alternatives or responses
are arranged in such a way that the scoring system of all the items was remaining the same
i.e. 5, 4, 3, 2, 1 whether the items are positive or negative. If the respondent put (√) mark
for first alternatives the score is five, for second alternative score is four, for third
alternative the score three, for fourth alternative the score is two and last alternative the
score is one. The summated score of all the forty-eight items provide the total self-concept
score of an individual. A high score on this inventory indicates a higher self-concept,
while a low score shows low self-concept.
2.5.4 Scoring Procedure of Academic Achievement Motivation Test
The Sharma academic achievement motivation test provide direct numerical score
indicating how much an individual is motivated in the field of academic achievement. The
score range from zero to thirty eight. There are no positive or negative items in the test.
There are thirty eight items in the test and in each item there are two alternatives are given
such as A and B. For each item award one mark if box A has been ticked in case of
items no 1, 3, 4, 6, 8, 10, 12, 13, 15, 16, 17, 18, 21, 25, 27, 31, 35, 36; 37 and if box B
has been ticked in case of items no 2, 5, 7, 9, 11, 14, 19, 20, 22, 23, 24, 26, 28, 29, 30, 32,
33, 34; 38.

85
2.6 Statistical Techniques Used
Statistics is a mathematical technique or process of gathering, describing,
organizing, analyzing and interpreting numerical data. The statistical techniques are used
to give meaningful and considerable picture of whole data so that it could be easily
comprehended. It was employed to test the hypotheses of the study.
For the present study, the following statistical techniques were used for the
analysis and interpretation of data:
i. Range: The range was used to describe the difference between minimum and maximum
scores of each learning style of senior secondary school students.
ii. Mean: The mean value was computed to describe status of learning style of senior
secondary school students.
iii. Standard deviation: The standard deviation was used to know most reliable measure of
variability in each learning styles of senior secondary school students.
iv. Correlation: The Pearson correlation was used to describe magnitude and direction of
relationship between independent variables (emotional intelligence, self-concept and
achievement motivation) and dependent variable (Learning styles).
v. F-test: The Analysis of Variance (ANOVA) was used to find out interactional effect of
emotional intelligence, self-concept and achievement motivation (independent variables)
on learning styles (dependent variable) of senior secondary school students.
-------- X --------