chapter iii research methoddigilib.uinsby.ac.id/1620/5/bab 3.pdf · analytical exposition text...
TRANSCRIPT
39
CHAPTER III
RESEARCH METHOD
This chapter is purposed to find out whether or not the students who are
taught analytical exposition text using VOA Special English Audio Podcast have
better writing achievement than those who are not taught analytical exposition
text using VOA special English audio podcast. In addition, it is purposed to
explore whether or not the students can be motivated in learning writing analytical
exposition text through VOA Special English Audio Podcast. This chapter is
discussed the method that was used in this research. They are research design,
research variables, population and sample, research procedure, data and source of
data, data collection technique, instrument of the study, validity and reliability,
data analysis procedure and hypothesis.
A. Research Design
The research design for this research defined into two parts. The first research
is Quasi- Experimental research design which is aimed for answering the research
question. This is the major research design for research design. Because of the
second research question is about qualitative research, the secondary research
design is descriptive qualitative research design.
1. Quasi- Experimental Research Design
This research is purposed to find out the better achievement on writing
analytical exposition text between students who are taught using VOA Special

40
English audio podcast and students who are taught using conventional teaching.
Because it studied the different teaching technique in using authentic materials,
the appropriate research design was quasi- experimental research. According to
Ary et al, quasi- experimental is experimental research design that has lack
randomization of group1. It is appropriate to be applied with the education system
which did not allow to takes the random sample for doing research in the school.
Quasi- experimental needed two similar groups as the sample of the research.
As Latief states that quasi- experimental research is the research which takes
sample from two different classes in the same grades which has similarity2. The
classes are experimental group and control group3. The experimental group was
the group who taught writing analytical exposition text using VOA Special
English audio podcast. In the other hand, the control group was the group who are
not taught writing analytical exposition text using VOA Special English audio
podcast.
b. Qualitative research design.
This qualitative research designed to answer the students’ motivation in the
experimental group of this research. As Ary stated that qualitative research design
was aimed to interpret the behaviour and intention of the sample4. It means that it
1 Donald Ary, Jacobs, LC, and Razavieh, An Introduction to Research in Education: Third Edition
(New York: CBS College Publihing, 1985) 302 2 M. Adnan Latief, Tanya Jawab Metode Penelitian Pembelajaran Bahasa (Malang: UM Press,2010)
120 3 Ibid 171-121
4 Donald Ary, Jacobs, LC, and Razavieh... p.424
41
focused on how the human interpret or understand their experience. Therefore, the
interview was used to know the students’ experience in the experimental group
after getting treatment using VOA Special English audio podcast. The appropriate
sampling for doing interview in this research is purposive sampling5. It is
purposed to know the opinion or the students’ sense of experimental group after
getting treatment. The sample for this research is 15 students as the representative
for experimental group’s students. As Ary stated that the sample for purposive
sampling is the representative from the population.6
B. Research Variables
a. Independent variable
Independent variable is also known as stimulus variable predictor variable
and antecedent variable7. Independent variable is variable that give effect to the
dependent variable8. Based on the theories, independent variable is treatments
which are given to the sample of the research. So, VOA special English audio
podcast was the independent variable in this research.
b. Dependent variable
Dependent variable is also known as output variable, criteria variable, and
consequent variable9. Dependent variable is variable that is the effect of the
5 Donald Ary, Jacobs, LC, and Razavieh... p.423
6 Donald Ary, Jacobs, LC, and Razavieh...p. 156
7 Sugiyono, Statistika Untuk Pendidikan, (Bandung: Alfabeta, 2011)4
8 Ibid
9 Ibid
42
independent variable10
. It means that dependent variable is the products which are
produce by the students. So, writing skill on analytical exposition text of the
eleventh graders became dependent variable in this research.
C. Population and Sample
Identifying the target population is needed to be done firstly in sampling of
the research. According to Ary, the first step in sampling is identifying the target
population which hopes to generalize the results of the study.11
The target
population for this research was the senior high school which has some problems
in English writing skill. Yet, it was difficult to select all of the target population.
It would be expensive and need much to finish the research. So, defining the
accessible population is needed because this research need the population of
subjects which accessible to the researcher for choosing sample.12
The accessible
population of this research was SMAN 1 Waru. SMAN 1 was selected as the
accessible population because it was one of the schools which has very good
quality in education in Sidoarjo. Besides proved by its A very good criteria in
accreditation of state senior high school in Sidoarjo, the good quality of the
school was proved by the students’ participation in English competition. They
often win in speaking competitions, such as speech contest held by university in
Surabaya, speech contest held around senior high school in Sidoarjo, speech
contest, and so on. One of them got the 2nd
winner of the speech contest in
10
Ibid 11
Donald Ary, Jacobs, LC, and Razavieh.............. 149 12
ibid

43
Sidoarjo area. The other students have passes other prestige English
competencies. Yet, most of them are mastered in speaking skill.The students’
participation indicated that the students were interested in learning English.
After identifying the population, selecting the sample is needed to be
considered. The classes which were used as the experimental and control group
were selected based on the sampling technique. The sampling technique for this
research was cluster sampling. According to Ary states that cluster sampling is
taking sample from groups not an individual from the one place.13
So, the cluster
is taken from the groups which have similarity in writing skill. XI- S2 was
selected as experimental group and XI-S3 was selected as the control group based
on the English teacher’s recommendation at SMAN 1 Waru. There were 30
students of XI- S2 and 30 students XI- S3.
The sample of this research was the eleventh graders. They were not the new-
comers in the school. In addition, they also have problems in writing skill.
Because of they were not in preparation of National Examination, they have a lot
of time to reduce their problem in writing skill. This research expected to help
them in improving their English writing skill.
D. Research procedure
The research procedure was administered into four steps: conducting pretest,
giving treatments, administering post test and interview. For answering the first
research question, the researcher collected data from pretest and post test. The
13
Ibid, p.154

44
pretest and post test were collected from the experimental group and the control
group. In addition, for answering the second research question, the data were
collected from interview to the students in the experimental group. The interview
was conducted after the post test in the experimental group. The research schedule
can be seen in the following table:
Table 3.1
Research Schedule
NO. EXPERIMENTAL GROUP CONTROL GROUP
DATE ACTIVITY DATE ACTIVITY
1 July 19th
2013 Conducting Pretest July 17
th
2013 Conducting Pretest
2 July 23rd
2013
Giving 1st treatment:
Explanation of
analytical exposition
text and teaching
using VOA Special
English audio podcast
with topic “doing
exercise”
July 20th
2013
Giving 1st treatment:
Explanation of
Analytical
exposition text and
teaching using
conventional
teaching with the
topic “doing
exercise”
3 July 24th
2013
Giving 2nd
treatment:
Explanation of
analytical exposition
text and teaching
using VOA Special
English audio podcast
with topic “smoking”
July 23rd
2013
Giving 2nd
treatment:
Explanation of
Analytical
exposition text and
teaching using
conventional
teaching with the
topic “smoking”
4 July 26th
2013 Administering Post
test
July 27th
2013
Administering Post
test
5 July 26th
2013 Interview - -
45
1. The Experimental Group
The students of experimental group were the students of XI- IPS 2. In
experimental group, the research was conducted in some steps. The steps are
conducting pre-test, giving treatments, administering post test and interview. The
treatments for students in experimental group was taught writing using VOA
Special English audio podcast
a. Conducting Pretest
The pretest was conducted on July 19th
2013. It was conducted to know the
students’ capability in writing analytical exposition text before getting treatments.
The pretest was conducted in 45 minutes. In pretest, the students composed an
analytical exposition text based on the topic “BlackBerry Mobile Phone”. Before
the students did the pretest, the researcher has explained briefly about analytical
exposition text. A brief explanation was to ensure that they wrote the text in the
right organization of analytical exposition text. To help the students in doing the
pre-test, the researcher elicited them about the advantages and the disadvantages
about the use of BlackBerry mobile phone. So, they have many ideas to be written
in their task.
b. Treatments
The treatments in experimental group were administered in two meetings.
Each treatment was done in 60 minutes. The treatments were conducted using
authentic material from the news in VOA Special English audio podcast (see

46
appendix 2). The script of VOA Special English audio podcast can bee seen in the
appendix 7. The first treatments were conducted on July 23rd
2013 using topic
“Doing Exercise”. In the first activity, the researcher explained first about
analytical exposition text. Afterwards, the researcher let the students to listen to
the podcast. While listening, they arranged the scramble paragraphs of VOA
script to be good order with their seatmate. After they got their good order
paragraphs, they discussed together. After they understand the content of the
VOA script, they and gave two arguments about it with their seatmate. After they
have two arguments, they have to elaborate two opinions into analytical
exposition text. To ease them in writing analytical exposition text, they did the
task with their seatmate. The second treatment on July 24th
was conducted using
topic “Smoking”. The whole activities were same with first treatment. The
difference was on the topic in each treatment.
c. Post Test
The post test and interview were administered on July 26th
2013. The pre-test
was administered to know the result of the students on writing analytical
exposition text after getting treatments using VOA Special English audio podcast.
In the post test, the students wrote analytical exposition text. The students chose
the topic for writing analytical exposition text by their own. Most of the students
prefer wrote about “Smoking”. The post-test was conducted in 30 minutes.

47
d. Interview
The interview was conducted after the post test finished. It was done using the
interview guidelines (see appendix 5). The interview was aimed to explore
whether or not the students can be motivated after getting treatments using VOA
Special English Audio Podcast. The sample of the interview was taken randomly.
The sample for interview was 15 students as the representative of students in the
experimental group. The interview was conducted in 30 minutes.
2. The Control Group
In the control groups, the steps of research were conducting pretest, giving
treatments, and administering post test. The treatments did using conventional
teaching. The members of control group were the students of XI-IPS class. The
following activities were:
a. Conducting Pretest
The pretest was conducted on July 17th
2013. The pretest was conducted to
know the students’ writing capability before getting treatments. The pretest did in
45 minutes. In pretest, the task was same with the task in experimental group. The
students wrote an analytical exposition text based on the topic “BlackBerry
Mobile Phone”. Before the students started doing the pretest, the researcher has
explained briefly about analytical exposition text. A brief explanation was to
ensure that they wrote the text in the right organization of analytical exposition
48
text. In addition, the researcher elicited them about BlackBerry mobile phone to
ease them doing the pre-test.
b. Giving Treatments
The treatments on control group were same conventional teaching way which
is usually used by the English teacher there (see appendix 2). The treatments in
control group were done twice. Each treatment was given in 60 minutes. The first
treatment was done on July 20th
2013. The first activity was explaining analytical
exposition. Afterwards, the students were let to read an analytical exposition text
which is the topic is Exercise. To ease them understand the text, the researcher let
them to ask some difficult vocabularies of the text. To ensure that they already
understand the content of the text, some questions were asked to the students. In
the next activity, they were let to mention their arguments about the content of the
text in the white board. After the teacher checked their arguments, the researcher
let them to choose two arguments in the board and elaborate the arguments into
analytical exposition text. They allowed to write analytical exposition text with
their seatmate. The second treatments did on July 23rd
2013. The activities in the
treatment were same with the first treatment. The difference was on the topic in
each treatment. The topic in second treatment was “Smoking” (see appendix 2).
c. Administering Post Test
The post test was done on July 27th
2013. The post test was administering in
30 minutes. It was aimed to know the students achievements in writing analytical

49
exposition text after getting treatments using conventional teaching. The post test
was same with the post test in experimental group. The students wrote the
analytical exposition text. They chose the topic by their selves.
E. Data Collection Technique
The first data collection technique was collected by try-out test. It was for
measuring the reliability and validity of the test. The other major data were
collected from pre-test, post test and interview.
a. Pre Test
The pre-test was conducted for both of groups, experimental group and
control group. Pre-test in experimental group was done on July 19th
2013 and
in control group on July 17th
2013. Pretest was aimed to measure students’
achievement before getting treatment. In scoring the result of pretest, the
researcher used writing scoring profile adapted from Jacob et, al (see appendix
1).14
Students’ pretest was scored in five criteria in writing text. The criteria
were content, organization, vocabulary, language use and mechanic.
b. Post Test
The post test was conducted for both of groups, experimental group on
July 26th
2013 and control group on July 27th
2013. The post test was
conducted to find out the students’ achievements after getting treatments. In
scoring the result of post test, the researcher used writing scoring profile
14
Arthur Hughes, Testing For Language Teacher (United Kingdom: Cambridge University Press,
2003) 100

50
adapted from Jacob et, al (see appendix 1).15
Each student’s post test scored in
five criteria in writing text. The criteria were content, organization,
vocabulary, language use and mechanic.
c. Interview
The interview was conducted to explore students’ motivation after getting
treatment on writing analytical exposition text using VOA Special English
audio podcast. According to Irving, the aim of interview is for interest
understanding of people’s experience and the meaning of their experience for
theirselves.16
The interview was done for 15 students as the representative of
experimental group. The questions in interview guidelines were based on
motivation indicator by Sardiman (See Appendix 5).17
d. Documentation
The data were documented to support the instrument of the test. The
documentation collected from lesson plans (See Appendix 2), students’ score
(see appendix 3 and appendix 4) and students’ writing.
F. Instrument of The Study
The instruments for the research were test, interview guidelines, and
documentation.
15
Ibid 16
Irving Seidman, Interviewing as Quaitative Reseach: A Guide for Researchers in Education and
Social Science (USA: Teachers College Press, 2006) 9 17
Sardiman A. M, Interaksi dan motivasi belajar mengajar (Jakarta: CV Rajawali, 1990) 88

51
a. Test
The tests were pre-test and post test. The tests were conducted on
experimental group and control group.
b. Interview guidelines
The interview guidelines were some questions for interview that related to the
research. It is delivered to the students of experimental group during the
interview. The interview guidelines were some questions related to the indicators
of students’ motivation by Sardiman (see appendix 5).
c. Document
The documents for the research were lesson plans for treatments in the
experimental group and the control group, students’ pretest and post test. In
addition, students’ score and students’ composition were attached as the
document for this research (see appendix).
G. Validity and Reliability
a. Validity
According to Ary, et all, validity is “the extent to which an instrument
measured what it claimed to measure. The focus of recent views of validity is not
on the instrument itself but on the interpretation and meaning of the scores
derived from the instrument”18
. So, the validity is related to the instrument of the
research. For this research, the researcher chooses content validity. The standard
of content validity is the degree to which the sample of items, tasks, or questions
18
Ary, et. al, p. 225

52
on a test are representative of some defined universe or domain of content 19
.
Content validity is related to the content of the test. It means that content validity
is related to the content of items in the test that is available in the curriculum. To
strengthen the validity of the instrument, the validity also took from the English
teacher at SMAN 1 Waru and the expert of writing skill, the lecturer of English
Education Department (see appendix).
b. Reliability
Reliability referred to the consistency of test score from one measurement to
another. In measuring the reliability, test-retest was used. As Sugiyono stated that
test re-test is the way in measuring the instruments which done twice20
. The test-
retest was done in the same subject and the same task but in the different time.
The data for testing the reliability of the test came from score of try-out test.
Try-out test was conducted on July 15th
2013 and July 16th
2013. The members of
try-out test were the students that were not from the experimental group nor
control group. The members of try-out test were thirty students of XI-IPS 1.
The data was calculated by using manual calculation. The first step, the
researcher needed to calculate the mean of try-out test with the following step:
Table 3.2
Calculation of Try-out 1 and Try-out 2 of The Test
19
Ibid 20
Sugiyono, Statistik Untuk Penelitian (Bandung: AlfaBeta, 2011) 354
Subject X Y X2 Y
2 X.Y
1 76 76 5776 5776 5776
2 73 76 5329 5776 5548

53
The next step was calculating the reliability with the product moment
formula:21
21
Ibid 356
3 78 78 6084 6084 6084
4 76 77 5776 5929 5852
5 78 78 6084 6084 6084
6 77 77 5929 5929 5929
7 75 77 5625 5929 5775
8 80 81 6400 6561 6480
9 72 78 5184 6084 5616
10 75 75 5625 5625 5625
11 76 79 5776 6241 6004
12 77 77 5929 5929 5929
13 76 77 5776 5929 5852
14 76 76 5776 5776 5776
15 73 73 5329 5329 5329
16 75 75 5625 5625 5625
17 77 77 5929 5929 5929
18 78 79 6084 6241 6162
19 75 76 5625 5776 5700
20 80 80 6400 6400 6400
21 78 78 6084 6084 6084
22 75 77 5625 5929 5775
23 80 80 6400 6400 6400
24 77 77 5929 5929 5929
25 75 75 5625 5625 5625
26 76 77 5776 5929 5852
27 79 79 6241 6241 6241
28 75 77 5625 5929 5775
29 75 79 5625 6241 5925
30 75 76 5625 5776 5700
TOTAL 2288 2317 174616 179035 176781

54
𝑟𝑖 = N∑XY – (∑X) (∑Y
𝑁Σ𝑋2 − Σ𝑋 2 𝑁Σ𝑌2 − Σ𝑌 2
Explanation:
ri : The coefficientt of correlation between variable X and Y.
X : Test score of first try out.
Y : Test score of second try out.
N : The number of the students.
𝑟𝑖 = 𝑁Σ𝑋𝑌 − Σ𝑋 Σ𝑌
𝑁Σ𝑋2 − Σ𝑋 2 𝑁Σ𝑌2 − Σ𝑌 2
𝑟𝑖 = 30(176781) − 2288 2317
30 174616 − (2288)2 30(179035) − 2317 2
𝑟𝑖 = 5303430 − 5301296
5238480 −5234944 5371050 −5368489
𝑟𝑖 = 2134
3536 2561
𝑟𝑖 = 0,71
55
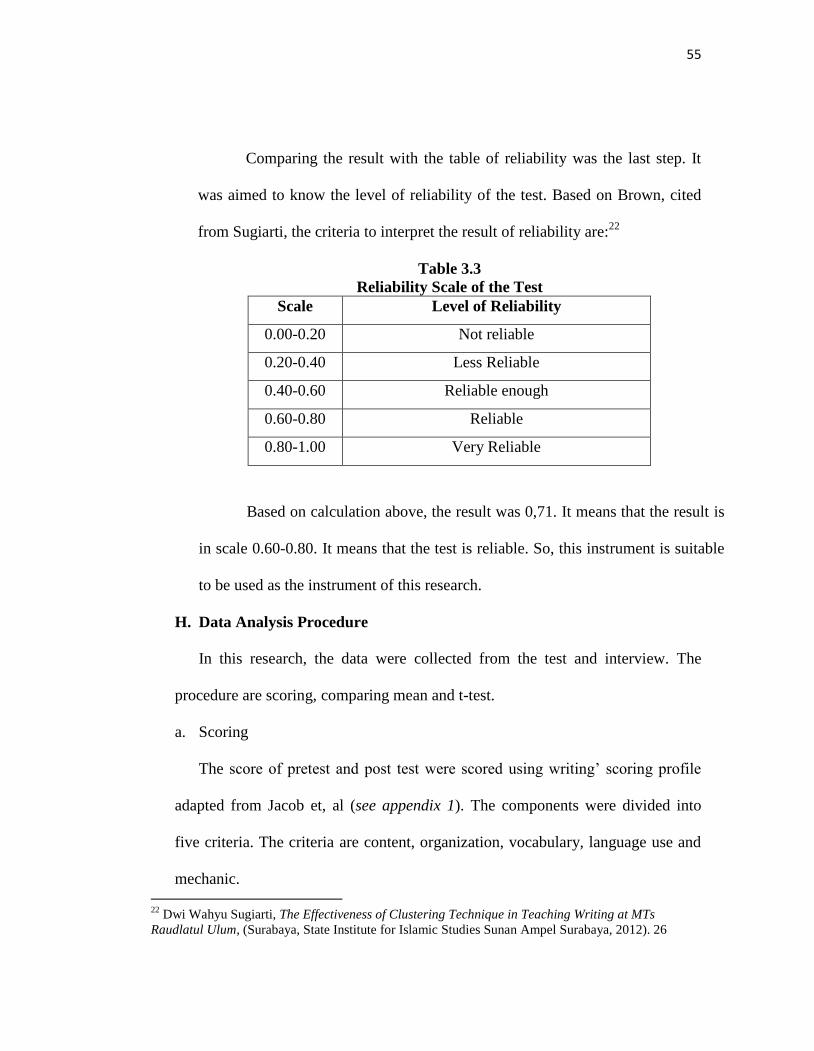
Comparing the result with the table of reliability was the last step. It
was aimed to know the level of reliability of the test. Based on Brown, cited
from Sugiarti, the criteria to interpret the result of reliability are:22
Table 3.3
Reliability Scale of the Test
Scale Level of Reliability
0.00-0.20 Not reliable
0.20-0.40 Less Reliable
0.40-0.60 Reliable enough
0.60-0.80 Reliable
0.80-1.00 Very Reliable
Based on calculation above, the result was 0,71. It means that the result is
in scale 0.60-0.80. It means that the test is reliable. So, this instrument is suitable
to be used as the instrument of this research.
H. Data Analysis Procedure
In this research, the data were collected from the test and interview. The
procedure are scoring, comparing mean and t-test.
a. Scoring
The score of pretest and post test were scored using writing’ scoring profile
adapted from Jacob et, al (see appendix 1). The components were divided into
five criteria. The criteria are content, organization, vocabulary, language use and
mechanic.
22
Dwi Wahyu Sugiarti, The Effectiveness of Clustering Technique in Teaching Writing at MTs
Raudlatul Ulum, (Surabaya, State Institute for Islamic Studies Sunan Ampel Surabaya, 2012). 26

56
In scoring of content, the scoring started ranging from excellent criteria until
poor criteria. The excellent to very good score have 30 until 27 level which the
criteria relevant to assigned topic, the main sentences are clear, and supporting
sentences are related to the topic in terms content the composition. Good to
average score have 26 until 22 level which the criteria are the content of
composition is relevant enough to assigned topic but it lack detail. It means the
main sentences are clear, most of supporting sentences are related to the main
topic, there are a few supporting sentences that are not appropriate. In fair to poor
score the level are 21-17 with the criteria inadequate development of the topic at
the content of the composition, clear enough of main sentences, several
supporting sentences which are not related to the main sentence. The last score in
very poor score have level 16-13 with criteria. The content of the composition is
not relevant to the topic and unclear main sentences and supporting sentences.
In scoring of organization, the scoring started ranging from excellent criteria
until poor criteria. The excellent to very good score have level 20-18. The criteria
are the clearly stated ideas. The composition is cohesive and well organized by on
the generic structure. In good to average score, the levels are 17 until 14. The
criteria are the structure of the composition is logical but it is in incomplete
sequence. In fair to poor score, the levels are 13 until 10. The criteria are the
structure is lack logical sequencing and development. The last score is very poor
57
level which has level 9-7. It means that the ideas are not clearly stated and the
organization of the composition is poor
The third score was vocabulary. The scoring started from excellent until very
poor score. In excellent to very good score, the levels are 20 until 18. The criteria
are effective and appropriate in usage of the chosen vocabularies. In good to
average score, the level is 17 until 14 with good enough and meaningful the
chosen vocabularies but there are still occasional errors of words/idioms. In Fair
to poor score, the level is 13 until 10. The criteria are chosen vocabulary has
confusing meaning and there are frequent errors of words/idiom in usage. In very
poor, the level is 9-7. The criteria are chosen vocabulary is not related and there a
little knowledge of English vocabulary.
The fourth score was language use. In excellent to very good, the level is 25-
22 with a few errors of agreement, tense, number, word order/function, articles,
pronouns, prepositions. In good to average, the level is 21-18 which have criteria
in several errors of agreement, tense, number, word order/function, articles,
pronouns, prepositions. In fair to poor, the levels are 17 until 11. The criteria are
frequent errors of agreement, tense, number, word order/function, articles,
pronouns, prepositions. In very poor, the level is 10-5. The criteria are dominated
by errors and the language use does not communicate.
The last score is mechanic. The excellent to very good criteria, the level are 5.
The criteria are a few errors of spelling, punctuation, capitalization, paragraphing.

58
In good to average, the level is 4. The criteria are occasional errors of spelling,
punctuation, capitalization, paragraphing. In fair to poor, the level is 3. The
criteria are frequent errors of spelling, punctuation, capitalization, paragraphing.
In very poor, the level is 2. The criteria are dominated by errors of spelling,
punctuation, capitalization, paragraphing.
So, the whole score is 100. It is taken from maximum score in each level at
content 30, organization 20, vocabulary 20, language use 25, and mechanic 5.
b. Comparing Mean
For answering the first research question of the study, it needed to compare
the mean result both experimental and control group. Mean was calculated by
dividing the total of the score with the amount of students in each group of this
research. Using Microsoft Excel was needed to calculate the mean of the test in
experimental group and control group. Afterward, comparing the mean of both
test were conducted to know the higher score between those groups.
c. T-test
T-test was aimed to compare whether the result score of test in both groups
were significantly different. It was utilized to test that the result is not obtain by
chance. The students’ score posttest in the experimental group and the control
group was calculated by using t-test formula23
. The terms in using t-test should
23
Anas Sudijono, Pengantar Statistik Pendidikan, (Jakarta: PT Raja Grafindo Persada, 2006) p.314
59
be in normal distribution and homogeneous variants.24
So, before analyzed the test
using t-test, the data needed to be checked whether or not the data is in normal
distribution and in homogenous variants. The way in checking the normal
distribution was through normality test. In addition, to know the homogenous
variant, the homogenous test was needed to be calculated. The following
procedure of normality test and homogenous test are:
1. Normality test
The normality test is used to check whether the posttest score of
experimental group and control group were normally distribution or not. The
steps are:25
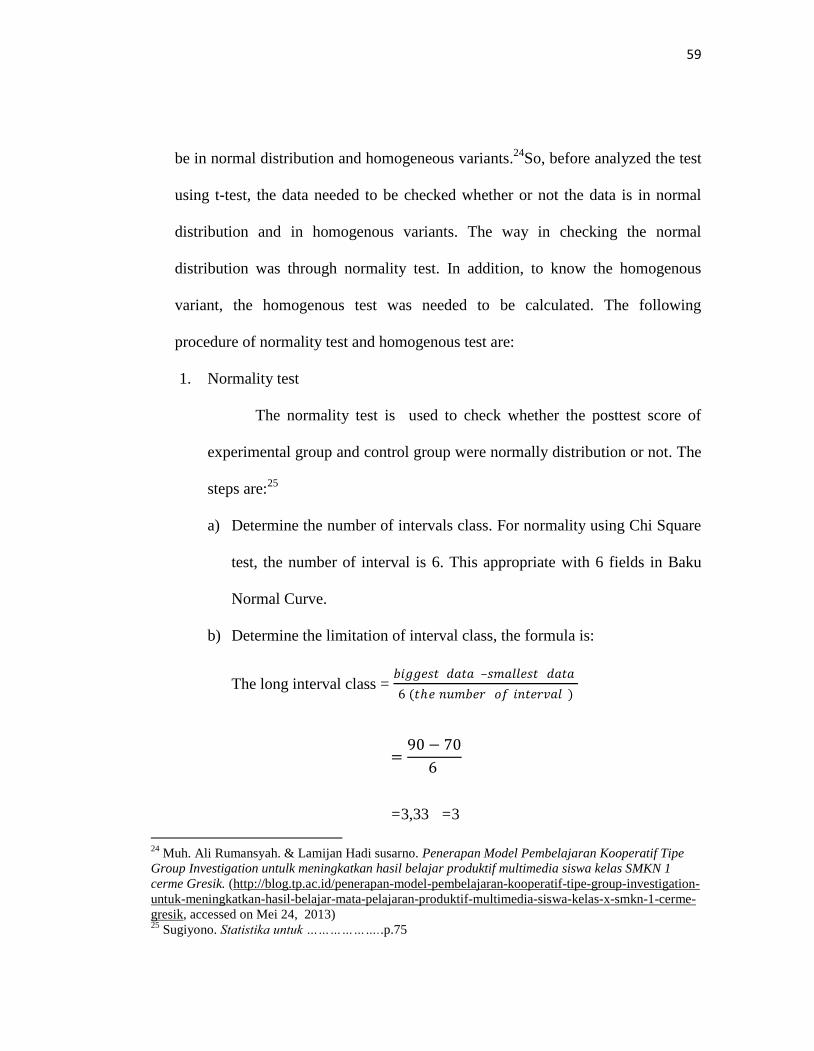
a) Determine the number of intervals class. For normality using Chi Square
test, the number of interval is 6. This appropriate with 6 fields in Baku
Normal Curve.
b) Determine the limitation of interval class, the formula is:
The long interval class = 𝑏𝑖𝑔𝑔𝑒𝑠𝑡 𝑑𝑎𝑡𝑎 –𝑠𝑚𝑎𝑙𝑙𝑒𝑠𝑡 𝑑𝑎𝑡𝑎
6 (𝑡𝑒 𝑛𝑢𝑚𝑏𝑒𝑟 𝑜𝑓 𝑖𝑛𝑡𝑒𝑟𝑣𝑎𝑙 )
=90 − 70
6
=3,33 =3
24
Muh. Ali Rumansyah. & Lamijan Hadi susarno. Penerapan Model Pembelajaran Kooperatif Tipe
Group Investigation untulk meningkatkan hasil belajar produktif multimedia siswa kelas SMKN 1
cerme Gresik. (http://blog.tp.ac.id/penerapan-model-pembelajaran-kooperatif-tipe-group-investigation-
untuk-meningkatkan-hasil-belajar-mata-pelajaran-produktif-multimedia-siswa-kelas-x-smkn-1-cerme-
gresik, accessed on Mei 24, 2013) 25
Sugiyono. Statistika untuk ………………..p.75

60
Based on the calculation above, the smallest data both of group was
70 and the biggest data was 9. The long interval class in each interval was 3
with the number of interval was 6.
c) Arrange the data into a frequency distribution table. The steps are:
1. Calculating 𝑓 (the frequency of the expected) based on the
percentage area of each field in normal curve multiplied by 60 (the
number of individuals in the sample). Number of individuals in the
sample).
- The first line : 2,7 % x 60 = 1,62 is rounded to 2
- The second line : 13,53 % x 60 = 8,118 is rounded to 8
- The third line : 34,13 % x 60 = 20,478 is rounded to 20
- The fourth line : 34,13 % x 60 = 20,478 is rounded to 20
- The fifth line: 13,53 % x 60 = 8,118 is rounded to 8
- The sixth line: 2,7 % x 60 = 1,62 is rounded to 2
2. Taking the value of 𝑓0to the table columns 𝑓 , and then calculating
the value of (𝑓0 − 𝑓)2and(𝑓0− 𝑓 )2
𝑓
Explanation:
𝑓0= Frequency of data from the result of final test
𝑓= Frequency of the expected (percentage area of each field
multiplied by n)
𝑓0 − 𝑓= The differences between 𝑓0dan𝑓

61
3. The last step is arranging the data into a frequency distribution table
Table 3.4
Frequency Distribution Table
INTERVAL 𝒇𝟎 𝒇𝒉 𝒇𝟎 − 𝒇𝒉 (𝒇𝟎 − 𝒇𝒉)𝟐
(𝒇𝟎 − 𝒇𝒉)𝟐
𝒇𝒉
70-73 2 2 0 0 0
74- 77 11 8 3 9 1,125
78-81 22 20 2 4 0,2
82-85 22 20 2 4 0,2
86-89 1 8 −7 49 6,125
90-93 2 2 0 0 0
60 60 0 7,65
Explanation:
𝑓0 = Frequency / the number of data from the result of post-test
𝑓 = The number / frequency of the expected (percentage area of each
field multiplied by n)
𝑓0 − 𝑓= The differences between 𝑓0dan𝑓
4. Conclusion
Based on calculation above, the Chi square quantification was 7,65.
Then, defining the df which was calculated from the amount of interval - 1
or 6-1=5. The alpha that used in this research was 5% because that
percentage was the appropriate percentage in education research. After
that, based on df 5 and alpha 5%, the value of Chi square table can be
known. The value of Chi square table was 11.070.26
Afterwards, it needs
26
Sugiyono, Statistika Untuk Penelitian ( Alfabeta: Bandung: 2011), p 376
62
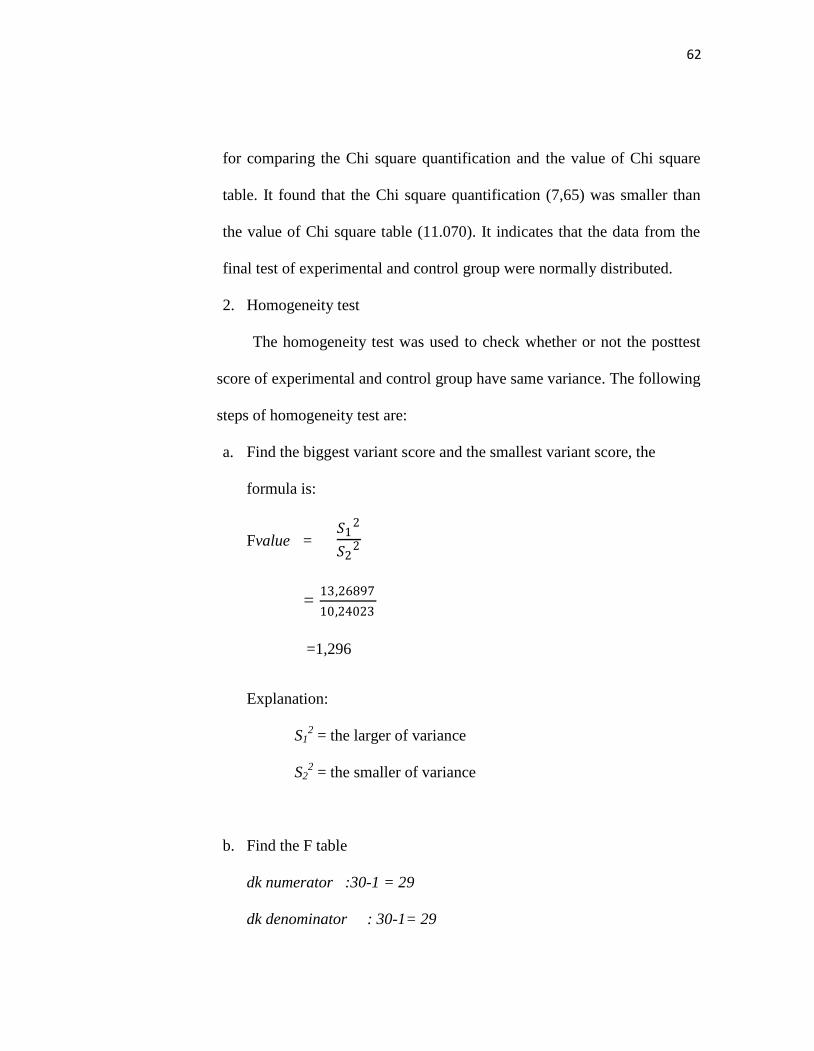
for comparing the Chi square quantification and the value of Chi square
table. It found that the Chi square quantification (7,65) was smaller than
the value of Chi square table (11.070). It indicates that the data from the
final test of experimental and control group were normally distributed.
2. Homogeneity test
The homogeneity test was used to check whether or not the posttest
score of experimental and control group have same variance. The following
steps of homogeneity test are:
a. Find the biggest variant score and the smallest variant score, the
formula is:
Fvalue = 𝑆1
2
𝑆22
= 13,26897
10,24023
=1,296
Explanation:
S12 = the larger of variance
S22 = the smaller of variance
b. Find the F table
dk numerator :30-1 = 29
dk denominator : 30-1= 29

63
F = (0,05 ; 29,29) = 1,99
3. Conclusion
From the calculation above, F value is smaller than the F table. So, it
can be concluded that the score of test both group was in normal
distribution and homogeneous variant. Afterwards, the next step was
analyzing the data by t-test. T-test was utilized to test that the result is not
obtain by chance.
d. Interview
Data from interview were collected from the interview to 15 students as the
representative of experimental group. The result of the interview analyzed
descriptively. The result of interview is described in words rather than numerical.
I. Research Hypothesis
1. If to > tt, it means that Null Hypothesis (Ho) is rejected and Alternative Hypothesis
(H1) is accepted. Thus, Students who are taught analytical exposition text using VOA
Special English audio podcast have better writing achievement than those who are not
taught using VOA Special English audio podcast.
2. If to < tt, it means that Null Hypothesis (Ho) is accepted and Alternative
Hypothesis (H1) is rejected. Students who are not taught analytical exposition text
using VOA Special English audio podcast have better writing achievement than those
who are taught using VOA Special English audio podcast.