chapter one 1 introduction 1.1 background of the … · cleansing action because they contain...
TRANSCRIPT

1
CHAPTER ONE
1 INTRODUCTION
1.1 Background of the Study
Lubricating grease is produced by dispersing thickening agents in mineral or synthetic oil.
Several thickening agents exist but soap-base is the most popular. Several soap bases like
sodium, lithium, calcium, aluminum etc. are used in lubricating grease production. Soap
comprises of the metallic salts of long chain monocarboxylic acids. Generally, soap making
is based on alkaline hydrolysis of fat and oil in a reaction known as saponification, according
to the equations (1.1) and (1.2).
C3H5(OOCR)3 + 3NaOH 3NaOOCR + C3H5OH …. (1.1)
(Fat) (Sodium Hydroxide) (Soap) (Glycerol)
OR
C3H5(OOCR)3 + 3KOH 3KOOCR + C3H5OH … (1.2)
(Fat) (Potassium Hydroxide) (Soap) (Glycerol)
These soaps give different properties to the grease and they have different formulations,
structure, and characteristics. Other thickening agents include Organoclay, Polymer, Silica
etc. All these soaps are formulated from manufactured alkalis. However, there is a prospect
of formulating lubricating grease from alkalis derived from the ashes of agricultural waste
such as plantain peel, since local soap production has been achieved using these alkalis as
reported by Nwoko, (1980) and Onyegbado et. al (2002). According to Adewuji, et al
(2008), several agricultural wastes of vegetable origin yield high potash when combusted.
These materials include plantain peels, cassava peels, palm bunch, wood, cocoa pod, banana
leaves, maize cob, wood, sugar beet waste and many others. When these materials are burnt

2
in air, the resulting ashes contain oxides of potassium and sodium which when dissolved in
water yield the corresponding hydroxides (equations 1.3 and 1.4). These agricultural wastes
are readily and locally available in abundance.
Na2O + H20 2NaOH …… (1.3)
K2O + H20 2KOH ……. (1.4)
As at present, these local alkalis are not used in grease production since no stoichiometry has
been developed for them. The local production of potash from these agricultural wastes has
been observed to be a cheaper alternative source of this much needed chemical used in the
production of soap and other alkalis based products (Adewuji et al, 2008). The making of
soap using vegetable matter has been an age old craft, unfortunately the soaps that were made
then, were soft, black, smelly and corrosive to the hands (Umeh-Idika and Maduakor; 2013)
However Onyeagbado (2004) has produced solid odourless soap using alkali extracted from
plantain peel ash. The ash derived alkali contains varying concentrations of different metals.
Since emulsion of Ca, Li and many other metal soaps and their mixtures are used in most
lubricating greases and are often called thickener (Thorsten et al., 2002), the soap made from
alkali derived from plantain peel ash could be useful as a thickener in lubricating greases and
will be more economical than those from inorganic sources. The presence of other metals
besides K and Na at higher concentrations limits the foamability of the soaps and Olabanji, et
al (2012) suggested that this could be an advantage to use them as grease thickeners since
foamability is not a desirable quality in lubricating greases.
Although at present, palm oil and palm kernel oil for local soap production (as source of fat
and oil) in Nigeria are readily available, nearly all the alkali for soap making is imported

3
(Onyegbado et al 2002). Edewor (1984) estimated an annual availability of over 30,000
tonnes of KOH derivable from cocoa-pod waste alone, in the country, which more than meet
the importation requirements of KOH and NaOH of 26,000 tonnes in 1985 but the knowledge
gap in developing the formulation for using this type of alkali has hampered the technical,
economic and social benefits derivable from their use. Onifade (1994) asserted that the
dumping of cocoa-pod wastes in concentrated heaps on the farms (the usual practice in
Nigeria) was adverse to soil fertility and that hogs and other livestock could not completely
remove the total wastes available, as fodder. According to (Umeh-Idika and Maduakor,
2013) several agricultural wastes are littered all over the environment and accumulation of
these wastes poses a serious health hazard. Apart from being an eyesore, even their proper
disposal is a waste of resources which are potential source of raw materials needed in soap
making. Therefore, such agricultural wastes could be converted to potash and used for soap
making and consequently, lubricating grease production.
1.2 Objective
The objective of the study is:
To produce lubricant grease using alkali derived from plantain peel ash and determine the
combination of reactants that give the best grease consistency.
1.3 Justification of the study
Studies have been conducted on production of soap using alkalis from ashes of agricultural
wastes (Onyeagbado et al, 2004, Onifade, 1994, Olabanji et al, 2012) but there are little or
no information on production of lubricant grease from any of these alkalis. It is therefore
pertinent to conduct studies on the production of lubricant grease using plantain peel ash as
the source of alkali. This will provide the information on the consistency of the grease it can

4
produce and know whether this consistency falls within the acceptable standards. Plantain
peel ash was chosen as the source of the bio-alkali because there is sufficient scientific
information available from the analysis of its alkali from various sources (Nwoko, 1982,
Onyegbado et. al. 2002, and Oluremi et al, 2012). This will enhance straightforward research
on its suitability as a good grease thickener, without recourse to auxiliary analysis of the bio-
alkali extract.

5
CHAPTER TWO
2.0 LITERATURE REVIEW
2.1 Lubrication and Lubricants.
Lubrication is the branch of science that deals with the application of lubricants to moving
machine parts. The functions of lubricants are as follows;
i. To reduce friction between moving parts, and so minimize the frictional effect of metal-to-
metal contact.
ii. To act as a cooling medium by absorbing and dissipating excessive heat generation. For
example, it has been estimated that the big-end bearing of an internal combustion engine
requires approximately 90 times as much lubricant to keep it cool as it requires for the actual
reduction of friction (Culpin, 1981).
iii. To act as a seal for pistons in internal combustion engines, so as to make the combustion
chamber gas tight.
iv. To remove dirt from engine parts, thus keeping them clean and efficient.
These elements move in relation to each other, either by sliding, rolling, approaching,
receding, reciprocating, and angular or by combination of these motions. Improper,
inadequate or excessive, lubrication results in premature failure of machine elements and
consequent high maintenance costs and lower profitability in industries. In fluid dynamics,
lubrication theory describes the flow of fluids (liquids or gases) in a geometry in which one
dimension is significantly smaller than the others. Interior flows are the elements of machines
that require lubrication are those in relative motion namely: gears, bearings, slides, guides-
ways, pistons/cylinders, cam/cam-followers, flexible couplings, pulley/wire ropes etc. those
where the boundaries of the fluid volume are known, and include those inside bearings. Here

6
a key goal of lubrication theory is to determine the pressure distribution in the fluid volume,
and hence the forces on the bearing components. The working fluid in this case is often
termed a lubricant.
Free film lubrication theory is concerned with the case in which one of the surfaces
containing the fluid is a free surface. In that case the position of the free surface is itself
unknown, and one goal of lubrication theory is then to determine this. Surface tension may
then be significant, or even dominant. Issues of wetting and dewetting then arise. For very
thin films (thickness less than one micrometre), additional intermolecular forces, such as
disjoining forces, may become significant. Mathematically, lubrication theory can be seen as
exploiting the disparity between two length scales. The first is the characteristic film
thickness, H, and the second is a characteristic substrate length scale L. The key requirement
for lubrication theory is that the ratio is small, that is, . The Navier-Stokes
equations (or Stokes equations, when fluid inertia may be neglected) are expanded in this
small parameter, and the leading-order equations are then (equations 1.2 and 2.2)
... (2.1)
... (2.2)
Where and are coordinates in the direction of the substrate and perpendicular to it
respectively. Here is the fluid pressure, and is the fluid velocity component parallel to
the substrate; is the fluid viscosity.
Lubricants are introduced to reduce friction between moving surfaces and may also have the
function of transporting foreign particles. The property of reducing friction is known as
lubricity.
A good lubricant possesses the following characteristics:
1. High boiling point.

7
2. Low freezing point.
3. High viscosity index.
4. Thermal stability.
5. Corrosion prevention.
6. High resistance to oxidation.
There are four main types of lubricants. These are solids (e.g. graphite), liquids (e.g. oils),
plastics (e.g. grease) and gases (e.g. air).
2.2 Lubricating Grease
Lubricating grease is generally defined as “a solid to semi-fluid product or dispersion of a
thickening agent in a liquid lubricant. Other ingredients imparting special properties may also
be included” (NLGI, 1987). Grease from the early Egyptian or Roman eras is thought to have
been prepared by combining lime with olive oil
(http://en.wikipedia.org/wiki/Grease_(lubricant). The lime saponifies some of the triglyceride
that comprises oil to give calcium grease. In the middle of the 19th century, soaps were
intentionally added as thickeners to oils (Thorsten et al, 2005). Over the centuries, all manner
of materials have been employed as greases. Black slugs Arion ater were used as axle-grease
to lubricate wooden axle-trees or carts in Sweden (Svanberg, 2006)
2.2.1 Fundamentals of Grease Formulation
Lubricating grease is a complex mixture of alkali, fatty acid (fats and oil), and lubricating oil.
First the alkali reacts with the organic acid to form soap as shown in equations (1.1) and
(1.2). The soap is heated to dehydrate and melt so as to have an intimate mixing with the
lubricating oil to form grease. Soap production started around 2500 BC with boiling of fats

8
with ashes. The formula for soap consisting of water, alkali and cassia oil was written on a
Babylonian clay tablet around 2200 BC (Willcox, 2000). Soaps are salts of fatty acids and it
may be hard or soft soap depending on the type of ingredients used (Okeke, 2009). Soaps are
made by the hydrolysis of fats with caustic soda (Sodium hydroxide), thus converting the
glycosides of stearic, oleic and palmitic acids into sodium salts and glycerol. Soaps have a
cleansing action because they contain negative ions composed of a long hydrocarbon chains
attached to a carboxyl group (Okeke, 2009). The hydrocarbon chain has an affinity for grease
and oil and the carboxyl group has an affinity for water. In other words,
Soap has two dissimilar ends: a hydrocarbon chain, that is non-polar, and a carboxylate salt
end, which is polar as shown in equation (2.3)
O … (2.3)
CH3 (CH2)16C
Sodium stearate, soap
The non-polar hydrocarbon chain is soluble in fats and oil while the polar end is soluble in
water (hydrophilic). So in grease formation, the non-polar hydrocarbon chain causes the soap
to dissolve in the lubricating oil, thereby thickening it. Although the gelling action of all
thickening agent is not fully understood (Nwagbara, 2005), most of the soap types are fibrous
crystallites. Oil is believed to be held in the fibrous structure by capillary forces adsorption on
the gel-formation molecules and physical entrapment within the interlacing fiber structure.
Awoyale et al (2011) also asserted that base oil is trapped in the fibre network of the soap.
The relative importance of each of these mechanisms depends on the type and degree of
O – Na+
Non-polar Polar

9
dispersion of the thickener, the type and solvency of action of the oil, and the influence of
any stabilizing agents and additives. Unfortunately, neither the chemical formula for grease
nor the chemical equation that leads to its formation has been developed yet. Chemical
formula and equation that leads to soap formation has earlier been given in this work.
2.2.2 Fat and Oil
Fats and oils are naturally occurring esters used as energy-storing compounds by plants and
animals. They are derived from propane 1,2,3-triol, CH2OH–CHOH–CH2OH (commonly
known as glycerol or glycerine). This molecule has the capacity to combine with one, two or
three molecules of carboxylic acid. In practice, most fats are triesters derived from propane
1,2,3,-triol and a variety of long-chain carboxylic acids, sometimes called fatty acids.
For example, a simple fat molecule is that derived from a mole of propane – 1,2,3-triol and
three molecules of octadecanoic acid according to the equation (2.4)
CH2OH HOOC(CH2)16CH3 CH2OOC(CH)16CH3
CHOH + HOOC(CH2)16CH3 CHOOC(CH2)16CH3 + 3H2O … (2.4)
CH2OH HOOC(CH2)16CH3 CH2OOC(CH2)16CH3
In naturally occurring fats each molecule is derived from two or three different fatty acids.
Table 2.1 gives some common fatty acids: fifty or so are found in nature, the vast majority
having an even number of carbon atoms in their molecule (Hill and Holman, 1979).
1 Mole of Propane -
1,2,3-triol 3 Moles of octa
-decanoic acid 1 Mole of Propane –
triyl trioctadecanoic
acid

10
Table 2.1: Some common fatty acids
Structure Systematic name Common name Occurrence
CH2(CH2)16COOH Octadecanoic acid Stearic acid Mainly in animal fats
CH2(CH2)10COOH Dodecanoic acid Lauric acid Coconut oil, palm-
kernoloic
CH2(CH2)14COOH Hexadecanoic acid Palmitic acid Most fats especially
palm oil
CH2(CH2)7CH=CH
(CH2)7COOH
Octadec-9-enoic acid Oleic acid Most fats especially
olive ore
Source: (Hill, and Holman 1979)
Fats containing large proportion of unsaturated acids tend to have low melting points: many
are liquid at room temperature and these are called oils. They can be converted to solid fats
by hydrogenation.
2.2.3 Liquid Lubricant
Lubricants commonly used in grease production are either derived from mineral oils or are
classified as synthetic. The synthetic oils available are based on esters derived from animal or
vegetable oils and other groups are derived from hydrocarbons (Liyedahl et al 1979).
However, lubricants that are derived from mineral oils predominate.
Mineral lubricants are obtained from crude petroleum and change very little on exposure to
the air. A great variety of lubricants are produced, ranging from light to heavy oils. Crude oil
is a complex mixture of hydrocarbons, mainly alkanes, cycloalkanes and aromatic. The
residual oil from the primary distillation boils above 3500C and is a highly complex mixture

11
of involatile hydrocarbons. Most of it is used as fuel oil in large furnaces such as those in
power station or big ships. A proportion of it, however, is used to make lubricating oil and
waxes. Both these materials contain C26 – C28 hydrocarbons; when pure these hydrocarbon
are solid, but lubricating oil contains a complex mixture, each member of which depresses the
melting point of the others so that the mixture is a liquid.
2.2.4 Types of Grease
There are seven types of grease available, each manufactured for special purposes. These
include wheel bearing grease, universal joint grease, chassis grease, extended lubrication
interval (ELI), multipurpose grease, extreme pressure grease (EP), and spindle grease.
Generally speaking, greases are those lubricants, which at ordinary temperatures are in a
solid, plastic state. Greases that are in a more fluid state are sometimes called semi fluid oils.
2.2.5 Classification
Greases may be classified according to their method and mode of manufacture; those
obtained by saponification with a metallic base like sodium hydroxide and then mixed with
mineral oil, those prepared by a cold process with calcium hydroxide and resin, and those
obtained from residues composed of mixtures of fatty or mineral oils and the residual of
petroleum distillation. In the chemical sense, the last mentioned is a solid mixture of oils and
should not be considered grease because they are not formulated as grease (Billet, 1979). The
use of only the first category of grease is recommended. Unlike petroleum jelly or any other
type of grease, their soap content provided them with special qualities, namely, long
persistence upon a surface and reduced viscosity during use. Their viscosity depends upon
the viscosity of the dispersion medium, that is, the oil used in the manufacture of the grease.
The base used for saponification has an important effect upon the lubricant‟s properties, and

12
accordingly, may constitute another criterion of classification. For example, grease with
bases of calcium, sodium, aluminum, or lithium have different qualities as explained below.
1. Aluminum Soap Grease
Aluminum base greases are resistant at high temperatures and possess particularly adhesive
properties, which minimize leakage. It is smooth, transparent grease with poor shear stability
but excellent oxidation and water resistance, but tends to have poor mechanical stability and
so is not suitable for rolling bearings (Mohammed, M.A.R 2013)
2. Calcium Soap Grease
It is one of the earliest known greases and is water resistant and mechanically stable. Calcium
soap grease usually has a low dropping point; typically 95 °C. High temperatures cause a loss
of water and a consequent weakening of soap structure, and therefore the use of this grease is
limited to a maximum temperature of about 60 °C
3. Sodium Soap Grease
It is fibrous in structure and is resistant to moderately high temperature but not to water.
Sodium soap grease has a high dropping point (175 °C) than calcium grease. In applications
where high temperatures, dynamic stress, or centrifugal effects are significant, sodium-base
greases are more efficient than calcium-base greases. However, they are emulsified by
water.
4. Lithium Soap Grease
It is normally smooth in appearance but may exhibit a grain structure. Lithium soap grease
offers both the water resistance of calcium soap grease and high-temperature properties of

13
sodium soap grease. They are water resistant and can be used at temperatures up to
approximately 120○C this makes them useful in a wide range of applications and for this
reason they are called multi-purpose greases. The vast majority of bearing used in industries
have running temperatures well within the capability of the lithium soap thickened greases.
5. Mixed Soap Grease
It is generally manufactured by saponifying the fatty material with mixed alkalis derived
from metals. One of the soaps usually predominates and determines the general character of
the greases while the other modifies the structure in some way. This results, for example, in
changes in texture and improved mechanical stability.
6. Complex Soap Grease
It is formed when two dissimilar acids are attached to the same metal molecules, thus
restricting complexes to only polyvalent metals. There are several types of complex grease,
such as, calcium complex grease, aluminum complex grease, and lithium complex grease.
Calcium-complex greases commonly include a minor proportion of calcium acetate with fatty
acid soap thereby forming multipurpose greases with dropping points above 260 0C.
7. Non Soap Grease
Many non-soap greases are present.
A. Polyurea
It is the most important organic non soap thickener. It is a low-molecular weight organic
polymer produced by reacting amines with isocyanates, which results in an oil soluble
chemical thickener. The polymer-thickened greases are used when semi-fluid type grease is

14
required, for example in certain gearbox applications where leakage is a problem (Billet,
1979).
B. Organo–Clay
It is the most commonly used inorganic thickener. Its thickener is modified clay, insoluble in
oil in its normal form, but through complex chemical processes, converts to platelets that
attract and hold oil. Organo–Clay thickener structures are amorphous and gel-like rather than
the fibrous, crystalline structures of soap thickeners. This grease has excellent heat resistance
since clay does not melt. The clay-thickened greases are very useful in special high
temperature, low speed applications, such as the lubrication of oven chain and kiln car wheel
bearings. However, the presence of the mineral oil limits their upper temperature use to
approximately 200○C.
Others
Sometimes, for special applications, fluids other than mineral oils are used. The silicone
greases lubricate bearings that have to operate under extremes of heat and cold. Carbon black
is used as a thickener in some high temperature petroleum and synthetic greases. Organic
powders and pigments, which are stable at elevated temperatures, are being used increasingly
(Billet, 1979). Tables 2.2 and 2.3 show the properties and compatibilities of different grease
soaps respectively
15
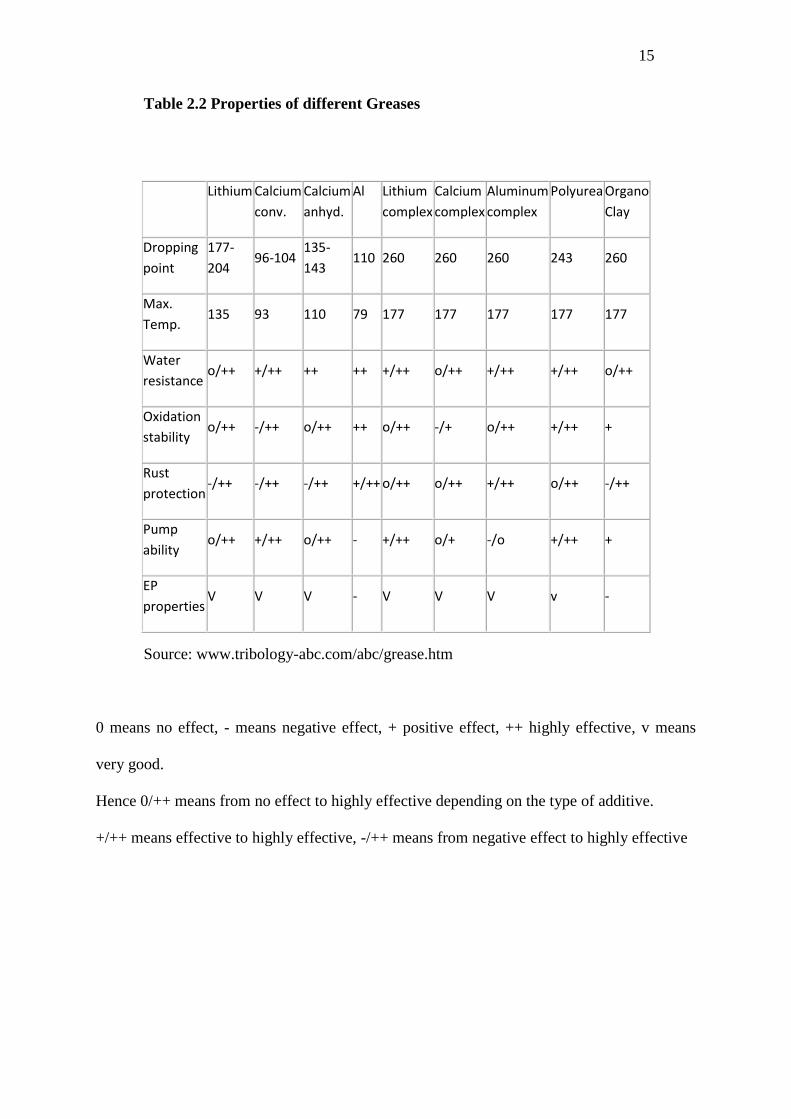
Table 2.2 Properties of different Greases
Source: www.tribology-abc.com/abc/grease.htm
0 means no effect, - means negative effect, + positive effect, ++ highly effective, v means
very good.
Hence 0/++ means from no effect to highly effective depending on the type of additive.
+/++ means effective to highly effective, -/++ means from negative effect to highly effective
Lithium
Calcium
conv.
Calcium
anhyd.
Al
Lithium
complex
Calcium
complex
Aluminum
complex
Polyurea
Organo
Clay
Dropping
point
177-
204 96-104
135-
143 110 260 260 260 243 260
Max.
Temp. 135 93 110 79 177 177 177 177 177
Water
resistance o/++ +/++ ++ ++ +/++ o/++ +/++ +/++ o/++
Oxidation
stability o/++ -/++ o/++ ++ o/++ -/+ o/++ +/++ +
Rust
protection -/++ -/++ -/++ +/++ o/++ o/++ +/++ o/++ -/++
Pump
ability o/++ +/++ o/++ - +/++ o/+ -/o +/++ +
EP
properties V V V - V V V v -

16
Table 2.3 Grease compatibility chart
Lithium
complex Lithium
Al.
Complex
Calcium
complex Barium Sodium Bentone
Silica
gel Polyurea
Lithium complex - V X V X X x v V
Lithium V - X V X X x v V
Al.complex X X - X X X x v X
Calcium complex V V X - V X x x X
Barium X X X V - X x v X
Sodium X X X X X - x x X
Bentone X X X X X X - v X
Silica gel V V V X V X v - X
Polyurea V X X X X X x x -
Source: www.tribology-abc.com/abc/grease.htm
v is for compatibility, x is for non-compatibility
2.2.6 Consistency.
Consistency in greases is analogous to viscosity in oils, the corresponding coefficient being
defined in the same way as that of viscosity. Sometimes the reciprocal relation between the
velocity gradient normal to the direction of motion and the tangential force on the unit of
surface is used. This reciprocal relation is called mobility. The term consistency is also used
to define the properties of greases: structure (smooth, fibrous, spongy), elasticity (rigid,
elastic), and ductility (fibrous, soft). Consistency depends on different factors such as the
nature and quality of the metallic soap content, percentage of free fatty acids, percentage of
alkaline substances used in the saponification process, speed of cooling, temperature of

17
dispersion, method of manufacture, temperature during storage, action to which it has been
subjected during use, and water content. In general, soap content is the most important
factor. Grease with a high percentage of soap has a high consistency. The consistency of
greases during operation is modified by time of use and by the degree of mixing and stirring.
Any grease or plastic materials having consistency that depends on the shearing actions to
which they have been previously subjected are customarily referred to as thixotropic (Nolan,
2004).
The friction developed in bearings, the operating temperature of the bearings, the flow of
grease, and the carrying capacity, all depend on consistency, which should be considered the
fundamental property of these lubricants. In contrast to oils, the consistencies of greases
exhibit large variations, depending on the parameters just mentioned. Additives, the most
important of them being graphite and mica, are used to enhance the lubricating qualities of
greases. Chalk, talcum, and gypsum are used to enhance their dynamic operating
characteristics (Nicolae, 1962). Consistency is determined by measuring the flow of grease
through a capillary tube at various pressures. Its value varies because the relation between
pressure and flow is nonlinear, as in the case of viscous fluids, but in general, consistency
depends on pressures. Consequently, determinations must be carried out at various pressures.
Another laboratory method of determining consistency is by measurement of the depth to
which a standard body subjected to a given force penetrates into a mass of grease.
Establishment of the melting point and the leaking point of grease are of practical importance
because the maintenance of grease films within bearings depends on these points. The
melting and leaking points also depend on the soap content, for they increase with the
quantity of soap in the grease and on the mineral oil and water content of the greases. The

18
flash point of grease is defined in the same way as for oils. A large proportion of fats, or of
free fatty acids, facilitates oxidation and alteration of the lubricants. Grease used in ball
bearings should be sufficiently stable to resist centrifugal forces, which tend to separate the
component substances. It is also important to determine the corrosive action of greases in
establishing their possibilities for utilization. This is done by spreading the lubricant on a
copper plate and noting the colour modification of either the metal or the grease (Nicolae,
1962).
2.2.7 Consistency Number (Grades)
Greases are neither Hookean solids, nor Newtonian fluids, but are “in-between” viscoelastic
(semi-fluid) materials that display differing physical properties depending on the applied
conditions (Nolan, 2004). In selecting engine oil, the first concern is the appropriate
viscosity. A grease, is however, graded by its hardness, and not by its viscosity. It is
expressed in terms of American Society for Testing of Material (ASTM) penetration or
National Lubricating Grease Institute (NLGI) consistency number. ASTM penetration is a
numerical representation of an actual test of an object as it sinks into grease under a specific
test condition. NLGI's classification defines nine grades, each associated to a range of ASTM
worked penetration values, and measured using the test defined by standard ASTM D217
“cone penetration of lubricating grease”. This involves two test apparatus. The first apparatus
consists of a closed container and a piston-like plunger. The face of the plunger is perforated
to allow grease to flow from one side of the plunger to another as the plunger is worked up
and down. The test grease is inserted into the container and the plunger is stroked 60 times
while the test apparatus and grease are maintained at a temperature of 25 °C. Once worked,
the grease is placed in a penetration test apparatus. This apparatus consists of a container, a
specially-configured cone and a dial indicator. The container is filled with the grease and the

19
top surface of the grease is smoothed over. The cone is placed so that its tip just touches the
grease surface and the dial indicator is set to zero at this position. When the test starts, the
weight of the cone will cause it to penetrate into the grease. After a specific time interval the
depth of penetration is measured. It is measured in tenths of a millimeter.
NLGI uses a consistency number 000 to 6 to classify the grease, with use of ASTM
penetration test results. For example, a grease having the consistency number 000 is soft, like
ice cream at a room temperature of 250C, whereas, grease having consistency number 6 is
hard-like butter just removed from a refrigerator. NGLI #2 grease is suitable for most
ambient temperature for either light or heavy applications. However, for extremely low
ambient temperature, NLGI 0 or 1 is recommended. The National Lubricating Grease
Institute (NLGI) of America and the American Society for Testing of Materials (ASTM)
provide the standards and equivalent measurement to assist in the use of lubricating greases
for automotive, industrial plant, machinery and equipment selection in general. The corporate
and equivalent values as provided by the two bodies are shown in Table 2.4 The consistency
of industrial greases are classified by the distance in tenths of a millimeter, that a standard
cone penetrates a sample of the grease under standard conditions at 25ºC

20
Table 2.4 NLGI consistency number and equivalent ASTM penetration value.
NLGI Consistency
(Grade no.)
ASTM Worked
Penetration at 25ºC
(Penetration in 0.1
mm)
Appearance Consistency food
analog
000 445 – 475 Fluid cooking oil
00 400 – 430 semi-fluid Applesauce
0 355 – 385 very soft Mustard
1 310 – 340 Soft tomato paste
2 265 – 295 “normal” grease* peanut butter
3 220 – 250 Firm vegetable
shortening
4 175 – 205 very firm frozen yogurt
5 130 – 160 Hard smooth pate
6 85 – 115 very hard cheddar cheese
.
Source: www.tribology-abc.com
“Normal” grease* means the most common grease.
NLGI grades 0, 1 and 2 are applied in highly loaded gear transmissions; grades 1 through 4
are often applied in rolling bearings where grade 2 is the most common (www.tribology-
abc.com). The quality of the grease is governed by the fluid used, the ratio between the fluid
and thickener, the chemical structure of the thickener and its additives. Non-soap grease can
be made but are not significant in general lubrication.
2.2.8 Dropping point.
The dropping point of soap-thickened lubricating grease is the temperature at which it passes
from a semi-solid to a liquid state under specific test conditions. It is an indication of the type
of thickener used, and a measure of the cohesiveness of the oil and thickener of grease.
(Totten, G.E., 2006). Dropping point is used in combination with other testable properties to

21
determine the suitability of greases for specific applications. It is applicable only to greases
that contain soap thickeners. Greases with other thickeners, such as many synthetic greases,
do not change state. Instead, they separate oil, and the dropping point as a phase transition
does not apply. It is useful to assist in identifying the grease as to type and for establishing
and maintaining bench marks for quality control. The results are to be considered to have
only limited significance with respect to service performance because dropping point is a
static test. Cooperative testing indicates that, in general, dropping points by Test Method
D2265 and Test Method D566 are in agreement up to 260°C. In cases where results differ,
there is no known significance. However, agreement between the manufacturer and purchaser
as to test method used is advisable.( http://www.astm.org/Standards/D2265.htm)
The dropping point test procedures are given in ASTM standards D-566 and D-2265. The test
apparatus consists of a grease cup with a small hole in the bottom, test tube, two
thermometers, a container, stirring device if required and an electric heater. The inside
surfaces of the grease cup are coated with the grease to be tested. A thermometer is inserted
into the cup and held in place so that the thermometer does not touch the grease. This
assembly is placed inside a test tube. The test tube is lowered into the container which is
filled with oil in D-566 and has an aluminum block in D-2265. Another thermometer is
inserted into the oil/block. To execute a test, the oil/block is heated, while being stirred, at a
rate 4.4 °C to 6.7 °C per minute until the temperature is approximately16.7 °C below the
expected dropping point. The heat is reduced until the test tube temperature is 2.2 °C or less
than the oil/block temperature. Once the temperature has stabilized the sample is inserted.
The dropping point is the temperature recorded on the test tube thermometer, plus a
correction factor for the oil/block temperature, when a drop of grease falls through the hole in
the grease cup. If the drop trails a thread, the dropping temperature is the temperature at
which the thread breaks.

22
2.2.9 Additives
Chemical additives similar to those used in lubricating oils also are added to grease to
improve their performances such as oxidation resistance, rust protection, extreme pressure
properties etc. In a study by Mohammed, (2013) he concluded that the best weight
percentages to all types of grease which give good properties are 1.5% extreme pressure
additive, 3% graphite, 1% molybdenum disulfide, 2.5% carbon black. On the other hand, he
noted that the best weight percentage for corrosion inhibitor is 1% to lithium-calcium grease,
2% to lithium grease, and 3% to sodium grease. He also concluded that there is no need to
add corrosion inhibitor to calcium grease.
Although 1-naphthyl (phenyl) amine is the common choice as an oxidation inhibitor at about
0.1-0.5% concentrations, other amines; phenolic, phosphate, sulfur and selenium inhibitors
are also used. A common procedure involves trying a number of commercial additives in
varying concentrations to determine the least expensive means of obtaining satisfactory
oxidation inhibition. In many greases 0.2-0.3% of an amine metal deactivator is also added
to avoid staining of copper and to minimize any catalytic effect of copper on oxidation of the
grease (Nicolae, 1962). Although, most greases offer some inherent protection against rusting
of coated surface, additives e.g., amine salt, metal sulfonate and cycloparafin salts
(naphthenate), esters, and nonionic surfactants, are used to provide added resistance against
water and salt-spray corrosion. A dispersion of sodium nitrite has been especially effective in
some multipurpose grease (Nicolae, 1962). Extreme Pressure (EP) additives are not required
in greases for most ball and roller-bearing applications nor for general purpose industrial use,
but they are necessary to minimize wear of bearings under shock load conditions
characteristics in steel rolling mills, for many gear applications, and for sliding conditions
that involve boundary lubrication- Solid powders are added as fillers in greases for extreme

23
conditions of boundary lubrication. Among those employed are graphite, molybdenum
disulfide, talc and zinc oxide (Nicolae, 1962). The lubricant industry has come a long way in
relatively short period of time to limit the use of dangerous substances such as lead, asbestos
and chlorinated solvent that were once common place (Kieke and Klein, 2004). Glycerol also
is present in many lubricating greases. Frequently, the glycerol remains after the formation of
the metallic soap thickener when natural fats are employed as raw materials. Even with some
soap that are produced from fatty acids, glycerol may be added for its stabilizing effect on the
soap structure when used in combination with a small amount of water (Billet, 1979).
2.2.10 Choice of grease as Lubricant
In lubricating any given mechanism, a fundamental choice must be made. Will the lubricant
be a liquid, a solid or an intermediate product, grease, which may range from semi-fluid to
semi-solid? The choice is made, in fact, by the machine designer, who looks at expected
operating conditions and the properties of available lubricants and decides on the lubrication
system to be used. The designer finds several advantages in using greases. One is cost.
Greases assist seals. Oils require more effective, more expensive seals. If vertical shafts are
involved, effective sealing of oil is quite difficult and costly. Sealing greases is less complex
and more economical. Another significant cost saving is due to the decreased complexity and
space required when grease is used. To lubricate a bearing with oil, we frequently find an
oil-filled sump below the bearing and a pumping device, which lifts the oil from the sump to
the bearing. The oil then drains back to the sump. Compare this with the corresponding
grease lubricated bearing. Neither pump nor sump is required. Housing around the bearing
holds a small supply of grease, which does not drain away. Such a device, which is less
complex and more compact, would be less expensive than oil lubricated bearing.

24
Many other characteristics of grease are helpful to both designer and user of the equipment.
Some of the advantages in using grease are highlighted as follows:
1. Low Speed Combined with High Pressure
Grease is usually the preferred lubricant when bearings are operating at speeds below 100
rpm at high load. If very high-viscosity oil is used, an adequate lubricating film would be
formed. However, such oil has very poor pumpability and often cannot be employed. Lower
viscosity oil would not form an adequate lubricant film under these conditions. Because of
their high apparent viscosity at low speeds, grease would form a lubricant film of adequate
thickness. Such a film, despite the high load would lubricate successfully under these
adverse circumstances.
2. When Machine Parts Are Badly Worn
A mechanism designed for oil probably will be lubricated with oil for the life of the machine.
However, as equipment grows older, wear causes machine clearances to increase until
adequate oil films can no longer be maintained in service. At this juncture, a change to
grease is helpful since with increased clearance, shear rate of the moving mechanism -
bearing, gear or whatever - decreases. At low shear rate, grease films are much thicker than
oil films, providing adequate lubrication. A change to lubricating grease permits the machine
to continue in service at least until a maintenance shutdown can be scheduled. Some gear
cases designed for use with gear oil have operated for years with greases ranging from NLGI
#000 to #2 in consistency
3. When Noise Reduction Is Important - As machines become worn, gears, bearings and
shafts develop looseness. Loose, sloppy fits lead to noisy operation. Under such

25
circumstances, the thick films provided by grease cushion the excessive movement and
significantly reduce the noise level. Though most lubrication is carried out with oils under
many situations encountered in service, the properties of grease are superior, making them
the lubricants of choice.
4. To Decrease Dripping and Spattering of Lubricant
Greases assist seals. Thus, grease tends to stay in its housing and not leak or drip out. This is
particularly true as seals become worn. The effect on house-keeping is obvious. In
processing foods, pharmaceuticals or other products for which contamination must be
avoided, grease minimizes problems.
5. To Decrease Frequency of Lubrication
Machine design frequently requires the placement of bearings where they cannot be easily
serviced without shutting down production. In these applications, grease can provide
lubrication for long periods of time with only infrequent lubrication. Electric motors in
plants are often lubricated annually or even less often. Some electric motors and gears are
lubricated for life at the factory. Obviously, infrequent lubrication requires high quality
greases.
6. To Seal out Contaminants
Since greases make seals more effective, they assist in keeping out contaminants. In mining
operations and steel mills, dust, dirt and water must be excluded. In paper mills, corrosive
water and pulp are potential contaminants. In chemical plants and many other environments,
corrosive gases and liquids must be kept out. If corrosive contaminants do enter the bearing
cavity, grease is more protective of the metal surface than oil would be. When a machine is

26
stopped, oil drains away from bearing surfaces, leaving them essentially unprotected. Grease
does not drain away from those surfaces. Thus a protective grease film remains on the
bearing surfaces to protect against corrosion.
7. For Intermittent Operation - The fact that oil drains away when a machine is stopped,
but grease does not, is significant also whenever equipment operates intermittently, changes
speed, or reverses direction. On start-up, bearings are dry until oil has been drawn in
between surfaces, forming a lubricating film. Grease does not drain away when the device is
stationary; on start-up, a lubricating film forms immediately. Thus, for intermittent
operation, grease protects against wear that would be found with oil as the lubricant.
8. To Suspend Solid Additives - Some solids have lubricating properties in varying degrees
when mixed with oils or greases, the mixture often performs better than the oil or grease
alone does. Typical solids are graphite, molybdenum disulfide and zinc oxide. When mixed
with oil, the solid tends to settle out leaving little, if any, in suspension. The solids can be
ground very fine at considerable cost; yet the amount remaining in suspension is small.
When mixed with grease, even coarse solids remain in suspension indefinitely at any
proportion desired.
9. High Temperature
Many industrial operations subject equipment and lubricants to very high operating
temperatures. Kiln car, Ladle car and Furnace door bearings are examples. Oil lubrication
tends to develop too thin a film and poses a significant fire hazards. High temperature
greases sometimes, containing solids give quite satisfactory lubrication.

27
10. Shock Loading
Shock loading is an instantaneous and severe increase in stress. Such loading tends to rupture
a thin lubricant film, leading to rapid wear. Grease appears to cushion against such sharp
rupturing of the film. Shock loading occurs, for example, in rolling mills when a thick slab
hits rollers, which have been preset to a lesser thickness (Sote 1997).
2.3 Grease Manufacturing Methods.
For over 4,000 years, man has made use of solid or semi-solid materials for lubrication.
During this time, many methods, ranging from a simple hand-stirred pot over an open fire to
a continuous manufacturing process, have been used for their manufacture. This work
concentrated on three methods of manufacturing lithium hydroxystearate grease. These
methods are the Stratco Contactor process, the Texaco Continuous Process and the
Atmospheric Kettle process.
2.3.1 Stratco Contactor Process
The STRATCO Contactor consists of a pressure vessel; a circulation tube and a hydraulic
head assembly with the mixing impeller and driver. The outstanding feature of the Contactor
is its highly turbulent circulation in a closed cycle path. All energy input through the mixing
impeller is expended within the materials being mixed and there is virtually no pressure
differential between the Contactor‟s inlet and outlet. The high dispersion mixing in the
Contactor is achieved by the hydraulic head assembly. Frequent and forced changes in the
velocity and direction of flow occur around the impeller area. The material feed flows
directly to the impeller from where it emerges uniformly mixed and dispersed. Turbulence is
established between the stationary shear vanes and the blades of the impeller, resulting in a
zone of high shear and intense mixing.

28
As the material passes through the impeller, its velocity is greatly increased. At the discharge
side of the impeller, the slightly swirling stream is violently impinged against the diffuser
vanes. The vanes then straighten the stream into axial turbulent flow and the direction of
flow is reversed at the bottom of the hydraulic head. A double walled circulation tube is
installed inside the Contactor to create a continuous flow path for the soap concentrate.
Material is pulled down through the center of the circulation tube by the impeller and then
forced through the annular space formed by the circulation tube and Contactor wall. The
outside of the Contactor is jacketed. Heat transfer oil is circulated in both the jacket and
inside the circulation tube to provide heating or cooling. An alternate design can use high-
pressure steam. The impeller is connected to a two-speed motor normally turning at 1200
rpm. A mechanical seal seals the shaft from the process materials. This seal can be replaced
from outside the Contactor without removing the head or the motor.
The STRATCO Contactor process is similar to the atmospheric kettle process but is slightly
more sophisticated. Dry materials are charged through the top manway of the Contactor,
while base oils are normally pumped in through meters or added through weigh tanks. The
dry materials added to the Contactor may consist of acids and glycerides, such as
hydrogenated castor oil, beef tallow or other combinations, along with the lithium hydroxide
and some water. The Contactor is then sealed and heating commenced. This startup
operation requires about 20 minutes. Normally, the amount of raw materials initially charged
to the Contactor results in producing a soap concentrate in the Contactor containing
approximately 30-weight percent soap. However, for some conventional lithium soap
greases, a soap concentrate containing up to 40-weight percent soap can be produced.
The water added, as well as the water of reaction, increases in the Contactor‟s operating
pressure. Pressures in the range of 4.8 to 6.9 bars are typical of those used for efficient and

29
essentially complete saponification. This pressure prevents foaming of the soap concentrate
as well as accelerating the saponification reaction. The Contactor pressure is maintained by
manually venting or by automatic controls as the temperature rises. Very rapid heating occurs
during saponification when the ingredients are circulated between the circulation tube and the
shell. The temperature in the Contactor rises to 204.4oC in approximately 30 minutes. Upon
reaching the desired maximum temperature, the pressure is vented to atmospheric conditions.
Cooling or quench oils are then added to reduce the temperature below the soap
crystallization temperature. At this point, the Contactor‟s contents are transferred to an
atmospheric kettle and the grease is finished with additional oils and additives. As outlined
above, the complete process of charging the raw materials, cooking, quenching, transferring
the soap concentrate and rinsing requires less than two hours. This procedure results in
maximizing the volume of soap concentrate produced in a single Contactor over a given
period of time. An alternate procedure is to partially or completely finish the grease in the
Contactor. This option takes advantage of the high shear milling action of the Contactor‟s
impeller. Many times such further processing in the Contactor will eliminate the need to mill
NLGI #1 grade greases. The Contactor can be utilized to prepare almost every metallic soap
based grease. Other than adjusting operating conditions as appropriate, the only additional
step required to take advantage of this flexibility is more complete rinsing between the
different soap batches.
In summary, the Contactor permits the grease manufacturer to use an unlimited variety of raw
materials. The ability to perform these operations under pressure accelerates saponification
while allowing complete control of all the manufacturing variables. This includes
minimizing the amount of excess water required to accomplish complete and efficient
saponification. The STRATCO Contactor is supplied in many sizes 617 to 8,113 litres

30
operating volumes. Various small pilot units are also supplied with the most popular size
being a 55.1litres unit.
2.3.2 Texaco Continuous Grease Process
The Texaco Continuous Grease Process (TCG) is well documented in the literature. It is
basically composed of three major sections: the reactor, the dehydration and the finishing
sections. All raw materials for the TCG must be in liquid form. The process described for
manufacturing lithium grease uses a hot, stirred, 15,285 1itres solution of 14% hydroxystearic
acid in oil maintained at about 99.5oC. The lithium hydroxide is dissolved in water in 1,762
litres stirred tank containing about 9.3% lithium hydroxide monohydrate. A third feed tank
holds oil at about 173oC. The liquid raw materials from the feed tanks are metered to the
reactor where they are heated to 350oC. High recirculation rates and residence times are
maintained in the reactor to ensure complete reaction. The recirculation system is adjusted to
maintain a high pressure of up to 6.9 bars by passing through partially closed valves. The
stream is then directed to the dehydration section where additional heat and often times
additional hot oil from a storage tank are added. This section removes the water or other
volatiles under reduced pressure at a temperature of 185oC. The stream is then cooled by the
addition of cold oil followed by coolers in the finishing section. Additives are also metered
in at this point. The TCG includes a consistometer, which senses the amount of finishing oil
needed to produce a particular grade of grease. The finished grease is then milled and sent to
bulk storage tanks. TCG plants are built in several sizes for processing 1,360 to 2,268 Kg of
grease per hour. The raw material feed tanks are sized from 1,762 to 5,285 litres each. The
unit can be used to manufacture several types of grease.

31
2.3.3 Atmospheric Kettle Processing.
Nearly all grease plants utilize atmospheric or open kettles. Many kettles are fabricated with
simple agitators, which come close but do not scrape the walls of the kettle. Later designs
use a counter rotating blade system with hinged wall scrapers. Some are also constructed to
operate under higher than atmospheric pressures but most are open to the atmosphere. Like
the STRATCO Contactor Process, atmospheric kettle processing can utilize essentially all of
the dry and/or liquid raw materials known for grease making. Processing becomes critical
with respect to maintaining sufficient water and time to dissolve all of the lithium hydroxide
and force complete saponification. This problem is particularly evident when saponifying
glycerides such as beef tallow and hydrogenated castor oil. Incomplete saponification leaves
fragments or partial esters, which affect certain grease properties. Incomplete solution of all
the lithium hydroxide sometimes leaves small particles in the grease.
Approximately 10 to 12 times more water is required to saponify the glycerides in the open
kettle process than with the STRATCO Contactor. Even with this amount of excess water,
all of the available glycerides are not used to form the soap thickener. Finally, processing
time in the open kettle is prolonged because of this large amount of water and poor heat
transfer and slow agitation characteristics of kettles. Kettles are fabricated in various sizes.
2.4 Prospect of Using Plantain Peel Ash as the Source of Alkali.
It has been stated earlier that ashes of agricultural materials can be a source of industrial
alkali. The present work is devoted to investigating the suitability of plantain peel ash as a
source of alkali for lubricating grease production. Research has shown that plantain peel ash
has been used to produce soap of good quality. Hence, it is believed that soap produced from
the ash can equally be a good grease thickener.

32
2.5 The Plantain
The plantain, scientifically named musa Paradisiaca is a very starchy banana that is usually
used in cooking (www.all-creatures.org/recipes/I-plantain.html). It is a fast - growing plant
3-5m high with herbaceous stem. The fruits grow in bunches of up to 200 fingers each
(www.fao.org). Plantains are widely grown across the world‟s tropical regions. They are
major food crops in developing countries, and are also an important export crop to industrial
countries. They are easy to grow and production is relatively stable. In addition, the fruits
are highly nutritious, containing large amounts of carbohydrates and minerals such as
phosphorus, calcium, and potassium as well as vitamins A and C. They are also important
sources of revenue for many small-scale farmers. About 90% of the world‟s plantains are
grown on small farms and consumed locally. An estimated 20 million people eat plantain as
their major source of dietary carbohydrate. They are particularly important in East Africa,
where they constitute the main staple food for about 50% of the population. In that part of
the world, the annual consumption reaches over 400 kg per person. ). Almost 75% of the
world‟s plantains were grown in Africa. Uganda is the largest producer of plantains and
produces about 9 million tons per annum (www.fao.org). The fruits can be fried, baked, or
roasted, and are also sold in pulp form, as chips, and in confectionery. In some countries, they
are used to produce alcohol. The leaves and pseudo stem are also often used, for example,
for wrapping food, for thatching, and in textile manufacture. The fruits can also be used as
animal feed. The major pests are the banana weevil and parasitic nematodes. Studies have
revealed that if plantains are infected with both weevils and nematodes, yield losses may
reach 85%. Another major constraint of plantain is that the fruits are highly perishable. At
ambient tropical temperatures, plantain has an average market life of 1 - 10 days, compared
to several weeks for yam, for example. In Nigeria, plantains are grown at the following states
of the federation; Rivers, Cross River, Imo, Anambra, Ondo, Lagos, Ogun, Oyo, kwara,

33
Benue, Plateau, Kogi, Abia, Enugu, Edo and Delta with annual production of 1,855,000
Metric tons
2.6 Potassium Hydroxide
The major constituent of plantain peel ash is potassium hydroxide (Onyeagbado et al 2002).
Potassium hydroxide is a chemical compound with formula KOH. Pure potassium hydroxide
forms white, deliquescent crystals. For commercial and laboratory use, it is usually in the
form of white pellets. A strong base, it dissolves readily in water, giving off much heat and
forming a strongly alkaline, caustic solution. It is commonly called caustic potash. It closely
resembles sodium hydroxide in its chemical properties and has similar uses, for example, in
making soap, in bleaching, and in manufacturing chemical, but is less widely used because of
its higher cost. Potassium Hydroxide is prepared chiefly by electrolysis of potassium
chloride; commercial grades of it sometimes contain the chloride as well as other impurities.
It is a major industrial chemical used as a base in a wide variety of chemical processes. It is
used as a catalyst in reactions like the production of biodiesel. The advantage of using
potassium hydroxide (KOH) and not sodium hydroxide (NaOH) is that NaOH “clumps” and
KOH does not. Some uses of KOH include acrylate ester copolymer coating, defoaming
agents used in the manufacture of paper, formulation aid for food, PH control agent,
polyethylene resins, and textile processing. Other uses include in veterinary medicine, in
disbudding calves horns and to dissolve scales and hair; in human medicine, to diagnose
fungal infections, and as a wart and cuticle solvent; in manufacture of cleansers. This
chemical is also used in washing powders, some denture cleaners, non-phosphate detergents,
and drain or pipe cleaners. A very significant use of KOH in terms of significance to the
average home consumer is that alkaline batteries use an aqueous solution of KOH as an

34
electrolyte. Thus, potassium hydroxide helps to power flashlights, smoke detectors, and other
battery powered household items.
2.7 Bio-Alkali
Bio-alkali is the alkali derived from the ashes of burnt biomaterials. Agricultural materials
contain a good percentage of mineral salts. These include calcium, phosphorous, iron,
sodium, potassium and so on, as shown in Table 2.3 When these materials are burnt in air,
carbohydrates, fats, proteins and vitamins will all burn away. The resulting ashes contain
oxides of these minerals. Some of these are basic oxides of potassium and sodium, which
when dissolved in water yield their corresponding hydroxides (alkali) according to the
equations (1.1) and (1.2)
Table 2.5 Mineral Salt composition of some raw foods mg/100g edible portion
Food Product Calcium P Fc Na K
Plantain 7 30 0.7 5 385
Rice 32 221 1.6 9 214
Soya bean 226 4 8.4 0.5 1677
Wheat (whole grain) 1308 1016 0.6 532 1745
Yam tuber 20 69 0.6 - 600
Cowpea (mature dry) 74 426 5.8 35 1024
Groundnut (peanut) 59 409 2.0 5 674
Sorghum (whole grain) 23 263 3.6 - -
Source: Enwere (1998)

35
Alkali is derived from the Arabic word “al-kali” which means the dust or ashes (Bajah and
Godman 1976). This was based on its earlier mode of extraction. Soda (Sodium carbonate)
was made by burning marine plants to ashes and extracting the soda from them, while potash
(Potassium carbonate) was made by burning wood in iron pots and extracting the potash from
the ashes. The name “Potash” actually came from the compound word “pot-ash” (Bajah and
Godman 1976) The method of making these “mild” alkalis into “caustic” alkalis by treatment
with lime was practiced in the time of Pliny (www.simplestarpage.com) in connection with
the manufacture of soap, and it was known that the ashes of shore-plants yielded a hard soap
and those of land plants a soft one. But the two substances were generally confounded as
“fixed alkali” (carbonate of ammonia being “volatile alkali”), till Duhamel du Monceau in
1736 established the fact that common salt and the ashes of sea-plants contain the same base
as is found in natural deposits of soda salts (“mineral alkali”), and that its body is different
from the “vegetable alkali” obtained by incinerating land-plants or wood in iron pot and
extracting the potash (hence the name, pot-ash, and hence a derivation of potassium).
Later, Martin Heinrich Klaproth (Bajah and Godman, 1976) finding vegetable alkali in
certain minerals, such as Lucite, proposed to distinguish it as potash, and at the same time
assigned to the mineral alkali the name natrium, which survives in the symbol, Na, now used
for sodium. The word alkali supplied the symbol for potassium, K (kalium). Analysis of
alkalis derived from vegetable matter ashes by Nwoko (1980) and others (Onyekwere, 1996,
Kuye and Okolie, 1990), showed that the extract was chiefly potassium hydroxide with some
quantities of sodium hydroxide. Other metallic ions present constituting as a whole about 2%
of the metallic ions present, were Ca++
, Cr++
, B++
, Zn++
, Fe++
, Pb++
and Ni++
. Tests have
shown that bio-alkali produces harder soap than those produced from pure potassium

36
hydroxide, and this is because of the presence of the above metallic ion and notably sodium
(Onyeagbado et al 2002).
Generally speaking, alkalis are soluble bases. A base is a metallic oxide, or hydroxide, which
neutralizes an acid to form a salt and water only. In solution, the bases form hydroxides.
Common alkalis and their formulae are Sodium hydroxide (Caustic soda) NaOH, Potassium
hydroxide (Caustic potash) KOH, Ammonia solution NH4OH and Calcium hydroxide (Lime
water) Ca(OH)2. Alkalis have very low concentration of hydrogen ions when dissolved in
water, and their pH values are above 7 (Sambal‟s Science Web 2006). Sodium carbonate
(correctly speaking, is a salt) is included as an alkali in showing the uses of alkalis (Baja and
Godman 1979). Ammonia solution also strictly speaking is not a hydroxide (Holderness and
Lambert, 1976). A solution of sodium carbonate has an alkaline reaction, and it can be used
in place of an alkali to neutralize an acid. The reaction is not neutralization by definition, as
carbon dioxide is evolved. Both sodium and potassium carbonate have alkaline reactions
with indicators, and they are called mild alkalis. The remaining alkalis are called caustic
alkalis because they have a corrosive action when concentrated.
2.7.1 Properties and Uses of Alkalis
(a) Properties
The properties of alkalis are as follows;
(i) They neutralize acids to form salt and water
(ii) They change red litmus to blue, methyl orange to yellow and phenolphthalein to pink
(iii) They give off ammonia gas (not ammonia solution) when they are warmed with an
ammonium salt
(iv) They have soapy feel
(v) They have bitter taste

37
(b) Uses
Alkalis are used in large quantities in most chemical industries. Bases are less important
commercially. Some of the more important uses of alkalis are as follows;
(i) Caustic soda and potash are used in the production of soap, paper, artificial silk,
mercerized cotton and lubricating grease.
(ii) Sodium carbonate is used in water softening and also in the manufacture of glass and soap
(iii) Lime is used in the manufacture of fertilizer
(iv) Ammonia is used in making household cleaners
2.7.2 Extraction of Bio Alkali
Caustic solution is also known as “lye water”. There are various methods of extracting bio
alkali. Two are described here.
Method 1
The method described here was originally prepared and printed as a booklet, at the request of
Christians in Burma, to help in situations where normal supplies of soaps are not readily
available; and where caustic soda is hard to come by. This information was needed because
soap can be powerful in stopping the spread of certain diseases (Peter, 1986).
(a) Ashes
Dried palm bunches, dried out banana peels, cocoa pods, kapok tree wood, and oak wood, (or
for really white soap, apple tree wood) make the best lye ashes. Ordinary wood used in
cooking will do also. Whatever wood is used, it should be burnt in a very hot fire to make
very white ashes. When cold, these are stored in a covered plastic bucket or wooden barrel, or
stainless steel container. If these are not available, a clay pot-jar which has been fired in a
pottery-making kiln (not just dried in the sun) will do.

38
(b) Soft Water
Water from a spring or from showers of rain is called “soft water”, because it does not have
metallic or acidic chemicals in it. This makes it useful for soap making, as there are no other
chemicals in it which would get in the way of making soap. Ordinary bore well or river water
can be used for making soap, but this will sometimes need a washing soda or baking soda
added to it. Otherwise, some of the chemicals in the water will get in the way of making the
soap. If ordinary water is to be used, it will be necessary to test if soda needs to be added by
simply trying to make soap bubble up (foam) in it. If the soap easily foams up, the water is
probably ok as it is. Otherwise adding a little bit of soda at a time, stirring it to make it
disappear, until the water will foam the soap up, will be necessary.
(c) Safe Containers
Any of the types of containers, buckets, barrels or jars described in the Ashes or Soft Water
sections are called “Safe containers”
(d) Making Lye Water
A large barrel or drum to be used to make the lye water can have a tap or hole at a level a
little above the bottom, and some kind of filter placed on the inside, around the opening The
barrel will be filled with white ashes to about 10cm or 0.1m below the top, and boiled soft
water poured over the ashes. More cold (soft) water should be added slowly until liquid drips
out of the barrel top. The tap should be closed or the hole blocked. More ashes could be
added to top the barrel up again, and more soft water but so much water should not be added
that the ashes swim. This should be left to stand for four or more hours (or even over night if
there is time). Then the lye water should be allowed to drip into safe containers by opening
the tap or unplugging the hole. When the brown lye water stops coming out of the barrel, or

39
ash container, then more soft water should be poured through the ashes, collecting the lye
which comes out in a separate “safe” container (as this lye may be weaker than the first
lot).This process is repeated until no more brown liquid comes out of the ashes. The lye is
stored in a safe container and the ashes dug into the vegetable garden. It should never be
stored in aluminum or tin container. They are badly corroded by the caustic solution.
(e) Lye Water Strength
If an egg or potato floats just below half way, or a chicken feather starts to dissolve in it, the
lye water is at the right strength for local soap production. If the egg will not float, then the
lye water could be boiled down to make it stronger. If the egg seems to pop up too far, the lye
water is too strong, and a little bit of soft water (a cup at a time) would be added stirring the
lye water, until the egg floats so that its head pops up.
Method 2
This method was reported by Onyegbado et al (2002) of the Department of Chemical
Engineering, University of Port Harcourt, Nigeria, to improve the quality of ash-derived
alkali soaps in order to make them amenable to all the uses previously listed for potassium
based soaps. The lye water produced can also find other application where alkali uses are
required. The apparatus and materials used included an oven, weighing balance, a large
shallow tray called “combustion pan”, a sieve set, a spectrophotometer and laboratory glassware.
Unripe plantain peels were collected from Choba village, near Port Harcourt, Nigeria. They
were dried in an oven at 100 °C for two days to constant weight. The peels were thus said to
be “bone-dried”. The bone-dried peels were placed in an open “combustion pan” and heated
till the peels ignited. The ignition temperature, which was presumably very high, could not

40
be measured with a mercury-in-glass thermometer. A metallic rod with a wooden handle was
used to turn the burning peels, thus ensuring uniform combustion. The ashing lasted three
hours. Another sample of the “bone-dried” peels was not ashed but ground into a fine
powder. No alkali was detected when this sample was leached with distilled and
deionized water. The ash sample was homogenized by crushing by hand and then sieved
to remove large particles. Kuye and Okorie (1990) had shown that a particle size of 1.06
x 10-4 gave the highest concentration of potassium hydroxide when slurry of the ashed
sample containing 0.15kg of the ashes in 2.5dm³ of distilled and deionized water was kept for
eight hours at 60ºC. In their study, the slurry prepared under the above conditions was kept
for forty-eight hours in a further attempt to ensure maximum extraction of the alkali.
Subsequently, the slurry was filtered to obtain the extract. Spectrophotometric analysis of the
extract for metallic ions was done using an atomic absorption spectrophotometer (AAS)
available at NAFCON, Onne, Rivers State, Nigeria. The percentage compositions of the
metal ions in the extract were approximately as follows;
Sodium ion = 15.86%, Potassium ion = 84.14%. Other ions were insignificant
2.7.3 Industrial Manufacture of Alkali
Sodium hydroxide and potassium hydroxide are obtained from electrolysis of sodium
chloride and potassium chloride respectively. Since both alkalis are extracted the same way,
this work will only discuss the standard electrolytic process for the manufacture of sodium
hydroxide. This is described in several textbooks.
Sodium hydroxide is obtained when a solution of sodium chloride is electrolysed. In
solution, sodium chloride ionizes thus;
Nacl Na+ + cl
- … (2.4)
The water molecules also ionize slightly

41
H2o H+ + OH ˉ … (2.5)
At the cathode, the hydrogen ions are discharged in preference to sodium, while at the anode;
the chloride ions are discharged in preference to the hydroxyl ions.
Three types of cells have been devised for the production of sodium hydroxide
electrolytically: These are the diaphragm cell, the mercury cathode cell, membrane Cell
(a) The Diaphragm Cell:
The cell consists essentially of a porous diaphragm, closely covered on the outside with steel
gauze, which acts as the cathode shown in Fig.(2.1). The anode, which is made of graphite,
dips into the concentrated solution of sodium chloride (brine) in the porous diaphragm. The
brine gradually percolates through the diaphragm. During the electrolysis, chlorine is
liberated at the anode and hydrogen at the cathode. Sodium ions collect at the cathode. The
discharge of hydrogen ions (from water in the brine) leaves hydroxyl ions at the cathode;
sodium and hydroxyl ions, together with water, form sodium hydroxide solution. Sodium
hydroxide solution drips from the diaphragm and collects in the outer compartment of the
diaphragm. On heating the concentrated solution in iron pans, fused sodium hydroxide is
obtained, from which pellets or flakes are made.
(b) The Mercury Cathode Cell:
The cell consists essentially of graphite anodes dipping into a concentrated solution of brine
in a container as shown in Fig.(2.2). A layer of mercury covers the floor of the cell and is
kept flowing slowly through the cell. Chlorine is librated at the anode, but sodium ions,
being more easily discharged than hydrogen at the mercury elctrode, form a solution of
sodium in mercury (sodium amalgam). This amalgam flows to a trough in which it reacts
with water to give sodium hydroxide solution and hydrogen. Mercury, which is also

42
regenerated in this reaction, is returned to the electrolytic cell to pass though the process
again.
2H20+2Na/Hg = 2NaOH + H2 + 2Hg … (2.6)
Solid sodium hydroxide is obtained as before. Sodium amalgam is represented by the symbol
Na/Hg, as it is not a compound of definite atomic proportions.
(c) Membrane Cell
The Membrane Process
A membrane cell is a diaphragm cell with an improved diaphragm called a „membrane‟. This
is made from polytetrafluoroethylene (PTFE), making it a plastic membrane, which has been
modified to include anionic groups to act as an ion exchange membrane. The Membrane Cell
is replacing the older techniques which used the Castner-Kellner Mercury cell (problems with
mercury pollution) and the Gibbs Diaphragm cell (contamination of the NaOH produced with

43
Fig 2.1: Diaphragm Cell (Source: Bajah and Godman, 1976)
Fig 2.2: Mercury Cathode Cell (Source: Bajah and Godman, 1976)
Sodium Hydroxide
Solution
Chlorine
Mercury
Brine
Spent Brine
Amalgam - ve
+ ve
Chloride Out
Spent Brine Out
Steel Net Cathode
Porous Diaphragm Brine
Graphite Anode
Hydrogen Out
Brine in + ve
- ve

44
NaCl) because it gives a much purer solution of sodium hydroxide and the whole process is
more energy-efficient and less polluting. In a membrane cell, an ion-exchange membrane
separates the anode and cathode compartments. The separator is generally a bi-layer
membrane made of perfluorocarboxylic and perfluorosulfonic acid-based films, sandwiched
between the anode and the cathode
The process‟s success rests on the nature of the membrane. It is a modified PTFE called
Naflion (a du Pont polymer), the structure being given below
(http://home.clara.net/rod.beavon/membrane_cell.htm).
PTFE is very inert and so can stand immersion in hydroxide solutions for long periods of
time. The sulphonyl groups (- SO3H) make it a cation-exchange membrane, so it will pass
cations but not anions between compartments of the cell. This has nothing to do with pore
size; it depends only on the ions being positively charged. Thus sodium ions can pass to the
cathode compartment, but chloride (or other anions) cannot and so cannot contaminate the
NaOH product. Since any cations can pass through, it is important for the purity of the
NaOH produced that the concentrated brine that is fed in be pure and free from metal ions
other than sodium. The solution must be concentrated; otherwise chlorine will not be
produced at the anode. The membrane is not semi-permeable; which is used only to
describe a membrane that passes a solvent from low to high concentration in osmosis. The
saturated brine is fed to the anode compartment where chlorine is liberated at the anode, and

45
the sodium ion migrates to the cathode compartment. Unlike in the diaphragm cells, only
the sodium ions and some water migrate through the membrane. The unreacted sodium
chloride and other inert ions remain in the anolyte. About 30-32% caustic soda is fed to the
cathode compartment, where sodium ions react with hydroxyl ions produced during the
course of the hydrogen gas evolution from the water molecules. This forms caustic, which
increases the concentration of caustic solution to ~35%. The hydrogen gas, saturated with
water, exits from the catholyte compartment. Only part of the caustic soda product is
withdrawn from the cathode compartment. The remaining caustic is diluted to ~32% and
returned to the cathode compartment.
The anode compartment therefore contains sodium hydroxide solution. In one type of cell
(not the only one) 33% NaOH is taken out near the top of the anode compartment; some of
this solution is taken for concentration and sale, and some are diluted with water to 30%
concentration and returned to the bottom of the anode compartment. A diagram of this cell is
given below in Fig.2.3.
The use of this process results in virtually pure sodium hydroxide (only contains about
0.02% of sodium chloride at most) being produced as there is no contamination by chloride,
and there is virtually no oxidant in the spent brine. Furthermore, there is no working hazard
of working with asbestos or mercury. This process of using electrolysis to develop sodium
hydroxide, has been adapted in all chlor-alkali plants due to its very pure production of
sodium hydroxide, similar costs to that of the diaphragm cell (reasonable) and it has
negligible environmental impact. The process is much more preferable to that of the mercury
and diaphragm processes and has proved to be the best technique for extracting sodium
hydroxide

46
Fig.2.3 The Membrane Cell. (Source: http://www.rod.beavon.clara.net/membrane_cell.htm)

47
The Electrochemical and chemical reactions occurring in membrane cells can be summarised
as follows:
At the Anode (titanium), oxidation reaction takes place thus;
2Cl-(aq) -----> Cl2(g) + 2e … (2.4)
At the Cathode (nickel) reduction reaction takes place thus;
2H2O(l) + 2e -----> H2(g) + 2OH-(aq) … (2.5)
Na+ migrates across the membrane to cathode compartment combining with OH
- to form
NaOH.
Overall cell reaction (showing Na+ spectator ions):
2H2O(l) + 2Cl-(aq) + 2Na
+(aq) -----> 2Na
+(aq) + 2OH
-(aq) + H2(g) + Cl2(g … (2.6)
Side reactions
Cl2 + 2NaOH ==> NaOCl + NaCl + H2O … (2.7)
3NaOCl ==> NaClO3 + 2NaCl … (2.8)
Product is concentrated sodium hydroxide.
2.7.4 Alkali Metals
The Alkali Metals are the series of elements in Group 1 (IUPAC STYLE) of the periodic
table, excluding hydrogen. These are lithium (Li), sodium (Na), potassium (K), rubidium
(Rb), caesium (Cs), and francium (Fr). They are highly reactive and are never found in
elemental form in nature. See Table.2.4
The Alkali Metals are silver-colored (caesium has a golden tinge), soft, low-density metals,
which react readily with halogens to form ionic salts, and with water to form strongly alkaline
(basic) hydroxides. These elements all have one electron in their outermost shell, so the

48
energetically preferred state of achieving a filled electron shell is to lose one electron to form
a singly charged positive ion.
Eg. Na + eˉ Na … (3.9)
Hydrogen, with a solitary electron, is sometimes placed at the top of Group 1, but it is not an
alkali metal (except under extreme circumstances as metallic hydrogen); rather, it exists
naturally as a diatomic gas. Removal of its single electron requires considerably more energy
than removal of the outer electron for the alkali metals. As in the halogens, only one
additional electron is required to fill in the outermost shell of the hydrogen atom, so hydrogen
can in some circumstances behave like a halogen, forming the negative hydride ion. Binary
compounds of hydride with the alkali metals and some transition metals have been prepared.
Under extremely high pressure, such as is found at the core of Jupiter, hydrogen does become
metallic and behaves like an alkali metal.
Table 2.6 Elements of Group 1 in the periodic table.
Period Element Symbol Atomic No
2 Lithium Li 3
3 Sodium Na 11
4 Potassium K 19
5 Rubidium Rb 37
6 Caesium Cs 55
7 Francium Fr 87
Source: http://sambal.co.uk/?page_id=57

49
The first ionization energy is much lower than the second. In the case of Na, it is nine times
easier to remove the first electron than the second. The first electron, in an s-orbital, can be
removed from the element easily, but the second electron must be removed from a noble gas
core, which is closer to the nucleus, and therefore requires much energy. Thus, sodium
readily forms Na+ ions, but never forms Na²
+ ions. This means that sodium and the other
elements in Group 1 have only the one oxidation state of + 1 in their compounds.
2.7 Oxidation Numbers and S-Block Elements
Table 2.7 Physical properties of the elements in Group 1
Properties Li Na K Rb Cs Electron Structure (He)2s¹ (Ne)3s¹ (Ar)4s¹ (Kr)5s¹ (Xe)6s¹
First ionization
Energy KJ mole ¹ 520 500 420 400 380
Second ionization
Energy KJ mole ¹ 7300 4600 3100 2700 2400
Atomic radius/nm
(metallic radius) 0.15 0.19 0.23 0.25 0.26
Melting point/ºC 180 98 64 39 29
Boiling point/ºC 1330 892 760 688 690
Density/gcm-³ 0.53 0.97 0.86 1.53 1.90
Standard electrode
Potential, M+ (aq)
/M(s)/Volts -3.05 -2.71 -2.93 -2.92 -2.93
Source: http://sambal.co.uk/?page_id=57
Elements

50
2.7.6 Physical Properties
The atomic radii of alkali metals are included in Table 3.3. The atomic radii increase with
atomic number down the groups since each succeeding element has electrons in one more
shell than the previous element. The outermost s-electrons in these metals are held very
weakly by the nucleus. Thus, the outer electrons can drift further from the nucleus than in
most other atoms, and the elements have larger atomic radii than those elements which
follow them in their respective periods. The large atomic size results in weaker forces
between neighboring atoms since there is a reduced attraction of the nuclear charge for the
shared mobile outer electrons, as these electrons get further away. Consequently, the metals
have lower melting points and lower boiling points than would normally associate with
metals. All the Group 1 metals melt below 200ºC. In contrast, most of the transition metals
melt at temperatures above 1000ºC.
The reduced interatomic forces in these metals make them relatively soft. They can be cut
with a penknife. As have seen, s-block elements have larger atomic radii than transition
metals of approximately the same relative atomic mass. Thus, the s-block elements will be
less dense and have larger molar volumes. Of the elements in table 3.2, their densities vary
from approximately 1g cm ˉ ³ to 1.9g cm ˉ ³. Most transition metals have a density greater
than 7g cm ˉ ³.
2.7.7 Chemical Properties
All the metals are high in the activity (electrochemical) series. The standard electrode
potential for the conversion of each metal to its ions is positive and greater than 2.0 volts for
all metals except beryllium. Hence, these metals are very good reducing agents. They all
react vigorously with water, reducing it to hydrogen.

51
M(s) M+ (aq) + eˉ … (2.10)
H2O(1) + eˉ ½H2(g) + OH ˉ (aq) … (2.11)
Excluding lithium, which reacts slower than all the other elements of Group 1, the reactivity
of the elements with water closely follows the value of E˚, for example, sodium reacts
vigorously, fizzing and skating about on the water surface. Potassium reacts even more
vigorously giving small cracks and pops as the hydrogen explodes and producing a lilac
flame as the hydrogen burns. Rubidium and caesium explode violently in contact with water.
Although electrode potentials relate only to aqueous solutions, they also provide a guide to
the general reactively of a substance. All the s-block elements are such good reducing agents
that they can react with chlorine, bromine, sulphur, hydrogen and oxygen on heating. They,
of course, tarnish rapidly in air, forming a layer of oxide, and the reactivity of the metals is
such that lithium, sodium and potassium are usually stored under oil.

52
CHAPTER THREE
3.0 MATERIALS AND METHODS
3.1 Extraction of Alkali from Plantain Peel-Ash
The apparatus and materials used were weighing balances, a large shallow tray called
“combustion pan”, a sieve set, laboratory glass wares, hydrometer, plastic buckets and
containers. 10 kg of plantain peels were collected from eateries in Lagos, dried by placing
them under an industrial gas burner fired grease boiler until dried enough to break with hand.
The dry weight was 5kg. The dried peels were burnt inside the combustion pan with
industrial gas burner and ash of 1 kg was obtained. This is in contrast to oven drying
practiced by (Onyeagbado et al 2002). Ash samples were naturally powdery, but it was sieved
with 0.105 mm sieve (US sieve No. 140; Tyler equivalent 150 Mesh) to remove large
particles. Kuye and Okorie (1990) had shown that a particle size of 1.06 x 10⁻⁴
m gave the
highest concentration of potassium hydroxide when the slurry of ashed sample containing
0.15kg of the ashes in 2.5dm³ of distilled water was kept for eight hours at 60°C.
The ashes were allowed to cool down, packed into a 5-liter transparent bucket and boiled
water poured into it. The slurry was kept for 24 hours before draining of extract. After
draining, the first extract was kept in a separate plastic container before more cold water was
poured into the slurry for further extraction. This was repeated the third time and all the
extracts kept in different containers. The following extracts were made. 0.5 litres of 1.300
specific gravity Bio-alkali, 0.75 litres of 1.250 specific gravity bio-alkali and 0.75 litres of
1.220 specific gravity. The density of the alkali was measured using a hydrometer and then
converted to specific gravity.

53
3.2 Lubricating Grease Formulation
The apparatus and materials used included a Bunsen burner, spatula, evaporating dish,
mercury-in-glass thermometer, weighing balance, laboratory glass wares, stirrer and
penetrometer. The raw materials for preparing lubricating grease are the alkali, fatty acid and
lubricating oil. The alkali used was the bio-alkali extract, while the lubricating oil is mineral
oil. The fatty acid was palm oil. Palm oil was purchased from Agege market while N-500
base oil was from base oil tank farm in Apapa, both in Lagos. N-500 grade has viscosity of
between 91 and 101 Cst at 40oC and is good for grease production. Tallow, Stearic acid and
Caustic soda (for control experiment) were all bought from Ojota Chemical market, Lagos.
The experiments were carried out using Palm oil, animal fat (Tallow) and Stearic acid
separately. All experiments and tests were carried out in the laboratory of Mega Lube
Industries ltd, Lagos. Mega Lube Industries Ltd is a Lubricating grease manufacturing
company.
A 5x5 factorial experiment in 3 replicates was used for the study. This involved 5 different
specific gravities and 5 different volumes of the Bio-Alkali (BA). The first alkali extract was
too strong while the last extract was too weak. With the aid of hydrometer, the extracts were
compounded and five different specific gravities of the extracts were formulated by diluting
stronger extracts with weaker extracts, and kept in 5 different containers from which
experiments were carried out. To form a grease base, the volume of the base oil and the fatty
acid are usually equal while the alkali is always a fraction (percentage) of the volume of the
fatty acid. The mixture was boiled in a stainless pot and stirred. Grease preparation is
accomplished in three stages, namely; Stage 1: The mixture was boiled and stirred until
saponification takes place with foaming. Stage 2: The saponified mixture was further boiled,
stirred to dehydrate. Stage 3: The heater was turned off and melted grease base was stirred

54
and more base oil added as a finishing procedure. This is required to bring down the
temperature of the grease to safe storage range to avoid separation.
3.2.1 Preparation of bio alkali grease
The following procedures were followed in all preparations.
100ml of palm oil was mixed with 100ml of N-500 base oil. Bio-alkali with specific gravity
of 1.245 was first experimented upon using the following volumes; 33ml, 36ml, 39ml, 42ml,
45ml. After that, 1.250 SG was used, and then 1.255, 1.260 and 1.265 SG were used
respectively. In the preliminary experiments lower and higher values of volumes and specific
gravities were used in trial runs but they all gave very bad results that formed no grease at all.
It was after several trials that the above volume and specific gravity ranges were selected for
analysis because they presented data either close to or within the recommended consistency
values of 85 – 475. In each case, the three compounds; alkali, base oil and palm oil were
mixed inside a stainless steel pot. Stainless steel pot was used to withstand the corrosive
nature of alkali. The mixture was placed on a Bunsen burner and boiled. As the boiling went
on, the mixture was stirred continuously. The temperature rose rapidly and at 110oC it started
foaming. This was a sign of saponification. Foaming continued for about 10 minutes before
there was complete saponification, then dehydration and intimate mixing of the soap and base
oil commenced. This continued for the next 10 minutes before complete melting and
dehydration was achieved and this time, the temperature was maintained at 150oC. The
mixture was a transparent reddish- yellow compound. At this point, the heat was put off and
additional 100 ml of base oil gradually poured into the mixture as it was continuously stirred.
Additional 100 ml was poured because a good thickener should form a consistent grease in
concentration of 25-50wt% for metallic soap (Izuagie,2006) and up to 40% may be
acceptable for inorganic thickeners in mineral oil (Graham,1991). By the time all the oil was

55
poured, the temperature has come down to70oC. At this temperature, the grease could be
stored without the fear of separation. Palm oil was used because Tallow and Stearic acid gave
fluidized grease only when mixed with a ratio of palm oil. Hence experimentations with them
were discarded and all efforts focused on palm oil.
3.2.2 Preparation of NLGI #0 grease
The materials and methods used to determine the optimum consistency of 361 were used to
prepare NLGI #0 grease. Further dilution with lubrication oil can lead to NLGI #00 and
NLGI #000. It must be noted that there is a difference between the consistency of grease base
and consistency of the grease itself. Consistency of the grease base depends on getting
appropriate specific gravity of the alkali and mixing it at correct ratios with equal volume of
fatty acid and lubrication oil. When the specific gravity and volume of alkali are wrong, they
will affect the best consistency a grease base should have. However, when one has got the
best consistency a particular grease base can have, then the variation of the consistency of
any grease produced from it can be achieved by varying the quantity of „finishing‟ lubrication
oil added to the grease base. For the NLGI #0 grease, the ration of bio alkali, palm oil and N-
500 base lubricating oil was 1: 2.8:5.6.
3.2.3 Preparation of control samples
A polymer-base NLGI #0 from ASCON was collected as a control sample for analysis.
Another sodium-base NLGI #0 was formulated as a second control sample for analysis. The
reason for using the two control samples are as follows. ASCON grease was used because it
is commercially available, while sodium-base sample was used to have a similar soap base
for comparison since the ASCON NLGI #0 is polymer-base. The materials and methods used
for preparing the bio alkali grease is similar to that of sodium base only that sodium

56
hydroxide was used to replace the bio alkali. The ratio of the reactants is as follows: 1: 3: 15
for Caustic soda, Palm oil and N-500 base oil respectively.
3.3 Testing
No testing was carried out the same day the grease was blended. They were left till the
following day so as to fully cool down.
3.3.1 Consistency test.
The testing was done according to ASTM D217-02 Standard Test Methods for Cone
Penetration of Lubricating Grease. The penetration is measured in tenths of a millimetre.
3.3.1.1 Un-Worked Penetration Test
Three samples each of the grease and the controls were subjected to penetration test. They
had their different penetration levels measured using penetrometer by filling in a standard
grease cup, cylindrical in shape with 50ml capacity with a little disturbance, the surface was
smoothened and placed on the penetrometer assembled and pressed for five seconds during
which a special grease-cone on the assembly has its tip just touching the level of the grease
surface at the start. The distance dropped for each sample was read from the dial indicator of
the penetrometer and recorded.
3.3.1.2 Worked Penetration Test
The worked penetration test was carried out in the same manner with that of the Un-worked
penetration test but the difference was that the grease samples were worked for 60 double
strokes in the standard grease worker cup. In this method, the disturbance of the grease was
standardized by the prescribed working process and is more reliable than Un-worked

57
penetration test because the grease has been subjected to a work load of double strokes over a
wide range of temperatures.
The Un-worked and the worked penetration test describe above were used to determine the
grease consistency and the grease consistency is its resistance to deformation by an applied
force. A significant difference between un-worked and worked penetration can indicate poor
shear stability.
3.3.2 Dropping Point test
The dropping point test procedures given in ASTM standards D-566 and D-2265 were
followed. The test apparatus consists of a grease cup with a small hole in the bottom, test
tube, two thermometers, and an electric heater. The inside surfaces of the grease cup are
coated with the grease to be tested. A thermometer is inserted into the cup and held in place
so that the thermometer does not touch the grease. This assembly is placed inside a test tube.
The test tube is lowered into the container which is filled with oil in D-566 and has an
aluminium block in D-2265. Another thermometer is inserted into the oil/block.
To execute the test, the oil/block was heated, while being stirred, at a rate of 4.4 °C to 6.7 °C
per minute until the temperature is approximately 100 °C. The heat was reduced until the test
tube temperature 95°C. Once the temperature stabilized the sample was inserted and heating
continued. The dropping point was the temperature recorded on the test tube thermometer,
plus a correction factor for the oil/block temperature, when a drop of grease falls through the
hole in the grease cup.
3.4 Design of Experiment
The experiment to discover the optimum specific gravity and volume of the bio alkali extract
that gave the best grease consistency will be analyzed as a factorial experiment using Split

58
Plot in Randomized Complete Block Design. When there are two nested groupings of the
observations on the basis of treatment application, it is known as a split plot design
((http://support.sas.com/documentation/cdl/en/statug/63033/HTML/default/viewer.htm#statu
g_anova_sect028.htm). The two treatment factors in this work (specific gravity and volume) are
nested, in that each volume carries the specific gravity treatment inside it. This is unlike other
factorial experiments in which the factors are independent of each other. For instance, if we intend
to test the effect of type of alkali and type of palm oil in the consistency of the grease, then each
factor is independent of the other and simple factorial design can be applied. It must be stated that
the ANOVA is not just to determine the effect of specific gravity and volume of bio alkali in
lubricating grease per se because it is obvious that they do have significant effects, but the
essence is to lay a solid foundation to conduct FLSD so as to determine the specific gravity
and volume that have least variation within their treatment means. It is these set of data that
can be said to be the best ratios in the bio alkali grease production stoichiometry.
Split plot design is characterized by randomizations at two levels. In simple terms, a split-plot
experiment is a blocked experiment, where the blocks themselves serve as experimental units
for a subset of the factors. Thus, there are two levels of experimental units. The blocks are
referred to as whole plots; while the experimental units within blocks are called split plots,
split units, or subplots. Corresponding to the two levels of experimental units are two levels
of randomization. One randomization is conducted to determine the assignment of block-
level treatments to whole plots. Then, as always in a blocked experiment, a randomization of
treatments to split-plot experimental units occurs within each block or whole plot.
Facilities for construction of split-plot designs are not as yet generally available in software
packages; with SAS/JMP being one exception (Jones and Nachtsheim, 2009). Therefore
manual calculations will be done using machine formula shown in the appendix (Anova in

59
RCBD), since EXCEL and other available software cannot do it properly. Besides, the
construction of the ANOVA will be in nested format.
It must also be noted that Factorial experiments could be laid out in different ways such as a
Completely Randomized Design(CRD), Randomized Complete Block Design (RCBD), or
other layouts, (Kristensen and Halekoh, 2013), but Randomized Complete Block Designs is
preferred in this work. Randomized Complete Block Designs differ from the Completely
Randomized Designs in that the experimental units are grouped into blocks according to
known or suspected variation which is isolated by the blocks. Therefore, within each block,
the conditions are as homogeneous as possible, but between blocks, large differences may
exist. Recent works, most notably by Lucas and his coworkers (Anbari and Lucas (1994),
Ganju and Lucas (1997, 1999, 2005), Ju and Lucas (2002), Webb et al. (2004)) demonstrated
that many experiments previously thought to be Completely Randomized experiments also
exhibit split-plot structure.
The above explanatory note is to forestall any misunderstanding on the choice of
experimental design chosen as any other design will, unlikely produce the correct result.

60
CHAPTER FOUR
4.0 RESULTS AND ANALYSIS
Experimental work was divided into three stages as follows:
Stage 1
Preliminary experiments were conducted to eliminate various specific gravities and volumes
that did not form any type of grease whatsoever. It was after these trials that the ranges that
produced results whose consistencies fell within prescribed standard were identified. All the
data generated here were of no analytical use and hence discarded.
Stage 2
After eliminating values that did not produce grease, the experiment was expanded to identify
the specific gravities and volumes that produced grease whose consistencies either fell within
or close to the standard range. This informed the decision to narrow down the specific
gravities to 1.245 -1.260 and volume from 33% to 45%. The results of these experiments are
presented in Table 4.1 and Table 4.2. The summary of the consistencies with the quality of
grease produced is shown in the appendix.
Stage 3
The specific gravity and volume that produced the best consistency was used to formulate
NLGI #0 grease. This grease was subjected to various quality tests and compared to two
control samples. One of the control samples was grease formulated from Sodium Base while
the other was commercially available grease. The results are presented in Tables 4.3, 4.4, and
4.5
4.1 Bio alkali grease Consistency results.
The summary of the Consistency measurements of Lubricating grease produced from bio-
alkali of different specific gravities and volumes are presented in presented in Table 4.1

61
Table 4.1 Consistency measurements of Lubricating grease produced from bio-alkali
of different specific gravities and volumes.
SG %VOL REPLICATIONS TOTAL
I II III
1.245
45
42
39
36
33
500 500 500
475 474 475
470 472 471
475 473 472
500 500 500
1500
1424
1413
1426
1500
TOTAL ∑V 2420 2419 2418 7257
1.250
45
42
39
36
33
500 500 500
500 500 500
430 429 430
365 364 367
370 372 371
1500
1500
1289
1096
1113
TOTAL ∑V 2165 2165 2168 6498
1.255
45
42
39
36
33
500 500 500
500 500 500
400 399 402
361 360 362
369 367 366
1500
1500
1201
1083
1102
TOTAL ∑V 2130 2126 2130 6386
1.260
45
42
39
36
33
500 500 500
500 500 500
480 479 481
465 463 464
410 411 412
1500
1500
1440
1392
1233
TOTAL ∑V 2355 2353 2357 7065
1.265
45
42
39
36
33
500 500 500
500 500 500
480 483 481
470 472 471
472 473 474
1500
1500
1444
1413
1419
TOTAL ∑V 2422 2428 2426 7276
G/TOTAL ∑∑V 11492 11491 11499 34482

62
4.2 Production of NLGI #0 grease from Bio alkali and Sodium hydroxide
The summary of the grease produced with the various percentage compositions of the base
oil, palm, bio alkali and sodium hydroxide is as shown in Table 4.2
Table 4.2: Variation of composition and temperature of the produced grease sample
S/No Grease Sample Bio-Alkali Sodium-base 1 Mass of base oil (B) (g) 280.0 450.0
2 Mass of thickener used (T) (g) 99.2
99.0
3 Saponification temperature (oC) 110
120
4 Maximum Reaction temperature (oC) 130
150
5 Blending time (minutes) 20
30
6 Percentage (T/B) (%) 35
22
7
Cooling time to storage temp of 50 oC 30 60
4.3 Consistency Test (Un-Worked and Worked Penetration)
The summary of the un-worked and worked penetration values of the bio alkali grease,
sodium-base grease and Ascon grease is as shown in Table 4.3.

63
Table 4.3 Consistencies of NLGI #0 test samples and control (0.1mm)
S/No
Samples
Un-worked
Worked
Balance
1
Bio alkali grease 360 363 1
2
Sodium-Base grease 360 362 2
3
Ascon 363 365 2
4.4 Dropping Point Test
The summary for the dropping point test values of the grease and the controls in degree
Celsius (oC), and the cost in N/kg are as shown in the Table 4.4
Table 4.4: Dropping point values and Cost of Production
S/No
Grease sample
Dropping Point (oC)
Cost (N/kg)
1.
Bio Alkali base
143
135
2.
Control 1(Sodium base)
145
256
3.
Control 2 (Ascon)
150
300

64
CHAPTER FIVE
5.0 DISCUSSIONS
5.1 Mean of the consistencies
The summary of the mean of the consistencies from Table 4.1 is presented in Table 5.1
Table 5.1 Mean of the Consistencies.
*9 MEAN SPECIFIC GRAVITY
1.245 1.250 1.255 1.260 1.265
MEAN OF
MEANS
45
42
39
36
33
500.0 500.0 500.0 500.0 500.0
474.7 500.0 500.0 500.0 500.0
471.0 429.7 400.3 480.0 481.3
475.3 365.3 361.0 364.0 421.0
500.0 371.0 367.3 411.0 473.0
500
494.94
452.46
407.32
424.46
MEAN OF
MEANS 484.2 433.2 425.72 451 485.06
The result of the preliminary consistency test shows that the consistency was bad at both
lower specific gravity and volume. As both factors increased, the consistency improved to a
point where it started going bad again. The set of data that produced the best grease
consistency was specific gravity of 1.255 and volume of 36%. From Table 5.1 a plot of the
mean consistencies at various specific gravities and volumes was carried out with scilab
software and shown in Fig (5.1). The scilab code that produced Fig (5.1) is shown below:

65
C= [500.0 500.0 500.0 500.0 500.0
474.7 500.0 500.0 500.0 500.0
471.0 429.7 400.3 480.0 481.3
475.3 365.3 361.0 364.0 421.0
500.0 371.0 367.3 411.0 473.0];
//x : volume ([45 42 39 36 33]) and y : matrix (C)
x=[45 42 39 36 33];
plot(x,C);
plot(x',C); // idem, x is automatically transposed to match C (here the columns)
xlabel('Volume'); ylabel('Consistency');
Fig 5.1 is a chart which can be used to determine the grease consistency given any specific
gravity and volume of choice. The graph is also used to develop the consistency equation
shown in equation (5.12) From graph, it is obvious that best mean specific gravity and
volume of the alkali that gave the best consistency of 361 are SG1.255 and Volume 36%.

66
Fig. 5.1 Graph of Grease Consistency at different Specific gravities and Volumes

67
5.2 Analysis of variance (ANOVA)
Analysis of Variance (ANOVA) was carried out to determine the effect of Specific gravity
(SG) and Volume (V) of Bio-alkali on the Consistency of the lubricating grease produced
The ANOVA is shown in Table 5.2. Analysis of variance (ANOVA) is a collection of
statistical models used to analyze the differences between group means and their associated
procedures (such as "variation" among and between groups), in which the observed variance
in a particular variable is partitioned into components attributable to different sources of
variation.
Table 5.2 ANOVA showing the effect of Specific gravity and Volume of Bio-alkali on
the consistency of lubricating grease.
SOURCES OF
VARIATION
D.F S.S M.S OBS.F EXPECTED F
1%
MAIN PLOT ANALYSIS
µ 1 158344.32 - -
8.65
7.01
Block
Factor A
Error(a)
2
4
8
1.52
48119.13
7.43
0.76
12029.78
0.93
0.82N.S
12935.25**
Total 14 48128.08
SUB-PLOT ANALYSIS
Factor B
Interaction AB
Error(b)
4
16
40
78526.75
52831.13
31.72
19631.69
3301.95
0.79
24850.24**
4179.68**
3.83
2.49
Total 60 131389.60
Grand Total 74 179517.68
NB: N.S = Not Significant, ** = highly significant.

68
Null hypothesis Ho: µA = µB … (51)
Alternative hypothesis H1: µA ≠ µB … (5.2)
Where Ho = null hypothesis, µA = factor A treatment means, µB = factor b treatment means
In analysis of variance, an F-test is used to test group variance against a null hypothesis, and
is often used to determine whether any group of trials differs significantly from an expected
value. If F-calculated is greater than the F-tabular, then there is a significant treatment effect,
and that at least one of the treatments is different. F-LSD or LSD can be done to find which
Mean(s) is (are) different.
The null hypothesis for this work is as follows
1. All the blocks have the same effect on the consistency of the bio alkali grease
2. All the levels of specific gravity (factor A) have the same effect on the consistency of the
grease
3. All the levels of volume (factor B) have the same effect on the consistency of the grease
4. All the combinations of specific gravities and volumes have the same effect on the
consistency of the grease
This null hypothesis simply means that there are no significant differences in the effects of
the blocking, the specific gravity levels, the different volumes and the interaction between the
different levels of specific gravity and the volumes. If null hypothesis is accepted, then no
stoichiometry can be generated from the experiment. This will mean that either more work
needs be carried out or that bio alkali cannot be used to produce grease.
5.3 Standard Errors of the Experiments
Formula for calculating standard errors for the experiment can be seen in the appendix.
(a) Standard error of the difference between two factor A means or between two main plot
(Whole plot) treatment means is 0.99532

69
(b) Standard error of the difference between two factor B means, that is, two sub-plot
Treatment means is 2.055
(c) Standard error of the difference between two factor B means (i.e. sub-plot treatment
Means) for the same level of factor A i.e. a1b1- a2b2 is 4.599
(d) Standard error of the difference between two factor A means of the same or different
levels of B is 4.173
Looking at the ANOVA Table, the observed F < Expected F for blocks at 1% levels of
probability. Hence null hypothesis is accepted. However for factors A, B and Interactions
AB, observed F > Expected F, hence null hypothesis is rejected. Then alternative hypothesis
H1: µA ≠ µB is accepted.
The summary of the ANOVA table is as follows
1. The effect of blocking on the consistency of the grease is not significant at 1% level of
probability. This result is obvious since the experimental material is homogenous.
2. The effect of specific gravity of the bio-alkali on the consistency of lubricating grease
produced with it is significant 1% levels of probability.
3. The effect of the volume (quantity) of bio-alkali used in saponification of palm oil for the
production of lubricating grease on the consistency of grease produced is also significant at
1% level of probability
4. The combined effect of both the specific gravity and the quantity of bio-alkali used in
Lubricating grease production is equally significant at 1% level of probability.
Having concluded that both factors, volume and specific gravity, have significant effects
statistically, it is necessary to determine the particular treatment means that contributed to
these differences. This was done by FLSD
The decision rule for FLSD =LSD at any α-level is as follows:

70
If the difference between any two means is greater than their LSD (least significant
difference), then those two means are statistically different at that α-level. Conversely, if the
difference between any two means is less than their LSD or FLSD, then those two means are
statistically equal. The aim here is determine those treatments that are statistically different
and observe their levels of contributions to the effects observed in ANOVA. The treatment
means that have least variations within its effects when the means are separated will be used
as the appropriate ratio that will form the stoichiometry of bio alkali grease.
To separate the means by the means of FLSD = LSD at 1% level of probability, a two way
test was done in order to ignore the sign convention. The calculations are shown in the
appendix
1. For factor A, specific gravity,
FLSD = LSD = tα 2, Error (a) d.f x Sd = 3.343
Then table of mean difference for the mean of means from Table 5.1 is shown in Table 5.3
below for specific gravity effect on consistency.
Table 5.3 Table of mean difference for the mean of means of consistency due to the
effect of Specific gravity as factor A
SPECIFIC
GRAVITY
SG1.265 SG1.260 SG1.255 SG1.250 SG1.245
= 485.06 = 451 = 425.72 = 433.2 = 484.2
SG1.245 = 484.20
SG1.250 = 433.20
SG1.255 = 425.72
SG1.260 = 451
SG1.265 = 485.06
0.86 33.2 58.48 51 0
51.86 17.8 7.48 0
59.34 25.28 0
34.06 0
0

71
From Table 5.2, it is obvious that FLSD is only greater than the difference between the mean
of means of consistency reading under SG1.245 and SG1.265. Hence null hypothesis is
accepted that:
Ho: µSG1.245 = µSG1.265. … (5.3)
That means that statistically speaking, both SGs have the same consistencies. Null hypothesis
is however rejected for all other means, and alternative hypothesis is accepted indicating that
the mean of means of other SGs presented statistically significant differences in consistencies
and the relationship from Table 5.3 is as follows:
HA : µSG1.265 >µSG1.260 > µSG1.250 > µSG1.255 … (5.4)
It is instructive to notice that SG1.255 has the minimum variation within its consistency
means and hence presents the best option as an ideal specific gravity for the bio-alkali. Again,
this information from FLSD not only confirms that of ANOVA that differences in the SGs
have high significant effect on the consistency of the grease produced, it has gone further to
show the relationship between the effects in equations (5.3) and (5.4)
2. Secondly FLSD for factor B, the volume of bio-alkali = 4.15
The table of mean difference for the mean of means from Table 5.1 is shown below for
volume effect on consistency in Table 5.4

72
Table 5.4 Table of mean difference for the mean of means of consistency due to the
effect of volume as factor B
% VOLUME 33%=424.4 36%=407.32 39%=452.46 42%=494.94 45%=500
45%=500
42%=494.94
39%= 452.32
36%=407.32
33%=424.40
75.54 92.68 47.54 5.06 0
70.48 87.62 42.48 0
28.0 45.14 0
17.08 0
0
Judging from the FLSD of 4.15, and Table 5.4, null hypothesis was rejected for all means and
alternative hypothesis accepted as:
HA : µ45 > µ42 > µ39 > µ33 > µ36 … (5.5)
It is equally instructive to notice that VOL36 has the minimum variation within its consistency
means and hence presents the best option as an ideal volume for the bio-alkali. Again, this
information from FLSD not only confirms that of ANOVA that differences in the volume of
the bio-alkali used have high significant effect on the consistency of grease produced, it has
equally gone further to show the relationship between the effects in equation (5.5)
5.4 Consistency Empirical formulation
Obviously there is a relationship between the interactive effect of the volume of alkali used in
grease production and its specific gravity on the consistency of lubricating grease produced
as shown in Fig. 5.1. This relationship, however, has not been captured mathematically in
literature. The analysis of variance indicated that the effects of both volume and specific
gravity on the lubricating grease consistency are very significant, so also is the effect of the

73
interactions of both factors. To express these effects mathematically, using the experimental
results in Table 5.1, various mathematical equations were examined to determine whether a
model could be developed to define this relationship as captured in Fig 5.1. They were then
modeled into an empirical formula.
Mathematical relationship between specific gravity and volume of bio alkali in lubricating
grease production are given below
1. Linear equation
A linear equation is an algebraic equation in which each term is either a constant or the
product of a constant and (the first power of) a single variable. A common form of a linear
equation in the two variables x and y is
... (5.6)
where m and b designate constants (parameters), the constant m determines the slope or
gradient and b determines the point at which the line crosses the y-axis, otherwise known as
the y-intercept.
The general (or standard) form linear equation considered is written as:
… (5.7)
where A and B are constants, C is consistency while x and y are volume and specific gravity
respectively. It is obvious that the data of Table 6.1 cannot give a straight line graph. Hence
linear equation was discarded.
2. Exponential Function
The exponential function considered was

74
C = e(x+y)
… (5.8)
Where C is the consistency; x and y are volume and specific gravity respectively.
It is equally obvious that this function cannot be used to describe the data in Table 5.1
3. Logarithmic Function
The Logarithmic function considered is given in equation (5.9)
Log(xy) = Log(x) + Log(y) … (5.4)
Where x is volume and y is specific gravity; xy is a combination of x and y. The data again
did not fit well to the function and was therefore discarded.
4. Quadratic Function
Another mathematical function considered was the quadratic function in the form given in
equation (5.10)
… (5.10)
This was inappropriate because it has a single variable specific gravity, then a bivariate
quadratic function of the second-degree polynomial was also considered. The bivariate
quadratic function is given in equation (5.11).
Cst = Ax2 + By
2 + Cx +Dy + Exy + F … (5.11)
Where Cst is consistency, x is specific gravity, and y is volume. A,B,C,D,E and F are
constants. This equation can faithfully simulate the behaviour of the data in Table 5.1 and
Fig. 5.1 with due considerations.

75
General considerations
The following empirical formula was developed using the data range that falls in between
specific gravity of 1.250 – 1.260, and volume of 33% and 36% taking cognizance of equation
(6.10) The enclosed data gave a less erratic behavior and can be assumed to represent the
consistency response to variation in specific gravity and volume of the bio alkali. To
faithfully simulate the data empirically, the parameters in equation (10) are defined as
follows:
A = 4.4, B = 2(105), C= -11, D = -100, E = 1 and F = 361 (the best consistency)
VB = (v – vi), SGB = (Sg – sgj)
Cstij = Grease consistency at ith column and jth row
v = the volume of bio alkali that gave the best consistency = 36
vi = The volume of bio alkali at ith column
sg= the specific gravity of the bio alkali that gave the best consistency = 1.255
sgj = the specific gravity of the bio alkali at the jth row
F = the best consistency got for the bio alkali grease at v = 36 and sg = 1.255
Hence equation (5.11) can be reduced to
Cst = 4.4VB 2
+ 160000 SGB 2 - 11VB - 100 SGB + VB .SGB + 361 … (5.12)

76
5.5 Regression Analysis
As stated earlier, just like in every other stoichiometric development, parabolic data are
always generated. To obtain a linear regression one has to apply the principle of single
jeopardy by dividing the data into two with the best reading as terminal; either in ascending
or descending order. Whichever of the data that presents the cheapest option is chosen as data
of single jeopardy while the other is a data of double jeopardy. The jeopardy is bad part of the
data while single jeopardy occurs when little was spent in getting the bad result, but
additional jeopardy is incurred if much is spent and yet bad result was got. Based on this
theory, linear regression can be computed for the data.
From the table of means (Table 5.1) it is obvious that at 36% volume all the grease produced
were consistent and that the best overall consistency was got at SG of 1.255 and 36% volume.
Hence 36% volume was chosen as the volume upon which different specific gravities and the
resulting consistencies would be used for the regression equation. Specific gravity is treated
as independent variable while consistency is treated as dependent variable.
Linear regression equation is given as
Y = a + bX … (5.13)
Where Y = dependent variable
a = the interception (the value of y when x =0)
b = the gradient of the line
X = independent or explanatory variable.
To solve the regression equation, one has to solve for „a‟ and „b‟
b = ∑[(xi - µx)(yi -µy)] ∑[(xi - µx)2] …(5.14)
a = µy - bµx . ... (5.15)
where xi = the x value for observation i. i = 1 to n, n being the number of data

77
µx = mean value of x
yi = value of y for observation i,
µy = mean value of y
From Table 5.1, values of x and y were generated for specific gravity, X = 1.245 to 1.255,
and consistency, Y = 475.3 to 361.0 as shown in Table 5.4.
NB Dividing the parabolic data of Table 5.1 into two gives SG 1.245 to 1.255 and SG 1.255
to 1.265. The first half, SG 1.245 to 1.265 is cheaper than the second half of SG 1.255 to SG
1.265 because it is cheaper to produce lower value SGs. Hence the first half of the data and
their corresponding consistencies were used.
Table 5.5 Regression analysis data
From equation (5.14), b = -11830,
From equation (5.15), a = 15188.
Hence regression equation
Y = 15188-11830X … (5.16)
X Y
1.245 475.3
1.250 365.3
1.255 361.0
TOTAL 3.75 1201.6
MEAN 1.25 400.5

78
5.6 Coefficient of Determination
This is used to determine how well the regression equation fits the data and is given as,
R2 = {(1 n ) * ∑ [ (xi - µx) * (yi - µy) ] (σx * σy ) }
2 …(5.17)
Where R is correlation, n is the number of observations used to fit the model, ∑ is the
summation symbol, σx is the standard deviation of x, and σy is the standard deviation of y.
σx =√[∑ (xi - µx )2/n] … (5.18)
= 0.00409
σy = √[∑ (yi - µy)2/n] … (5.19)
= 54.80
Therefore, Coefficient of determination
R2
= 0.88
The coefficient of determination of 0.88 indicates that about 88% of the variation in the
consistency of the grease produced when bio alkali used in production is 36% volume of the
Palm oil used can be explained by the relation to the specific gravity of the bio-alkali. This is
a good fit for the data.
5.7 Optimization
Mathematically speaking, optimization is the maximizing or minimizing of a given function possibly
subject to some type of constraints. An optimization problem can be represented in the following
way
Given: a function f : A R from some set A to the real numbers
Sought: an element x0 in A such that f(x0) ≤ f(x) for all x in A ("minimization") or such
that f(x0) ≥ f(x) for all x in A ("maximization").
Typically, A is some subset of the Euclidean space Rn, often specified by a set of constraints,
equalities or inequalities that the members of A have to satisfy. The domain A of f is called

79
the „search space‟ or the „choice set‟, while the elements of A are called „candidate solutions‟
or „feasible solutions‟. The function f is called, variously, an objective function, cost
function, etc.
The objective function for the experiments and hence the entire project is “consistency”.
Several thickeners, both soap and none soap base are available for lubricating grease
production. Soap base thickeners are product of chemical reaction between fatty acid and
alkali. Consistency of lubricating grease is a measure of its stiffness, and before any product
is called grease, the consistency must fall within those given by ASTM and NLGI, as
presented in Table 2.1
In systems engineering, optimization has to do with the efforts and processes of making a
decision, a design, or a system as perfect, effective, or functional as possible. It can involve
the specific methodology, techniques, and procedures used to decide on the one specific
solution in a defined set of possible alternatives that will best satisfy a selected criterion. This
is also known as system optimization and that is our concern in this project
The objective function of this project is the grease consistency but consistency has no
empirical formula; hence in optimizing this project the objective is to minimize the cost of
producing grease with the consistency of NLGI # 0 to 000 with plantain peel ash as the
source of alkali.
Three major ingredients are required for grease production, but only two can be manipulated
to optimize the profit. This can be achieved by minimizing their costs. The three ingredients
are Alkali, Palm Oil and Lubricating Oil. However the two variables whose costs can be
minimized are alkali and lubricating oil. There is little option in palm oil since there is only
one palm oil type in the world. Cheap sourcing is the only option for it.

80
5.7.1. Bio-alkali production Optimization
To minimize the cost of production of bio-alkali, the following procedures are recommended
(a) Location of plantain chips manufacturers and other eateries that deal on lots of plantain
menu. These people will have lots of plantain peels.
(b) Drying will not be carried out in oven as practiced by (Onyeagbado et al, 2002). Collected
peels should be kept under any industrial heat source like boilers or burners as was practiced
in this project. The waste heats from the burner will dry the plantain peels.
(c) Very dried plantain peels should be set on fire either in open chamber or specially
constructed incinerator. By this no fuel is wasted in the combustion process.
(d) Any type of water, especially bore-hole water should be used in extracting the alkali since
foamability of the soap base is not desirable.
This procedure was followed and the bio alkali produced was =N=50/litre when compared to
its industrial equivalent of =N=150/litre.
5.7.2 Optimizing lubricating oil selection
Grease of NLGI#0 to 000 consistencies are mainly used in gear box applications that are
either noisy, worn out or is leaking. Incidentally most gear oils are dark in colour. So instead
of using a lighter coloured N-500 base oil whose cost is =N=250/litre, one should go for
HPFO( high pour fuel oil) which is very thick and yet cost about =N=85/ litre. The grease
will be darkish but not different from the colour of regular gear oil but much cheaper.
To formulate NLGI # 0 grease during this project work the following ratio was used
Grease = 36ml alkali: 100ml Palm oil: 200ml Lube Oil = 302g grease.
The cost of the grease will be N74 based on the prevailing cost of raw materials and the
optimized bio-alkali grease will cost N40.8
Producing similar grease with regular caustic soda and N-500 base oil will cost N77.4

81
This makes production of Bio alkali grease very profitable for consistency of NLGI#0.
5.8 Comparative analysis of the grease samples
From Table 5.2, it obvious that the ratio of thickener of bio alkali soap to the base oil is 35%
while it is 22% for sodium base control sample. This is not unexpected because the nature
and structure of soap will determine the quantity of its soap that will thicken the grease
formed. Oluremi, (2012) et al stated that soaps produced from the ash-derived alkalis were
not solid; they were soft and jelly-like. This is expected as the percentage concentration of
potassium in plantain peel is higher than that of sodium in the extract. The "softness" of the
soap made from the extract could therefore be attributable to its large content of potassium
hydroxide as potassium hydroxide soaps are known to be softer than the ones made from
sodium hydroxide and have found uses in such areas as liquid soaps; as shampoos; shaving
creams; cleaning of dirty floors and kitchen utensils; in emulsion polymerization processes
used in rubber and plastic industries and in such other similar uses. However the percentage
soap content of the grease is within the acceptable standards of 40%. Sodium base soap has
lower soap percentage for the obvious reasons that it sodium hydroxide produces stronger
soap than potassium hydroxide. From economic point of view, the higher percentage of bio
alkali soap thickener present in the bio alkali grease is desirable since it is very cost effective.
5.9 Grease production parameters
Production of bio alkali grease presented better application of lower temperatures both for
saponification and reaction than that of sodium base grease. While the grease has
saponification and reaction temperatures of between 110 - 130 oC, sodium base grease
production temperature ranged between 120-150 oC. This could be explained in two ways.
One, bio alkali contains more of potassium hydroxide which is more reactive that sodium

82
hydroxide, hence saponification takes place at lower temperature than that of sodium soap.
Also from Table 3.3, it is obvious that potassium has both lower melting and boiling point
than sodium. The other reason why the maximum production temperature is higher in sodium
grease could be attributed to stronger soap formed by sodium hydroxide and consequently,
higher temperatures are needed to melt the soap base for intimate mixing with the lubricating
base oil. This difference in temperature can be entirely attributed to differences in soap base
since the same base oil was used. According to Olisakwe, (2011) grease formulations are
mainly due to the composition and chemo-physical properties of the base oil with particular
reference to viscosity especially in relation to temperature
After grease is produced, it is allowed to cool enough before use. The cooling time of bio
alkali grease to storage temperature of 50 o C (from industry experience) was also shorter than
that of the sodium base and the reason can be attributed to the sodium being a heavier alkali
metal than potassium with the density of 0.97gcm-3
compared to 0.87 gcm-3
and also due to
the higher reaction temperature achieved in producing sodium base grease. It took bio alkali
30 minutes to cool down from 130 oC to 50 degrees but took sodium one hour to cool down
to 50oC from 150
oC.
Blending time to produce bio alkali grease is shorter than that of sodium base but the reasons
can be deduced from the factors mentioned above as regards reactivity and temperature
requirements that favour bio alkali grease. This development should not be confused with the
position of Awoyale et al, (2011) that the higher the quantities of the thickener or close to the
amount of the base oil, the more difficult will be the formation of grease. This is because
different soap bases are used in this work and his assertion could be true if the same soap
base is used.

83
5.10 Grease consistency analysis
For the grease consistency test, both the prepared one and that of the controls (Sodium-base
and Ascon NLGI#0 grease) were measured using the parameters of the un-worked and the
worked penetration test and there were not much differences between them. A significant
difference between un-worked and worked penetration if any indicates poor shear stability.
Grease consistency is the resistance to deformation by an applied force; this depends on the
type and amount of thickener used and the viscosity of the base oil. This is confirmable in
Table 5.3 which shows the values (in mm) obtained from the un-worked and worked
penetration tests.
5.11 Dropping point analysis
Dropping point test is of importance for grease properties because it gives a general
indication of the temperature at which lubricating grease changes from semi – solid to liquid
state under specific test conditions. The dropping point of the bio alkali grease was 123 oC
and is lower than that of the sodium base (130 oC) and Ascon (127
oC) . This behaviour can
be attributed to the fact that the bio alkali soap base has lower meting point than that of
sodium soap, however the cost of producing bio alkali grease is the cheapest amongst the
three samples. Ascon NLGI #0 grease is polymer-base and hence what was measured cannot
be called dropping point technically because dropping points are specifically used for soap-
base lubricating grease. With gearboxes, the acceptable operating temperature range can be
up to 50°C more than the ambient temperature (maximum 45°C) because of the compactness
and the lower quantity of oil contained in modern gearboxes. With a standard gearbox, the
maximum allowable inside temperature is 80°C. Higher temperature could damage the oil
seals (www.rotomotive.com/support_operating_temperature.html). This shows that all the
three samples can withstand the maximum temperatures a gear box can generate. This further

84
makes the bio alkali grease suitable for gear box applications. While the other samples had
better performances indices, bio alkali performances are within the acceptable standard and
the grease is much cheaper than the other samples. This makes the prospect of producing bio
alkali grease attractive.

85
CHAPTER SIX
6.0 CONCLUSION AND RECOMMENDATIONS
6.1 Conclusion
From the result of this study, it was concluded that:
(1) Alkali from plantain peel was discovered to form a good grease base but only in the range
of consistency number NLGI#0 to 000.
(2) The cost of bio-alkali produced was N50/litre as against N150/litre of its industrial
equivalent. This will help producers cut down the cost of their production by exploring vast
quantities of bio-wastes that can be converted to bio-alkali.
(3) The bio-alkali produced was good when compared to both the sodium-base and
commercial grease used as controls.
(4) The combination of specific gravity and percentage volume of the bio-alkali that gave the
best consistency of 361 are 1.255 and 36% respectively.
(5) The consistency of the bio-alkali grease is within the ASTM standards and the dropping
point can comfortably accommodate temperatures generated with gear boxes for which the
consistency is suitable for applications.
The overall benefit of this study is that the knowledge gap of appropriate stoichiometry for
producing grease from ashes of plantain peel has been provided, and dumping of plantain
peels in heaps in farms which is considered adverse to soil fertility will stop.
6.2 Recommendations
It is recommended that further researches should be carried out on using composite mixture
of bio-alkali and pure sodium hydroxide to produce grease. This is necessary because since
sodium-base can produce very hard grease, the composite mixture of bio-alkali and pure

86
sodium hydroxide will definitely produce grease that has better consistency than that of
ordinary pure bio-alkali and at the same time cheaper in price than those produced from pure
sodium hydroxide. These mixed-base greases will definitely have wider applications than
those of bio-alkali and more affordable than their commercially available equivalents.

87
APPENDIX
ANOVA IN SPLIT-PLOT RANDOMIZED COMPLETE BLOCK DESIGN
The Experimental Design is a factorial experiment in a Split-Plot Randomized Complete
Block Design (RCBD). Data was used from Table A1 shown below while Table A2 is for a
sub-plot analysis. Analysis of Variance (ANOVA) was carried out to determine the effect of
Specific gravity (SG) and Volume (V) of Bio-alkali on the Consistency of the lubricating
grease produced. Facilities for construction of split-plot designs are not as yet generally
available in software packages; with SAS/JMP being one exception (Jones and Nachtsheim,
2009). Therefore manual calculations will be done using machine formula shown in the
appendix (Anova in RCBD), since EXCEL and other available software cannot do it
properly. Besides, the construction of the ANOVA will be in nested format.
The ANOVA is shown in Table A3.
To construct the ANOVA table, it is necessary relevant information and formula be stated.
Factor A is specific gravity, a=5, Factor B is Volume, b=5, Replications, r=3

88
Table A1. Consistency measurements
SG %VOL REPLICATIONS
I II III
1.245
45
42
39
36
33
500 500 500
475 474 475
470 472 471
475 473 472
500 500 500
1500
1424
1413
1426
1500
TOTAL ∑V 2420 2419 2418 7257
1.250
45
42
39
36
33
500 500 500
500 500 500
430 429 430
365 364 367
370 372 371
1500
1500
1289
1096
1113
TOTAL ∑V 2165 2165 2168 6498
1.255
45
42
39
36
33
500 500 500
500 500 500
400 399 402
361 360 362
369 367 366
1500
1500
1201
1083
1102
TOTAL ∑V 2130 2126 2130 6386
1.260
45
42
39
36
33
500 500 500
500 500 500
480 479 481
465 463 464
410 411 412
1500
1500
1440
1392
1233
TOTAL ∑V 2355 2353 2357 7065
1.265
45
42
39
36
33
500 500 500
500 500 500
480 483 481
470 472 471
472 473 474
1500
1500
1444
1413
1419
TOTAL ∑V 2422 2428 2426 7276
G/TOTAL ∑∑V 11492 11491 11499 34482

89
Table A2. Block total readings for total sum of squares for Sub-Plot Analysis
FACTOR B TOTAL
b1 b2 b3 b4 b5
a1
a2
FACTOR A a3
a4
a5
1500 1424 1413 1420 1500
1500 1500 1289 1096 1113
1500 1500 1201 1083 1102
1500 1500 1440 1392 1233
1500 1500 1444 1413 1419
7257
6498
6386
7065
7276
TOTAL 7500 7424 6787 6410 6362 34482
NB
N.S means not significant
* means Significant
** means highly significant
Mean square MS = SS/d.f
Error = Total – treatment
Observed F = MStr/MSe
Expected F, from Table.

90
Table A3. ANOVA showing the effect of Specific gravity and Volume of Bio-alkali on
the consistency of lubricating grease.
SOURCES OF
VARIATION
D.F S.S M.S OBS.F EXPECTED F
5% 1%
MAIN PLOT ANALYSIS
µ 1 158344.32 - - - -
Block
Factor A
Error(a)
2
4
8
1.52
48119.13
7.43
0.76
12029.78
0.93
0.82N.S
12935.25**
4.46
3.84
8.65
7.01
Total 14 48128.08
SUB-PLOT ANALYSIS
Factor B
Interaction AB
Error(b)
4
16
40
78526.75
52831.13
31.72
19631.69
3301.95
0.79
24850.24**
4179.68**
2.61
1.90
3.83
2.49
Total 60 131389.60
Grand Total 74 179517.68
Main Plot analysis
(i). Correction For the Mean
CFM =(X2…) abr = (∑∑∑X
2ijk)/abr …….(1)
= (500+475+…474+471)2/5x5x3 = 1583444.32
(ii). Total Sum of Squares
TSS = ∑∑∑X2
ijk – CFM … (2)
[(500)2 + (475)
2 +…+ (474)
2 + (471)
2] – 1583444.32 = 179517.68
(iii) Block Sum of Squares

91
BSS = (∑X2
i..)/ab – CFM … (3)
= [(11492)2 + (11491)
2 + (11499)
2]/5x5 – 1583444.32 = 1.52
(iv) Factor A Sum of Squares
FASS = (∑X2.j.)/rb – CFM … (4)
= [(7257)2 + (6498)
2 +…+ (7276)
2]/3x5 – 1583444.32 = 48119.13
(v) Error(a) Sum of Squares
E(a)SS = Whole plot SS - BSS – FASS … (5)
Whole plot SS = (∑∑Xij.)/b - CFM … (6)
= [(2420)2 + (2419)
2 +…+(2426)
2]/5 - 1583444.32 = 48128.08
E(a)SS = 7.43
(vi). Factor B Sum of Squares
FBSS = (∑X2..k)/ar - CFM …(7)
From Table 7,
FBSS = [(7500)2 + (7424)
2 +…+ (6361)
2]/5x3 – 1583444.32 = 78526.75
(vii) Interaction AB Sum of Squares
ABSS =( ∑X2.jk)/r – CFM – FASS – FBSS … (8)
= [(1500)2 + (1500)
2 +…+(1419)
2]/3 – CFM – FASS – FBSS = 52831.13
(viii) Error(b)SS Sum of Squares
E(b)SS = TSS – Whole Plot SS – FBSS-ABSS …(9)
= 31.72.
Standard Errors of the Experiments
(a) Standard error of the difference between two factor A means or between two main plot
(whole plot) treatment means is as follows:
Sd = √(2E(a)/rb) … (10)
= √[(2x7.43) 3x5] = 0.99532

92
(b) Standard error of the difference between two factor B means, that is, two sub-plot
Treat ment means is given as
Sd = √(2E(a)/rb) … (11)
= √[(2x31.72) 3x5] = 2.055
(c) Standard error of the difference between two factor B means (i.e. sub-plot treatment
Means) for the same level of factor A i.e. a1b1- a2b2 is given as
Sd = √(2E(b)/r) … (12)
= √[(2x31.72) 3] = 4.599
(d) Standard error of the difference between two factor A means of the same or different
levels of B i.e. b1a1 – b1a1 or b1a1 – b2a1 is given as
Sd = √{[2(b–1)E(b) + E(a)]/rb} … (13)
= √[(2x4x31.72 + 7.43) 3x5] = 4.173
FLSD CALCULATIONS
1. For factor A, specific gravity,
FLSD = LSD = tα 2, Error (a) d.f x Sd …. (14)
From ANOVA table, Error (a) d.f = 8, and from eqn(10), Sd for A = 0.99532
From the student t-distribution table, (tα 2, 8) = 3.36
Then FLSD0.05 = 3.36 x 0.995 = 3.343
2. Secondly FLSD was done for factor B, the volume of bio-alkali.
From equation (11), Sd for factor B is 2.055. From ANOVA Table 8 Error(b) d.f = 40.
From student t-test table, (t0.025 , 40) = 2.02
FLSD = 2.055 x 2.02 = 4.

93
Table A4. Summary of measured parameters of the plantain peel ash grease
Specific Gravity
% Volume of ash extract
33%
36% 39% 42% 45%
1.245
500 (fluid)
475 (fluid)
471 (fluid)
475 (fluid)
500 (fluid)
1.250
371 (very soft)
365 (very soft)
430 (semi fluid)
500 (fluid)
500 (fluid)
1.255
367 (very soft)
361 (very soft)
400 (semi fluid)
500 (fluid)
500 (fluid)
1.260
411 (semi fluid)
464 (fluid)
480 (fluid)
500 (fluid)
500 (fluid)
1.265
473 (fluid)
471 (fluid)
481 (fluid)
500 (fluid)
500 (fluid)

94
REFERENCES
Awoyale, A.A. Odubiyi, O.A, Eloka-Eboka, A.C (2011) Production and Testing of
Biodegradable Grease from Black-Date (Canarium schweinfurthii) Oil Journal
of Innovative Research in Engineering and Sciences (pp.223-233)
Babayemi, J. O., (2008). Evaluation of ten different
African wood species for potash production. International Journal of Physical
Sciences Vol. 3; 63-68.
Anbari, F. T. and Lucas, J. M. (1994). “Super-Efficient Designs: How to Run Your
Experiment for Higher Efficiencies and Lower Cost”. ASQC Technical
Conference Transactions, pp. 852–863.
Anbari, F. T. and Lucas, J. M. (2008). “Designing and Running Super-Efficient Experiments:
Optimum Blocking with One Hard-to-Change Factor”. Journal of Quality
Technology Vol. 40, pp. 31–45.
ASTM D566 - 02 Standard Test Method for Dropping Point of Lubricating Grease, ASTM
ASTM D2265 - 06 Standard Test Method for Dropping Point of Lubricating Grease Over
Wide Temperature Range, ASTM
Baja, S.T. and Godman, A. (1976) Chemistry: A New Certificate Approach.
Longman Press Lagos
Bajah, S.T, Teibo, B.O,Onwu, G. and Obikwere, A. (1995) Senior Secondary Chemistry.
Longman Nigeria PLC
Billet, M. (1979) Industrial Lubrication: A Practical Handbook for Lubrication and
Production Engineers. 1st ed. Pergamon Press Ltd Oxford, England.

95
Box, G.; Hunter, W.; and Hunter, S. (2005). Statistics for Experimenters: Design, Innovation,
and Discovery, 2nd edition. New York, NY: Wiley-Interscience.
Box, G. and Jones, S. (1992). “Split-Plot Designs for Robust Product Experimentation”.
Journal of Applied Statistics Vol. 19, pp. 3–26. Journal of Quality Technology
Vol. 41, No. 4, October 2009
Box, G. and Meyer, R. D. (1986). “An Analysis for Unreplicated Fractional Factorials”.
Technometrics Vol. 28, pp. 11–18.
Culpin, C. (1981) Farm Machinery. ELBS. Low Priced Edition. 19th
ed. Granada Publishing
Ltd, London.
Edewor, J.O. (1984) Chemicals Production from Fossil Fuels and the Nigerian Balance of
Trade. Journal of the Nigerian Society of Chemical Engineers. Vol. 3:5-9.
Enwere, N.J. (1998). Foods of Plants Origin. Afro-Orbis Publication Ltd., Nsukka.
Fisher, R. A. (1925). Statistical Methods for Research Workers. Edinburgh: Oliver and Boyd.
Ganju, J. and Lucas, J. M. (1997). “Bias in Test Statistics when Restrictions in
Randomization Are Caused by Factors”. Communications in Statistics: Theory
and Methods Vol. 26, pp. 47–63.
Ganju, J. and Lucas, J. M. (1999). “Detecting Randomization Restrictions Caused by
Factors”. Journal of Statistical Planning and Inference Vol. 81, pp. 129–140.
Ganju, J. and Lucas, J. M. (2005). “Randomized and Random Run Order Experiments”.
Journal of Statistical Planning and Inference 133, pp. 199–210.

96
Hill, G. C and Holman, J.S (1979). Chemistry In Context. 3ed. Heineman Educational Books
Ltd, London
Holderness, A. and Lamber, J. (1980) A New Certificate Chemistry. Heinemann Educational
Books Ltd, London.
http://en.wikipedia.org/wiki/Dropping_point (Accessed June 2012)
http://www2.hawaii.edu/~halina/603/603RCBD.pdf (Accessed June 2012)
http://www.astm.org/Standards/D2265.htm (Accessed June 2012)
http://en.wikipedia.org/wiki/Grease_(lubricant) (Accessed May 2013)
http://sambal.co.uk/?page_id=57 (Accessed August 2006)
Irvine, F.R. (1965). West African Crops. Oxford University Press, 3rd
Edition.
Izuagie, L.T (2006) Recycling of Spent Engine Oil and Grease Production. B.Sc. Project.
Dept of Industrial chemistry, University of Nigeria Nsukka.
Jones and Nachtsheim, (2009) Journal of Quality Technology Vol. 41, No. 4, October 2009
culled from www.jmp.com/software/pdf/30612.pdf, (Accessed Jan 2014)
Ju, H. L. and Lucas, J. M. (2002). “Factorial Experiments with Hard-To-Change and Easy-
To-Change Factors”.Journal of Quality Technology 34, pp. 411–421.
Kieke, M.D and Klein, R. (2004) Earth Friendly Vegetable Oil Based Greases Thickened
with Organophilic Clay. EUROGREASE Magazine, Feb,2004, pp. 12–19
Kristensen and Halekoh, (2013). Lecture 3: Factorial and Split-Plot designs –
September 12, 2013 page 3. Department of Agroecology and Department of

97
Animal Science Faculty of Science and Technology, Aarhus University,
Denmark
Kuye A.O. and Okorie, C. (1990) Factor Affecting the Lixiviation of Palm Bunch Ash as a
Source of Alkali for Soap Production. Ife Journal of Technology Vol. 3 (2):
33-37
Liljedahl T.B, Carleton, W.M, Turnquist, P.K and Smith, D.W (1979). Tractors and Their
Power Units. 3rd
ed. John Wiley and Sons Inc U.S.A.
Mary Moon, David Turner & Bill Tuszynski ,(2014). NLGI GREASE GLOSSARY FOR
2015: (https://www.nlgi.org/grease-glossary/, (Accessed November,2014)
Mohammed, M.A.R (2013). Effect of Additives on the Properties of Different Types of
Greases. Iraqi Journal of Chemical and Petroleum Engineering Vol.14 No.3:
11- 21
Nicolae, T. (1962). Theory of Lubrication, with Application to Liquid and Gas Film
Lubrication. Stanford University Press, California
NLGI (1987). National Lubricating Grease Institute Lubricating Grease Guide.2nd
ed., Kansas
City
Nolan, S. (2004) The Use of Controlled Stress Rheometer to Evaluate the Rheological
Properties of Grease. EUROGREASE magazine 2004, pp. 22-28
Nwagbara, H.M (2005) Lubricating Grease Production. B.Sc. Project. Dept of Industrial
chemistry, University of Nigeria Nsukka.
Nwoko, V.O. (1980). Chemical Processing Development. Proceedings of the 10th
Annual
Conference of the Nigerian Society of Chemical Engineers pp. 40 -53

98
Okeke, S. U. N. (2009). Home economics for schools and colleges, Onitsha: Africana First
Publishers Plc Nigeria.
Onifade, K.R. (1994). The Potential Application of Cocoa Pod Husks for the Manufacture of
Caustic Potash. Journal of Agricultural Technology Vol. 2 (2): 59 -64
Onyegbado, C.O. (1984) Feasibility of Soap Production for Bright Future Soap Industries.
Private Communication.
Onyegbado, C.O., Iyagba, E.T., and Offor, O.J. (2002). Solid Soap Production Using
Plantain Peel Ash as Source of Alkali. Journal of Applied Sciences and
Environmental Management. Vol 6, N0 1 pp. 73 – 77
Olabanji O, Oluyemi, E.A and Ajayi O.S (2012) Metal analyses of ash
derived alkalis from banana and plantain peels (Musa spp.) in soap making.
African Journal of Biotechnology Vol. 11(99), pp. 16512-16518
Olisakwe, H.C. (2011). Production and Comparative Investigation of biodegradable
lubricants from Jatropha curcas and Thevetia peruviana feedstocks. An M.Eng
Thesis: University of Agriculture, Makurdi, Nigeria.
Onyekwere, C.(1996) Cassava Peels Ash. An Alternative Source of Alkali in Soap
Production. B.Eng. Thesis, Department of Chemical Engineering,) University
of Port Harcourt, Nigeria, 1–33. In: Onyegbado, C.O, Iyagba, E.T, and Offor,
O.J. (2002). Solid Soap Production Using Plantain Peel Ash as Source of
Alkali. Journal of Applied Sciences and Environmental Management. Vol 6,
N0 1 pp 73 – 77
Othmer K. (1968). Encyclopedia of Chemical Technology.3rd Edition, Vol. 2, John Willey

99
Peter, D. (1986). Traditional Soap Making. Small Scale Soap Making Publication Handbook.
I.T, London.
Svanberg, I. (2006). "Blacks slugs (Arion ater) as grease: a case study of technical use of
Gastropods in Pre-industrial Sweden". Journal of Ethnobiology Vol. 26 (2):
299–309. doi:10.2993/0278-0771(2006)26[299:BSAAAG]2.0.CO;2.
Thorsten B, Wolfgang B, Jürgen B, Christian B, Wolfgang B, Wilfried D, Carmen F,
Manfred H, Rolf-Peter H, Dietrich H, Franz K, Georg L, Achim L, Rolf L,
Theo M, Siegfried N, Jürgen O (2002). "Lubricants and Lubrication".
Ullmann's Encyclopedia of Industrial Chemistry. Weinheim: Wiley VCH.
Thorsten B, Wolfgang B, Jürgen B, Christian B, Wolfgang B, Wilfried D, Carmen F,
Manfred H, Rolf-Peter H, Dietrich H, Franz K, Georg L, Achim L, Rolf L,
Theo M, Siegfried N, Jürgen O (2005). "Lubricants and Lubrication" in
Ullmann's Encyclopedia of Industrial Chemistry, 2005, Weinheim. Published
Online: 15 JAN 2003. DOI: 10.1002/14356007.a15_423
Totten, G.E.(2006) Handbook of Lubrication and Tribology Volume 1: Application and
Maintenance, CRC Press
Umeh-Idika, A and Maduakor M; (2013) Soap Production Using Waste Materials of Cassava
Peel and Plantain Peel Ash as an Alternative Active Ingredient, Implication for
Entrepreneurship IOSR Journal of VLSI and Signal Processing (IOSR-JVSP,
Volume 3, Issue 3, PP 01-05
Webb, D. F.; Lucas, J. M.; and Borkowski, J. J. (2004). “Factorial Experiments when Factor
Levels Are Not Necessarily Reset”. Journal of Quality Technology 36, pp. 1–
11.

100
Willcox M (2000). "Soap". In Hilda Butler. Poucher's Perfumes, Cosmetics and Soaps (10th
edition ed.). Dordrecht: Kluwer Academic Publishers. pp. 453.Cavitch, Susan
Miller. (1994). The Natural Soap Book. Storey Publishing.
http://web.fccj.org/~smilczan/eleven/Soap.pdf
www.lubrizol.com/greaseReference?glossry.asp.(2005).Grease Ready Reference Glossary
www.rmrdc.org/Briefs- on-Raw-Mat.htm (2005). Briefs on Raw Materials.(Accessed May,
2008)
http://www.rod.beavon.clara.net/membrane_cell.htm (Accessed June 2012)
www.tribology-abc.com/abc/grease.htm (Accessed July 2010)
www.simlpestarpage.com/2301_ALKALI.HTML(2006). ALKALI (Accessed June 2008)
Yates, F. (1935) “Complex Experiments, with Discussion”. Journal of the Royal Statistical
Society, Series B 2, pp. 181–223.