chapter title: managing physician panels in primary...
TRANSCRIPT

1
Chapter Title: Managing Physician Panels in Primary Care
First Author:
Hari Balasubramanian,
Assistant Professor of Industrial Engineering
University of Massachusetts, Amherst.
160 Governors Drive, Amherst, MA, 01003
Phone: 413-577-3208, Fax: 413-545-1027
Second Author:
Brian Denton
Assistant Professor,
Edward P Fitts Department of
Industrial and Systems Engineering
North Carolina State University,
Raleigh, NC.
111 Lampe Drive, Campus Box 7906, Raleigh, NC, 27695-7906
Phone: 919-513-1690, Fax: 919-515-5281
Third Author:
Qi Ming Lin
Purchasing Engineer
American Holt,
Norwood, MA.
106 Dunstable Street Charlestown, MA, 02129
Phone: 781-526-5624, Fax: 413-545-1027
2
1. Introduction
Primary care providers (PCPs) are typically the first point of contact between patients and health
systems. From a patient's perspective, PCPs provide the majority of care they receive during
their lifetime and are responsible for a variety of health services including preventive medicine,
patient education, routine physical exams, and the coordination of complex episodes in which
patients are referred to medical specialties for secondary and tertiary care. The benefits of a
strong primary care system are well documented in the clinical literature. Shi, Starfield and
Macinko (2005) show that increased access to primary care 1) improves access to health services
for relatively deprived population groups; 2) has a strong positive relationship with prevention
and early management of health problems; and 3) leads to increased familiarity with patients
and, consequently, to less wasteful expenditures due to inappropriate specialist care.
Despite the reported benefits of primary care a recent study by the American College of
Physicians (2006) reports that primary care in the United States “is at grave risk of collapse due
to a dysfunctional financing and delivery system.” They also emphasize the growing demand for
primary care (by 2015, “an estimated 150 million Americans will have at least one chronic
condition”), and the steady decline in the supply of primary care physicians over the last decade.
This looming crisis in primary care is also at the heart of the policy debate in US healthcare as
the nation attempts to reform the healthcare system and provide the roughly 45 million uninsured
patients with coverage. As the case of Massachusetts has shown, universal coverage will further
strain primary care, as newly insured patients request access to doctors. Several prominent media
outlets such as New York Times and National Public Radio recently reported on the severe
3
shortage in primary care physicians in Massachusetts (Sack, 2008 and Brown, 2008). The
shortage has been attributed to the state’s goal of achieving universal coverage.
Timely access to care and patient-physician continuity have been adversely affected due to these
broader trends. The Institute of Medicine (2001) has reported “timeliness” as one of the six key
“aims for improvement” in its major report on quality of healthcare. In one study, nearly 33 % of
patients cited “inability to get an appointment soon as a significant obstacle to care” (Strunk and
Cunningham, 2002). More recently, Rust et al. (2008) report that the inability to get a timely
appointment to a primary care physician increases the likelihood of patients visiting the ER. This
hinders the appropriate management of chronic diseases that could have been effectively treated
in a primary care setting. It is also important that patients see their own physician in order to
maintain continuity of care. Indeed, continuity of care is considered one of the hallmarks of
primary care. Gill and Mainous (1999) point to several studies which show that patients who
regularly see their own providers are 1) more satisfied with their care; 2) more likely to take
medications correctly; 3) more likely to have problems correctly identified by their physician;
and 4) less likely to be hospitalized. Gill et al. (2000) show a link between lack of continuity and
increased emergency department use. Thus, timely access and continuity of care not only have a
positive effect on a patient's health, they are also instrumental in reducing healthcare costs.
In this chapter, we look at a case study concerning the Primary Care Internal Medicine (PCIM)
practice at the Mayo Clinic in Rochester, Minnesota. Our focus is on improving timely access
and continuity of care. The rest of the chapter is organized as follows. We first provide
background on the operational aspects of primary care practices and review the relevant
4
literature. We then discuss methods of classifying patients with regard to their appointment
request patterns. Next, we investigate how these classifications play a role in the design of a
physician’s panel, where a panel is the set of patients a physician is responsible for. We discuss
how timely access and continuity of care can be improved simultaneously by optimizing a
physician’s panel. Finally, we discuss some of the emerging trends in primary care and their
operational implications.
2. Background and literature
Primary care practices include family physicians, general internists, and pediatricians. In the
United States, more than 66 % of all practices are group practices (Hing et al. 2004). As stated
earlier, each physician has a panel, which is the set of patients he/she is responsible for.
Fostering the relationship between a physician and his patients – improving patient-physician
continuity in other words – is one of the foundations of primary care. Patient appointments are
typically classifiable into two types 1) Urgent or acute appointments; 2) Non-urgent
appointments or appointments generally meant for annual exams and to monitor chronic
conditions. Physician appointments are generally for 20-minute slots and reimbursement to
physicians in primary care (for most practices in the United States) is based largely on the
number of 20-minute visits. A physician working full time typically sees about 24 patients a day.
The traditional model of appointment scheduling involved scheduling urgent requests as soon as
possible - typically on the same day - while postponing non-urgent visits. However, in recent
years, a new paradigm called “advanced access” or “open access” has been adopted by practices
5
nation-wide (Murray and Berwick (2003) and Murray et al. (2003)). Under advanced access, all
patients who call are given same-day appointments: physicians are encouraged to “do today's
work today”. Thus the booking of appointments well into the future, which happens frequently
for non-urgent appointments, is avoided to a certain extent.
The adoption of open access, which promises patients same-day appointments, has prompted a
series of questions. What should physician panel sizes be to allow open access? What if patients
prefer to have appointments at some future time rather than see a doctor the same day? These
questions have necessitated the use of queuing and stochastic optimization approaches that
provide guidelines to practices. For instance, Green et al. (2007) investigate the link between
panel sizes and the probability of “overflow” or extra work for a physician under advanced
access. They propose a simple probability model that estimates the number of extra appointments
that a physician could be expected to see per day as function of her panel size. The principal
message of their work is that for advanced access to work, supply needs to be in sufficiently
higher than demand to offset the effect of variability. Green and Savin (2008) use a queuing
model to determine the effect of no-shows on a physician's panel size. They develop analytical
queuing expressions that allow the estimation of physician backlog as a function of panel size
and no-show rates. In their model, no show rates increase as the backlog increases; this results in
the paradoxical situation where physicians have low utilization even though backlogs are high --
this is because patients, because they have had to wait for long, do not show up.
Gupta et al. (2006) conduct an empirical study of clinics in the Minneapolis metropolitan area
that adopted open access. They provide statistics on call volumes, backlogs, number of visits
6
with own physician (which measures continuity) and discuss options for increasing capacity at
the level of the physician and clinic. Kopach et al. (2007) use discrete event simulation to study
the effects of clinical characteristics in an open access scheduling environment on various
performance measures such as continuity and overbooking. One of their primary conclusions is
that continuity is care is affected adversely as the fraction of patients on open access increases.
The authors mention provider groups (or physicians and support staff) working in teams as a
solution to the problem. Gupta and Wang (2006) explicitly model many of the key elements of a
primary care clinic. They consider scheduling the workday of a clinic in the presence of 1)
Multiple physicians 2) Two types of appointments: same-day as well as non-urgent appointments
3) Patient preferences for the a specific slot in a day and also a preference for physicians. The
objective is to maximize the clinic's revenue. They use a Markov Decision Process (MDP) model
to obtain booking policies that provide limits on when to accept or deny requests for
appointments from patients.
In this chapter we investigate the effect of panel size and composition on timely access and
continuity of care in a primary care group practice. While the effect of the size of a physician’s
panel has been studied before, there has been no discussion of the type of patients in a
physician’s panel and its effect on access measures. For instance, females in the age group 55-60
are likely to request twice the number of appointments when compared to males in the group 25-
30 (Murray, Davies and Boushon, 2007). We first illustrate the differences in appointment
request patterns between different categories of patients using examples. We then discuss how
the information about patient categories and their appointment request rates are relevant to the
design of a primary care physician’s panel. Our examples are from the Primary Care Internal

7
Medicine Practice (PCIM) at the Mayo Clinic in Rochester, Minnesota. The PCIM practice is
located in downtown Rochester. In all there are 40 physicians in the practice with a total of
20,230 empanelled patients. The majority of the patients are middle aged or elderly, but the
practice also includes young patients between 18 and 40 (pediatric patients are seen in a different
practice).
3. Patient Classifications
Many factors such as age, health status, geographic location, patterns of historical appointments
(appointment types, urgent vs. non-urgent requests, etc.) can be used to define a classification of
patient types. The examples we present include two different types of categorizations: the first, a
simple categorization based on age and gender, and the second a categorization obtained using
classification and regression trees (CART). The purpose of such classifications is to reflect the
reality that patient request rates from the different categories may vary significantly.
The first classification uses twenty eight categories based on age and gender starting with
separate groups for males and females aged 18-23 (patients aged less than 18 are seen by a
separate pediatric practice), and with the rest of the categories being in five-year increments. The
last two groups are patients aged over 83.
Consider for example the empirical distribution of the fraction of total patients in a given
category requesting appointments in a week. We contrast the histograms of two different
categories: Males in the 48-53 age group and Females in 73-78 age group. The histograms are

8
based on the weekly visits for the years 2004-2006.
Figures 1 and 2 show the histograms for groups 48-53 M and 73-78 F respectively. The data can
be interpreted as follows. There are in total 708 patients from category 48-53 M empanelled
within the PCIM practice. Figure 1 shows that an average of 4.8% of these patients will request
appointments in a given week. On some weeks as many as 8% of these patients will request
appointments.
In contrast, 986 patients from category 73-78 F are enrolled in PCIM (278 more patients than in
48-53 M). Furthermore, from Figure 2, on average 8.4% of these patients request appointments
in a week (as compared to 4.8 for 7M). Thus, not only is the category size larger but a greater
fraction of 73-78 F patients request appointments.
Figure 1. Comparison of categories two age and gender categories with regard to fraction
total patients requesting appointments per week
9
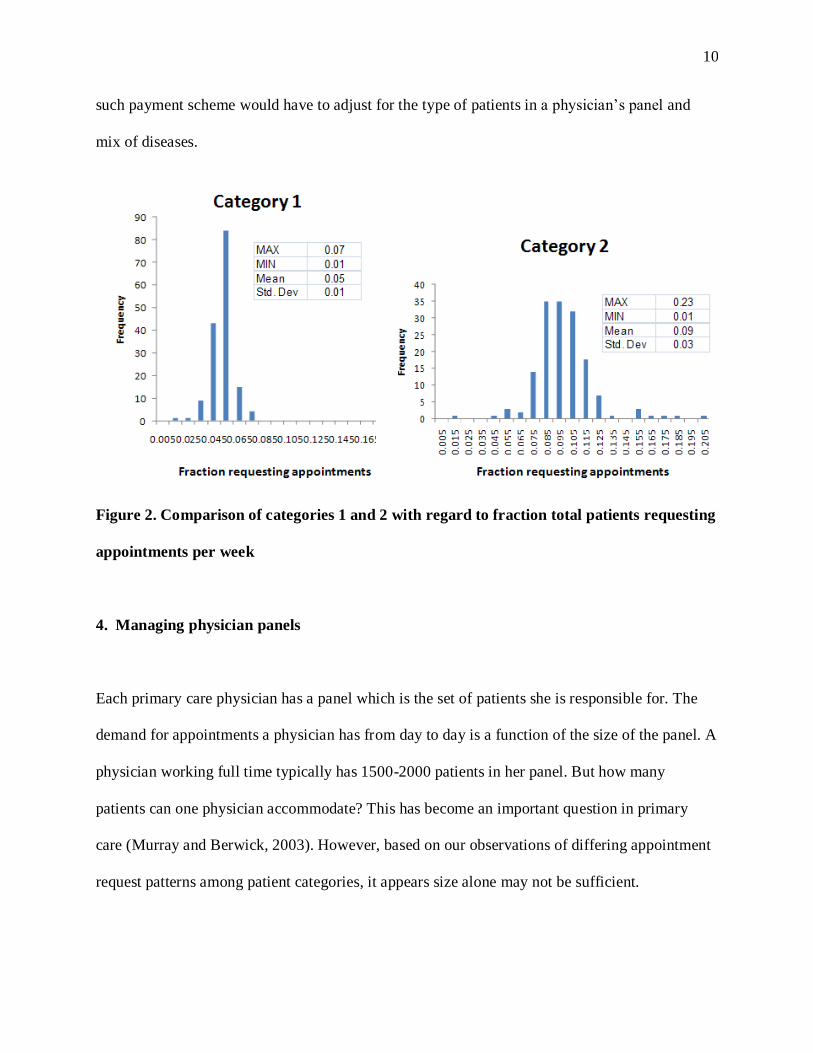
While age and gender serves as a simple proxy for appointment request behaviour, specific
chronic conditions or diseases may also be useful indicators. Further analysis of the same PCIM
patients using CART analysis revealed that in addition to age and gender, cornonary artery
disease (CAD), hypertension and depression were significant indicators of high appointment
request rates. As an example, the following figure shows the distribution of the fraction of total
patients requesting appointments from two different categories, which we refer to below as
categories 1 and 2. Category 1 is comprised of female patients less than 53 years old (2865
total), with none of the aforementioned three conditions. Category 2 is comprised of patients,
both male and female, aged above 69 (789 total) and who have coronary artery disease (CAD).
The distributions are clearly different. The mean of the second is double the mean of the first; the
second also has a broader distribution compared to the first.
Identifying different categories of patients is thus important for understanding patterns in patient
demand. Different patients may have different needs: younger patients may not value continuity
as much as older patients; patients with chronic conditions need regular follow-up appointments.
The classification of patients helps a practice effectively segment its patients and plan its care
delivery models.
Furthermore, classification helps in the design of a physician’s panel, which we discuss in the
next section. This has an important policy implication. Currently, physicians are reimbursed
based on the number of visits. But there are “pay for performance” intiatives (Bohmer and Lee,
2009) underway that reimburse not only based on visits but also based on the preventive
measures promoted in the population and quantifiable improvement in health outcomes. Any
10
such payment scheme would have to adjust for the type of patients in a physician’s panel and
mix of diseases.
Figure 2. Comparison of categories 1 and 2 with regard to fraction total patients requesting
appointments per week
4. Managing physician panels
Each primary care physician has a panel which is the set of patients she is responsible for. The
demand for appointments a physician has from day to day is a function of the size of the panel. A
physician working full time typically has 1500-2000 patients in her panel. But how many
patients can one physician accommodate? This has become an important question in primary
care (Murray and Berwick, 2003). However, based on our observations of differing appointment
request patterns among patient categories, it appears size alone may not be sufficient.
11
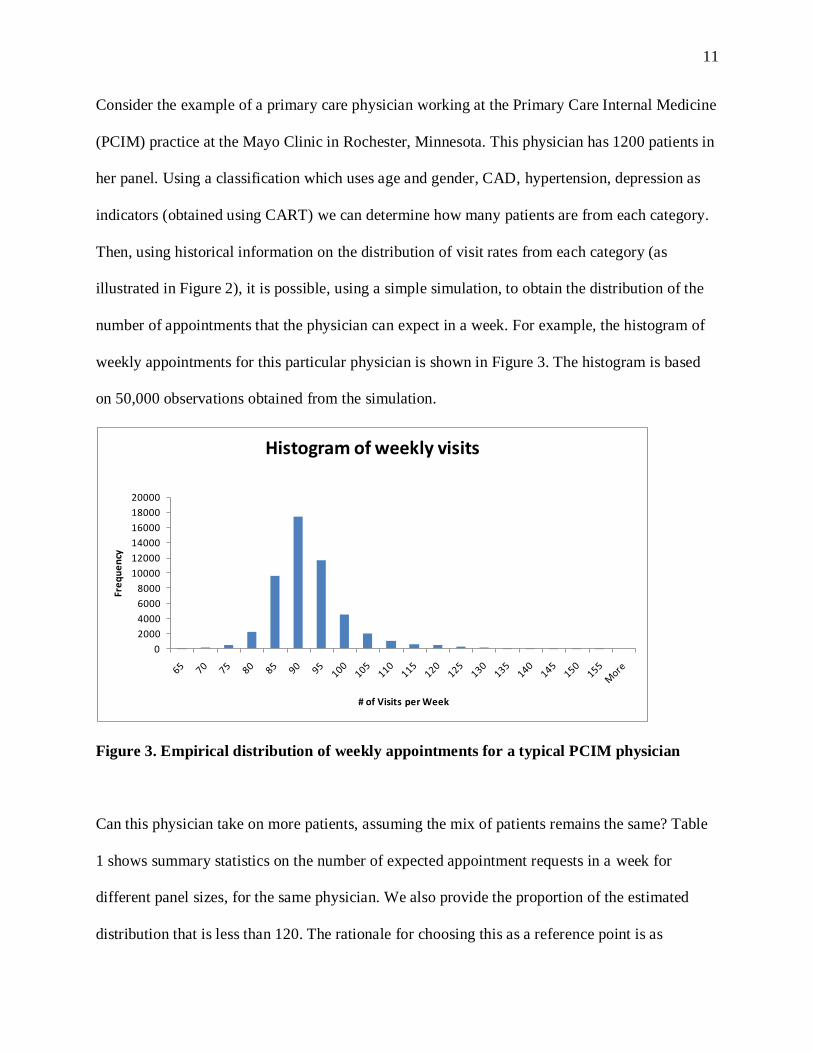
Consider the example of a primary care physician working at the Primary Care Internal Medicine
(PCIM) practice at the Mayo Clinic in Rochester, Minnesota. This physician has 1200 patients in
her panel. Using a classification which uses age and gender, CAD, hypertension, depression as
indicators (obtained using CART) we can determine how many patients are from each category.
Then, using historical information on the distribution of visit rates from each category (as
illustrated in Figure 2), it is possible, using a simple simulation, to obtain the distribution of the
number of appointments that the physician can expect in a week. For example, the histogram of
weekly appointments for this particular physician is shown in Figure 3. The histogram is based
on 50,000 observations obtained from the simulation.
0
2000
4000
6000
8000
10000
12000
14000
16000
18000
20000
Fre
qu
en
cy
# of Visits per Week
Histogram of weekly visits
Figure 3. Empirical distribution of weekly appointments for a typical PCIM physician
Can this physician take on more patients, assuming the mix of patients remains the same? Table
1 shows summary statistics on the number of expected appointment requests in a week for
different panel sizes, for the same physician. We also provide the proportion of the estimated
distribution that is less than 120. The rationale for choosing this as a reference point is as
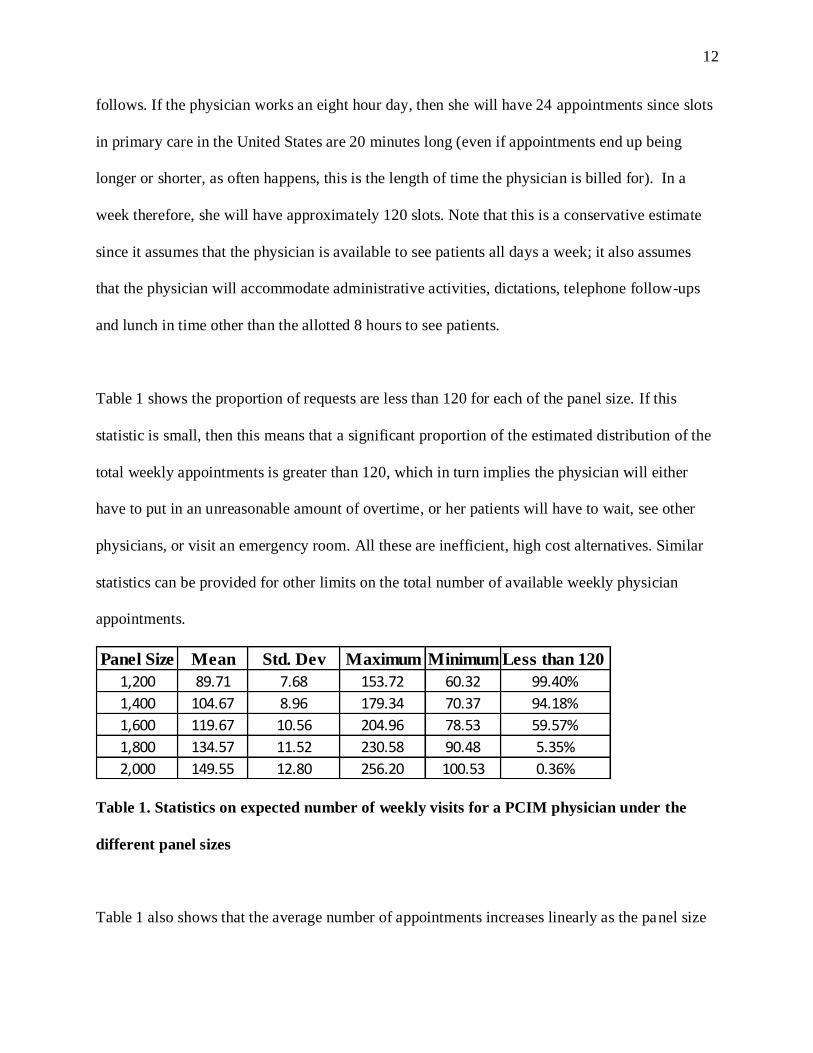
12
follows. If the physician works an eight hour day, then she will have 24 appointments since slots
in primary care in the United States are 20 minutes long (even if appointments end up being
longer or shorter, as often happens, this is the length of time the physician is billed for). In a
week therefore, she will have approximately 120 slots. Note that this is a conservative estimate
since it assumes that the physician is available to see patients all days a week; it also assumes
that the physician will accommodate administrative activities, dictations, telephone follow-ups
and lunch in time other than the allotted 8 hours to see patients.
Table 1 shows the proportion of requests are less than 120 for each of the panel size. If this
statistic is small, then this means that a significant proportion of the estimated distribution of the
total weekly appointments is greater than 120, which in turn implies the physician will either
have to put in an unreasonable amount of overtime, or her patients will have to wait, see other
physicians, or visit an emergency room. All these are inefficient, high cost alternatives. Similar
statistics can be provided for other limits on the total number of available weekly physician
appointments.
Panel Size Mean Std. Dev Maximum Minimum Less than 120
1,200 89.71 7.68 153.72 60.32 99.40%
1,400 104.67 8.96 179.34 70.37 94.18%
1,600 119.67 10.56 204.96 78.53 59.57%
1,800 134.57 11.52 230.58 90.48 5.35%
2,000 149.55 12.80 256.20 100.53 0.36%
Table 1. Statistics on expected number of weekly visits for a PCIM physician under the
different panel sizes
Table 1 also shows that the average number of appointments increases linearly as the panel size
13
increases. But the proportion of the distribution below 120 decreases non-linearly. At 1600
patients, the mean is 120 appointments per week, but only 60% of the distribution is below 120.
Clinics thus should be careful about planning physician panel sizes with just averages. Recall
that 120 is an estimate on the high side; for smaller total available weekly slots, panel sizes larger
than 1500 will be untenable. This analysis shows that while nationwide panels tend to be
between 1500-2000, the mix of disease conditions and the corresponding demand at PCIM imply
that a panel size beyond 1500 will not result in an acceptable level of service.
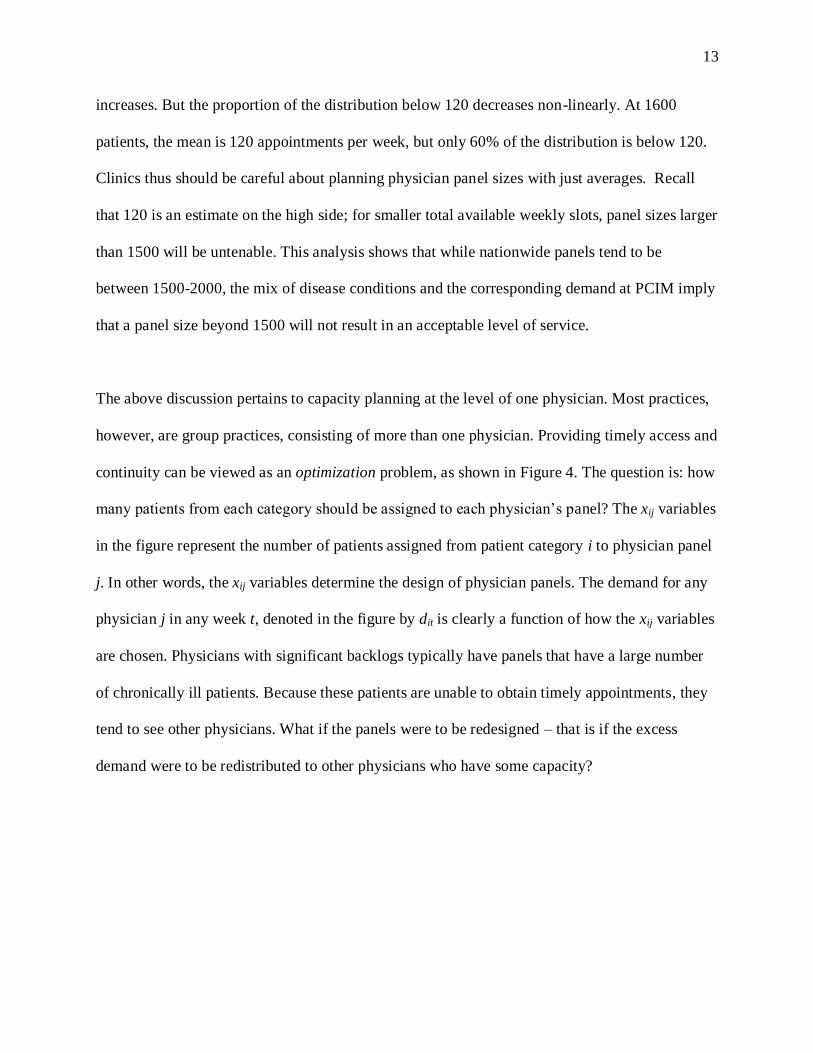
The above discussion pertains to capacity planning at the level of one physician. Most practices,
however, are group practices, consisting of more than one physician. Providing timely access and
continuity can be viewed as an optimization problem, as shown in Figure 4. The question is: how
many patients from each category should be assigned to each physician’s panel? The xij variables
in the figure represent the number of patients assigned from patient category i to physician panel
j. In other words, the xij variables determine the design of physician panels. The demand for any
physician j in any week t, denoted in the figure by dit is clearly a function of how the xij variables
are chosen. Physicians with significant backlogs typically have panels that have a large number
of chronically ill patients. Because these patients are unable to obtain timely appointments, they
tend to see other physicians. What if the panels were to be redesigned – that is if the excess
demand were to be redistributed to other physicians who have some capacity?
14
.
.
.
.
.
.
x11
x1n
x12
x21
xm1
x21
x2n
xm2
xmn
Health
Categories
Physician
Panels
Category 1
Category 2
Category m
Panel 1
Panel 2
Panel n
d1t
d2t
dnt
.
.
.
.
.
.
.
.
.
.
.
.
x11
x1n
x12
x21
xm1
x21
x2n
xm2
xmn
Health
Categories
Physician
Panels
Category 1
Category 2
Category m
Panel 1
Panel 2
Panel n
d1t
d2t
dnt
Figure 4. Panel design framed as an optimization problem
Balasubramanian et al. (2007) considered the panel design question using a simulation
optimization framework. They propose a panel design genetic algorithm (PDGA) to generate
optimal designs and test it using data from the Mayo Clinic PCIM group practice. For health
categories, a simple age and gender classification is used. Each panel design in the PDGA
population is evaluated over 52 weeks to calculate waiting time in weeks and average number of
redirections to physicians that are not the patient’s own. These redirections are viewed as losses
in continuity, since an unfamiliar physician will now have to understand the medical history of
the patient. This may result in additional follow-up appointments with the patient’s own
physician, or diagnosis and medication errors.
The simulation works as follows: physician calendars start empty (no appointments) in the first

15
period and move from period to period. In each period, patients request appointments from their
PCPs. Patient requests in each period are satisfied on a first-come-first-served basis: requests
originating in earlier periods are filled first. Ties between requests arising in the same period to a
given physician panel are broken arbitrarily. If the capacity for a particular panel is exhausted,
patients have one of two options: to see another provider within the same period or to wait for a
future period to see their PCP. We assume that a fixed proportion of patients (40%) are willing to
see other providers in the same period. These requests are filled by physicians who have
available capacity. For each panel design we truncate the first ten weeks of data to remove the
initial transient and use 50 replications to obtain our estimates.
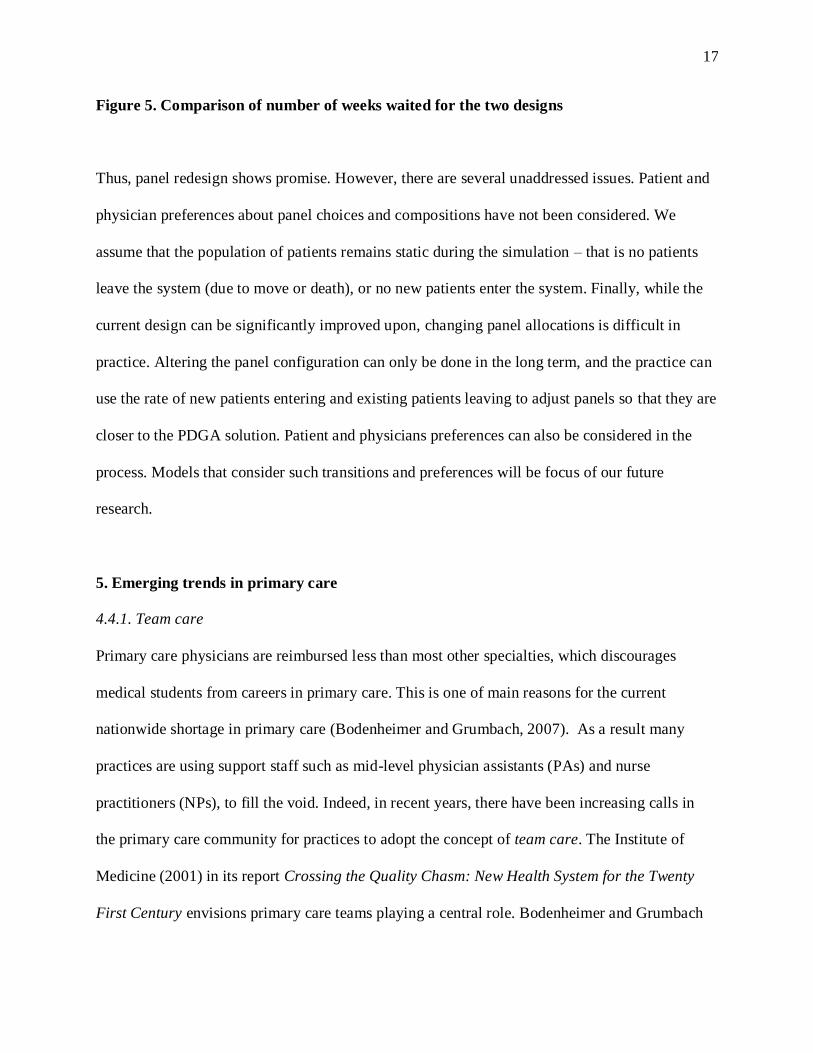
The results of the genetic algorithm are compared to the existing panel configuration in the
practice, as shown in Table 2 and Figure 5. Average wait time is improved by more than 30%,
while average number of weekly redirections to other physicians is reduced by more than 50%.
Figure 4 shows graphically the differences in wait times involved in the two solutions. The x-
axis indicates the number of weeks. The y-axis indicates the average number of patients who
waited i weeks or more, where i is the corresponding value on the x axis. The PDGA solution
performs significantly better but the differences taper off as the number of weeks increases.
16
Wait T im e Redirections
Mean 6.82 531.10
Std.Dev 0.21 26.43
Upper 95% CI 6.87 538.43
Lower 95 % CI 6.7 6 523.7 8
Mean 4.50 230.13
Std.Dev 0.18 26.7 7
Upper 95% CI 4.55 237 .55
Lower 95 % CI 4.44 222.7 1
PDGA Solution
Current Design
Table 2. Comparison of GA design with current practice
0
2000
4000
6000
8000
10000
12000
14000
16000
0 5 10 15 20 25
Nu
mb
er
wh
o w
ait
ed
Weeks
Current Panel Design vs PDGA
Current Panel Design
PDGA
17
Figure 5. Comparison of number of weeks waited for the two designs
Thus, panel redesign shows promise. However, there are several unaddressed issues. Patient and
physician preferences about panel choices and compositions have not been considered. We
assume that the population of patients remains static during the simulation – that is no patients
leave the system (due to move or death), or no new patients enter the system. Finally, while the
current design can be significantly improved upon, changing panel allocations is difficult in
practice. Altering the panel configuration can only be done in the long term, and the practice can
use the rate of new patients entering and existing patients leaving to adjust panels so that they are
closer to the PDGA solution. Patient and physicians preferences can also be considered in the
process. Models that consider such transitions and preferences will be focus of our future
research.
5. Emerging trends in primary care
4.4.1. Team care
Primary care physicians are reimbursed less than most other specialties, which discourages
medical students from careers in primary care. This is one of main reasons for the current
nationwide shortage in primary care (Bodenheimer and Grumbach, 2007). As a result many
practices are using support staff such as mid-level physician assistants (PAs) and nurse
practitioners (NPs), to fill the void. Indeed, in recent years, there have been increasing calls in
the primary care community for practices to adopt the concept of team care. The Institute of
Medicine (2001) in its report Crossing the Quality Chasm: New Health System for the Twenty
First Century envisions primary care teams playing a central role. Bodenheimer and Grumbach
18
(2003) report several examples of clinics that have adopted team care.
Patient
Requests
PACs,
CAs,
Recep-
tionists
Mid-level PA
Physicians’
Non-consult care time
RNsLPNs,
CAs
chronic
chronic
acute
acute
Follow up visits
Physicians’ Consult
time
Email review of
lab and test results
The primary care team
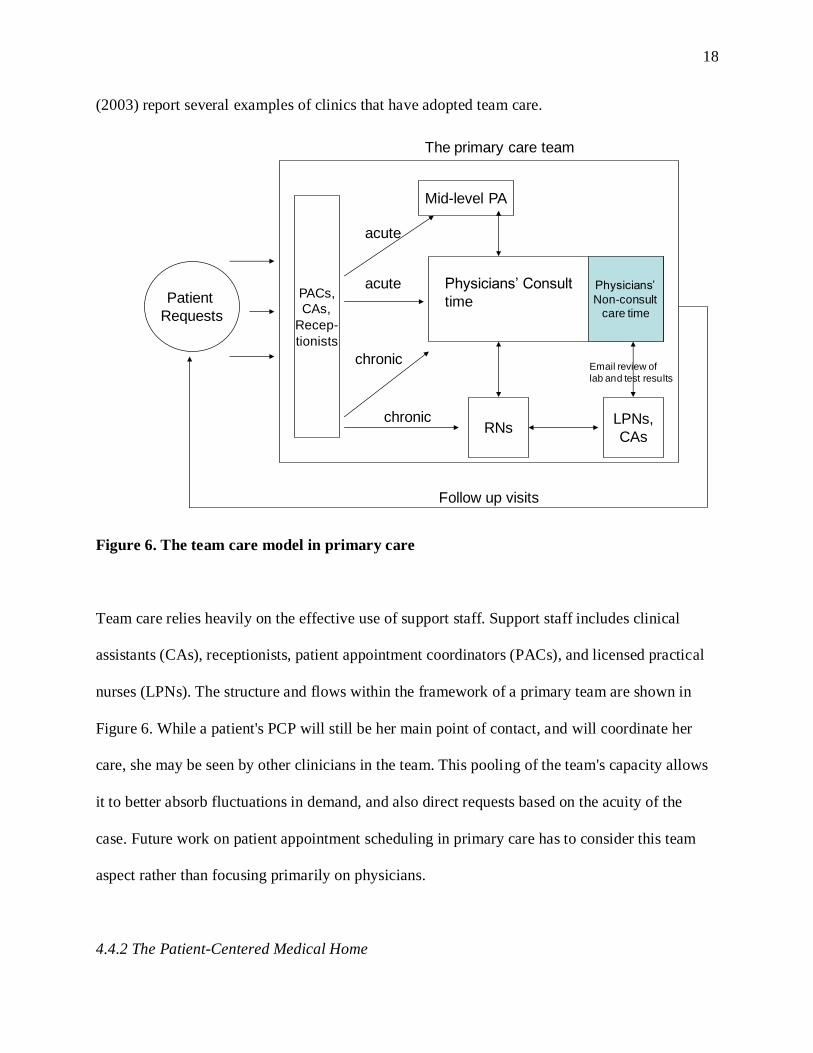
Figure 6. The team care model in primary care
Team care relies heavily on the effective use of support staff. Support staff includes clinical
assistants (CAs), receptionists, patient appointment coordinators (PACs), and licensed practical
nurses (LPNs). The structure and flows within the framework of a primary team are shown in
Figure 6. While a patient's PCP will still be her main point of contact, and will coordinate her
care, she may be seen by other clinicians in the team. This pooling of the team's capacity allows
it to better absorb fluctuations in demand, and also direct requests based on the acuity of the
case. Future work on patient appointment scheduling in primary care has to consider this team
aspect rather than focusing primarily on physicians.
4.4.2 The Patient-Centered Medical Home
19
In recent years, prominent physician organizations have been calling for a fundamental
transformation in how primary care is practiced. Specifically, they have been advocating for a
Patient-Centered Medical Home (PCMH) which they define as “an approach to primary care…
that facilitates partnerships between individual patients, and their personal physicians, and when
appropriate, the patient’s family” (AAFP/AAP/ACP/AOA, 2007). The medical home attempts
to counter the increasing fragmentation and lack of coordination that is prevalent in the US
healthcare system, by making primary care practices the central point of care. Each patient will
have a personal physician, but the physician will also coordinate and will stay informed of the
patient’s care across other parts of the system: subspecialty care, hospitals, home health agencies
and nursing homes. The medical home model of care will use information technology and
electronic medical records to achieve this coordination.
As discussed earlier, physician reimbursement in most practices is currently based on the number
of visits. In a medical home, “face-to-face” visits will be complemented by visits with other
members of the care team such as nurses and physician assistants; some exchanges may happen
over email and phone. The reimbursement of physicians will thus have to account for “non-visit”
care time. This leads to a number of operational questions, since a “capacity” of a clinic now
assumes a flexible form rather than being centered solely on physician visits. Furthermore,
medical home reimbursement will also “recognize case-mix differences in the patient population
being treated within the practice” [AAFP/AAP/ACP/AOA, 2007]. Such a payment scheme
adjusts for the type of disease burdens prevalent in the population. Our discussion in section 4.2
regarding patient classifications thus becomes important.
20
5. Summary and Conclusions
In summary we have illustrated approaches for patient appointment scheduling in primary care
using a case study involving the Primary Care Internal Medicine (PCIM) practice at the Mayo
Clinic in Rochester Minnesota. Salient features of our approach include 1) the recognition of the
differences in appointments request patterns between patient groups, 2) the use of patient
classifications for the effective design of an individual physician’s panel, and 3) the discussion of
a simulation-optimization framework to redesign panels in a group practice. We have also briefly
discussed some of the emerging trends in primary care, specifically team care and the patient-
centered medical home. Our future work will focused in developing models that evaluate the
operational implications of these trends.
References
American College of Physicians, 2006. The impending collapse of primary care and its
implications for the state of the nation’s healthcare. Technical report.
AAFP/AAP/ACP/AOA (American Academy of Family Physicians, American Academy of
Pediatrics, American College of Physicians, and American Osteopathic Association). Joint
principles of the patient-centered medical home. March 2007
(http://www.acponline.org/advocacy/where_we_stand/medical_home/approve_jp.pdf).
Balasubramanian, H., Banerjee, R., Gregg, M., and Denton, B., 2007, Improving primary care
21
access using simulation optimization, Proceedings of the Winter Simulation Conference,
Washington DC, 1494-1500.
Bodenheimer, T., and Grumbach, K., Improving primary care: Strategies and tools for a better
practice, McGraw Hill Lange, 2007.
Brown, K., 2008. All Things Considered. Massachusetts health care reform reveals doctor
shortage. National Public Radio.
http://www.npr.org/templates/story/story.php?storyid=97620520, Nov 30, 2008.
Edington M. eds., 2001. Crossing the quality chasm: A new health system for the 21st century.
The Institute of Medicine Report. Technical report, National Academy Press, Washington
DC.
Gill, J. M., Mainous, A., 1999. The role of provider continuity in preventing hospitalizations.
Archive of Family Medicine 7, 352 - 357.
Gill, J. M., Mainous, A., Nsereko, M., 2000. The effect of continuity of care on emergency
department use. Archives of Family Medicine 9, 333 – 338.
Green, L. V., Savin, S., 2008. Reducing Delays for Medical Appointments: A Queueing
Approach. Operations Research 56(6), 1526 – 1538.
Green, L. V., Savin, S., Murray, M., 2007. Providing timely access to care: What is the right
patient panel size? The Joint Commission Journal on Quality and Patient Safety 33, 211 –
218.
Grumbach, K., and Bodenheimer, T., 2004, Can health care teams improve primary care
practice? Journal of the American Medical Association, 291(10):1246-1251.
Gupta, D., Potthoff, S., Blowers, D., Corlett, J., 2006. Performance metrics for advanced access.
Journal of Healthcare Management 51(4), 246 – 259.
22
Gupta, D., Wang, L., 2008. Revenue management for a primary-care clinic in the presence of
patient choice. Operations Research 56(3), 576 – 592.
Hing E., Cherry D.K., Woodwell D.A., 2004, National Ambulatory Medical Care Survey: 2002
Summary. Advance Data from Vital and Health Statistics; No. 346. Hyattsville, MD: National
Center for Health Statistics.
Murray, M., Berwick, D. M., 2003. Advanced access: Reducing waiting and delays in primary
care. Journal of the American Medical Association 289 (8), 1035 – 1040.
Murray, M., Bodenheimer, T., Rittenhouse, D., Grumbach. K., 2003. Improving timely access to
primary care: Case studies of the advanced access model. Journal of the American Medical
Association 289 (3), 1042 – 1046.
Murray, M., Tantau, C., 1999. Redefining open access to primary care. Managed Care Quarterly
7(3), 45 – 55.
Murray, M., Tantau, C., 2000. Same-day appointments: Exploding the access paradigm. Family
Practice Management 7(8), 45 – 50.
O’Hare, C. D., Corlett, J., 2004. The outcomes of open-access scheduling. Family Practice
Management 11(2), 35 – 38.
Renata, K., DeLaurentis, P., Lawley, M., Muthuraman, K., Ozsen, L., Rardin, R., Wan, H.,
Intrevado, P., Qu, X., and Willis, 2007, D., Effects of clinical characteristics on successful
open accecss scheduling, Health Care Management Science, 10, 111-124.
Rust, G., Ye, J., Baltrus, P., Daniels, E., Adesunloye, B., Fryer, G. E., 2008. Practical Barriers to
Timely Primary Care Access. Archives of Internal Medicine 268(15), 1705 – 1710.
Bohmer, R., and Lee, T., 2009, The shifting mission of healthcare delivery organizations, New
England Journal of Medicine, 361 (6), 551-553.
23
Sack, K., 2008. In Massachusetts, universal coverage strains care. New York Times, April 5,
2008.
Shi, L., Starfield, B., Macinko, J., 2005. Contribution of primary care to health systems and
health. The Milbank quarterly 83(3), 457 – 502.
Smith, D. R., Whitt, W., 1981. Resource sharing for efficiency in traffic systems. Bell System
Technical Journal 60, 39 – 55.
Starfield, B., Macinko J., Shi, L., 2007. Quantifying the health benefits of primary care physician
supply in the United States. International Journal of Health Services 37(1), 111 – 126.
Steinbrook, R., 2008, Healthcare Reform in Massachusetts – Expanding Coverage, Escalating
Costs, New England Journal of Medicine.
Strunk B.C., Cunningham, P.J, 2002, Treading Water: Americans’ Access to Needed Medical
Care, 1997-2001. Washington, D.C.: Center for Studying Health System Change,
http://www.hschange.com/.