chapter vi demand and supply projections for food...
TRANSCRIPT

Indian Agriculture – Trends in Food grains Production,
Implications on Food Security in India – Post 1980’s Study
186
Food security should be considered as important as national security. Along with measures to
enhance the production, simultaneously there must also measures be taken to enhance the
purchasing power of the vast poor people through generation of employment opportunities.
Chapter VI Demand and Supply Projections for Food Grains
In the following analysis we try to examine and present the studies that have exclusively
focussed upon the projected demand for food grains in future at an aggregate level in India.
Various eminent economists have used different tools to these projections keeping in mind of the
projected increase in population as well as the demand for food grains. They have also taken into
account other parameters like projected increase in income growth and tried to project the
possible gap between demand and supply of food grains during the stipulated future period.

Indian Agriculture – Trends in Food grains Production,
Implications on Food Security in India – Post 1980’s Study
187
Significant economic growth, increasing population and changing lifestyles in India are causing
significant changes in Indian food basket, away from staple Food grains towards high-value
horticulture and animal products. While per capita consumption of Food grains has declined,
their total consumption has increased due to increasing population. Also, changes in the dietary
pattern towards animal products have led to an increased demand of Food grains as feed.
Nonetheless, Food grains particularly Rice and Wheat continue to be the pillars of India’s food
security. After mid 1990’s, per capita food grain production started declining due to deceleration
in the total factor productivity (TFR) growth. It is a matter of concern for Indian food security.
This changing scenario of consumption and production will have a significant influence on the
demand and supply prospects of food.
Demand for Food grains has been increasing over the years accounting for the factors like
urbanisation, regional variations in consumption pattern and income distribution, limit on energy
requirement and changes in tastes and preferences of consumers for food varieties. Indirect
demand including ‘home away demand’ has also been considered in working out this food grain
projections.
Rice is the main staple food in the eastern, north eastern and southern regions, while wheat is the
main staple grains in the northern, northern hills and western regions. Coarse cereals appear as
important food in the western and southern regions. Therefore the food consumption patterns and
demand parameters vary across regions, locations (rural, urban) and income groups. Income
growth is another important factor in demand projections. Growth rates in per capita income
were obtained by subtracting population growth rate from economic growth and were used in
predicting the per capita consumption. Estimated per capita consumption was multiplied by
population, and aggregated by regions, income groups and lifestyles to obtain the total demand.
Though there exists a decline in per capita direct consumption of food grains, the total demand is
projected to increase by 2 per cent per annum in the medium term on account of an increase in
the population and also as the need for grain as feed and related uses. It indicates that the growth
rate in food grains production needs to be enhanced to four fold in order to protect the people
from food insecurity. If we observe the per capita production of food grains, it has increased
from 183 kg per year during the early 1970s to 207 kg by the mid-1990’s, despite the fact that

Indian Agriculture – Trends in Food grains Production,
Implications on Food Security in India – Post 1980’s Study
188
country’s population has increased beyond 50 per cent. Unfortunately after the mid 1990’s, food
grains production could not grow on par with the growth of population. Whereas the per capita
production of cereals has declined by 17kg and pulses production by 3kg during the last decade,
between 1990-2000. These trends would appear to jeopardise the food security91
91 Ramesh Chand and Raju, S.S. (2007): “Risk in Indian Agriculture – A Case study of Six Major Crops”, from ‘Agricultural Situation in India – Oct – 2007.’
.
6.1 Shifts in Dietary Pattern
If we can observe the trends in the recent dietary patterns across India, the long term trend in the
consumption pattern at the household level shows that per capita direct consumption of food
grains has been decreasing and that of livestock products, fruits and vegetables has been
increasing for a fairly long time. Despite the shift in the dietary pattern, food grains are
considered to be of paramount importance for household food and nutrition security. It can be
attributed to the fact that, cereals and pulses are generally staple foods in India and there is no
perfect substitution between staple foods and other foods and also due to the inadequate level of
intake of almost all foods, increased consumption of other foods, in most cases, fulfils the dietary
deficiency. And also due to, food grains are the cheapest source of energy and protein, compared
to other foods and are thus vital for food nutrition security of the low income classes. More
importantly, increased production and consumption of livestock products resulting from rising
per capita income require high growth in the use of grain as feed for livestock. Because of these
reasons, food grains continue to be the main pillars of food security in the country and any
deficit in their production translates into a price shock and will have an adverse impact on
common people. Factors behind this dietary shift are...1. Increases in per capita income 2.
Changes in preferences due to changes in taste, lifestyle and occupation structure and increase in
urbanisation and also the prices.
6.2 Rationale behind Demand Projections
Demand for food grain can be classified into two categories: 1) Food grains consumed by the
household at house hold level in different forms, referred as ‘Direct demand’ or food demand 2)
Food grains used as feed for cattle, as seeds in agriculture and used in industry and also the
quantity that goes as waste and this termed as ‘Indirect Demand for Food’.
Indian Agriculture – Trends in Food grains Production,
Implications on Food Security in India – Post 1980’s Study
189
Here the NSSO Survey on Consumer Expenditure in the year 2004-05, has been utilised as the
base period to make demand projections. Projections are made based on the changes observed
on different spheres between 1993-94 and 2004-05, and by also taking into the account the
income elasticity of demand for different food grains. The total change in per capita food grains
consumption between 1993-94 and 2004-05 was considered to be the total of two elements, they
are A) Changes occurred due to growth in per capita income B) Changes in demand due to
dietary shifts in tastes and preferences of consumers. This is measured by taking the difference
between the total change in demand for food grains and change in demand due to increase in
incomes. The increase in demand due to the increase in incomes is estimated by multiplying
growth in per capita income (during 1993-94 to 2004-05) by the income elasticity of demand. Per capita demand in future period (tn) was estimated from per capita demand in base year (to), as:
Dtn= Dt0 [(1+ ny *Yg)**(n) + ∆ PR];
Where Dtn is the per capita demand in future year (tn);
Dt0 is per capita demand in the base year;
çy is income in the base year;
çy is income elasticity of demand;
Yg
NNP at factor cost
is growth rate in per capita income; and
∆ PR is rate of change in demand due to shift in preferences and taste.
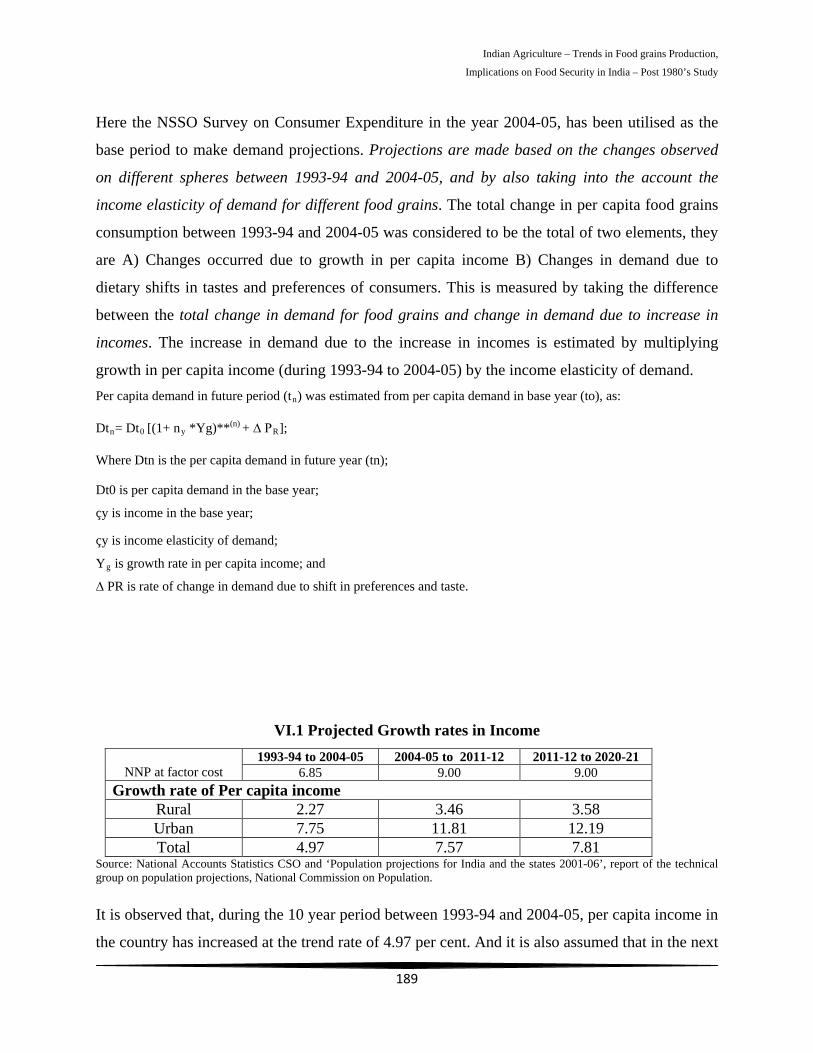
VI.1 Projected Growth rates in Income 1993-94 to 2004-05 2004-05 to 2011-12 2011-12 to 2020-21
6.85 9.00 9.00 Growth rate of Per capita income
Rural 2.27 3.46 3.58 Urban 7.75 11.81 12.19 Total 4.97 7.57 7.81
Source: National Accounts Statistics CSO and ‘Population projections for India and the states 2001-06’, report of the technical group on population projections, National Commission on Population.
It is observed that, during the 10 year period between 1993-94 and 2004-05, per capita income in
the country has increased at the trend rate of 4.97 per cent. And it is also assumed that in the next

Indian Agriculture – Trends in Food grains Production,
Implications on Food Security in India – Post 1980’s Study
190
five to 15 years, the Indian economy might grow at an average rate of 9 per cent, which implies
that there will be a 7.57 per cent growth in per capita income during the 11th
Commodity
plan and a 7.81 per
cent growth rate beyond that. And obviously the growth rate of urban income would be more
than three times the growth rate of the per capita income of rural people. Recent studies have
arrived at a conclusion that income elasticity of demand for cereals is either close to zero or
negative.
6.3 Direct Demand for Food
In India, the per capita consumption of cereals in rural areas registered a slight decline between
1973-74 and 1983-84. Later on, cereal intake exhibits a sharp decline in rural as well as urban
areas. We can also observe that the per capita consumption of cereals is much lower in urban
areas than in rural areas. At the all India level, per capita consumption of cereals has declined
from 154.24 kg per person per year in 1973-74 to 132.58 kg in 2004-05. Disaggregated data
shows us that the per cent of decline was much larger for coarse cereals in comparison to Rice
and Wheat. But in later periods, we can observe the gap between wheat and rice consumption
getting narrowed down.
VI.2Total Demand (Projected) for Food grains as Household (million tonnes)
1993-94 2004-05 2011-12 2020-21
Rice 71.3 80.0 84.7 89.1
Wheat 48.7 58.0 62.7 67.5
C.Cereals# 17.6 13.7 11.8 10.1
T.Cereals## 137.6 151.7 159.1 166.6
Pulses 8.5 9.8 11.8 12.5
Foodgrains 146.1 161.5 169.9 179.1
Indian Agriculture – Trends in Food grains Production,
Implications on Food Security in India – Post 1980’s Study
191
Source: Population projections for India and the States 2001-06’, report of the technical group on population projections, National Commission on Population. And Population projections for India and States 2001-26, office of the Registrar General and Census Commissioner, India. From “Demand for Foodgrains” by Ramesh Chand, EPW Dec 29 2007.
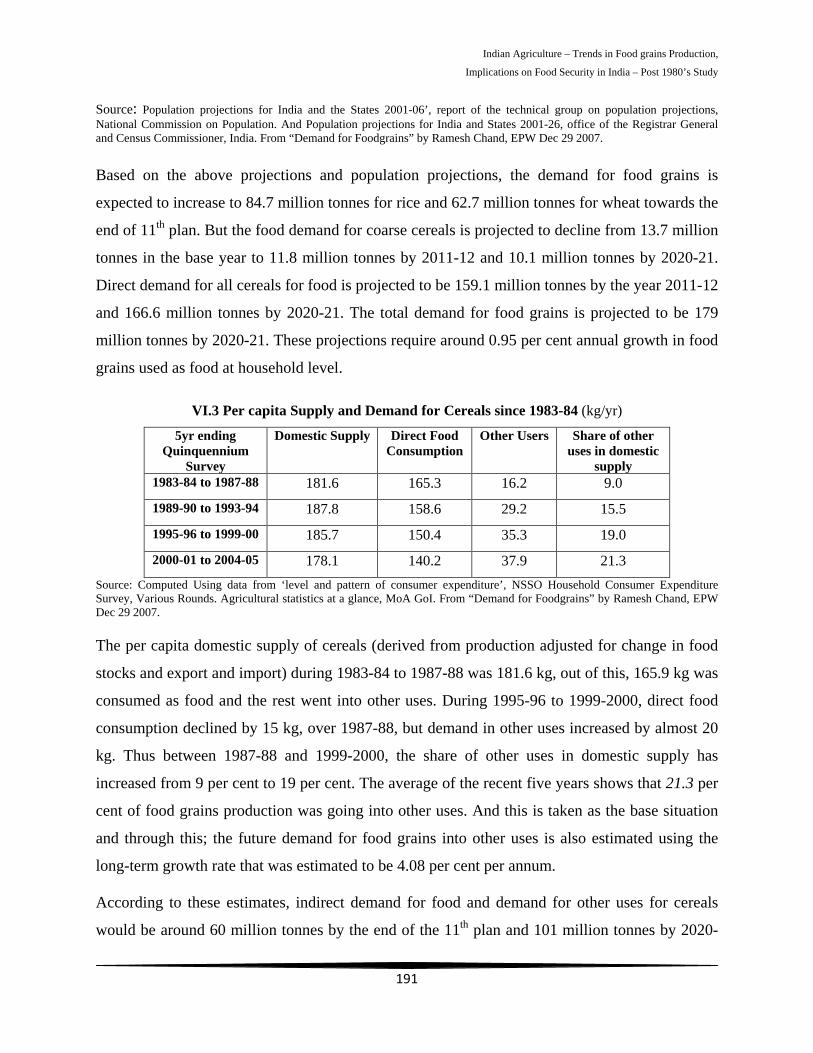
Based on the above projections and population projections, the demand for food grains is
expected to increase to 84.7 million tonnes for rice and 62.7 million tonnes for wheat towards the
end of 11th
5yr ending Quinquennium
Survey
plan. But the food demand for coarse cereals is projected to decline from 13.7 million
tonnes in the base year to 11.8 million tonnes by 2011-12 and 10.1 million tonnes by 2020-21.
Direct demand for all cereals for food is projected to be 159.1 million tonnes by the year 2011-12
and 166.6 million tonnes by 2020-21. The total demand for food grains is projected to be 179
million tonnes by 2020-21. These projections require around 0.95 per cent annual growth in food
grains used as food at household level.
VI.3 Per capita Supply and Demand for Cereals since 1983-84 (kg/yr)
Domestic Supply Direct Food Consumption
Other Users Share of other uses in domestic
supply 1983-84 to 1987-88 181.6 165.3 16.2 9.0
1989-90 to 1993-94 187.8 158.6 29.2 15.5
1995-96 to 1999-00 185.7 150.4 35.3 19.0
2000-01 to 2004-05 178.1 140.2 37.9 21.3 Source: Computed Using data from ‘level and pattern of consumer expenditure’, NSSO Household Consumer Expenditure Survey, Various Rounds. Agricultural statistics at a glance, MoA GoI. From “Demand for Foodgrains” by Ramesh Chand, EPW Dec 29 2007.
The per capita domestic supply of cereals (derived from production adjusted for change in food
stocks and export and import) during 1983-84 to 1987-88 was 181.6 kg, out of this, 165.9 kg was
consumed as food and the rest went into other uses. During 1995-96 to 1999-2000, direct food
consumption declined by 15 kg, over 1987-88, but demand in other uses increased by almost 20
kg. Thus between 1987-88 and 1999-2000, the share of other uses in domestic supply has
increased from 9 per cent to 19 per cent. The average of the recent five years shows that 21.3 per
cent of food grains production was going into other uses. And this is taken as the base situation
and through this; the future demand for food grains into other uses is also estimated using the
long-term growth rate that was estimated to be 4.08 per cent per annum.
According to these estimates, indirect demand for food and demand for other uses for cereals
would be around 60 million tonnes by the end of the 11th plan and 101 million tonnes by 2020-
Indian Agriculture – Trends in Food grains Production,
Implications on Food Security in India – Post 1980’s Study
192
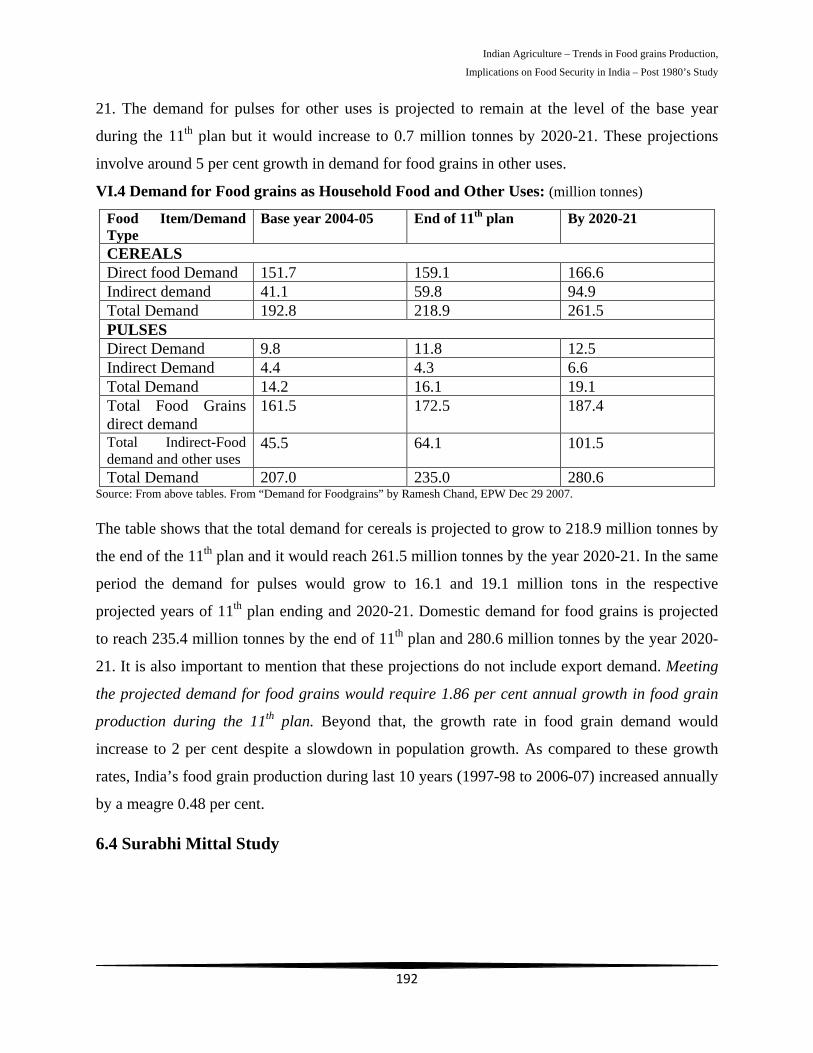
21. The demand for pulses for other uses is projected to remain at the level of the base year
during the 11th
Food Item/Demand Type
plan but it would increase to 0.7 million tonnes by 2020-21. These projections
involve around 5 per cent growth in demand for food grains in other uses.
VI.4 Demand for Food grains as Household Food and Other Uses: (million tonnes)
Base year 2004-05 End of 11th By 2020-21 plan
CEREALS Direct food Demand 151.7 159.1 166.6 Indirect demand 41.1 59.8 94.9 Total Demand 192.8 218.9 261.5 PULSES Direct Demand 9.8 11.8 12.5 Indirect Demand 4.4 4.3 6.6 Total Demand 14.2 16.1 19.1 Total Food Grains direct demand
161.5 172.5 187.4
Total Indirect-Food demand and other uses
45.5 64.1 101.5
Total Demand 207.0 235.0 280.6 Source: From above tables. From “Demand for Foodgrains” by Ramesh Chand, EPW Dec 29 2007.
The table shows that the total demand for cereals is projected to grow to 218.9 million tonnes by
the end of the 11th plan and it would reach 261.5 million tonnes by the year 2020-21. In the same
period the demand for pulses would grow to 16.1 and 19.1 million tons in the respective
projected years of 11th plan ending and 2020-21. Domestic demand for food grains is projected
to reach 235.4 million tonnes by the end of 11th plan and 280.6 million tonnes by the year 2020-
21. It is also important to mention that these projections do not include export demand. Meeting
the projected demand for food grains would require 1.86 per cent annual growth in food grain
production during the 11th plan. Beyond that, the growth rate in food grain demand would
increase to 2 per cent despite a slowdown in population growth. As compared to these growth
rates, India’s food grain production during last 10 years (1997-98 to 2006-07) increased annually
by a meagre 0.48 per cent.
6.4 Surabhi Mittal Study

Indian Agriculture – Trends in Food grains Production,
Implications on Food Security in India – Post 1980’s Study
193
The study by Surabhi Mittal92
Both in the 1980’s and 1990’s, the total consumption of cereals pictures a negative growth rate;
also in the two decades, growth in annual per capita consumption of edible oil has registered a
significant rise. In the 1990’s, sugar also shown a higher rate of growth in per capita
consumption. And this is followed by decent increase in the consumption of pulses and rice.
, projects the supply and demand for rice, wheat, total cereals,
pulses, edible oil/oil seeds and sugar/sugarcane during the years 2011, 2021 and 2026.
Projections have been based on levels of productivity, changes in price, growth of population and
income. It is observed that an increase in demand is primarily due to growth in population and
growth in per capita income. Here it is observed that supply side production is dented by low per
hectare yield growths. This is clearer with regard to total cereals and sugarcane. If at all if we
want to meet these demands the country will have to increase food grain production or import
them.
Naturally the mismatch between production and demand influences the prices and profitability.
Therefore the projections on demand side and supply side assume importance to make policy
initiatives. In the coming decades, India is projected to emerge as the most populous country in
the World. Therefore the demand and supply analysis of food grains will be the essential
indicators to the food security concerns. If we observe the consumption of per capita cereals, it
declined from 140.3 kg per annum in 1983 to 138.2 kg per annum in 2004-05. This can be, to
some extent, attributed to diversification in food consumption and easy access to supply of other
high value modern agricultural commodities and also due meat diet for which large amounts of
grains have been diverted to feed cattle instead of directly feeding the people.
Changes in tastes and preferences, and also change in relative prices of food items, higher
economic growth and per capita incomes have led to reduction in per capita demand for cereals.
Though the annual per capita consumption of rice, wheat and pulses changed marginally between
1983 and 2004-05, the per capita consumption of edible oil has got doubled almost. Sugar
consumption also rose significantly from 9.7 kg per annum in 1983 to 12.1 kg annum in 1999-
2000.
92 Mittal, Surabhi (2008): “Demand and Supply trends and Projections of Food in India” From ‘Indian Council for Research on International Economic Relations’, Working Paper No. 209.

Indian Agriculture – Trends in Food grains Production,
Implications on Food Security in India – Post 1980’s Study
194
Engel’s law also says that, an increase in income leads to a fall in per capita consumption of food
and this will act as an improvement in the overall welfare of people.
6.5 Demand Projections of Food grains
Under different situations, the growth in per capita income, for computing demand projections, is
calculated by subtracting the population growth from income growth. Growth in demand for
cereals and pulses can be attributed to population growth and also rise in demand for cultivation
seeds, animal feed as well as industrial use.
In this background the total cereal demand projected in 2011 is, if the economy grows at the rate
of 8 per cent per annum, 187.8 million tons (mt) and 188.5 mt if the GDP growth rate is 9 per
cent. And the projected cereal demand by the year 2026 will be to the tune of 272.5 mt and 277.2
mt in the other scenarios, respectively. In the same way, demand for rice, wheat and pulses is
expected to be 102.1 mt, 65.9 mt, respectively, under scenario 2 (9 per cent GDP growth rate).
VI.5 Projected annual per capita domestic demand for selected food items (kg/annum)
Food Items Scenario 1 (8 % GDP Growth) Scenario 2(9% GDP Growth) 2011 2021 2026 2011 2021 2026
Population Projected## (Millions)
1178.90 (1.39)*
1345.63 (1.33)
1414.00 (0.99)
1178.90 (1.39)
1345.63 (1.33)
1414.00 (0.99)
Rice 80.2 72.0 72.3 80.1 71.9 72.2 Wheat 51.0 49.6 48.9 50.0 47.8 46.6
T.Cereals# 159.3 180.4 193.4 159.9 182.2 196.0 Pulses 19.5 28.8 36.1 20.4 31.6 40.8
Edible Oil 13.3 19.8 25.0 14.2 22.4 28.9 Sugar 22.6 40.9 57.4 24.9 48.8 71.2
## Population projected remains same for both the scenarios. *It is the Average annual rate of growth (%). #Total Cereals. Note: Scenario1: GDP is 8%; Scenario 2: GDP is 9 %. From ‘Demand – Supply Trends and Projections of Food in India – working paper No.209” by Surabhi Mittal, March -2008, Indian Council for Research on International Economic Relations (ICRIER)”
The table shows that the projected demand for different food grains in terms of kilo grams per
annum. We can observe that with the given population growth rate the projected growth for Rice
is expected to reach 72.3 kg/annum (1st scenario) and 72.2 kg/annum (2nd scenario) per head by
the year 2026, showing a marginal decline, and the same figures for wheat, cereals and pulses are
48.9 and 46.6, 193.4 and 196.0, 36.1 and 40.8 respectively. These trends are exhibiting a gradual
decline except in the case of total cereals, which can be attributed to the increase in the demand
Indian Agriculture – Trends in Food grains Production,
Implications on Food Security in India – Post 1980’s Study
195
for coarse cereals. Sugar and edible oil demand projections also have shown a drastic rise from
the earlier periods in both the scenarios.
6.6 Projections of Food grains Supply
Here the medium and long term food supply projections have been done in a more accurate
method. These projections have been calculated assuming the yield growths to be constant or
same as in the past decade. Area expansion is also assumed to take place in future. Therefore in
the following table food Supply prospects have been presented for selected food items namely
Rice, Wheat, total cereals, pulses, oil seeds and sugarcane, for the years 2011, 2021 and 2026,
using the yield growth for the most recent period of 1993-2003 and taking 2004 as the base year
for area and production. The projected yield figures for different crops, used in computation of
future supply have been presented.
6.7 Supply Projections by Other Studies – A comparison:
Supply projections of food grains have also been made based on the assumptions of yield
growth, cropping pattern shift, technological change, impact of input and output prices etc.
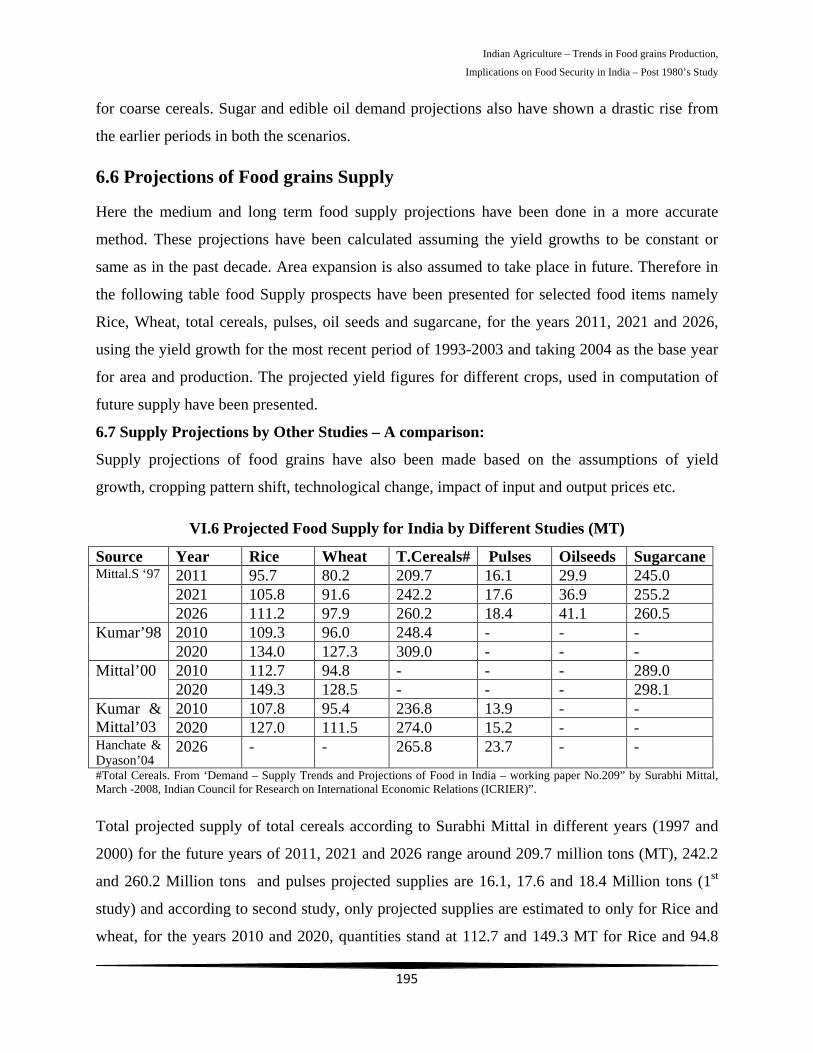
VI.6 Projected Food Supply for India by Different Studies (MT)
Source Year Rice Wheat T.Cereals# Pulses Oilseeds Sugarcane Mittal.S ‘97 2011 95.7 80.2 209.7 16.1 29.9 245.0
2021 105.8 91.6 242.2 17.6 36.9 255.2 2026 111.2 97.9 260.2 18.4 41.1 260.5
Kumar’98 2010 109.3 96.0 248.4 - - - 2020 134.0 127.3 309.0 - - -
Mittal’00 2010 112.7 94.8 - - - 289.0 2020 149.3 128.5 - - - 298.1
Kumar & Mittal’03
2010 107.8 95.4 236.8 13.9 - - 2020 127.0 111.5 274.0 15.2 - -
Hanchate & Dyason’04
2026 - - 265.8 23.7 - -
#Total Cereals. From ‘Demand – Supply Trends and Projections of Food in India – working paper No.209” by Surabhi Mittal, March -2008, Indian Council for Research on International Economic Relations (ICRIER)”.
Total projected supply of total cereals according to Surabhi Mittal in different years (1997 and
2000) for the future years of 2011, 2021 and 2026 range around 209.7 million tons (MT), 242.2
and 260.2 Million tons and pulses projected supplies are 16.1, 17.6 and 18.4 Million tons (1st
study) and according to second study, only projected supplies are estimated to only for Rice and
wheat, for the years 2010 and 2020, quantities stand at 112.7 and 149.3 MT for Rice and 94.8
Indian Agriculture – Trends in Food grains Production,
Implications on Food Security in India – Post 1980’s Study
196
and 128.5 for Wheat. And coming to Kumar stuies in both years of 1998 and 2003, for the
projected supply years of 2010 and 2020, they are only estimated for Rice, Wheat, Total Cereals
and Pulses. Observing the 1st study in the year 1998, projected supply Quantity figures for total
cereals are 248.4 and 309.0 million tons for the respective projected years of 2010 and 2020. As
per the 2nd
In the same way the pulses projections by the above three studies for the year 2011 are 23.7,
13.9 and 16.1 million tons, but the actual realised production in the year 2011 is that 18.09, here
while two studies have projected less supply than the real production, one study has over
study in the year 2003, projected supply Quantity figures for total cereals are 236.8
and 274.0 million tons for the same projected years 2010 and 2020.
Hanchnte and Dyson (2001) have calculated supply projections using area and yield projections
for total cereals and pulses for the year 2026. According to him, domestic supply in 2026, for
total cereals, will be to the level of 265.8 Mt and 23.7 mt for pulses with 1996-98 as the base
year. Kumar (1998) and Kumar & Mittal (2003) study present us the estimates on future supply
under the assumptions of input and output prices, Total Factor Productivity (TFP) growth and
supply elasticity. The results in above table for these studies are under the assumptions of
constant TFP growth. These studies project a supply of 309 mt and 274 mt of total cereals,
respectively in 2020. Estimated supply of pulses in 2020 by Kumar and Mittal (2003) study is
15.2 mt with 2000-01 very close to the 17.6 mt estimate of pulses production by present paper
for 2021. Future supply estimates for oil seeds and sugar cane have not been given by other
studies except Mittal (2000). The estimates in the present paper for sugarcane are lower than that
of Mittal (2000) because sugarcane yields are showing a declining trend in present years.
If we observe these trends closely, as these projections are made quite some years back,
excluding the projections for the years 2020 and 2026, it is very clear that, projections that have
been made for the year 2011 are lagging long way behind the reality. Because the projected
supply of Rice in the year by above four studies are 107.8, 109.3, 112.7 and 95.7 million tons,
but the actual realised production in the year 2011 is just 80.41 mt. In the same way the
projections for wheat were 95.4, 96.0, 94.8, 80.2 million tons, except the last study, all other
studies have lagged behind as there existed big gap between the projection and actual production,
actual realised production is only 85.93 million tons.
Indian Agriculture – Trends in Food grains Production,
Implications on Food Security in India – Post 1980’s Study
197
estimated the projection when compared to the actual production. It only shows that the pulses’
have been showing a decent performance when compared to other cereals. Therefore if India has
to achieve the food security, it really needs to increase the production of staple cereals especially
the Rice and Wheat in order to meet the increased demand in future.
These Demand and supply projections of food grains act as indicators to policy makers to
formulate their medium and long term agricultural policies. The study shows that the increase in
total demand can be attributed to growth in population and per capita income. As far as supply is
concerned, production is constrained by low yield growth.
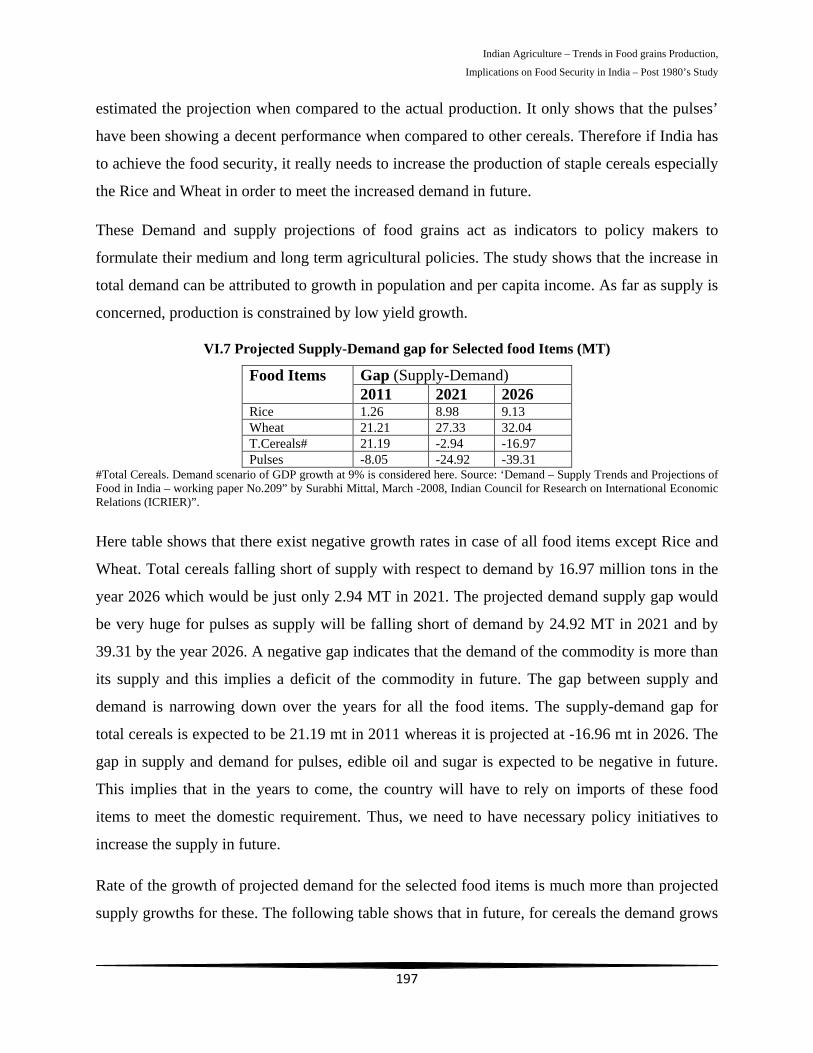
VI.7 Projected Supply-Demand gap for Selected food Items (MT)
Food Items Gap (Supply-Demand) 2011 2021 2026
Rice 1.26 8.98 9.13 Wheat 21.21 27.33 32.04 T.Cereals# 21.19 -2.94 -16.97 Pulses -8.05 -24.92 -39.31
#Total Cereals. Demand scenario of GDP growth at 9% is considered here. Source: ‘Demand – Supply Trends and Projections of Food in India – working paper No.209” by Surabhi Mittal, March -2008, Indian Council for Research on International Economic Relations (ICRIER)”.
Here table shows that there exist negative growth rates in case of all food items except Rice and
Wheat. Total cereals falling short of supply with respect to demand by 16.97 million tons in the
year 2026 which would be just only 2.94 MT in 2021. The projected demand supply gap would
be very huge for pulses as supply will be falling short of demand by 24.92 MT in 2021 and by
39.31 by the year 2026. A negative gap indicates that the demand of the commodity is more than
its supply and this implies a deficit of the commodity in future. The gap between supply and
demand is narrowing down over the years for all the food items. The supply-demand gap for
total cereals is expected to be 21.19 mt in 2011 whereas it is projected at -16.96 mt in 2026. The
gap in supply and demand for pulses, edible oil and sugar is expected to be negative in future.
This implies that in the years to come, the country will have to rely on imports of these food
items to meet the domestic requirement. Thus, we need to have necessary policy initiatives to
increase the supply in future.
Rate of the growth of projected demand for the selected food items is much more than projected
supply growths for these. The following table shows that in future, for cereals the demand grows

Indian Agriculture – Trends in Food grains Production,
Implications on Food Security in India – Post 1980’s Study
198
at a much higher rate than the domestic supply. This difference in growth rates is much higher
for pulses, edible oil and sugar.
VI.8 Per cent Annual Growth rate of projected supply and Demand in 2026 Food Items Demand Supply Rice 1.55 1.01 Wheat 1.42 1.34 Total Cereals 3.17 1.45 Pulses 6.51 0.91
Note: Growth rates are between base year and 2026. Demand Scenario of GDP growth at 9% is considred here. Source: ‘Demand – Supply Trends and Projections of Food in India – working paper No.209” by Surabhi Mittal, March -2008, Indian Council for Research on International Economic Relations (ICRIER)”.
The table shows that the projected growth rates of demand and supply for Rice and wheat lesser
compared to total cereals, pulses, edible oil and sugar. It only shows that there will be supply
shortages in response to demand. It indicates that there will of scope for food insecurity in future.
Rice and Wheat falling short of demand marginally, but Pulses and Cereals have been subject to
extreme differences in supply and demand in future by the year 2026, as their demand will be
falling short of supply.
VI.9Projected Growth Rates in Income: (% per annum) Particulars 2004-11 2011-16 2016-21 NNP at factor price 9.0 9.0 9.0 Per capita Income Rural 3.46 3.52 3.58 Urban 11.81 12.01 12.19 All India 7.57 7.75 7.91 Source: “Demand Projections for Food Grains in India” by Praduman Kumar, P.K.joshi and Pratap S.Birthal, NCAP-N.Delhi. Agricultural Economics Research Review, Vol.22 July-Dec 2009 pp 237-243.
Based on recent trends, it was assumed that the Indian Economy would grow at an average rate
of 9 per cent per year over the next 15 years. Netting out the population growth rates during
different five year plans from the GDP, growth provides us a growth rate of 7.57 per cent in per
capita income during the XIth plan, 7.75 per cent during 2011-16 and 7.91 per cent during 2016-
21. Rate of growth in per capita income of urban population is likely to be 3 times of the growth
in per capita income of rural population.
6.8 Projection of Food Grains Consumption:
Indian Agriculture – Trends in Food grains Production,
Implications on Food Security in India – Post 1980’s Study
199
Per capita consumption of food grains (as direct demand) in 2004-05 by region and income
group separately for rural and urban population was used as baseline consumption for projecting
the future per capita consumption. Cereal consumption has shown a decline in both rural and
urban areas. Per capita consumption of coarse cereals has shown much steeper decline than by
rice and wheat. Per capita consumption of cereals has been projected to decline from 139.9 kg
(per year) in 2004-05 to 125.3 kg in 2011-12 and 122.6 kg in 2021-22. Consumption of pulses is
likely to be around 9.5 kg during the XIth plan and would increase only marginally afterwards.
By multiplying the projected per capita consumption with projected population, we arrive at the
direct household demand for food grains as 181.2 million tonnes (Mt) towards the end of XIth
plan, with a grain mix of 87.4 Mt of rice, 67.2 Mt of wheat, 14.2 Mt of coarse grains, and 12.5
Mt pulses. The direct household demand for food grains would increase to 202 Mt by 2021-22,
comprising 97.4 Mt of rice; 73.5 Mt of wheat; 15.1 Mt of coarse grains and 16.1 Mt of pulses.
Now if we can observe the Projections of future food grain consumption, we can derive some
interesting inferences. For rural areas, in the coming years of 2011-12, 2016-17 and 2021-22, the
per capita consumption of Rice is expected to remain exactly at 72.4kg/yr during all three
projected periods. Coming to wheat consumption, it is expected to range between 47.9 and 48.1
kg/year exhibiting a marginal decline.
Even the coarse cereals also going to register a marginal decline from 14.9 kg/yr to 14.5 kg/yr
during the same years. But the consumption of total cereals is going to fluctuate between 135.2
to 135.1 kg/yr. Only the pulses consumption is expected to grow from 8.7 kg/yr to 9.5 kg/yr
while the total consumption of food grains is projected to grow slightly from 143.9 kg/yr to
144.6 kg/yr.
But in the case of urban areas, the consumption of Rice, wheat, coarse cereals, total cereals and
total food grains have been projected to decline significantly. Only the consumption of Pulses is
expected to grow from 11.0 kg/yr to 13.5 kg/yr. And the all India trends of projections are also
showing the same trends of reduction in consumption of all the cereals except Pulses. Factors
behind this can be attributed to the increase in population, decrease in Food grain production or
increase in prices and to some extent due to changes in the tastes and preferences of the
consumers.

Indian Agriculture – Trends in Food grains Production,
Implications on Food Security in India – Post 1980’s Study
200
6.9 Policy Scenario to meet Future Demand:
Given the recent trends in production, meeting future demand for food grains through domestic
production alone appears to be difficult, but not impossible. The incremental demand and
thereby production has essentially to come from productivity improvements as the potential for
area expansion, by and large, has exhausted. Besides, increasing demand for high-value food
commodities like fruits and vegetables is likely to cause a shift in area from staple food crops.
Also agricultural lands are being increasingly diverted towards non-agricultural uses. To meet
the future demand, the required levels of yield targets were estimated for the years 2011, 2016
and 2022 and have been presented in the following table.
VI.10 Yield target Projections for the years 2011-12, 2016-17 and 2021-22
Commodity Base Year TE 2005-06 Required Yield Level (kg/ha) Area (M.Ha) Yield (kg/ha) 2011-12 2016-17 2021-22
Rice 42.7 2056 2368 2500 2651 Wheat 26.5 2645 3063 3282 3380 C.Cereals* 29.6 1183 993 1015 1046 Cereals 98.8 1952 2141 2262 2364 Pulses 22.9 604 677 765 853 Foodgrains 121.7 1698 1866 1981 2080 Increment Required to meet future demand Rice 42.7 2056 15.2 21.6 29.0 Wheat 26.5 2645 15.8 24.1 27.8 Pulses 22.9 604 12.1 26.8 41.2
Source: “Demand Projections for Food Grains in India” by Praduman Kumar, P.K.joshi and Pratap S.Birthal, NCAP-N.Delhi. Agricultural Economics Research Review, Vol.22 July-Dec 2009 pp 237-243. *Coarse Cereals.
To meet the food grain demand in 2011-12, the yields of different commodities must be raised to
a minimum of 2.37 tons/hectare (t/ha) for rice, 3.07 t/ha for wheat, and 0.68 t/ha for pulses. By
2021-22, yields must further be improved to 2.65 t/ha for Rice, 3.38 t/ha for wheat and 0.85 t/ha
for pulses. In terms of percentage increase, by 2011-12 the average yield of rice and wheat must
increase by 15-16 per cent and of pulses by 12 per cent. By 2021-22, further improvements are
required in yields of rice and wheat by 28-29 per cent and of pulses by 41 per cent. Improving
yield levels would require serious efforts to sustain and improve the total factor productivity
through research and development efforts.
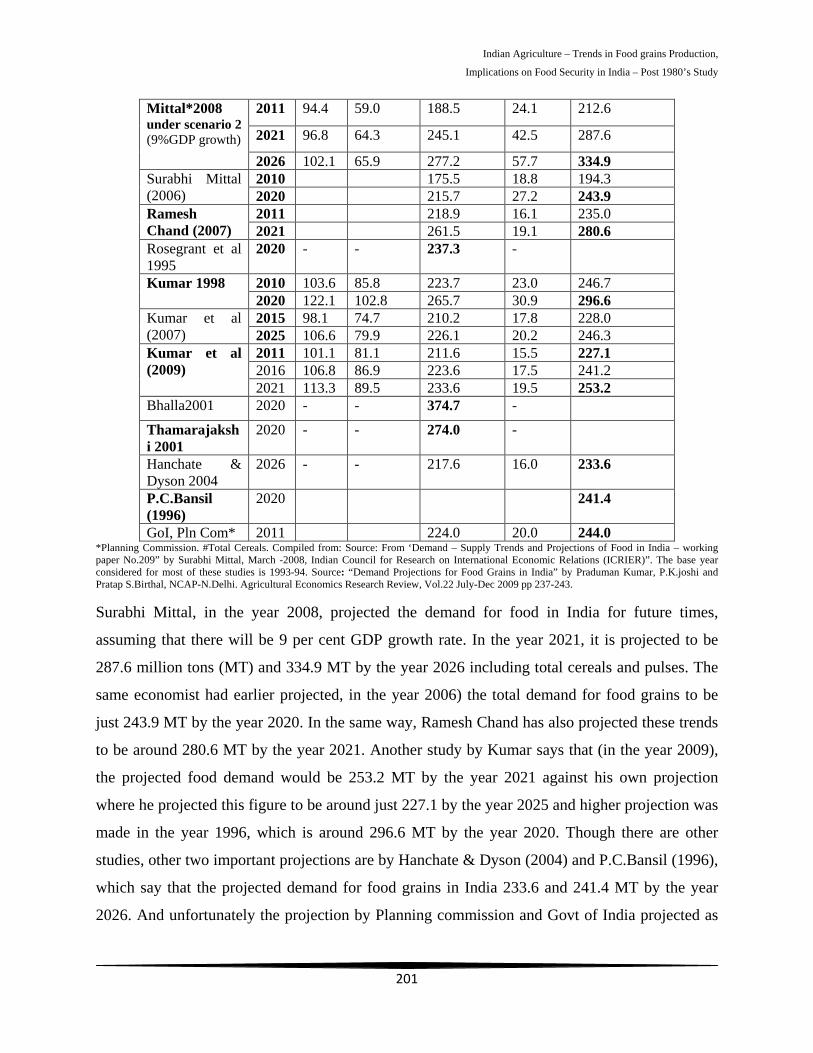
VI.11 Projected food demand for India, by different studies. (million tonnes)
Source Year Rice Wheat T.Cereals# Pulses Foodgrains
Indian Agriculture – Trends in Food grains Production,
Implications on Food Security in India – Post 1980’s Study
201
Mittal*2008 under scenario 2 (9%GDP growth)
2011 94.4 59.0 188.5 24.1 212.6
2021 96.8 64.3 245.1 42.5 287.6
2026 102.1 65.9 277.2 57.7 334.9 Surabhi Mittal (2006)
2010 175.5 18.8 194.3 2020 215.7 27.2 243.9
Ramesh Chand (2007)
2011 218.9 16.1 235.0 2021 261.5 19.1 280.6
Rosegrant et al 1995
2020 - - 237.3 -
Kumar 1998 2010 103.6 85.8 223.7 23.0 246.7 2020 122.1 102.8 265.7 30.9 296.6
Kumar et al (2007)
2015 98.1 74.7 210.2 17.8 228.0 2025 106.6 79.9 226.1 20.2 246.3
Kumar et al (2009)
2011 101.1 81.1 211.6 15.5 227.1 2016 106.8 86.9 223.6 17.5 241.2 2021 113.3 89.5 233.6 19.5 253.2
Bhalla2001 2020 - - 374.7 -
Thamarajakshi 2001
2020 - - 274.0 -
Hanchate & Dyson 2004
2026 - - 217.6 16.0 233.6
P.C.Bansil (1996)
2020 241.4
GoI, Pln Com* 2011 224.0 20.0 244.0 *Planning Commission. #Total Cereals. Compiled from: Source: From ‘Demand – Supply Trends and Projections of Food in India – working paper No.209” by Surabhi Mittal, March -2008, Indian Council for Research on International Economic Relations (ICRIER)”. The base year considered for most of these studies is 1993-94. Source: “Demand Projections for Food Grains in India” by Praduman Kumar, P.K.joshi and Pratap S.Birthal, NCAP-N.Delhi. Agricultural Economics Research Review, Vol.22 July-Dec 2009 pp 237-243.
Surabhi Mittal, in the year 2008, projected the demand for food in India for future times,
assuming that there will be 9 per cent GDP growth rate. In the year 2021, it is projected to be
287.6 million tons (MT) and 334.9 MT by the year 2026 including total cereals and pulses. The
same economist had earlier projected, in the year 2006) the total demand for food grains to be
just 243.9 MT by the year 2020. In the same way, Ramesh Chand has also projected these trends
to be around 280.6 MT by the year 2021. Another study by Kumar says that (in the year 2009),
the projected food demand would be 253.2 MT by the year 2021 against his own projection
where he projected this figure to be around just 227.1 by the year 2025 and higher projection was
made in the year 1996, which is around 296.6 MT by the year 2020. Though there are other
studies, other two important projections are by Hanchate & Dyson (2004) and P.C.Bansil (1996),
which say that the projected demand for food grains in India 233.6 and 241.4 MT by the year
2026. And unfortunately the projection by Planning commission and Govt of India projected as

Indian Agriculture – Trends in Food grains Production,
Implications on Food Security in India – Post 1980’s Study
202
high as 244.o mT of food grains including cereals and pulses, but the actual realised production
in this year is just around 218 MT.
These projections only indicate us the required levels of food grains growth in the coming years.
But considering the kind of structural, financial and policy obstacles that our agriculture is up
against, it is not going to be easy to achieve these growth rates. Especially the light of changing
climatic conditions, changing dietary patterns, changing dietary patterns and also the liberalised
trade regime in agriculture and also in the light of decreasing poverty rates and increasing
incomes of the poorer sections in India, there needs to be sufficient and required policies initiated
as early as possible.
6.1.0 Conclusion:
Despite dietary diversification involving a sharp decline in per capita direct consumption of food
grains, the demand for cereals and pulses is projected to grow at about 2 per cent per year on
account of the increase in population and growth in indirect demand. This growth rate is almost
four times the growth rate experienced in the domestic production of food grains during the last
decade. This has created serious imbalances between domestic production and demand which for
sometime was met by liquidating stocks and cutting down on exports. If the growth rate in the
domestic production of food grain fails to rise to the required level, it would result in a decline in
the export of rice and eventually lead to increased dependence on the import of wheat and rice
and pulses to meet the domestic demand for food grains.
If we want to meet the domestic demand of food requirements, we must increase production or depend on
imports. As agricultural growth is limited, imports will help improve the supply situation in the short turn
where as in the long term, we will need to focus on productivity increase, through public capital
formation in irrigation, research and efficient use of water, plant nutrition and other necessary inputs.
Policy initiates must lead for efficiency and help in maintaining balance between domestic production and
demand. If we strive to achieve these potential yield levels, then the increasing demand requirements of
the country can be met in future.
Chapter VII