characterisation and management of non-formal solid waste
TRANSCRIPT

Characterisation and management of non-formal solid waste management disposal sites in Harare, Zimbabwe.
By
CASTON MAHAMBA
Submitted in accordance with the requirements
For the degree of
MASTER OF SCIENCE
in the subject
ENVIRONMENTAL MANAGEMENT
at the
UNIVERSITY OF SOUTH AFRICA
SUPERVISOR: PROF TM RUHIIGA
FEBRUARY 2015

TABLE OF CONTENTS
(i) Declaration i
(ii) Dedication ii
(iii) Acknowledgements iii
(iv) Abstract iv
(v) List of figures v
(vi) List of tables vi
(vii) List of abbreviations vii
1 1 INTRODUCTION
1
2 1.1 Background to the study 1
3 1.2 Problem statement 6
4 1.3 Objectives of the study 7
5 1.4 Purpose of the study 7
6 1.5 Hypotheses 8
7 1.6 Justification for the study 8
8 1.7 Assumptions of the study 9
9 1.8 Limitations 10
10 1.9 Delimitations of the study 11
11 1.10 Chapter breakdown 12
12 1.11 Definition of terms 13
13 1.12 Summary 14
14 2 LITERATURE REVIEW
15
15 2.1 Introduction 15
16 2.2 Waste characterisation 15
17 2.2.1 Benefits of waste characterisation 17
18 2.2.2 Waste classification 17
19 2.2.3 Waste profiles 18
20 2.2.4 Waste management protocols 18
21 2.3 Dynamics of waste generation 19

22 2.4 Non-formal solid waste disposal sites 21
23 2.5 Solid waste management 23
24 2.5.1 Introduction 23
25 2.5.2 Conventional solid waste management 23
26 2.5.3 The Global Context 30
27 2.5.4 Conditions in Africa 32
28 2.5.5 Solid waste management in Zimbabwe 35
29 2.6 Summary 43
30 3 RESEARCH DESIGN AND METHODOLOGY
44
31 3.1 Introduction 44
32 3.2 Research design 44
33 3.3 Data sources 45
34 3.4 Population 45
35 3.5 Design of research instruments 46
36 3.6 Data management and presentation 46
37 3.7 Choice of instruments 47
38 3.8 Pilot study 49
39 3.9 Data collection 49
40 3.9.1 Observation 49
41 3.9.2 Interview 49
42 3.10 Sampling technique 50
43 3.11 Summary 53
44
45 4 RESULTS AND ANALYSIS
54
46 4.1 Introduction 54
47 4.2 Locational attributes of non-formal solid waste dumps
54
48 4.3 Analysis of internal linkages of locational attributes 57
49 4.4 Classification of waste by type 64
50 4.5 Analysis of variations in waste profiles 67
51 4.6 Current waste management approaches 70
52 4.6.1 Inventory of the Department of Waste Management 71

53 4.6.2 Waste handling methods 72
54 4.6.3 Receptacles used 73
55 4.6.4 Waste disposal methods 74
56 4.7 Summary 75
57 5 DISCUSSION OF THE RESEARCH RESULTS
77
58 5.1 Introduction 77
59 5.2 Locational attributes of non-formal solid waste dumps
77
60 5.3 Internal linkages of locational attributes 78
61 5.4 Classification of waste by type 80
62 5.5 Waste profiles in Harare 81
63 5.6 Current waste management strategies in Harare 83
64 5.7 Advice on sustainable waste management strategies 86
65 5.7.1 Integrated environmental management system 86
66 5.7.2 Contracting system 88
67 5.7.3 Environmental awareness 89
68 5.7.4 Human resources development 89
69 5.7.5 Legislation 90
70 5.8 Summary 91
71 6 CONCLUSION AND RECOMMENDATIONS
92
72 6.1 Summary 92
73 6.2 Conclusion 93
74 6.3 Recommendations 93
75 6.3.1 Recommendations to the Department of Waste Management
93
76 6.3.2 Recommendations to the residents of Harare 95

77 6.3.3 Recommendations to the government 96
78 6.4.4 Recommendations to the industry 97
79 LIST OF REFERENCES 98
80 APPENDICES
104
81 Appendix 1: Interview schedule for the Department of Waste Management
104
82 Appendix 2: Observation parameters 106
83 Appendix 3: Volumes of waste for sample dump sites 107
84 Appendix 4: Types of waste for selected dump sites 109
85 Appendix 5: Ethical clearance from Unisa 111
86 Appendix 6:Authorisation letter from the city of Harare 112
87 Appendix 7:Letter of introduction from the University of South Africa
113

DECLARATION
I, CASTON MAHAMBA, hereby declare that this dissertation is purely and wholly a product
of my own creation.I further declare that the work herein is virtually my own original work
and has not been previously partially or wholly submitted to any university or any institution
of higher learning. Where consultations were sought, relevant acknowledgements have
been dully conferred to in the way of referencing and citations; therefore, any material that
may be found to be similar to any published work will be mere coincidence.
i

DEDICATION
I dedicate this dissertation to my late father and my mother, who instilled in me a culture of
hard work from a tender age and never stopped to remind me of the power of education. I
also dedicate it my wife Tsitsi, who made sure that I never got time off from my books until I
completed this dissertation. Furthermore, with great love, I dedicate this work to my
daughters Rumbidzai, Zivai, Wadzanai and son Tawanda; I hope will inspire them as they
pursue their academic endeavours.
ii

ACKNOWLEDGEMENTS
This dissertation might not have seen the light of the day or probably would have taken
much longer to complete if it was not for the expert and untiring support of my most
esteemed supervisor Professor TM Ruhiiga, to whom I am greatly indebted. His amazing
knowledge and consummate mastery of the study area were manifested as he walked with
me along the seldom trodden ground of research and opened my eyes as he fed me with
the healthy milk of academic wisdom. My sincere gratitude also goes to Mrs N SMlilo,
whose undisputable knowledge of statistics made my data analysis and hypothesis testing
easily surmountable. I also acknowledge the efforts of Mr F Makarati,for his invaluable
assistance during the compilation of this dissertation (especially on issues of academic
writing). Special thanks also to Mr M Sibanda, who helped me with computer skills –
especially on the two models of waste management hierarchy and sustainable waste
management. The city of Harare and the Department of Waste Management receive special
mention for their cooperation during my data collection, which was most encouraging,
while the Zimbabwe Central Statistical Office is greatly thanked for their assistance with the
demographic data of the city of Harare.
iii

ABSTRACT
The study focused on the characterisation and management of non-formal solid waste
disposal sites in Harare, the capital city of the Republic of Zimbabwe. In many developing
countries, increasing urbanisation surpasses the development of urban infrastructure and
this has led to the proliferation of informal settlements, illegal dumping sites and
uncontrolled vending in cities like Harare. The researcher investigated the prevalence of
non-formal dumping sites in Harare, including the composition, locational attributes and
internal linkages of solid waste. Practices regarding the management of non-formal solid
waste disposal sites were examined and areas of good practice and conformity to
international standards were complemented while recommendations and suggestions were
made on areas that were found wanting. An integrated management system was
recommended for the sustainable management of solid waste. To support this
recommendation, management window of responsibilities (EMWR) model was created so
that the Harare City Council can enhance stakeholder participation. The research results
show that most residents used non-conventional ways to store waste, like mealie-meal bags
and sacks, and this posed a danger to human health. It also emerged that the city of Harare
has not updated some of its by-laws, some of which were enacted about 33 years ago while
others remained drafts for decades. This made it difficult for the city to effectively
implement them.
Key terms: characterisations, solid waste, solid waste management, integrated solid waste
management systems, non-formal solid waste disposal sites, Harare, municipality,
environment, household, solid waste disposal
iv
LIST OF FIGURES Page
Figure 1: Position of Harare, Zimbabwe 2
Figure 2: Districts of Harare 4
Figure 3: Main land-use zones of Harare 5
Figure 4: Street map of Harare 12
Figure 5: Characterisation of solid waste 16
Figure 6: Waste profiles of Harare 20
Figure 7: Integrated solid waste management model 28
Figure 8: Waste management hierarchy 29
Figure 9: Waste disposal methods in Harare 40
Figure 10: Waste storage facilities 41
Figure 11: Colour coded bins 42
Figure 12: Distribution of illegal dump sites in Harare 51
Figure 13: Solid waste dumps in Harare 55
Figure 14: Size of site and distance from land use 58
Figure 15: Waste profiles of high density residential areas 65
Figure 16: Waste profiles medium residential areas 66
Figure 17: Waste profiles of low density residential areas 66
Figure 18: Waste profiles of different land uses 68
Figure 19:Waste profiles of Harare 69
Figure 20 Waste handling methods 73
Figure 21: Types of receptacles used 74
Figure 22: Methods of waste disposal 75
Figure 23: Environmental management window of responsibilities (EMWR) model 87
V

TABLES Page
Table 1: Selected areas and number of waste dumps in Harare 22
Table 2: Recycling in Europe 25
Table 3: Waste collection recommendations 30
Table 4: Municipal waste streams in the United States 31
Table 5: Comparison of waste compositions in East African countries 33
Table 6 : Comparison of solid waste management in selected cities 33
Table 7: Instruments and variables measured 48
Table 8: Size of dump site in relation to land use 52
Table 9: Distance of dump site from main land use 56
Table 10: SAS Out put 58
Table 11: Distance between dump site and main land use 60
Table 12: Combined data for low-density and medium-density areas 61
Table 13: Land use and size of dump sites 63
Table 14: Level of education of personnel in the Department of waste management 71
Table 15: Equipment used for managing waste 71
vi

LIST OF ABBREVIATIONS
CBD central business district
CSO Central Statistical Office
DRC Democratic Republic of Congo
EACs East African countries
EMA Environmental Management Agency
EPA Environmental Protection Agency
EMWR environmental management window of responsibilities
ISWM integrated solid waste management
P (Botswana) Pula
PDL poverty datum line
R (South African) Rand
RSA Republic of South Africa
UK United Kingdom of Great Britain and Northern Ireland
UNDP United Nations Development Programme
UNEP United Nations Environmental Programme
US United States
USA United States of America
US$ United States Dollar
ZESA Zimbabwe Electricity Supply Authority
VII


1
CHAPTER 1: INTRODUCTION
1.1 BACKGROUND TO THE STUDY
As countries continue to industrialise, a number of challenges inevitably emerge and most of
them impact heavily on the environment. Chief among the urban problems is solid waste
management. Like many other cities in Sub-Saharan Africa and developing countries elsewhere
in the world, Harare has been conspicuously unable to effectively manage its solid waste
disposal sites. According to Bere(2013:24), the severity of solid waste management challenges
in Zimbabwe (and Harare in particular) is clearly manifested in the prevalent accumulation of
garbage in public places, on streets and in back alleys in many residential, industrial and
commercial areas of the city.
Harare is the capital city of Zimbabwe and is located in the northern part of the country. The
location of the city was influenced by the availability of water from the Mukuvisi and Manyame
rivers, rich agricultural soil, gold deposits and relatively cool temperatures compared to most
parts of the country. Harare receives an annual rainfall of over 1500mm. Abundant flat land
was another attraction for the establishment of Harare, since this made it cheaper to construct
structures of various designs and sizes without having to stabilise them with special foundations
as is the case with undulating landscapes. Pioneer column (led by Cecil John Rhodes), which
established the city in 1894, also considered the security offered by the surrounding kopjes.
Harare is also the economic hub of the country, headquartering many of the companies
operating in the country. In the 1960s, the city of Harare enjoyed some notable growth, as it
was the administrative centre of the federation which comprised northern Rhodesia (Zambia)
and Nyasaland (Malawi). It is also the current national administrative centre of Zimbabwe,
where all the government ministries are located. Harare is also home to some of the country’s
institutions of higher learning, like the University of Zimbabwe, Belvedere Teachers’ College,
Seke Teachers’ College, Harare Institute of Technology and Harare Polytechnical College. The
city of Harare is predominantly inhabited by Shona-speaking people because it is surrounded by

2
provinces where these people live, including Mashonaland West, Mashonaland Central and
Mashonaland East.
The position of Harare is also very strategic because it is the communication nodal point from
where all the major roads in the country radiate; this means that the country is well connected
with its neighbours. National roads and railway lines connect Harare to Zambia, Mozambique,
Botswana and South Africa. Figure 1 shows the position of Harare in Zimbabwe.
Figure 1:Position of Harare, Zimbabwe
(source: http://www.google.co.za/search q=free+downloadable+map+Zimbabwe

3
Waste management, particularly solid waste management, is one of the most readily visible
urban services whose effectiveness and sustainability can be used as an indicator to measure
the competencies and commitment of a municipality. It is with this reason that one does not
need to be a qualified environmental manager to see how the solid waste management system
in Harare has collapsed. According to Manyanhaire and Munasirei(2010:69), Harare is currently
ranked very low in the area of solid waste disposal compared to other African cities. They
observe that the population growth has not been matched with the expansion of infrastructure,
especially water reticulation and solid waste disposal; hence, the city has been cited by the
Economic Intelligence Unit as one of the most unliveable cities in the world. According to the
Zimbabwe National Statistical Agency(2012), the population of Harare is was 1 468 768 in
2012.The city cannot cope with such a big population and this results in residents dumping
waste in undesignated areas, causing phenomenal environmental pollution. There is also no
evidence of solid waste quantification, as more attention is focused on the effects of poorly
managed solid waste like odour, rodents, sewer blockages, contaminated ground water and the
general public nuisance caused by garbage.
According to Makarati and Chikobvu(2011:51), illegal dumping of solid waste has been cited as
the chief cause of sewer system blockages (especially from plastics and sanitary waste).The
poor management of solid waste (particularly the non-characterisation of non-formal solid
waste dump sites) was seen by the same authors as contributing to the accumulation of heavy
metals like lead, copper and zinc at non-formal disposal sites. These metals heavily pollute
ground water and since most of the people in Harare depend on borehole water, there have
been incidences of sickness caused by drinking contaminated water. Non-formal solid waste
disposal sites have become a common sight in the streets of Harare, especially in the residential
areas and the CBD. Littering has been attributed to the absence of enforcement of municipal
by-laws and general despondency among residents due to ever-falling standards. According to
the city of Harare’s Department of Waste Management (2014), from 2005 to mid-2009, waste
was not collected by the municipality due to economic hardship. It is assumed that some
children who were born during that time grew up for more than five years without seeing any

4
waste being collected, which possibly led to a culture of littering and dumping. The exodus of
qualified and experienced personnel from the country to neighbouring countries and abroad
due to the economic doldrums that hit the country from 2005 to 2008 did not spare Harare’s
city council– an occurrence which also contributed to the collapse of the Department of Waste
Management.
Figure 2: Districts of Harare(source: City of Harare 2014)

5
The districts re mainly designed to map out political boundaries and within these districts,
wards are created to make the management of the city easy. They are named using directions
(like Harare South, Central, West and East) and the names of some suburbs. Within these
districts, there are various land uses. The main land-uses in Harare include residential use,
industrial use and the central business district as shown in Figure 3.
Figure 3: Land use zones in Harare(source: City of Harare 2014)
Key
Central business district (CBD) Industrial area
Low-density residential area Low-income residential area
Medium-density residential area
6
Figure 3 illustrates urban land-use zones, especially residential areas. It shows that income
influences the type and value of the house one will occupy and the distance from the CBD.High-
income groups reside in more affluent areas with expensive houses that are usually away from
the CBD since they can afford the high costs of rent and transport. The CBD contains the major
shops and offices; it is the centre for commerce and entertainment, and the focus of transport
routes. Low-density residential areas are characterised by high-class housing that are occupied
by wealthy families who can afford expensive properties and the cost of commuting. These
areas include Borrowdale, Highlands, Mandara, Chisipiti and Avondale. Medium-residential
areas have high-quality housing and a lot of space. These include Waterfalls, Cranborn, Hatfield
and Houton Park. The high-density residential areas are where the low-income groups reside.
They are close to industries and town to enable workers to walk from and to town and work.
Examples of these areas are Mbare, Glenview, Dzivarasekwa, Mufakose and Kuwadzana. These
areas are characterised by poverty, overcrowding and illegal dumping of solid waste. Industrial
areas are where the industries are located.
1.2 PROBLEM STATEMENT
The city of Harare displays the typical mix of formal and non-formal solid waste dumps. These
are distributed across the different urban land-use types at various levels of intensity. While
formal solid waste dumps are planned, strategically located for accessibility, adhere to national
waste management guidelines and are regularly serviced, non-formal solid waste dumps do not
share similar characteristics. They are illegal and therefore not planned by the city authorities;
hence, they do not receive regular services and are not regulated. As a result of this, they
cannot be easily managed using the same protocols as apply to solid waste dumps. The
problem of illegal waste dumps is a multifaceted phenomenon in both a spatial and a temporal
context. The dumping of solid waste on undesignated areas has become a topical issue,
especially in developing countries. According to Chung (2010),dumping of waste at
undesignated sites is mainly caused by the inability of municipalities to effectively collect waste
on time, lack of enforcement of municipal laws, and lack of technical and financial capacity.

7
Much of the research efforts on urban waste management has focused on formal solid waste
disposal sites, partly because of the availability of records, the ease with which they can be
mapped, management practices that are aimed at meeting national waste guidelines and their
location in high priority areas (such as residential, commercial and industrial districts). This
means that not much is documented in the literature about the physical attributes of non-
formal waste dumps, especially in developing countries. Yet an understanding of these
attributes should provide important insights into the design of appropriate management
interventions.
1.3 OBJECTIVES OF THE STUDY
The objectives of this study are as follows:
• Measure locational attributes of non-formal solid waste dumps.
• Analyse internal linkages of locational attributes.
• Classify waste by type across the study area.
• Analyse the variations in the profiles of waste in the study area.
• Describe current waste management approaches usedin Harare.
• Generate advice on sustainable waste management strategies.
1.4 PURPOSE OF THE STUDY
The purpose of this study is to measure and analyse the physical attributes of non-formal waste
dumps at selected sites in the city of Harare as a basis for assessing current waste management
practices. The research will generate information on the characterisation and management of
non-formal solid waste disposal sites in Harare, and how it can be used to achieve
sustainability. The information can also be used to reduce waste and its impact on the
environment. The research findings are rooted in the contemporary urban issues of solid waste
8
management and sustainable cities, which makes the information invaluable for the city of
Harare.
1.5 HYPOTHESES
The hypotheses of the study are as follows.
(1) There is a statistically significant relationship between the location of dump sites and
the proximity of the dominant land-use type. The land use is on the x-axis (independent
variable) while the location of the dump site is on the y-axis (dependent variable).
The data inputs to consider for this hypothesis are:
o distance of dump site from position of land use
o amount of waste
o type of waste
o size of dump site
o main land-use
(2) The actual size of a dump site is closely related to the land use within a specified radius. The data inputs to consider for this hypothesis are:
o number of dump sites
o type of land use
o size of dump site
1.6 JUSTIFICATION FOR THE STUDY
This research has been necessitated by the seeming absence of a coherent strategy for a
successful and sustainable solid waste disposal system in Harare. The study is aimed at trying to
come up with sustainable and cost-effective solid waste disposal mechanisms. It is envisaged
that the proper and monitored characterisation of solid waste, together with its sources, will go
a long way in improving the management of solid waste. The research will provide city officials

9
and planners with an empirical justification for any proposed policy on domestic solid waste
management.
The residents of Harare, the Ministry of Environment and Natural Resource Management and
the Environmental Management Agency(EMA) need advice on efficient, affordable and
integrated environmental management systems and environmentally-friendly ways to manage
solid waste. The significance of this study is also to facilitate the exchange of information
among cities in Zimbabwe and in the region at large. It is also meant to demonstrate the
importance of integrated solid waste management. Teachers will be encouraged to come up
with cleaner and green environment project-based learning through solid waste management
awareness where the intellectual, emotional and social needs of a child are developed. Parents
will gain more helpful information on parenting practices to teach their children about solid
waste management. The research findings will also act as a seed bed from which other
researchers and advocacy groups that are doing similar research may tap valuable information
for their studies.
According to Musademba, Musiyandaka, Muzinda, Nhemachena and Jambwa(2011:15), the city
of Harare faces widespread criticism from residents and regional and internal watchdogs on
solid waste management. It is this that has prompted the researcher to contribute meaningfully
to both theory and practice to the debate and to offer practical solutions to environmental
management challenges. The business sector will also benefit from the research findings.
1.7 ASSUMPTIONS OF THE STUDY
As stated previously, dumping solid waste in undesignated areas has become a topical issue,
especially in developing countries. According to Chung (2010), dumping waste is mainly caused
by the inability of municipalities to effectively collect waste on time, lack of enforcement of
municipal laws, and lack of technical and financial capacity. Dumping waste mainly occurs in
residential areas and streets where vending has become the order of the day. According to

10
Faccia (2011), dumping waste is caused by a lack of environmental education (especially in
developing countries). The same author observes that agricultural-based economies produce a
lot of waste when preparing food, which makes it difficult for municipalities to cope. For the
purpose of this study, the following assumptions are specified:
• The city of Harare has mechanisms in place to deal with the collection, storage and
disposal of solid waste.
• Every household, business entity and institution has access to refuse bins for the
temporary storage of solid waste.
• The city of Harare has designated waste collection points across all the land-use types.
• The residents of Harare have little knowledge about the benefits of good solid waste
disposal and the dangers of poor waste disposal habits.
1.8 LIMITATIONS
The study only focused on the characterisation and management of non-formal solid waste
disposal sites in Harare. While the locational attributes of non-formal solid waste disposal sites
were measured and the waste classified according to type, the chemical and physical aspects of
the waste were not analysed. The population sample that was chosen for the study (i.e. 50
dump sites) was too small to be reflective of the true state of solid waste management in
Harare, let alone regional or global, to make watertight generalisations. The political situation
in the country during the research was riddled with polarisation; hence most of the participants
in the interviews and the staff of CSO were not very generous with the truth and held the
researcher in suspicion. Some respondents were very impatient due to time constrains. Some
members of the Department of Waste Management who were interviewed were not at liberty
to disclose weaknesses for fear of reprisals from the state agents who suspect researchers of
exposing failures and corruption, hence some of the information obtained during the interviews
was sugar coated. The fact that the research was carried out in 12 months means that the
11
researcher did not have time to cross the length and breadth of the city to visit every illegal
dump site.
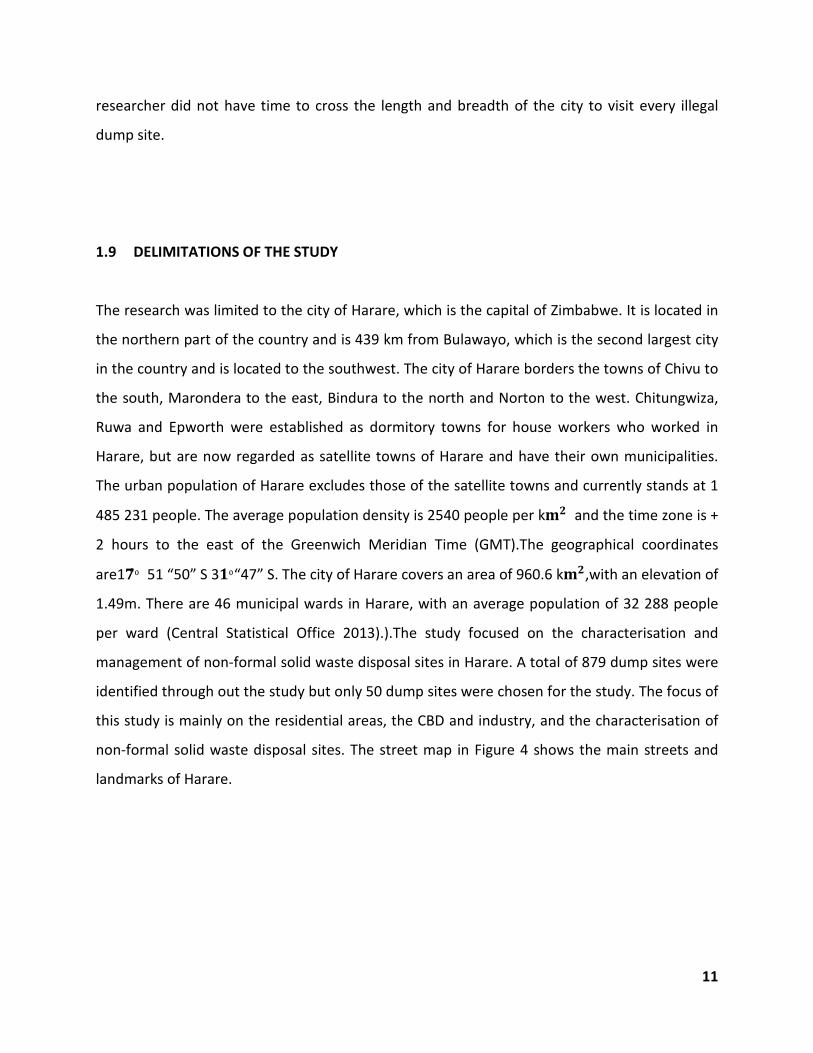
1.9 DELIMITATIONS OF THE STUDY
The research was limited to the city of Harare, which is the capital of Zimbabwe. It is located in
the northern part of the country and is 439 km from Bulawayo, which is the second largest city
in the country and is located to the southwest. The city of Harare borders the towns of Chivu to
the south, Marondera to the east, Bindura to the north and Norton to the west. Chitungwiza,
Ruwa and Epworth were established as dormitory towns for house workers who worked in
Harare, but are now regarded as satellite towns of Harare and have their own municipalities.
The urban population of Harare excludes those of the satellite towns and currently stands at 1
485 231 people. The average population density is 2540 people per k𝐦𝟐 and the time zone is +
2 hours to the east of the Greenwich Meridian Time (GMT).The geographical coordinates
are1𝟕⃘₀ 51 “50” S 3𝟏₀“47” S. The city of Harare covers an area of 960.6 k𝐦𝟐,with an elevation of
1.49m. There are 46 municipal wards in Harare, with an average population of 32 288 people
per ward (Central Statistical Office 2013).).The study focused on the characterisation and
management of non-formal solid waste disposal sites in Harare. A total of 879 dump sites were
identified through out the study but only 50 dump sites were chosen for the study. The focus of
this study is mainly on the residential areas, the CBD and industry, and the characterisation of
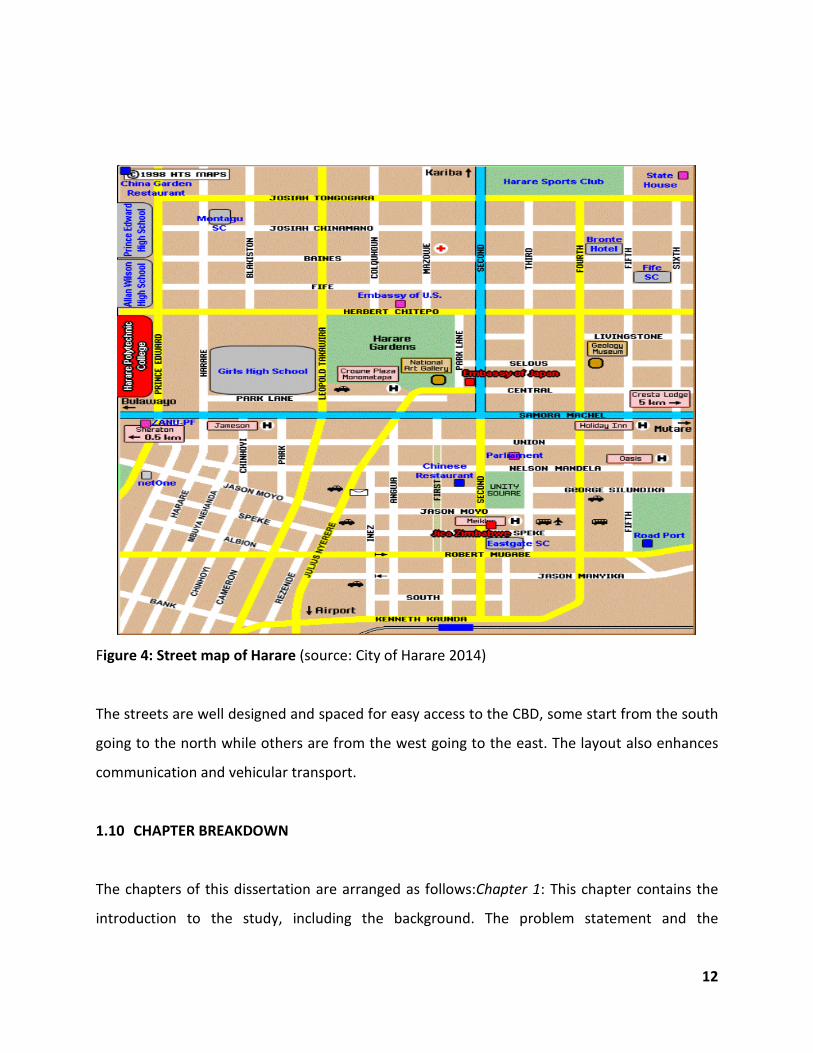
non-formal solid waste disposal sites. The street map in Figure 4 shows the main streets and
landmarks of Harare.
12
Figure 4: Street map of Harare (source: City of Harare 2014)
The streets are well designed and spaced for easy access to the CBD, some start from the south
going to the north while others are from the west going to the east. The layout also enhances
communication and vehicular transport.
1.10 CHAPTER BREAKDOWN
The chapters of this dissertation are arranged as follows:Chapter 1: This chapter contains the
introduction to the study, including the background. The problem statement and the

13
justification, aim, objectives and hypotheses of the study are also presented. Lastly, the chapter
breakdown and definition of terms are supplied.
• Chapter 2: This chapter reviews the literature that relates to the characterisation and
management of non-formal solid waste disposal sites. Aspects of solid, such as the
generation and transportation of solid waste, are investigated. The researcher examines
and borrows from what other researchers have said on the topic.
• Chapter 3: This chapter covers the research design and methodology, the data collection
methods and instruments, and the sample population.
• Chapter 4: The research results are presented and analysed in this chapter. The data is
presented in frequencies, percentages, pie charts and bar graphs.
• Chapter 5: This chapter presents the data sets and results of the analysis. The data is
presented in the form of frequencies, percentages, pie charts, bar graphs and
photographs.
• Chapter 6: This chapter contains the conclusion and recommendations of the study. This
is followed by the references and appendices.
1.11 DEFINITION OF TERMS
Characterisation: This is the process whereby the composition of waste streams is allocated to
a particular descriptive label.
Harare: This is the capital city of Zimbabwe
Household: This is a family that exists as a separate entity.
Integrated solid waste management: This is a combination of a variety of management
strategies that are interlinked to deal with solid waste in a holistic manner (Puorideme 2010).
Population: This is the total number of elements that one can investigate.
Solid waste: Any materials that are not prime products; for which the person who is generating
the material has no further use in terms of his or her own purpose of production,
transformation or consumption; and which he or she wants to dispose of but does not intend to
dispose of by using a pipeline (UNEP 2010).

14
Solid waste management: This refers to all the activities of handling, treating, conditioning,
transporting and disposing of waste (Government of Republic of South Africa 2006). [RSA 2006].
Urban area: Any built-up area of a country that is under the jurisdiction of a municipality.
Waste disposal: This means the burial, discharge, abandoning, dumping, placing or releasing of
litter into or onto land, air or water.
Waste generation: This describes all the activities that produce waste, for example food processing, construction and office work.
1.12 SUMMARY
In this first chapter, the research topic was introduced. The background to the study was
explored, the statement of the problem was elaborated, and the aim and objectives of the
study were explained. The rationale behind and the justification for the study were expounded.
The chapter ended with the delimitations of the study and the definition of terms.
15
CHAPTER 2: LITERATURE REVIEW
2.1 INTRODUCTION
This literature review was aimed at bringing to the fore a picture of the seemingly unending
solid waste management problems in Harare. It focused on the severity of the problem, its
scope and public views, and the paradigms on the problem of the characterisation and
management of non-formal solid waste disposal sites in Harare. To achieve this, the researcher
made use of books, journals, dissertations, newspapers, and government and municipal
periodicals.
Non-formal solid waste dumps have become a persistent and topical issue in Zimbabwean
cities – particularly in Harare, where there seems to be no observable evidence of proper
management of these dumps. According to Mbanga (2011:121), the city of Harare is battling
with problems caused by the ever-increasing number of illegal solid waste dump sites in
undesignated areas. These non-formal waste dump sites pose a threat to both human and
animal health. According to Mawire (2010:36), these illegal dump sites add an additional strain
to the already overstretched municipal budget – hence most of them are rarely managed,
especially in the low-income residential areas like Mbare, Mabvuku, Kuwadzana and Mufakose.
Musademba et al(2011:63)state that the proliferation of non-formal solid waste dumps also
creates an ugly and unsightly environment across the city. The non-collection of waste at these
dump sites has also been linked to air pollution since the waste decomposes in situ, exuding
offensive odours into the atmosphere. According to Okot-Okumu (2012), municipalities
(especially of African cities) find it difficult to manage non-formal solid waste dumps due to the
high rates of rural–urban migration and ineffective legislation on the illegal dumping of waste.
2.2 WASTE CHARACTERISATION
Waste characterisation can be defined as a process of determining the percentages of the
different constituents of waste, for instance how much paper, glass, food waste and others is

16
discarded in one’s waste streams. According to Munzwa (2010:54), waste characterisation is a
process whereby different waste streams are analysed. Waste characterisation plays an
important role in the treatment of waste; developers of new waste technology must also take
into account what exactly waste streams consist of in order to fully treat the waste. The
biological elements of the waste stream are crucially important in the use of systems such as
composting and anaerobic digestion.
Figure 5:Characterisation of solid waste (source: http://www.google.co.zw/maps)
It also involves the chemical, microbiological or radiological constituency of waste material.
Waste characterisation is mainly done with the purpose of reducing waste, recovering some
material that can be reused, recovering energy, minimising the impacts of waste on the
environment and reducing the costs of waste management. Information gathered helps in
planning how to reduce waste, set up recycling programmes, and conserve money and energy.
Saungweme (2012:39), defines waste characterisation as a process whereby the composition of
17
different waste streams is analysed. The same author describes it as a way of identifying the
chemical, microbiological or the radiological constituents of waste material. The biological
element of the waste is vitally important in the use of systems such as compositing or anaerobic
digestion. Figure 5 illustrates how solid waste is characterised.
The segregation of solid waste has a number of benefits, including better and easy handling of
was. The information helps in planning to reduce waste as well as setting up recycling
programmes. According to UNEP (2007), the characterisation of industrial waste helps in
determining whether the waste is classified as hazardous or non-hazardous for disposal
purposes. The method depends on the analysis or interest, such as the potentiality of a toxic
metal, chloride and the matrix of waste (such as solid or sediments).
2.2.1 Benefits of waste characterisation
Waste characterisation has a number of benefits if it is carried out effectively. According to the
USEP (2010), solid waste characterisation leads to less environmental pollution and
conservation of natural resources since a great deal of materials will be recycled or re-used.
There is also better coordination between waste generators and waste managers, leading to
better performance by municipalities. Mader (2011:29) notes that there will be increased public
participation, leading to improved public health and high cost recovery.
2.2.2 Waste classification
Wastes are classified into groups that pose similar risks to the environment and human health,
and this can be used to facilitate their management and appropriate disposal. According to
Fuggle and Rabbie (2006:231), waste can be grouped into various classes including special
waste; waste with infection characteristics; and waste that can cause ill-health to humans and
animals due to their toxicity, corrosiveness, volatility, in flammability, explossivity or radio-

18
activity. Liquid waste includes process water, wash water, cooking water, storm water, spills
and sanitary waste. Hazardous wastes are all waste that contains asbestos and/or lead, which
poses a great danger to human beings and other animals. Restricted solid waste is general,
putrescible or non-putrescible Waste is classified on generation sites before disposal by using
colour-coded bins. Some wastes are also classified on disposal sites in terms of easy
measurement of variables like weight, moisture content and biodegradability
2.2.3 Waste profiles
According to UNEP (2010), a waste profile includes all the information about the waste from its
generation to its disposal. In Harare – like any other city in the world –waste differs in the way
that it is generated, transported, stored and disposed of. Generator and site information is used
to establish the generator of the waste, the physical address where the waste is being
generated and the activities that produce the waste. The material that makes up the bulk of the
waste also needs to be known, as this helps in categorising the waste. The categories of the
waste must be established in order to determine its biodegradability and toxicity, and the ease
with which it can be handled. For ease of measurement and to record variables to generate
primary data, the type of waste found on each dump site must be known. The transporters of
waste must also be known, together with the equipment that they use to handle waste so that
the safety of the workers and any persons who may have contact or are exposed to the waste
on transit can be guaranteed.
2.2.4 Waste management protocols
A number of protocols govern the generation, storage, transportation and disposal of waste in
Harare.EMA is responsible for all environmental concerns in Zimbabwe, including solid waste
management. The Environmental Management Act of 2002 seeks, among other concerns, to
enforce laws to protect the environment. The Environmental Management Efficient and Solid
Waste Disposal Regulation Statutory Instrument 6 of 2007 controls the management of solid
waste in Harare and other cities in Zimbabwe. Solid waste management in Harare is also guided

19
by international conventions and protocols which Zimbabwe has ratified (e.g. the Montreal
Protocol of 1987, which seek to protect the ozone layer from harmful substances, the Kyoto
Protocol that was signed in Japan in 1997, which seeks to reduce the emission of greenhouse
gases into the atmosphere which cause global warming. Zimbabwe is also a signatory to the
Rio-Declaration Agenda 21, which aims to curb unsustainable consumption patterns that cause
environmental degradation and poverty. According to the government of Zimbabwe (2002, the
Environmental Management Act also helps to guide the city of Harare on how to carry out
environmental impact assessments.
2.3 DYNAMICS OF WASTE GENERATION
According to Makarati and Chikobvu (2011) waste generation differs from place to place around
the world and is dependent on the economic activities of the country. Poor characterisation of
solid waste leads to poor disposal methods, which result in poor waste management. In Harare,
there is very little evidence of characterisation and segregation of waste – hence the
homogenous nature of all the waste found at non-formal disposal sites. Currently, the Harare
City Council’s solid waste management leaves a lot to be desired, especially since most
emerging economies are investing heavily in municipal solid waste management that is
generated from agricultural activities in and around the city and the city council has not been
able to manage the waste. The emergence of the informal business sector in the city due to the
economic meltdown from 2000 to 2008 has meant that too much solid waste is generated at
undesignated and unregistered premises, hence the irregular collection and management of
solid waste. According to UNEP (2010), the global amount of municipal solid waste was 202
billion tonnes in 2006, representing a 7% increase since 2003. According to Momoh and
Oladebeye (2010) in the same year, Africa produced about 172 million tonnes of solid waste,
the global municipal solid waste rose by 3.3% to about 8%.According to Practical Action
Zimbabwe (2010:13), Zimbabwe generates about 2.5 million tonnes of solid waste per year,
both domestic and industrial.
20
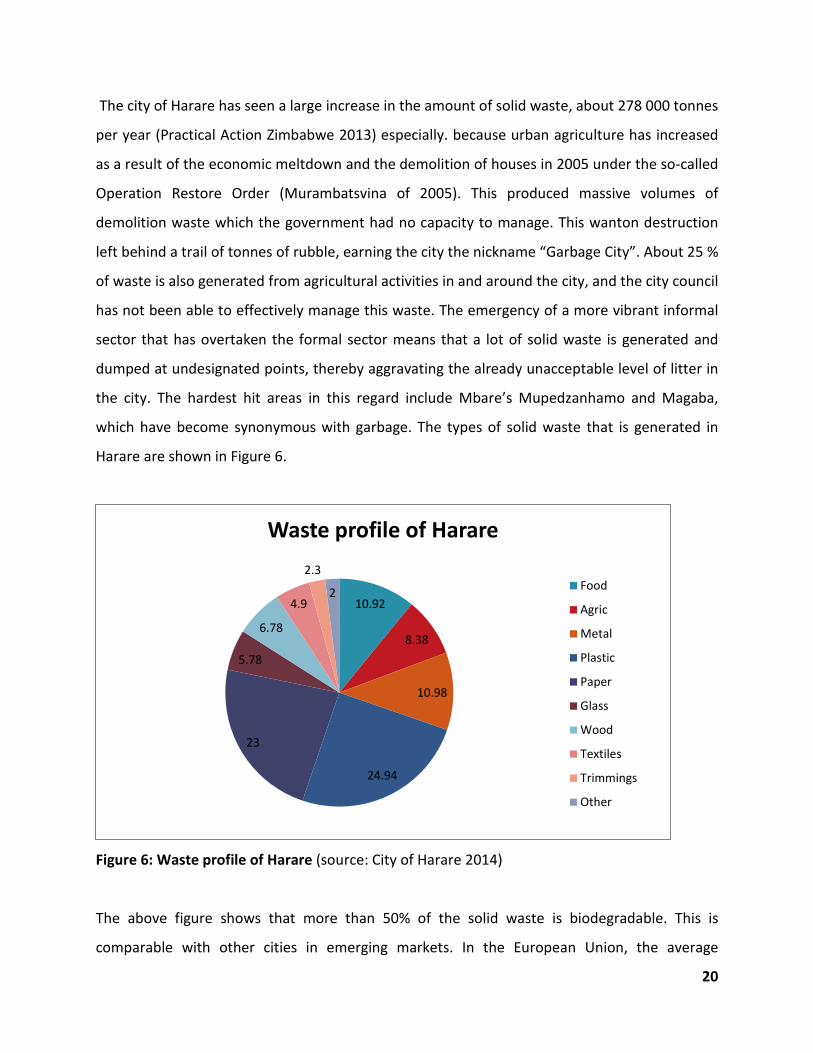
The city of Harare has seen a large increase in the amount of solid waste, about 278 000 tonnes
per year (Practical Action Zimbabwe 2013) especially. because urban agriculture has increased
as a result of the economic meltdown and the demolition of houses in 2005 under the so-called
Operation Restore Order (Murambatsvina of 2005). This produced massive volumes of
demolition waste which the government had no capacity to manage. This wanton destruction
left behind a trail of tonnes of rubble, earning the city the nickname “Garbage City”. About 25 %
of waste is also generated from agricultural activities in and around the city, and the city council
has not been able to effectively manage this waste. The emergency of a more vibrant informal
sector that has overtaken the formal sector means that a lot of solid waste is generated and
dumped at undesignated points, thereby aggravating the already unacceptable level of litter in
the city. The hardest hit areas in this regard include Mbare’s Mupedzanhamo and Magaba,
which have become synonymous with garbage. The types of solid waste that is generated in
Harare are shown in Figure 6.
Figure 6: Waste profile of Harare (source: City of Harare 2014)
The above figure shows that more than 50% of the solid waste is biodegradable. This is
comparable with other cities in emerging markets. In the European Union, the average
10.92
8.38
10.98
24.94
23
5.78
6.78
4.9
2.3
2
Waste profile of Harare
Food
Agric
Metal
Plastic
Paper
Glass
Wood
Textiles
Trimmings
Other

21
biodegradable waste generated by households was 40%, for Nairobi in Kenya it was 40% and
for Marondera in Zimbabwe it was 43%. Poor characterisation of solid waste leads to challenges
in disposal methods with adverse effects on waste management. In Harare, there seems to be
no evidence of segregation of the waste – hence the homogeneous nature of the waste found
on all the non-formal disposal sites. Currently, the Harare City Council’s solid waste
management leaves a lot to be desired, especially since most emerging economies are investing
heavily in municipal solid waste management.
2.4 NON-FORMAL SOLID WASTE DISPOSAL SITES
According to Jambwa (2011:33), illegal waste dumping is dropping or placing waste at areas
that are not designated for this purpose by the municipality. The waste is usually dropped off at
open spaces in residential areas, street corners, road junctions and even backyards. In Harare,
illegal dump sites can now be seen at bus ranks, notably in Mbare and Road Port. Some illegal
dump sites are at the back of buildings, in recreational parks and in thoroughfares. According to
Nyakudya and Stroosnijder (2011),the illegal dumping of waste is mainly caused by the sporadic
and (in some cases) non-collection of waste by the municipality, the inability of municipalities
to regularly collect waste from generation sources due to financial constraints and the absence
of clear legislation on waste disposal. If the fines for illegal dumping are not prohibitive enough
the problem may not be curbed. Irresponsible residents also contribute to the illegal dumping
of waste. Some residents lack both environmental education and environmental responsibility,
hence most think that the municipality is responsible for waste management in the city. Rapid
population growth in Harare also leads to the illegal dumping of waste, since the municipality
cannot cope with the influx of people. According to Mapira (2012:47),the illegal dumping of
waste in Harare is also caused by the increasing number of squatter settlements. These
settlements are not officially recognised by the municipality; hence the waste that they
generate is not managed by the municipality.

22
UNEP (2002) defines non-formal dump sites as undesignated areas where people drop off
waste; these sites are not officially recognised by the municipality, and they are rarely serviced
or not serviced at all. Dropping waste off at these sites is illegal, and so are the sites
themselves. According to Mapira (2012), informal dump sites have become a huge problem in
recent years as they now compete with human beings for land and financial resources. Unlike
formal dump sites, non-formal dump sites may exist for a longer time, thereby extending their
negative impact on the environment (like land, water and air pollution)and being breeding
places for vectors like mosquitoes, rodents and snails. These dump sites also increase the
scavenger populations, which also helps to spread diseases. In Harare, most non-formal dump
sites are found in the high-density residential areas predominantly inhabited by low-income
groups. According to Mapira (2012:50), the number of non-formal dump sites reflects mainland
use as well as types of food mainly consumed across the city. More agricultural-based waste is
found in high-density suburbs and informal settlements because these people cannot afford the
luxury of processed foods from shops. In the more affluent suburbs, there are fewer and
smaller informal dump sites and these are characterised mostly by hedge trimmings. According
to Makarati and Chikobvu (2011) the problem of these non-formal dump sites can be reduced
by rigorously implementing spot fines; placing billboards on dump sites with information
discouraging people from illegal dumping; increasing municipal police visibility; and reaching
out to people on the radios and television and in newspapers.
Table 1: Selected areas and number of waste dumps in Harare
(Source: City of Harare and Field work 2014)
AREA NUMBER
OF DUMPS
ESTIMATED
VOLUME IN KG
AREA NUMBER
OF DUMPS
ESTIMATED
VOLUME IN KG
Glen Norah 39 11 700 Eastlea 31 93 000
Hatfield 6 18 000 Cranborn 32 96 000
Greendale 7 21 000 Mabvuku 35 105 000
Highlands 4 12 000 Avondale 4 11800
Sunningdale 13 39 000 Highfield 156 310 000
Mt Pleasant 18 54 000 Mbare 281 104 300
Radcliffe 17 51 000 Borrowdale 2 6 000
23
Table 1 shows some selected suburbs in Harare with their number of non-formal dump sites
and estimated volumes of waste and loads required to remove the waste. The municipality can
also provide storage facilities for waste before transportation. Non-formal dump sites must be
identified and managed since ignoring them will only worsen the situation. From Table 1, there
are more non-formal dump sites in low-density residential areas (as is seen in areas like Glen
Norah, Mabvuku, Mbare, Highfield earlier shown in Figure 3 . This can be attributed to high
population sizes and informal activities (like backyard industries) that produce a lot of
waste.There are fewer illegal dump sites in low-density residential areas (as is seen in places
like Borrowdale, Mt Pleasant, Avondale, Highlands, Eastlea and Greendale) (Low density). Low
population densities in these areas and better environmental awareness are cited as the main
reasons for the fewer number of dump sites. Hatfield and Cranborne are some of the medium
residential areas in Harare and also have fewer dumpsites compared to high-density residential
areas.
2.5 SOLID WASTE MANAGEMENT
2.5.1 Introduction
This section is presented in terms of content using a funnel design from the general, to global,
to Africa and down to conditions in Zimbabwe The general approach covers the field of solid
waste management with respect of is conventional about waste generation, transportation,
treatment and final disposal. This then provides the background for looking at what research
has been carried out on solid waste management in different parts of the world.
2.5.2 Conventional solid waste management
Puorideme (2010) defines integrated solid waste management as a comprehensive model that
combines elements of waste prevention, recycling, composting and disposal with active
stakeholder participation which ensures efficient and sustainable waste management. The
natural objectives of integrated solid waste management are to deal with social acceptability,

24
environmental sustainability, economic affordability and management effectiveness. The model
advocates full stakeholder participation in all the environmental activities that take place in the
city. Environmental sustainability is at the core of integrated solid waste management, hence all
economic and human activities should be contracted in a way that always leads to
environmental sustainability. Effective management means waste should be properly managed
during generation, temporary storage and transportation, and should be disposed of in an
environmentally-friendly manner that does not pose any danger to human beings and animals.
Economic affordability entails that while municipalities strive to achieve a cleaner and safer
environment, the economic implications should not be ignored – which means that
municipalities should ensure that the management of solid waste is cheap and affordable
(Kemal 2007:24).
The major ways of managing solid waste are recycling, re-using, reducing, composting and
disposal, and are in interrelated. The benefits that accrue from an integrated management
system are immeasurable, ranging from energy recovery, money from selling waste, less health
hazards and improved resource conservation to improved public health. In as much as the
model tries to meet economic, environmental and managerial obligations, the social aspects
also have to be met. This means that it must be accepted by its constituency, which are the
stakeholders, and the ultimate goal should be to benefit residents. An integrated waste
management system also promotes energy recovery and greater coordination between the
stakeholders and processes. Health hazards are reduced, costs are cut and public participation
is enhanced, leading to collective responsibility. In an integrated management system, it is very
easy to identify areas of weakness and prompt action can be taken, and routine checks and
balances can be instituted, since all the stakeholders are aware of their mandate and do not
take offence when they are found wanting. Tevera (2013:8)posits that an integrated solid waste
management system is the way to go for all modern cities and municipalities, as it is the glue
that holds together the various components and ensures sustainability, accountability, financial
affordability and social acceptability.

25
Source reduction is aimed at reducing the quantities of waste at their generation/source.
According to Saungweme (2012:63), source reduction is best done through purchasing or using
material, for instance using products and packaging in lower quantities and with less toxicity.
Better waste segregation in households and communities reduces waste to the landfill. Local
authorities and communities should be encouraged to promote the use and return of re-usable
and retainable containers. Public awareness on the benefits of waste reduction is also very
important as it empowers the community on environmental, economic and social implications.
Thus, generators of waste must constantly be reminded of their environmental obligations.
All waste that can be recycled should by law or policy be recycled to reduce waste, costs and
environmental pollution. Materials like glass, paper, water, plastic and metals should be
recycled to ensure the sustainability of resources. According to UNEP (2000), the USA produced
about 231.9 million tonnes of solid waste and 69.9 tonnes were recycled. The concept of waste
recycling, especially domestic waste, has not received the attention it deserves (as is clear from
Table 6).
Table 2: Recycling in Europe
COUNTRY % MUNICIPAL WASTE
RECYCLED
COUNTRY %MUNICIPAL WASTE
RECYCLED
UK 40% Denmark 29%
Italy 35% Austria 50%
Spain 23% Germany 21%
Netherlands 43%
(Source: UNEP 2010:59)
The situation shown in Table 2 paints a very bleak picture considering that all the countries
belong to the developed world, but their level of commitment to recycling domestic solid waste
is far below expectations.
Composting is one of the oldest ways of solid waste management since the establishment of
relatively permanent settlements and the advent of crop farming. According to Kutiwa et al
26
(2010), composting is a method of solid waste management where the biodegradable
components of a waste stream are placed in prepared areas so that the waste decomposes and
valuable mineral elements are unlocked and returned to the soil to improve its fertility. It can
also be used for anaerobic breakdown to generate biogas as a way of energy recovery.
Composting is more effective when done with agricultural waste.
The concept of re-use means that materials should be used again and again for as long as they
can still serve the purpose for which they were made and do not pose a threat to human health
and the environment. Materials recovered from the waste stream can be used in their current
form, like bottles and plastic containers that are cleaned after use and then used again. Used
water can be used for cleaning cars, gardening and cooling machines in industries. This cuts
costs, saves time on manufacturing and reduces volumes of waste to landfills.
In small and isolated communities like farms and in hospital and schools, most of the waste that
is generated is destroyed in well-engineered incinerators. This method involves the combustion
of solid waste to reduce it to ashes, thereby significantly reducing the volume of the waste.
Incineration can also be used to recover energy. If the waste is from plant remains, the ashes
can be used as an alkaline fertilizer (Manyuchi and Phiri 2012). However, if incineration is done
on a large scale, it can cause air pollution.
Disposal refers to the process of taking waste to dump sites, incinerators and landfills. Sound,
healthy and sustainable environmental practices dictate that disposal should be carried out as a
last resort because it is the only method of solid waste management that has the greatest
environmental impact and therefore it should be avoided at all costs or be minimised as much
as possible. The volume of waste should be reduced as much as possible prior to disposal and
the residual should be disposed of in an environmentally sound manner, preferably at landfills.
Landfills are scientifically designed and engineered facilities where solid waste is disposed of,
compacted and managed. After all the other contemporary methods of solid waste

27
management have been applied and/or failed, the remaining waste must go to a landfill (
Manyuchi and Phiri 2012). The same authors observed that landfills must be located 60m from
lakes and streams, 1500 m from human settlements and 2 S000 m from airports. The waste
must be compacted on a daily basis and covered with a layer of soil to immobilise the waste
and reduce the activities of scavengers. Leachate must be monitor regularly to see if it will
affect ground water. Landfills are expensive to build and to operate. In most cases, landfills
have a lifespan of about 25 years, which – in terms of financial costs – is a relatively short
period of time. Even during closure, landfills still have to be financed. The heavy machinery
used in operating a landfill is very expensive to acquire and maintain. The diagram below
(Figure 10) shows Pomona Landfill in Harare, which is currently the only functional landfill in
Harare and the biggest landfill in the country. According to the Harare City Council’s
Department of Waste Management (2014), there are 200 registered people who collect waste
from the dumpsite to sell to recycling companies like Hunyani Pulp and Paper and individuals
for re-use. These people are registered for accountability by the city council because the landfill
is a protected area and access to it by persons other than municipal workers has to be
sanctioned by the city council’s Department of Waste Management.
Figure 7shows how an integrated solid waste model works and the benefits that accrue from it
if it is properly implemented. From the model environmental management can be enhanced
through an integrated system with a wide view that is aimed at sustainability. Modern solid
waste management can be addressed effectively if there is greater integration of the core
components of the environmental management cogs, which are social acceptability,
environmental sustainability, economic affordability and management effectiveness. It is shown
from this diagram that integrated environmental management is the only option for countries
to effectively deal with the issue of solid waste management. It promotes public participation,
good environmental sustainability, cost effectiveness, better human health and a greater desire
for natural resource conservation. Accountability on the side of the generators of waste leads
to better co-ordination and performance improvement.

28
Figure 7: Integrated solid waste management model
(Source: Adapted from Puopiel 2010)
Solid waste impacts heavily on the environment and the effects can be very adverse if the
waste is not managed properly Mapira (2012:37). The effects can range from short term to long
term, with varying degrees of impact on the environment. The short-term environmental
effects to the immediate environment include odours; outbreaks of disease like cholera; air
water and land pollution; blocked sewer pipes; and distortion of the aesthetic appeal of the
environment. Some waste, like broken bottles, can injure people and animals. According to
Waugh (2006:241), the long-term environmental effects on the environment last much longer,
cause considerable damage and threaten species with extinction. These include climate change
due to the emission of greenhouse gases into the atmosphere, threats to biodiversity,
desertification and siltation of water bodies around the city. In order for the city of Harare to
SUSTAINABILITY ASPECTS
1. Reduce the amount of solid waste generated
2. Recycle as much material as possible
3Make compost of biodegradable waste that can be reused in gardens
4. Incineration/Landfill of remaining portion of waste stream.
Stakeholder participation
Benefits
• Lower costs • Better cost
management & cost recovery
• Few health hazards
• Less environmental pollution
• Conservation of natural resources
• Better coordination and performance
Social acceptability, environmental sustainability, economic affordability& management effectiveness
29
achieve sustainable waste management, there should be rigorous environmental education on
the need for the proper disposal of domestic waste.
The municipality must provide adequate handling and disposal facilities. Investors must be
encouraged to set up recycling industries to deal with the problem of non-biodegradable
materials. Residents must be mobilised to join clean-up campaigns/weeks. Waste production
can also be reduced by using strong bags and baskets instead of plastics bags and using both
sides of the paper when typing. Materials can be re-used (e.g. glass and plastic bottles with
deposits can be returned to shops for re-use) and waste can be recycled (e.g. plastic, rubber,
paper and water).
Solid waste management is undertaken to reduce the effect of waste on health and the
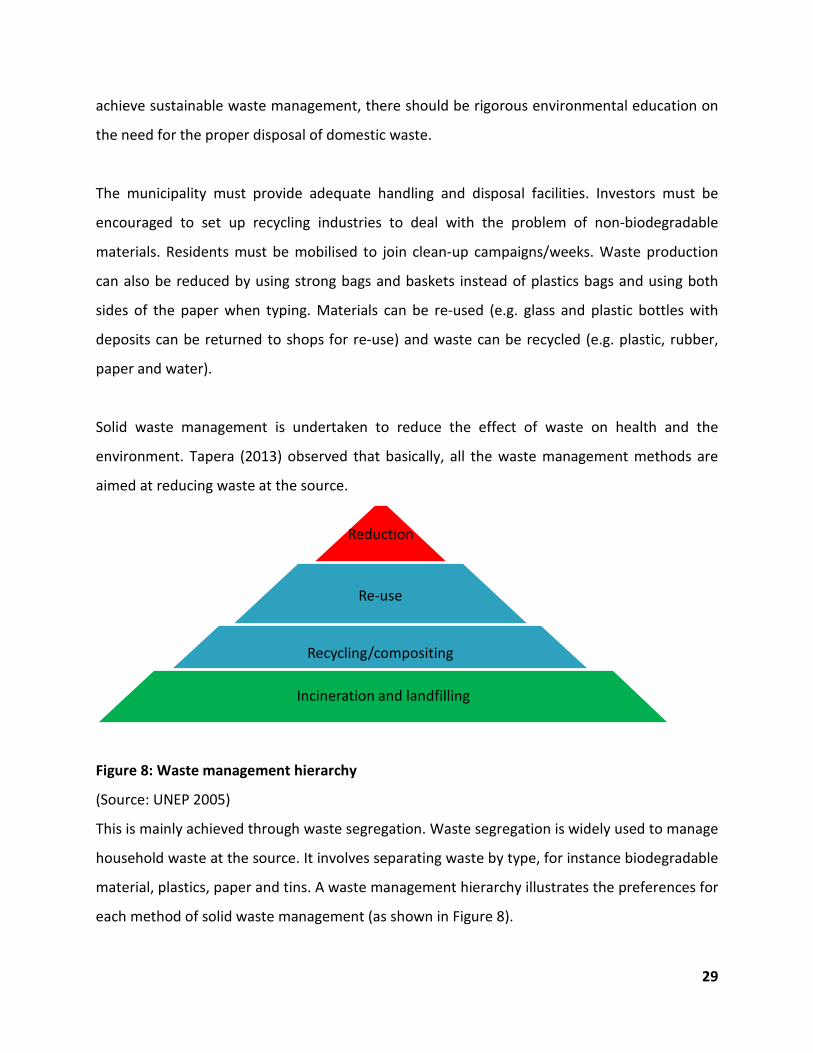
environment. Tapera (2013) observed that basically, all the waste management methods are
aimed at reducing waste at the source.
Figure 8: Waste management hierarchy
(Source: UNEP 2005)
This is mainly achieved through waste segregation. Waste segregation is widely used to manage
household waste at the source. It involves separating waste by type, for instance biodegradable
material, plastics, paper and tins. A waste management hierarchy illustrates the preferences for
each method of solid waste management (as shown in Figure 8).
Reduction
reduction Re-use
Recycling/compositing
Incineration and landfilling

30
The waste management hierarchy places great emphasis on waste reduction and encourages
recycling where reduction has failed. According to UNEP (2005),the waste management
hierarchy model encourages the prevention of waste or reduces the amount of waste
generated, and reduces toxicity or the negative impacts of waste. According to Saungweme
(2012:81), solid waste management has social, environmental and economic benefits, accruing
from team work, protection of the environment and saving money by recycling and re-use of
solid waste.
Table 3: Waste collection recommendations
GEOGRAPHICAL LOCATION FREQUENCY OF WASTE COLLECTION
Tropics Daily
Temperate Every two days in summer; every three days in winter
Cool climates Twice a week in summer; once a week in winter
(Source: UNEP 2006:37) According to UNEP (1996), of necessity, the frequency of waste collection depends on the
geological location of the place and the tropical areas are obliged to be more regular in their
waste collection given their high temperatures which promote high microbial activity. Medical
waste should be collected daily. The situation is best illustrated in Table 3.
2.5.3 The Global Context
In many parts of the world, solid waste management has become a dominant urban
environmental issue that continues to attract growing audience that ranges from academics,
politicians, economists, the media and civic organisations. In recent years, it has undoubtedly
become a big employer and a pursuable discipline of study. In general, West European cities are
more advanced than African cities when it comes to solid waste management and can only be
compared with cities in the United States of America. According to Halfman (2010), most
European companies now focus on avoiding and recovering waste, and view disposal as a last
resort when the waste cannot be turned into anything of value. Waste management is also
viewed as an industry that generates employment, skills and revenue for municipalities.
According to the central intelligence (2010:10), the generators of waste should be responsible
for educating consumers about their products and the best way of disposing of the eventual

31
waste. Consumer information on products is mandatory. According to Seng and Seng (2010),
some municipalities in Germany are encouraging turning landfills into recreational parks as a
way of reclaiming land.
While the situation of solid waste management in Harare is worrisome, studies carried out in
other parts of Africa, Western Europe, the USA and Asia show that the issue of solid waste
management is a global problem and that even the developed countries have sad stories to tell.
In the USA, Table 4, solid waste disposal is also a problem. According to Cherubini (2010),
American citizens produce about 2kg of waste per person per day. Space for waste is also a big
problem. According to the US EPA (2010), municipal waste disposal costs the country billions of
dollars per year. The most common waste streams in the USA are shown in the Table 4.
Table 4: Municipal waste streams in the United States
WASTE STREAM PERCENTAGE (%) WASTE STREAM PERCENTAGE (%)
Food 12.5 Textiles 7.6
Yard 12.8 Wood 5.6
Paper 37.7 Glass 5.3
Plastic 12.1 Other 3.2
Metals 8.2
Others 3.2
Total 100.0
(Source: US EPA 2010)
The USA has a higher food waste percentage (12.5 %) compared to most developing countries
(8% on average).However, in terms of performance, their systems of solid waste management
are very functional and efficient. The main methods of solid waste management disposal in the
US include composting, incineration, ocean dumping and recycling. According to Halfman
(2010), recycling municipal solid waste in the US only accounts for 40%. This author notes an
intensification of source reduction techniques in the country.

32
In China, municipal solid waste disposal is also a major concern. According to Chung (2010),
about 500 million people in China live in urban areas. Most of the solid waste that is generated
in the cities is managed by landfills (89.3%) incineration (3.72%) and composting (6.98%).
According to Geng, Zhu, Doberstein and Fujita (2009), China has 651 solid waste disposal
facilities, which include 528 landfills, 78 composting sites and 45 incineration plants; recycling is
currently at 44%, which is quite commendable by world standards. In Italy, land fillings are the
most common waste management practice. According to Cherubini (2010), waste is used to
generate about 15% of the electricity in Italy (especially in Rome, where more than 15% of the
municipal electricity is generated from waste). This is a plausible energy recovery way that
reduces waste and protects the environment.
2.5.4 Conditions in Africa
Awoso and Tariwo(2010) note that solid waste management problems (particularly in African
cities) are exacerbated by the low levels of environmental literacy and the type of food, which
in many cases is unrefined and produces a lot of waste during preparation. They also note that
most of the industries are mainly agricultural based and extractive, which means that they
produce a lot of waste compared to cities in the developed world where the service industry is
high and produces less waste. Ruhiiga(2013) reports that most African cities experience
problems with solid waste management because countries are rapidly and massively urbanising
while there are no clear budgets for municipalities. He also says that land acquisition is difficult
and therefore informal settlements mushroom. He notes that most cities in Africa do snot
generate enough money to service their clients. This leads to poor solid waste management.
According to Burnley (2007), most African cities fail to manage e-waste because it is a relatively
new product and disposal methods for it have not been developed.

33
In the East African Community (EAC)- made up of Kenya, Tanzania, Uganda, Rwanda and
Burundi- the management of solid waste is reportedly a major problem. The wastes generated
by the EACs, according to Okot-Okumu and Nyenje(2011), is decomposable matter but e-waste
is becoming significant due to the increasing levels of technology. The majority of
municipalities therefore need to be educated on how to manage e-waste. Old computers can
be broken down for parts to reduce waste since most of the hardware can be re-used. These
include keyboards, the outer cover and even the mouse. Kenya is leading other East African
countries in as far as e-waste management is concerned (UNEP 2009).
Table 5: Comparison of waste compositions in East African cities
WASTE
COMPOSITION (%)
DAR-ES-
SALAAM
MOSHI JINJA KAMPALA LIRA NAIROBI
Bio-waste 71.0 65.0 78.6 77.2 68.7 65.0
Paper 9.0 9.0 8.0 8.3 5.5 6.0
Plastic 9.0 9.0 7.9 9.5 6.8 12.0
Glass 4.0 3.0 0.7 1.3 1.9 2.0
Metal 3.0 2.0 0.5 0.3 2.2 1.0
Others 4.0 12.0 4.3 3.4 14.9 14.0
Total 100.0 100.0 100.0 100.0 100.0 100.0
(Source: UNEP 2011:71)
Table 6: Comparison of solid waste management in selected cities
city Collection of waste by local authority
Dares Salaam
(Tanzania)
More than 63% of solid waste remains uncollected in residential areas.
Kinshasa(Democratic
Republic of Congo)
Collection of household waste is undertaken only in residential areas. In
the rest of the city, waste is put on the roadside, at illegal dump sites, in
open spaces or in storm water drains.
Karachi(Pakistan) Only 40% of solid waste produced by households is collected.
South Africa Nearly 42% of all waste is recycled.
(Source: UNEP 2011)

34
UNEP (2011) provides comparative statistics for several cities in East Africa ib Table 5. Overall,
the waste generation rates for urban cities in EACs vary on average from 0.26(low income) to
0.78(high income) kg per capita per day (UNEP 2009).The lack of integrated solid waste
management in most EACs means that the collection of solid waste is sporadic and poorly
monitored. In Table 6, conditions across two cities and two countries are presented. According
to Ruhiiga (2013), in cities like Kampala in Uganda and Nairobi in Kenya, the encroachment of
urban agriculture has impacted on urban boundaries – which means that too much waste is
left close to cities or actually gets into cities. The availability of rail and road infrastructure has
also increased accessibility to urban cities by many volumes of people; hence more waste is
produced which the cities (with their meagre budgets) cannot manage properly.
In Southern Africa, most countries will have to contend with the problem for a little longer.
According to Bere (2011:11), municipalities in Southern African cities (cities in South Africa
excluded) are failing to come up with efficient waste management operations that are
sustainable. They continue to base their models and resources on a “collect, transport and
throw away” approach. This model of solid waste management has proven to be faulty since it
is ineffective, inefficient and unsustainable. Table 2 illustrates the different percentages of
waste management for selected cities. According to government of South Africa solid waste
management can be defined as a holistic approach including all the activities involved in the
handling of waste – from generation, storage, transportation and disposal – in an
environmentally-friendly manner. According to Burnely (2010), solid waste management is
aimed at maximising energy and material recovery, while minimising the amount of waste
delivered to the dump site/landfill, the pollution related to waste and the treatment collection
steps.
Compared to the rest of Africa, South Africa has done fairly well in solid waste management.
The country has laid down laws on managing solid waste. The National Environmental
Management Act 107 of 1998 sets out laws and policies on environmental issues. According to
this Act, there should be an emphasis on waste avoidance, reduction, re-use, recycling,
35
recovery and treatment, with safe disposal as a last resort. According to Matate and Trois
(2010), South African cities are moving towards zero waste. They now peg recycling of waste at
more than 45%. In major cities like Johannesburg, skip bins are available in most areas; solid
waste in residential areas are collected once a week in Ekurhuleni Municipality; and there are
marked collecting facilities in central Johannesburg for plastics, glass, paper and food waste.
Though Johannesburg has made great strides in solid waste management littering and pollution
still remain big challenges. According to the National Waste Management Strategy of 2011,
South Africa will achieve 95% waste collection in urban areas and over 80% of the disposal sites
will be licensed by 2015.As a fast-growing country, South Africa produces a lot of waste.
Mudau, Ruhiiga and Malan (2013), report that South Africa is doing fairly well when it comes to
solid waste management, although there are challenges of compliance and environmental
literacy.
2.5.5 Waste Management in Zimbabwe
According to Mangizvo(2010:15), an integrated system helps to promote a cleaner and safer
neighbourhood, high efficiency and improved resource augmentation. It saves costs due to the
reduced levels of final waste for use. There are also better business opportunities and economic
growth, and increased local ownership and participation. It can be seen from the that solid
waste management is still a serious problem in developing countries due to the fast rate of
urbanisation. Harare is hardest hit by this problem. While Harare’s solid waste problems seem
to be quite insurmountable, some researchers still believe that the situation can be improved
with proper planning. According to Makura(2013:18), the municipality of Harare needs proper
policing and adequate financial support from all stakeholders in order to improve its waste
management system. This author also notes the general unwillingness among residents to
participate in waste management issues because most of them are preoccupied with bread and
butter issues because of the increased poverty in the country.

36
The city of Harare is a typical example of a failed city when it comes to waste management. The
number of non-formal solid waste dumps has increased to unbearable proportions, as can be
seen at bus ranks in Mbare, in Fourth Street, in Rezende Street, at the Charge Office and at
Market Square. According to Madebwe and Mudebwe (2010:15), most emerging economies
still find it difficult to manage solid waste due to the lack of technical expertise, inadequate
funding, and clear government and municipal policies on solid waste management. According
to Bere (2013:11, the real problem with solid waste management in Zimbabwe is neither
financial nor technical, but strategic and management in nature. This means that lasting
solutions can only come from an integrated approach, where the municipality must move away
from the current unsustainable “collect, transport and throw away” approach to an integrated
solid waste management approach. An integrated solid waste management is currently viewed
as the only system that covers the whole spectrum of solid waste management as it covers its
generation, storage, treatment, recovery and disposal with an emphasis on maximising the use
of resources efficiency. Therefore, contrary to the common belief that most of the problems
associated with solid waste disposal in Zimbabwe are a result of the lack of financial, technical
and political will, Bere (2013) maintains that the city of Harare must develop strategies that are
coherent enough for it to successfully implement a sustainable, integrated solid waste
management system.
Mapira(2012) observed that in recent years, in Harare, solid waste management remains the
responsibility of the city council and the subject of integrated solid waste management in
Zimbabwe is still largely the domain of environmental academics who are mostly outside
central and local government, with their theoretical knowledge locked away in their offices and
computer software. According to Mangizvo (2010), municipalities in Zimbabwe still view solid
waste disposal as a task to be performed or an event to be managed but not as a continuous
process. He encourages city councils to come up with routine and continuous cycles to check
the efficiencies and effectiveness of their systems. It has also been noted that Zimbabwe
municipal by-laws for environmental offences, particularly littering, are not prohibitive.
UNEP(2011) states that strategy is weak, particularly in developing countries where the laws

37
are less strictly and less harshly enforced. There is also a lack of documentation on solid waste
quantities, as there are no weighbridge facilities at disposal sites to accurately weigh and
document the amounts of solid waste disposed. According to Okot-Okumu (2012), many cities
do not have the results of solid waste processing per day and there is no characterisation;
instead, all types of waste are mixed and thrown into a community bin and the quantities are
determined by the number of truck loads per day. According to Muchadehama(2012:27), the
city of Harare has to improve local governance if it is serious about sustainable solid waste
management. This author notes that rampant corruption and lack of accountability are some of
the factors that have contributed to the collapse of the solid waste management system in
Zimbabwe and particularly in Harare. It has also been observed that the current political system
in Zimbabwe affects the proper functioning of municipalities.
Magadu(2013) observes that unregulated vending points along the streets of Harare as also
responsible for the increasing number of non-formal solid waste disposal sites in the city. The
vendors– selling vegetables, fruits, food and drinks – do not have bins to service their
customers. He notes that the few public toilets cannot cope with the ever-increasing population
and this leads to people relieving themselves on the pavements and at the back of buildings.
The few efficient and clean toilets in the city are beyond the reach of many as they charge
50cents, which is equivalent to R5.For many Zimbabweans, this is very prohibitive compared to
the charge in other cities in the region. For example, in Johannesburg, most municipal toilet
facilities charge R1 and in Gaborone the charge is P1.
It has been observed in history and human sociology that unemployment and poverty change
people’s bodies and minds; hence, it can be said that the problem of illegally dumping solid
waste and littering in Harare is are a reflection of the changed mindset of the general populace
who are overwhelmed by economic hardship and have forgotten the culture of cleanliness as
they are perennially busy with issues of survival. Makarati and Chikobvu (2011:63) note that the
political system in the country interferes with donor and lobby groups who want to help with
both financial and technical support to help the council to deal with solid waste management.

38
The government views these donors and lobby groups as agents of regime change bend on
destabilising the country and exposing the government’s failures. The populist philosophy of
most African governments is also blamed for the problem of illegal dumping because
governments do not want to reprimand residents for fear of losing votes in elections, hence the
mushrooming of illegal vending stalls and parking lots for commuter buses. The government is
aware of the fact that they cannot create employment, so they sometimes allow people to
vend in undesignated areas. In Harare, the problem of illegal dumping is also a result of
ineffective managerial capabilities of the Department of Waste Management because as one
walks around, there is evidence of gross negligence of basic waste management practices like
street sweeping and cleaning public toilets (both of which do not require much finance and
thinking). Some residents who were interviewed during the fieldwork accused the city council
of corrupt tendencies, where municipal police officers take bribes from vendors on a daily basis
so that they can continue to conduct their businesses in undesignated areas. The overcrowding
of bus termini (like in Mbare, at Market Square and in Fourth Street) adds to the problem.
These facilities have not been expanded in many years to accommodate the ever-increasing
number of taxis that join the existing traffic everyday. The high rate of unemployment, which is
estimated at 80%, has also meant that a lot of the most able-bodied residents have joined the
ranks of the vendors – resulting in more waste being generated. According to the Zimbabwe
Central Statistical Office (2013), the level of unemployment in the country (and in Harare in
particular) is a major driver of waste generation since most of the residents are now engaged in
activities that generate a lot of waste (like selling scrap metal, backyard carpentry, selling
vegetables and green mealies, shoe repair and flea markets).
According to Mapira (2012:12), solid waste disposal should be viewed in the social context
where all citizens are socialised from an early age about the importance of good solid waste
disposal. This will help them to become responsible citizens when they are adults. From this,
the city of Harare has a lot of challenges when it comes to solid waste disposal. This is also clear
from the solid waste littered and heaped around the city. There are many non-formal solid

39
waste disposal sites in the CBD. This poses a danger to the people and is a public nuisance. The
situation is both filthy and unsightly.
Waste management, including refuse collection, in Zimbabwe is governed by environmental
laws and council and municipal by-laws. The following are some of the laws that govern solid
waste generation and management in Zimbabwe. The Environmental Impact Assessment Policy
of 1994is aimed at monitoring and assessing the impacts of all human activities on the
environment. It ensures that activities and projects in the country conform to environmental
standards. Activities have to be environmentally audited before the commencement of the
activity (pre-auditing), on site while the project is going on and after the completion of the
project. The National Sustainable Development Strategy of 2004 dictates that all developments
should be carried out in a manner that is sustainable and never compromises the environment.
It strives to ensure that while current human endeavours seek to satisfy the needs of the
present generation, they should not compromise or rob future generations of a livelihood. The
Draft Waste Management Strategy of 2006governs the management of waste in Zimbabwe
while the Science and Technology Policy of 2002 mandates that all scientific research and new
technology must enhance and promote environmental sustainability. The Draft National
Environmental Policy of 2003 was crafted to ensure that the environment is protected; it makes
it criminal for anyone to act in any manner that will endanger the environment.
In Harare, only the city council and/or its contractors have the responsibility of removing
domestic waste from premises (according to a City of Harare by-law of 1979). In principle,
domestic waste has to be collected at least once a week, but currently heaps of wastes left for
more than five months without being collected and the situation is even worse at non-formal
dump sites. Access to waste is restricted once the waste is deposited at disposal sites (City of
Harare 1981)The EMA is an arm of government tasked with ensuring that environmental laws
are understood, observed and applied. Its powers override those of municipalities, though in a
complementary manner. Currently EMA fines for companies and municipalities that do not
comply with environmental laws from US$1500 to US$5000 (as gazetted).

40
Although the law does not give people access to dump sites, economic hardships force many
people to scavenge on them in an effort to put their hands on anything sellable. From the
evidence from both formal and non-formal dump sites, it can be seen that that very little
recycling is taking place. Because of the city of Harare’s failure to collect waste on time, most
residents have resorted to other alternatives of storing waste while others hopelessly wait for
the perennially incompetent council to collect the waste. People have resorted to burning,
burying, dumping and composting waste to get rid of it – often with dire consequences. The
alternative mechanisms/methods are shown in Figure9.
Figure 9: Waste disposal methods in Harare
(Source: City of Harare 2014)
It can be seen from Figure 9that illegal dumping of waste has become so fashionable that
people no longer feel bad about dropping waste anyhow which was a taboo not so long ago.
At household level, waste is stored in a variety of receptacles before it is disposed of. These
include metal bins supplied by the city council and plastic bags that the residents buy. Some
households do not even store the waste in receptacles but put it in the alleys behind their
0% 10% 20% 30% 40% 50%
Burning
Burying
Illegal dumping
Compositing
Percentage of waste
Was
te d
ispo
sal m
etho
ds

41
houses. Figure 9shows that at almost 50% of Harare residents illegally dump their waste. Most
residents do not use conventional methods of managing waste, as is seen by the 25% who burn
solid waste and 15% who bury waste. While composting is encouraged since it helps in
decomposing waste for organic fertilizers that are used in gardens, one can notice that it is not
widely practiced (as shown by the 10%). These measures are taken by residents as they try to
deal with waste that the municipality is failing to handle. Burning and burying waste are mainly
done as a way to deal with waste, but there are far-reaching consequences (like odours,
breeding ground for pathogens and vectors, and rodents) and they make the vicinity ugly and
unsightly. The situation speaks volumes about the extent to which the city of Harare has failed
to deal with the problem of solid waste.
Figure 10: Waste storage facilities
(source: Fieldwork 2014)
Figure 10 shows that the bulk (48%) of solid waste in Harare is temporarily stored in plastic bags
at the generation source before it is transferred to dump sites. The inadequate waste storage
facilities at household level (as indicated by the 8%) is a great cause for concern since this
forces residents to store and dispose of waste in both unhygienic and unsustainable means.
While the situation in Harare can be described as dire, all hope is not yet lost because some
researchers still feel that their ideas can be used to help contain the situation while long-term

42
solutions are pursued. According to Beres (2012), the city of Harare should start educating its
residents about good solid waste management practices. It is felt that the newly introduced
colour-coded bins –see Figure 11-should be locally manufactured to reduce costs and it has
been observed that they are only used in the CBD. The city of Harare is encouraged to increase
the number of these bins and spread them evenly across the city as this will go a long way in
disseminating the information about separating and recycling waste. The fact that the bins are
coloured means that they have a natural appeal and are conspicuous enough to attract the
public and entice them into depositing waste in these bins. Public places like shopping malls,
bus termini and market places are the most ideal for a start.
Figure 11:Colour-coded bins in Harare
(source: City of Harare 2013)
From 2012, the city of Harare has experienced visible developments and actions in solid waste
management. Colour-coded bins have been introduced as a way of emphasising the need for
solid waste characterisation and recycling. These colour-coded bins can now be seen around
the streets, parks and shopping malls in the CBD, but they are still few and the city council

43
should increase and distribute them evenly across the city if there is to be any meaningful
change in the littering levels in the CBD and the rest of the city.
2.6 SUMMARY
The characterisation and management of non-formal solid waste disposal sites remain a
challenge in most developing cities and Harare is no exception. In the literature review, it was
noted that uncontrolled rural–urban migration, political interference with council business,
corruption and technical incompetence are the main causes of poor solid waste management in
Harare. Possible solutions to the challenges have been suggested. Contemporary solid waste
management strategies have been described with a view to encouraging sustainable solid
waste management methods.

44
CHAPTER 3: RESEARCH DESIGN AND METHODOLOGY
3.1 INTRODUCTION
In this chapter the research design and methodology of the study are discussed. Elements such
as the following are covered: an overview of methodological approaches, sampling, and data
collection instruments and procedures. Issues of validity, reliability and trustworthiness that are
relevant to the study are highlighted.
3.2 RESEARCH DESIGN
The research design for the study was quantitative, non-experimental, descriptive and
predominantly based on parametric data sets obtained through observation, interviews and
existing official statistics of the city of Harare. The research work involved a random selection of
study sites corresponding to different land-use types. Primary data sources were generated on
the basis of the physical measurement of attributes of non-formal waste dumps and site
observations to generate classes of solid waste. A structured interview was then used to solicit
information on waste management practices from officials of the City Council of Harare
responsible for waste management. The survey design was justified because the objects of
investigation, non-formal waste dumps were studied in their natural state without
manipulation of the variables. The variables of interest were measured on ratio and interval
scales, rendering data sets suitable for quantitative analysis. According to Chikoko and Moyo
(2003:27), this design allows for flexibility during the collection of data. The design also allows
for the collection of data on the basis of which questions on the who, what, where, when and
how phenomena can be addressed. Correlation was used at stage two of the analysis, following
the computation of descriptive statistics based on both primary and secondary data sets. The
techniques of multiple correlation and regression as well as chi-square formed the basis of for
testing statistical relationships. This design was further justified because it allowed for a
multiplicity of measurable variables, which in turn allowed for the analysis of internal

45
relationships between the cluster of independent variables at one level and between the
explanatory and dependent variables at another level. The use of statistical analysis made it
possible to test hypotheses and draw conclusions.
On the whole, the design incorporated the use of a hybrid of primary and relevant secondary
data that was numerical and textual. The researcher had a relative degree of control over the
information that was collected and methods of collection. Primary data sources included results
of survey measurements on non-formal waste dumps and responses of interviews with eight
officials of the City Council of Harare.
3.3 DATA SOURCES
As indicated above, the primary data sources included results of survey measurements on non-
formal waste dumps and responses of interviews with officials of the City Council of Harare.
Secondary data sources consisted of sets of data on waste from the city of Harare covering the
period from 1990 to 2014 that were extracted from the annual reports of the City Council of
Harare (budget and waste performance).
3.4 POPULATION
According to Mouton (2001:81), a population can be defined as the total number of elements
or cases that one can investigate. Bryman (2007) describes a population as the universe of units
from where a sample is drawn in an attempt to statistically represent a population. It is not
possible to investigate every member of a given population due to time constrains. According
to the Harare City Council’s Department of Waste Management (2014) there are approximately
789 non-formal dump sites across the city. In this research, a ground census was carried out
after selecting three specific districts for inclusion in the study. The areas that were represented
were high-density residential area, a medium-density residential area and low-density
residential area.
46
3.5 DESIGN OF RESEARCH INSTRUMENTS
The researcher designed the research instruments. The interview was mainly structured and a
few parts were semi-structured to suit different respondents. The observation schedule was
designed to capture data on dump sites according to classes of waste, the physical properties of
waste, locational attributes and the main land-uses that generated the waste.
3.6 DATA MANAGEMENT AND PRESENTATION
For each of the objectives specified earlier, the sources of data are indicated and the method of
collection, method of analysis, specification of analytical techniques and their justification are
provided. The results of each objective are initially represented graphically by using Excel
spreadsheet software (Gwimbi & Dirwai 2003:84). The individual graphs are at the level of
frequency distributions, following the screening of data sets and removal of outliers.
Hypothesis tests were performed to check the accuracy of the hypotheses. The actual data
analysis was presented using the SAS JMP (Microsoft 2012).
The objectives were matched with a relevant statistical technique and reasons for the choice
are advanced as follows:
• Objective 1.Measure the locational attributes of non-formal solid waste dumps (size of
dumps, type of waste, generation sources, quantities of waste and size of land covered
by waste); statistical technique – descriptive statistics.
• Objective 2.Analyse internal linkages between locational attributes of waste; statistical
technique – correlation, SAS JMP. This was chosen because it describes the relationships
between known variables of solid waste.
47
• Objective 3. Classify waste by type in the study area. No statistical technique was used;
instead, the classification was based solely on direct visual observation at the dump
sites.
• Objective 4.Analyse the variations in the profile of waste in the study area; used
descriptive statistics based on observations.
• Objective 5.Describe current waste management approaches; used descriptive statistics:
correlation. This was chosen because it describes relationships between solid waste and
their variations.
• Objective 6. Generate advice on sustainable waste management approaches; used an
efficiency index. This enabled the researcher to measure the performance standards of
the existing strategies and then compare them with the suggested strategies.
3.7 CHOICE OF INSTRUMENTS
Only interviews and observations were used to gather primary data. The researcher chose
these instruments over others because they were more appropriate for the study and easy to
administer. Since the research dealt with physical and locational attributes and types of solid
waste, the observation method was found to be very fitting. The structured interview was also
chosen because it enabled the researcher to get primary data from city council officials and
because of the adaptability of interviews.
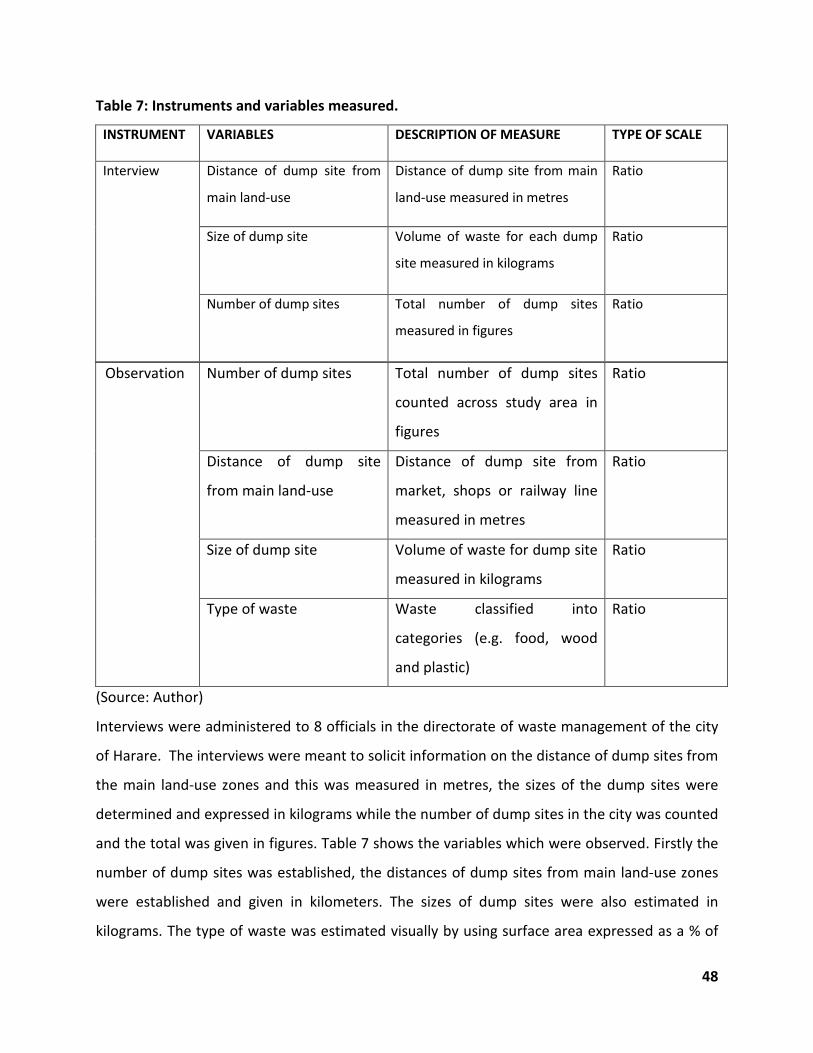
48
Table 7: Instruments and variables measured.
INSTRUMENT VARIABLES DESCRIPTION OF MEASURE TYPE OF SCALE
Interview
Distance of dump site from
main land-use
Distance of dump site from main
land-use measured in metres
Ratio
Size of dump site Volume of waste for each dump
site measured in kilograms
Ratio
Number of dump sites Total number of dump sites
measured in figures
Ratio
Observation
Number of dump sites Total number of dump sites
counted across study area in
figures
Ratio
Distance of dump site
from main land-use
Distance of dump site from
market, shops or railway line
measured in metres
Ratio
Size of dump site Volume of waste for dump site
measured in kilograms
Ratio
Type of waste Waste classified into
categories (e.g. food, wood
and plastic)
Ratio
(Source: Author)
Interviews were administered to 8 officials in the directorate of waste management of the city
of Harare. The interviews were meant to solicit information on the distance of dump sites from
the main land-use zones and this was measured in metres, the sizes of the dump sites were
determined and expressed in kilograms while the number of dump sites in the city was counted
and the total was given in figures. Table 7 shows the variables which were observed. Firstly the
number of dump sites was established, the distances of dump sites from main land-use zones
were established and given in kilometers. The sizes of dump sites were also estimated in
kilograms. The type of waste was estimated visually by using surface area expressed as a % of
49
the entire area covered by the site and then translated into kilogram equivalents. The inherent
limitations in this technique are acknowledged but it was not possible to physically sort waste
at each of the fifty sites.
3.8 PILOT STUDY
A pilot Study was conducted on five non-formal solid waste disposal sites in the study area in
order to test the validity and reliability of the research instruments. From the feedback, the
researcher was able to establish the correctness of individual questions in the interviews and
individual items in the observation schedules were found suitable for generating responses in
agreement with specific variables. Both the questions and the instructions on the interview grid
were pre-tested for errors and clarity. Reliability was tested by assessing the level of precession
achieved in the design measures for capturing data. According to Kitchin and Tate (2000), the
instruments should be revised to eliminate ambiguities and clarify some questions. On the
whole, the pilot study was done to check the viability of the research instruments.
3.9: DATA COLLECTION
The data was collected through observations and interviews.
3.9.1 Observations
Before the actual data collection procedures were carried out, a pilot study was conducted to
check the accuracy of the research instruments and refine questions that were thought to be
unclear or ambiguous. The primary data was gathered through observations, which were
carried out to establish the sizes, number and distribution of non-formal dump sites in the
Harare. Records were kept on the amount of land covered by these dump sites and the types of
waste on these dumps were classified. the impact of the waste on the immediate environment
was investigated. According Makarati and Chikobvu (2011:12), observations have the
advantage of giving the researcher the opportunity to interact with the subjects of the
investigation and all field measurements are done on the spot.
3.9.2 Interviews
The interviews were carried out to collect information on issues that could not be observed in
the field. Waste management officials were interviewed to get information about the calibre of

50
personnel in the Department of Waste Management, the budget allocated for waste
management, the number of solid waste collection vehicles, future plans and targets. According
to Chifamba (2010:37), interviews are very effective as a method of gathering data because
they are flexible and adaptable. Managers from the Department of Waste Management, the
city’s Health Department and ordinary residents were interviewed during face-to-face
interviews where the researcher had the luxury to modifying various lines of inquiry. Non-
verbal responses during the interview enhanced a greater understanding of and helped in
bringing out possible changes in the meaning of some aspects of the issues that were probed.
However, the interviews were time consuming and required adequate and through
preparation. Taylor and Proctor (2001) assert that interviews can develop interpersonal trust,
leading to the respondent revealing more information.
3.10 SAMPLING TECHNIQUE
A sample can be viewed as a part or segment of the population that is selected for the study.
The researcher used purposive and non-probability sampling where, according to Bell and
Bryman (2007), some units have an unknown chance of being selected. The city of Harare has
46 municipal wards which are serviced by the city council. These wards are demarcated
according to population size and are mapped for election purposes; hence, one residential area
may have more wards than others. The Zimbabwe CSO (2013) puts the population of Harare
(urban) at 1 485 231 people, with 372 862 households that each has an average of four persons.
According to the ground survey carried out and records from the Harare City Council’s
Department of Waste Management (2014), there are 789 non-formal solid waste dumps across
the city. A ground census was carried out in the field to identify, map and code each of these
sites. From the 789 waste dumps, 50 sites were sampled randomly (which translated to 6.33%
of all the dumps). A sample size of 50 was deemed appropriate for this study. All the dump sites
were mapped and using a table of random digits against the total population earlier coded. The
locational attributes that were measured included the number of dump sites, the size of the
dump sites and the distance of a dump site from a significant landmark like a shopping mall, a
bus terminus and/or a market place. These attributes were measured to ascertain whether the

51
land use, its intensity and the distance influenced the location of the waste dumps. The
population of the dump sites was 789. This figure was derived from a ground enumeration
exercise that was carried out in June 2014. Each of the 789 dump sites was allocated a three-
digit number (code): 001, 002, and 003, et cetera to789. Random sampling was used to identify
the population of the study. The sample was obtained from the three main land-uses: high-
density residential areas, medium-density residential and low-density residential areas. 50
dump sites were chosen to represent the sample because it was large enough to provide
conclusive facts. The distribution of coded dump sites is shown in Figure 12.
Figure 12: Distribution of illegal dump sites in Harare (Source: City of Harare and Field work
2014)

52
The samples were counted in an anti-clockwise direction from Divarasekwa, starting with dump
site004 and ending in Malborough with dump site 670. A distribution table –see Table 8-was
generated to show how the dump sites were grouped according to size.
Table 8: Size of dump site in relation to land use Dump site code Volume of waste in kg Small - less
than 1000kg Medium – less than 2000 kg
Large more than 2000 kg
Land use
004 2100 High density 007 1500 High density 012 1300 High density 025 2000 High density 033 1100 High density 034 2300 High density O43 1300 High density 052 2800 High density 077 1500 High density 083 2100 High density 121 2700 High density 194 3 000 High density 195 2 000 High density 197 18 00 High density 198 13 00 High density 202 20 00 High density 212 26 00 High density 223 30 00 High density 224 27 00 High density 227 21 00 High density 237 23 00 High density 238 33 00 High density 283 1700 High density 297 3100 High density 317 2900 High density 341 2200 High density 343 1900 High density 345 2800 High density 368 1900 High density 372 2300 High density 400 1800 High density 409 3000 High density 412 2700 High density 426 3100 High density 451 1100 Medium 486 0800 Medium 487 1000 Medium 494 7 00 Medium 513 1100 Medium 522 800 Medium 531 2800 High density 544 2 00 High density 565 2100 High density 576 600 Low density 591 5 00 Low density 618 8 00 Low density 619 1000 Low density 326 500 Low density 649 400 Low density 670 500 Low density
Source: (Fieldwork and records from city of Harare: 2014).

53
The dumps were grouped according to volume size, with those less than 2000 kg defined as
small, less than 2000 kg as medium and those with more than 3000 kg as large. The dump sites
were also identified according to land use or where they were located: high-density, medium-
density and low-density residential areas.
3.11 SUMMARY
In this chapter, the research design, data collection procedures, data collection instruments the
sampling technique were discussed. The research findings are presented in the next chapter.
54
CHAPTER 4: PRESENTATION OF THE DATA
4.1 INTRODUCTION
Chapter 2 gave a panoramic view of solid waste and its management at a global, regional and
local level. An in-depth study of non-formal solid waste disposal sites was carried out, with the
emphasis on their management and characterisation in Harare in particular. Chapter 3 dealt
mainly with issues of data collection. In this chapter the research findings and their analysis are
presented on the basis of the empirical evidence on the state of solid waste management in the
city of Harare. To enhance an understanding and the visual impact of the presentation,
percentages, tables, graphs and photographs are used. These findings are from the interviews
conducted with employees of the Department of Waste Management and the residents of
Harare. Further data was gathered through field observations.
4.2 LOCATIONAL ATTRIBUTES OF WASTE DUMPS
The locational attributes that were measured included the number of dump sites, the size of
the dump sites and the distance of a dump site from a significant landmark like a shopping mall,
a bus terminus and/or a market place. These attributes were measured to ascertain whether
the land use, its intensity and the distance influenced the location of the waste dumps. No
illegal dump sites were observed in the CBD and industrial areas; there was only littering and
the reasons for this were not difficult to understand. Firstly, the municipality gave preference to
the CBD when it came to waste collection because it is where that the cleanliness of the city is
easily noticed and where most visitors to the city go; hence, the face of the city has to be
protected at all costs. At the time of the research, there was widespread closure of many
business outlets in the city due to the economic recession which led to a reduction in the
amount of waste that was generated and some companies were permitted to transport their
waste to the municipal landfill. All the illegal dump sites that were studied were therefore in

55
the residential areas and were grouped under high-density, medium-density and low-density
residential areas.
Figure 13 shows people at Pomona Landfill in Harare picking up solid waste for resale, recycling
and re-use. Currently, it is the only functional landfill in Harare. If properly managed, landfills
can generate bio-fertilizers, electricity and heat from methane gas, and employment. They
reduce the impact of solid waste on the environment. Figure 13 shows how dire the problem of
illegal dumping has become in Harare, especially in the high-density residential areas where
there seem to be total disregard for the need to dispose of waste properly.
Figure 13: Solid waste dump in Mbare
(Source: Fieldwork 2014)
Figure 13shows that the highest number of illegal dump sites was in the high-density residential
areas and this can be attributed mainly to the high populations in these areas. The lower
number of illegal dump sites in both medium-density and low-density residential areas can be
attributed to low populations, better environmental awareness and a better waste collection
service by the municipality. The number of dump sites varied from one land use to another.
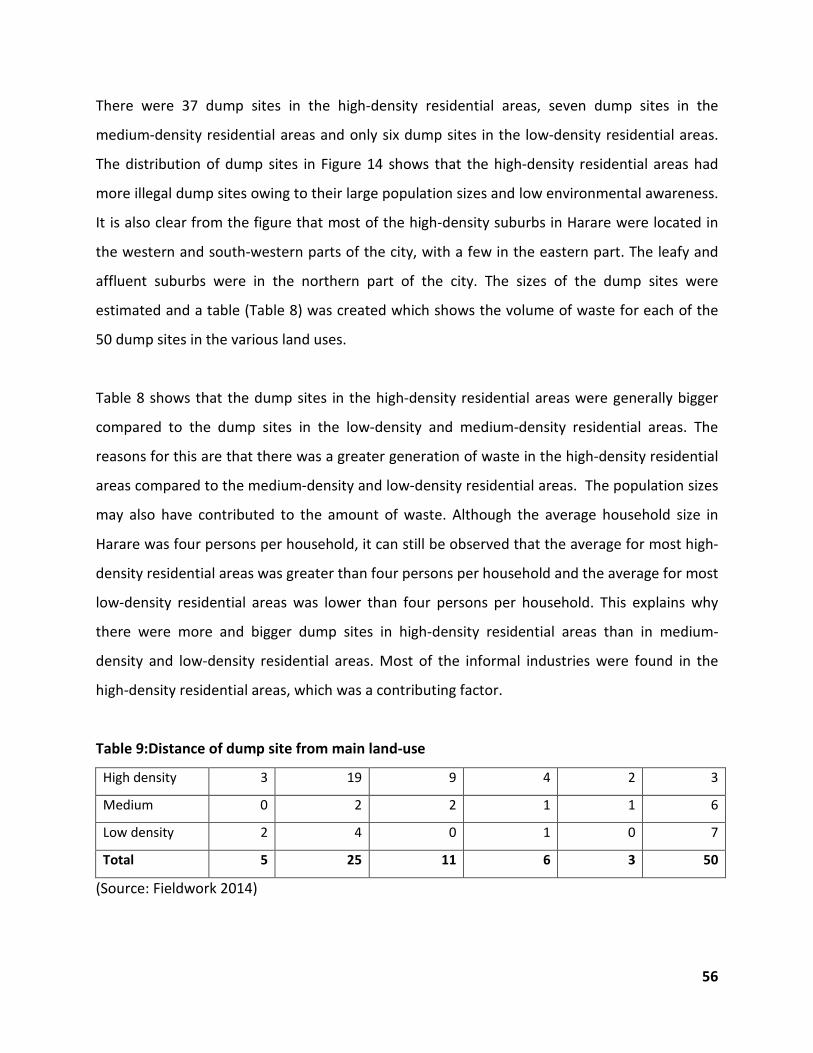
56
There were 37 dump sites in the high-density residential areas, seven dump sites in the
medium-density residential areas and only six dump sites in the low-density residential areas.
The distribution of dump sites in Figure 14 shows that the high-density residential areas had
more illegal dump sites owing to their large population sizes and low environmental awareness.
It is also clear from the figure that most of the high-density suburbs in Harare were located in
the western and south-western parts of the city, with a few in the eastern part. The leafy and
affluent suburbs were in the northern part of the city. The sizes of the dump sites were
estimated and a table (Table 8) was created which shows the volume of waste for each of the
50 dump sites in the various land uses.
Table 8 shows that the dump sites in the high-density residential areas were generally bigger
compared to the dump sites in the low-density and medium-density residential areas. The
reasons for this are that there was a greater generation of waste in the high-density residential
areas compared to the medium-density and low-density residential areas. The population sizes
may also have contributed to the amount of waste. Although the average household size in
Harare was four persons per household, it can still be observed that the average for most high-
density residential areas was greater than four persons per household and the average for most
low-density residential areas was lower than four persons per household. This explains why
there were more and bigger dump sites in high-density residential areas than in medium-
density and low-density residential areas. Most of the informal industries were found in the
high-density residential areas, which was a contributing factor.
Table 9:Distance of dump site from main land-use
High density 3 19 9 4 2 3
Medium 0 2 2 1 1 6
Low density 2 4 0 1 0 7
Total 5 25 11 6 3 50
(Source: Fieldwork 2014)
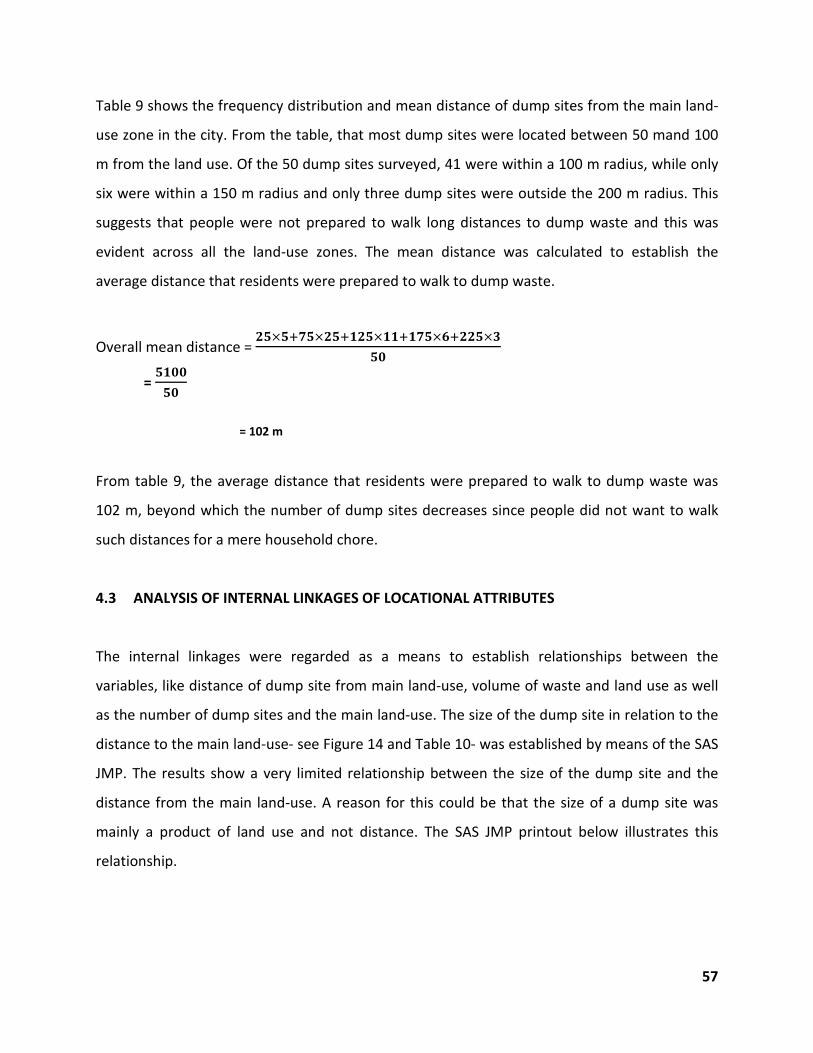
57
Table 9 shows the frequency distribution and mean distance of dump sites from the main land-
use zone in the city. From the table, that most dump sites were located between 50 mand 100
m from the land use. Of the 50 dump sites surveyed, 41 were within a 100 m radius, while only
six were within a 150 m radius and only three dump sites were outside the 200 m radius. This
suggests that people were not prepared to walk long distances to dump waste and this was
evident across all the land-use zones. The mean distance was calculated to establish the
average distance that residents were prepared to walk to dump waste.
Overall mean distance = 𝟐𝟐×𝟐+𝟕𝟐×𝟐𝟐+𝟏𝟐𝟐×𝟏𝟏+𝟏𝟕𝟐×𝟔+𝟐𝟐𝟐×𝟑
𝟐𝟓
= 𝟐𝟏𝟓𝟓𝟐𝟓
= 102 m
From table 9, the average distance that residents were prepared to walk to dump waste was
102 m, beyond which the number of dump sites decreases since people did not want to walk
such distances for a mere household chore.
4.3 ANALYSIS OF INTERNAL LINKAGES OF LOCATIONAL ATTRIBUTES
The internal linkages were regarded as a means to establish relationships between the
variables, like distance of dump site from main land-use, volume of waste and land use as well
as the number of dump sites and the main land-use. The size of the dump site in relation to the
distance to the main land-use- see Figure 14 and Table 10- was established by means of the SAS
JMP. The results show a very limited relationship between the size of the dump site and the
distance from the main land-use. A reason for this could be that the size of a dump site was
mainly a product of land use and not distance. The SAS JMP printout below illustrates this
relationship.

58
Figure 14: Size of site and distance from land-use
Table 10: SAS output
Linear Fit
Size of site=20.1584-0.0203827 * distance from the main land-use
Summary of Fit
R Square 0.019121
Adjusted R Square -0.00131
Root Mean Square Error 8.175122
Mean of Response 17.9
Observations 50
Lack of Fit
Source DF Sum of
squares
Mean Square F-Ratio
Lack of Fit 19 1527.7326 80.4070 1.3878
Pure Error 29 1680.2333 57.9391 P > F
Total Error 48 3207.5000 0.2081
Max R square
0.4862

59
Analysis of Variance
Source DF Sum of Squares Mean Square F-Ratio
Model 1 62.5340 62.5340 0.9357
Error 48 3207.9660 66.8326 P > F
C. Total 49 3270.5000 0.3382
Parameter Estimates
Term Estimate Std Error t-ratio P>[t]
Intercept 20.1584 2.605307 7.74 <.0001*
Distance from main land-use -0.020383 0.021072 -0.97 0.3382
From the SAS JMP output, it can be seen that there is an extremely weak correlation between
the distance from the main land-use and the size of the dump – as shown by the value of R² =
0.019121, which tells us that only 2% of the variability in the size of the dump is explained by
the distance from the main land-use. The points are scattered all over, which confirms that the
size of the dump and the distance from the main land-use were not correlated.
Table 11 was created to explain both expected frequency and observed frequency. Expected
frequency refers to the results and figures that the researcher would expect to get in a normal
situation when all other variables are silent. It is calculated as follows:
Expected frequency 𝒆𝒊 = 𝑹𝑹𝑹 𝒕𝑹𝒕𝒕𝒕×𝑪𝑹𝒕𝑪𝑪𝑪 𝒕𝑹𝒕𝒕𝒕
𝑮𝑮𝒕𝑪𝑮 𝒕𝑹𝒕𝒕𝒕
The observed frequency refers to the results that the researcher obtained from the fieldwork.
These results are compared with those from the expected frequency so that conclusions maybe
generated. For better results, the number of dump sites for both low-density and medium-
density residential areas were combined. This was done to avoid situations where some cells
had very few elements or no elements because this would have compromised the results. The

60
data for the two types of areas were also combined because they share a lot of similarities in
terms of population sizes, economic activities and consumption behaviour
Table 11: Distance between dump site and main land-use
DISTANCE
LAND USE ≤50 50< X≤100 100< Χ ≤150 150< Χ ≤200 >200 TOTAL
Observed
frequency
3.00 19.00 9.00 4.00 2.00 37.00
High density
Expected
frequency
3.70 18.50 8.14 4.44 2.22 37.00
Medium
density
Observed
frequency
0.00 2.00 2.00 1.00 1.00 6.00
Expected
frequency
0.60 3.00 1.32 0.72 0.36 6.00
Low density
Expected
frequency
0.7 3.5 1.54 0.84 0.42 7
Total 5 25 11 6 3 50
(Source: Fieldwork 2014)
Medium and low density were jointly evaluated for they both had only 13 dump sites which did
not warrant separate analysis compared to high density residential areas which over half of the
total number of dump sites (37).From Table 12, it is evident that for the high-density residential
areas, there were three dump sites within 50 m radius; there were only two dump sites for
both the low-density and medium-density residential areas, suggesting that people would not
normally dump waste very close to their homes. In a 50 m to 100 m radius, there were 25 dump
sites (19 for high-density and six for medium-density residential areas respectively). This again
shows that more than half the dump sites (30 dump sites) were in a 50 m to 100 m radius,

61
which is indicative that people were reluctant to walk long distances to dump waste. From 100
to 150 m, there were 17 dump sites (13 for high-density and four for low-density and medium-
density areas).
Table 12: Combined data for low-density and medium-density areas
DISTANCE
LAND USE
≤50 50< Χ≤100 100 Χ≤150 150<Χ ≤200 >200 TOTAL
High density
Observed
frequency
3.00 19.00 9.00 4.00 2.00 37.00
SExpected
frequency
3.70 18.50 8.14 4.44 2.22 37.00
Medium and
low density
Observed
frequency
2.00 6.00 2.00 2.00 1.00 13.00
Expected
frequency
1.30 6.50 2.86 1.56 0.78 13.00
Total 5.00 25.00 11.00 6.00 3.00 50.00
(Source: Fieldwork 2014)
The reasons for this sizeable number of dump sites were that the waste type included bulk
waste like old furniture, electric goods like fridges and old vehicles that require more space.
Beyond 200 m, there were only three dump sites – suggesting that beyond 150 m, people
would not travel to dump waste unless there was a special reason (like the unavailability of
dumping space close by or the presence of an environmental management enforcement
agency).
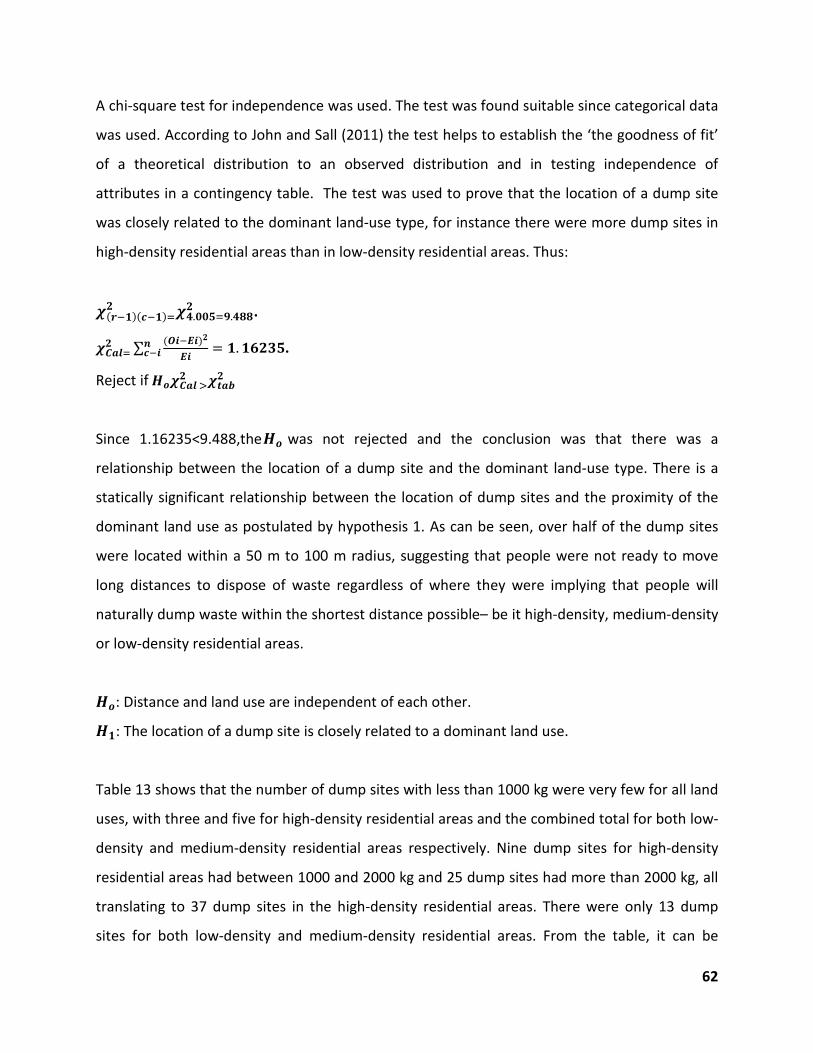
62
A chi-square test for independence was used. The test was found suitable since categorical data
was used. According to John and Sall (2011) the test helps to establish the ‘the goodness of fit’
of a theoretical distribution to an observed distribution and in testing independence of
attributes in a contingency table. The test was used to prove that the location of a dump site
was closely related to the dominant land-use type, for instance there were more dump sites in
high-density residential areas than in low-density residential areas. Thus:
𝝌(𝑮−𝟏)(𝒄−𝟏)=𝟐 𝝌𝟒.𝟓𝟓𝟐=𝟗.𝟒𝟒𝟒
𝟐 .
𝝌𝑪𝒕𝒕=𝟐 ∑ (𝑶𝒊−𝑬𝒊)𝟐
𝑬𝒊𝑪𝒄−𝒊 = 𝟏.𝟏𝟔𝟐𝟑𝟐.
Reject if 𝑯𝑹𝝌𝑪𝒕𝒕 >𝟐 𝝌𝒕𝒕𝒕𝟐
Since 1.16235<9.488,the𝑯𝑹 was not rejected and the conclusion was that there was a
relationship between the location of a dump site and the dominant land-use type. There is a
statically significant relationship between the location of dump sites and the proximity of the
dominant land use as postulated by hypothesis 1. As can be seen, over half of the dump sites
were located within a 50 m to 100 m radius, suggesting that people were not ready to move
long distances to dispose of waste regardless of where they were implying that people will
naturally dump waste within the shortest distance possible– be it high-density, medium-density
or low-density residential areas.
𝑯𝑹: Distance and land use are independent of each other.
𝑯𝟏: The location of a dump site is closely related to a dominant land use.
Table 13 shows that the number of dump sites with less than 1000 kg were very few for all land
uses, with three and five for high-density residential areas and the combined total for both low-
density and medium-density residential areas respectively. Nine dump sites for high-density
residential areas had between 1000 and 2000 kg and 25 dump sites had more than 2000 kg, all
translating to 37 dump sites in the high-density residential areas. There were only 13 dump
sites for both low-density and medium-density residential areas. From the table, it can be

63
deduced that the size of a dump site was closely related to the dominant land-use type. The
figures show that there were nine dumpsites with more than 1000 kg in the high-density areas
compared to six in both low-density and medium-density areas.
Table 13: Land use and size of dump sites
SIZE OF DUMP SITE IN KG
LAND USE ≤ 1000 KG 1000< Χ ≤2000 KG >2000 KG TOTAL
High density
Observed
frequency
3.00 9.00 25.00 37.00
Expected
frequency
5.92 11.1 19.98 37.00
Low and High
density
Observed
frequency
5.00 6.00 2.00 13.00
Expected
frequency
2.08 3.90 7.02 13.00
Total 8.00 15.00 27.00 50.00
(Source: Fieldwork 2014)
The scenario shows that there were bigger dump sites in high-density residential areas than in
both low-density and medium-density residential areas. This can be attributed mainly to high
population sizes and bigger household sizes in the high-density residential areas. According to
the Central Statistical Office’s (2013) annual mid-year reports, the average number of people in
Harare was 4.2 for high-density residential areas, 3.9 for medium-density residential areas, 3.7
for low-density residential areas and 4.0 for the city. This explains why there were more and
bigger dump sites in high-density residential areas compared to both low-density and medium-
density residential areas. To this effect, a test was carried out to check the correctness of the
postulation that the actual size of a dump site was related to the land-use type. The chi-square
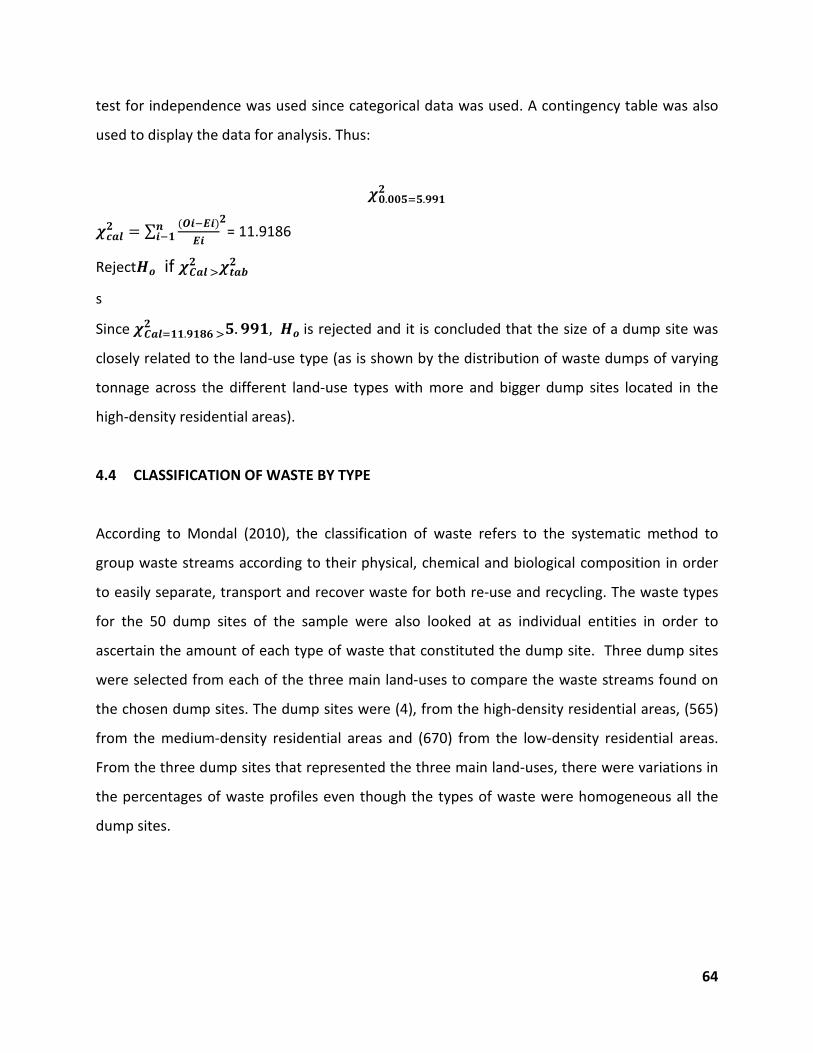
64
test for independence was used since categorical data was used. A contingency table was also
used to display the data for analysis. Thus:
𝝌𝟓.𝟓𝟓𝟐=𝟐.𝟗𝟗𝟏𝟐
𝝌𝒄𝒕𝒕𝟐 = ∑ (𝑶𝒊−𝑬𝒊)𝑬𝒊
𝟐𝑪𝒊−𝟏 = 11.9186
Reject𝑯𝑹 if 𝝌𝑪𝒕𝒕 >𝟐 𝝌𝒕𝒕𝒕𝟐
s
Since 𝝌𝑪𝒕𝒕=𝟏𝟏.𝟗𝟏𝟒𝟔 >𝟐 𝟐.𝟗𝟗𝟏, 𝑯𝑹 is rejected and it is concluded that the size of a dump site was
closely related to the land-use type (as is shown by the distribution of waste dumps of varying
tonnage across the different land-use types with more and bigger dump sites located in the
high-density residential areas).
4.4 CLASSIFICATION OF WASTE BY TYPE
According to Mondal (2010), the classification of waste refers to the systematic method to
group waste streams according to their physical, chemical and biological composition in order
to easily separate, transport and recover waste for both re-use and recycling. The waste types
for the 50 dump sites of the sample were also looked at as individual entities in order to
ascertain the amount of each type of waste that constituted the dump site. Three dump sites
were selected from each of the three main land-uses to compare the waste streams found on
the chosen dump sites. The dump sites were (4), from the high-density residential areas, (565)
from the medium-density residential areas and (670) from the low-density residential areas.
From the three dump sites that represented the three main land-uses, there were variations in
the percentages of waste profiles even though the types of waste were homogeneous all the
dump sites.

65
Figure 15: Waste profiles of high-density residential areas (Source: Fieldwork 2014)
Figure 15 shows that there was more agricultural (10 %) and wood (8 %) waste in low-income
residential areas. The reason which emerged from the interviews was that the general populace
in these areas were engaged in urban agriculture to supplement their incomes, while the wood
was used as fuel. Food waste in low-income residential areas was low(at an average of 10%)
and this can be attributed to low food levels in these areas, hence the low level of food waste.
Figure 16 shows a different scenario in medium-density areas, with higher food waste since
these residents are middle-income earners who can afford to buy substantial amounts of food.
The average food wastage in this category was 20%, which was twice than that in low-income
residential areas and only 4% less than that of low-density residential areas. Figure 16 shows
that the percentage of food waste was higher (20%) in medium-density residential areas
0 5 10 15 20 25 30
Food
Plastic
Paper
Wood
Glass
Metal
Textile
Yard trimmings
Agricultural
Other
Percentage of Waste
Type
of w
aste

66
compared to high-density residential areas, which was half (10%). Other wastes constituted the
lowest percentage at 3%.
Figure 16: Waste profiles of medium-density residential areas
(source: Fieldwork 2014)
Figure 17: Waste profiles of low-density residential areas (Source: Fieldwork 2014)
0 5 10 15 20 25 30
FoodPlasticPaperWoodGlass
MetalTextile
Yard trimmingsAgricultural
Other
Percentage of waste
Type
of w
aste
0 5 10 15 20 25 30
FoodPlasticPaperWoodGlass
MetalTextile
Yard trimmingsAgricultural
Other
Percentage of waste
Type
of w
aste
Waste profiles of low-density residential areas

67
Figure 17shows that low-density residential areas generated more food (24%) compared to
medium-density and high-density residential areas (which had 20% and 10% respectively). A
reason could be that the low-density residential areas housed wealthy people who could afford
to buy food in bulk and have the luxury to throw away leftover food, which is unheard of in the
high-density residential areas and is a not-so-common practice in the medium-density
residential areas. Plastic and paper waste is also high in this income group.
4.5 ANALYSIS OF VARIATIONS IN WASTE PROFILES
The survey revealed variations in the waste profiles for the residential areas. The profiles varied
from area to area, depending on whether the area was a low-income residential area, a
medium-income residential area or a high-income residential area. According to the Harare City
Council’s Department of Waste Management (2014),in December 2013 waste generation per
capita stood at 0.9 kg per day per person in Harare. Collection efficiency is currently was
pegged at 50% according to official records, although the information that was gathered from
residents showed a much lower efficiency. The city of Harare computed its waste collection as
follows: once a week = 100%, hence once in a fortnight translated to 50%.The level of waste
collection efficiency for a country emerging from an economic and political quagmire was fairly
plausible.
Figure 18 shows the waste profile variations in Harare per land use. There were great variations
in the waste profiles of Harare’s main land-use zones. Although there were great variations in
the percentages, there was general uniformity in the type of waste commonly found in Harare.
However, the bulk of waste in Harare (a city in a country experiencing economic hardships) is
predominantly agricultural waste as a result of urban agriculture.

68
Figure 18: Waste profiles of different land uses (source: Fieldwork 2014)
Figure 18 shows that there was more agricultural waste (26.3%) in the high-density residential
areas than in other areas. As earlier indicated, this can be attributed to increased participation
in urban agriculture. The high-density residential areas also had the least amount of food waste
(5.2%), showing a low mean per capita income and constrained consumption. There was a high
percentage of wood waste since wood was used mainly as fuel due to power cuts and because
most residents could not afford paraffin or generators. The low-density residential areas had
the highest level of food waste (20.1%) and the least agricultural waste compared to other
residential areas. These areas were where the rich people of the city stayed; they had high
incomes and could afford to buy a lot of food and throw away leftovers. The only agricultural
waste that they had was from garden vegetables. They had 29.4% plastic waste, which was the
highest for residential areas because of their heavy dependency on buying packed, wrapped
products and carrier bags from shops and their high use of stationery. Industry had the highest
percentage of plastic waste. Plastic was used mainly for packaging and wrapping goods in
0 10 20 30 40
High density
Medium
Low Density
Industry
CBD
Percentage of waste
Type
of l
and
use
Waste profiles of different land uses
Other
Trimmings Other
Textile
Wood
Glass
Paper
Plastic
Metal
Agric
Food

69
factories. The CBD had the highest percentage of paper waste (36.2%), which generally came
from offices, retail shops, banks and food outlets. Plastic waste was also high at 26.5%. In
general, there was low textile waste and other waste across the areas, with an average of 2%.
Figure 19:Waste profiles of Harare
(Sources: Fieldwork 2014)
Figure 19 shows that Harare had more plastic and paper waste. These were the most widely
used materials for packaging, wrapping and carrying goods. Food waste was at 10.92%, which
was about 3.5% below the world average and compared fairly well with regional standards
(Practical ActionZimbabwe2010:27).There was very little construction activity in the city. Plastic
and paper were mainly from shops, offices, institutions like schools and packaging industries.
Rubbish waste was at 15.5%, which was quite a high percentage. This was attributed to the
presence of informal industries which operated mainly in the backyards of homes and at
roadsides.
10.92
8.38
10.98
24.94
23
5.78
6.78
4.9
2.3
2
Waste profiles of Harare
Food
Agric
Metal
Plastic
Paper
Glass
Wood
Textiles
Trimmings
Other

70
4.6 CURRENT WASTE MANAGEMENT APPROACHES
As already established in chapter 2 of this dissertation, the city of Harare has two parallel forms
of dump sites: legal and the illegal dump sites. The legal dump sites are monitored and regularly
serviced, and the waste is transported to landfills. There is also participation by lobby groups
and pro-waste groups that are sanctioned by the city council. These include clean-up campaigns
by non-governmental organisations, volunteers and private companies that do not recycle
waste. While the formal dump sites receive regular servicing, it is usually not the case with non-
formal dump sites. These illegal dump sites are not serviced regularly and are more prevalent in
low-income residential areas. They are symptomatic of the inability of the municipality to
manage waste. All the waste collected is disposed of at Pomona Landfill, which is in the
northern part of the city. According to the Harare City Council’s Department of Waste
Management (2014), the other landfill at Golden Quarry (which is located to the western side
of the city) has been closed due to viability problems. At the landfill, the waste is spread and
then compacted. Official records of the Harare City Council (2014) show that there are 200
registered vendors who collect waste from the landfill to sell to recycling companies or their
agents. Only 20% of the solid waste generated in Harare is recycled.
According to the city’s Health Department (2014), all hospitals and other generators of
pathological waste operate under a permitting system whereby they are licensed to manage
their waste. This means that hospitals and pharmaceutical companies can incinerate their
waste, while the rest of the companies that produce chemical waste are permitted to transport
their waste to the landfill site. Some of the companies that produce chemical waste and have
been permitted to manage their waste include Turnal Asbestos, Hunyani Pulp and Paper,
Zimbabwe Fertilizer Company (ZFC) and all the tanneries.
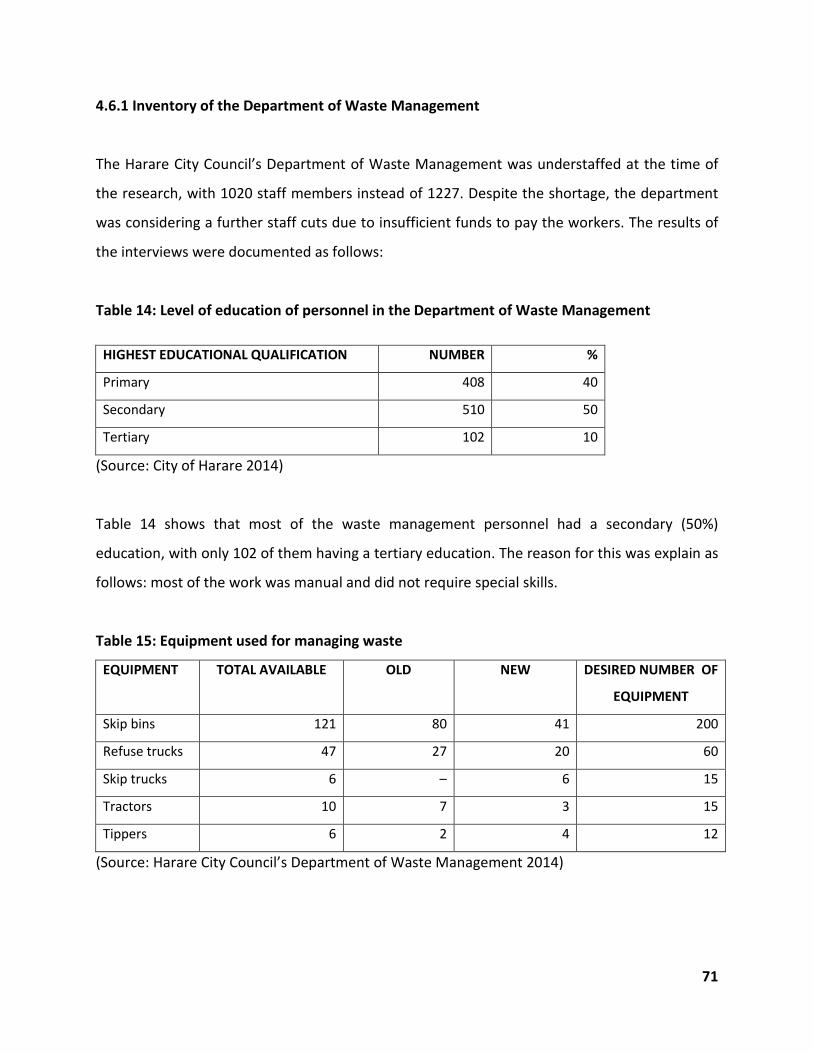
71
4.6.1 Inventory of the Department of Waste Management
The Harare City Council’s Department of Waste Management was understaffed at the time of
the research, with 1020 staff members instead of 1227. Despite the shortage, the department
was considering a further staff cuts due to insufficient funds to pay the workers. The results of
the interviews were documented as follows:
Table 14: Level of education of personnel in the Department of Waste Management
HIGHEST EDUCATIONAL QUALIFICATION NUMBER %
Primary 408 40
Secondary 510 50
Tertiary 102 10
(Source: City of Harare 2014)
Table 14 shows that most of the waste management personnel had a secondary (50%)
education, with only 102 of them having a tertiary education. The reason for this was explain as
follows: most of the work was manual and did not require special skills.
Table 15: Equipment used for managing waste
EQUIPMENT TOTAL AVAILABLE OLD NEW DESIRED NUMBER OF
EQUIPMENT
Skip bins 121 80 41 200
Refuse trucks 47 27 20 60
Skip trucks 6 – 6 15
Tractors 10 7 3 15
Tippers 6 2 4 12
(Source: Harare City Council’s Department of Waste Management 2014)

72
Table 15 shows that the Harare City Council was inadequately equipped to deal with solid waste
since the equipment they used was far less than what was required. Thiswas an obvious
indication why the municipality failed to manage waste. The desired number of equipment is
based on the volumes of waste generated in the city and sizes of the municipal wards in terms
of households.
According to the Department of Waste Management (2014), waste was supposed to be
collected once per week (with the hope of increasing the frequency to twice a week) but at the
time of the study, most wards were serviced once every fortnight. The municipality supplied
plastic bags free of charge to residents for the temporary storage of waste at three-month
intervals. Skip bins were placed at public places like markets, shopping malls and bus termini.
To ensure compliance with municipal by-laws on the generation, storage and disposal of waste,
the city council issued fines to offenders as follows:US$50 for the illegal dumping of domestic
waste, US$250 for a truckload of waste and US$20 for littering. For non-payment of rates, the
municipality disconnected the water supply.
4.6.2 Waste handling methods The responses from the household interviews indicate how waste was handled. These appear in
Figure21.

73
Figure 20: Waste handling methods
(Source: Fieldwork 2014)
Figure20shows that most residents of Harare mixed their waste. Most residents did not
separate their waste, as shown by the 60% for the mixing of waste. This is mainly due to the
lack of handling facilities.
4.6.3 Receptacles used
Harare residents used a number of receptacles for the temporary storage of waste before it
was transported to the landfill (as shown by Figure 22).
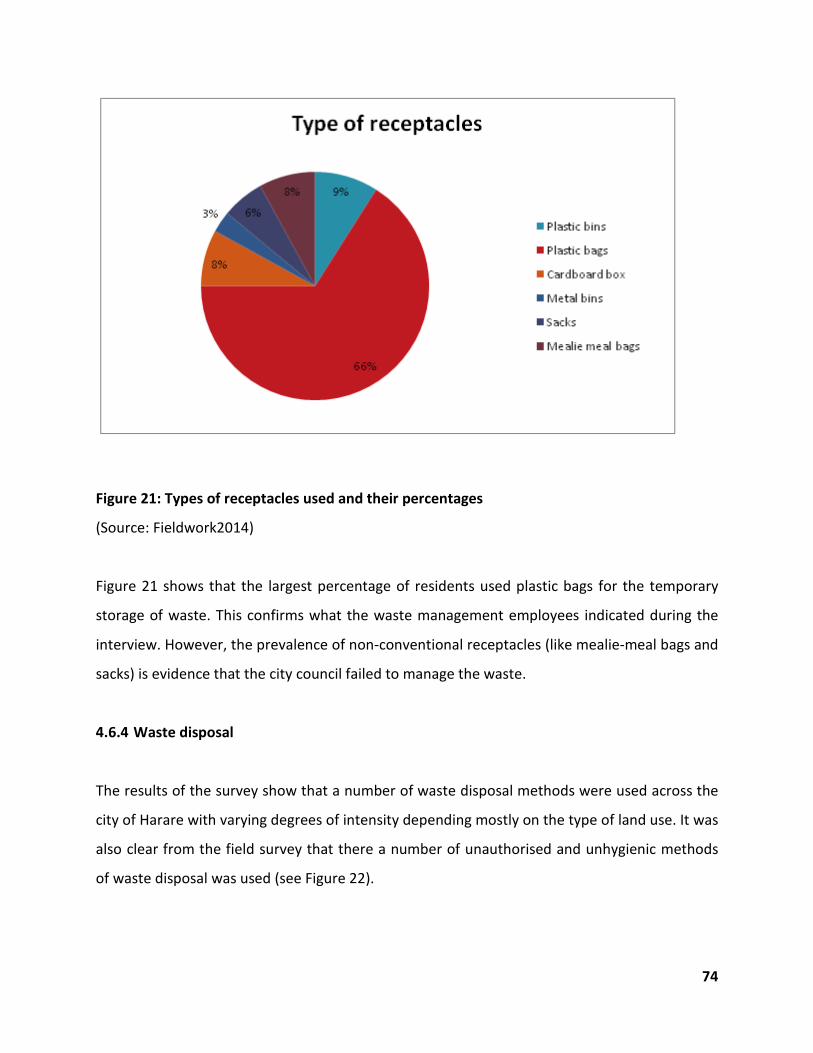
74
Figure 21: Types of receptacles used and their percentages
(Source: Fieldwork2014)
Figure 21 shows that the largest percentage of residents used plastic bags for the temporary
storage of waste. This confirms what the waste management employees indicated during the
interview. However, the prevalence of non-conventional receptacles (like mealie-meal bags and
sacks) is evidence that the city council failed to manage the waste.
4.6.4 Waste disposal
The results of the survey show that a number of waste disposal methods were used across the
city of Harare with varying degrees of intensity depending mostly on the type of land use. It was
also clear from the field survey that there a number of unauthorised and unhygienic methods
of waste disposal was used (see Figure 22).

75
Figure 22: Methods of waste disposal and their percentages (Source: Survey2014)
The above pie chart shows that there were six common ways to dispose of waste in Harare. It
can also be seen that dumping waste in undesignated areas was rampant. This explains why the
city was battling with problems of non-formal dump sites. In urban areas, burning waste is
strongly discouraged as it causes air pollution. Composting accounted for 18% of the waste
disposal, which is quite significant as this method generates odours and greenhouse gases like
methane. Although the resultant manure can be used, the negatives far outweigh the positives.
Selling waste was still very unpopular but if publicised, it could be a cleaner way of managing
waste in the city. There was both material and financial recovery. Burying waste underground,
just like composting, can contaminate ground water; exude odours; and be a breeding ground
for rats, mosquitoes and other disease-causing organisms.
4.7 SUMMARY
In this chapter, the locational attributes of non-formal solid waste dumps were discussed and
measured, and some internal linkages within the locational attributes were established. Solid

76
waste was classified according to type while the variations in the waste profiles of the areas in
the study were studied and analysed. Various waste management approaches that were used
in Harare were also discussed.

77
CHAPTER 5: DISCUSSION OF THE RESEARCH RESULTS
5.1 INTRODUCTION
The research results were presented and analysed in the preceding chapter. In this chapter, the
research findings are discussed with a view to establishing relationships between them,
accepting or rejecting the hypotheses where possible, and articulating pertinent issues about
the characterisation and management of non-formal solid waste disposal sites in Harare.
5.2 LOCATIONAL ATTRIBUTESOF NON-FORMAL SOLID WASTE DUMPS
The following locational attributes were measured: distance of dump site from main land-use,
size of dump site and number of dump sites in a given land-use zone. The research showed that
from the 50 dump sites that were studied, five were located within a 50 m and 25 were located
within a 50 to 100 m radius. This shows that 60% of the dump sites were located in a 50 to 100
m radius and six dump sites were located in a 150 to 200 m radius; only three dump sites were
found beyond a 200 m radius. It can therefore be said that more than half of the dump sites
were located in a 100 m radius, which suggests that the residents were not prepared to walk a
long distance to dump waste unless if there was virtually no space for dumping or some
environmental enforcement agency was visible. The distribution of the dump sites varied across
the various land-use zones, with all the land-use zones (low-density, medium-density and high-
density residential areas) registering more than half of their dump sites within less than 150 m
radius. It was also established that there were more dump sites in high-density residential areas
(37) – 48% more than the combined number of medium-density and low-density residential
areas (which were six and seven respectively). The reasons for this included that there were
higher population sizes in high-density residential areas. According to the Zimbabwe Central
Statistical Office (2014), the average population for high-density residential areas was 31 431
people, 20 241 for medium-density residential areas and about 14 593 for low-density
residential areas. It had already been established that the generation of waste per capita in
78
Harare was 0,900 kg per day, which meant on average one high-density residential area
produced about 28 287.9 kg of waste while a low-density residential area produced about 13
133.7 kg of waste per day. The study also showed that due to the high rate of unemployment, a
lot of informal industries operated in the backyards of homes. This was more evident in the
low-income residential areas, where waste generation had increased and accounted for the
higher number of dump sites in these areas. The sizes of the dump sites were measured and the
results did not show any pattern in the distribution of the dump sites across the areas that were
studied. Of the 37 dump sites in high-density residential areas, three were less than 1000 kg,
nine were between 1000 and 2000 kg, and 25 were more than 2000 kg. The situation was
different for low-density and medium-density residential areas, where only two dumpsites
were bigger than 2000 kg. The distribution did not show any distributional matrix, suggesting
that no factors influenced it. For the low-density and medium-density residential areas
combined, more than half the number of dump sites was less than 2000 kg25 dump sites in the
high-density residential areas were more than 2000 kg.
5.3 INTERNAL LINKAGES OF LOCATIONAL ATTRIBUTES
The internal linkages of the locational attributes of dump sites were analysed across the areas
that were studied. This included the distance of a dump site from the main land-use, the
number of dump sites in a given land-use area and the sizes of the dump site in relation to the
dominant land-use type. Of the 50 dump sites studied, it was observed that most were located
within a 100 m radius. For the high-density residential areas, three were within a 50 m radius;
there were no dump sites for medium-density residential areas and two dump sites for low-
density residential areas in the same radius. In a 50 to 100 m radius, there were 19 dump sites
in high-density residential areas, two dump sites in medium-density residential areas and four
dump sites in low-density residential areas.
The above distribution shows that 30 dump sites were located within a distance of 50 to 100 m,
representing 74% of the total. From this, it can be deduced that people usually dump waste

79
close to where they stay and are not prepared to walk long distances to dump waste. Within a
150 to 200 m radius, there were only six dump sites for all the residential areas (accounting for
only 12% of the total). Beyond 200 m, the dump sites were distributed in the following order:
two in high-density residential areas, zero in medium-density residential areas and one in low-
density residential areas – translating to 6% of the total number of dump sites. It is therefore
clear from the above distribution of dump sites across the various land-use types that there was
a statistically significant relationship between the location of a dump site and the dominant
land use. There were more dump sites close to the dominant land-use type than there were
away from the dominant land-use type.
The sizes of the dumpsites were also measured to establish whether there was a link between
the size of the dump site and the land use. The dump sizes were measured in kilograms, the
smallest being less than 1000 kg and the biggest more than 2000 kg. Out of the 50 dump sites
that were studied, six dump sites were located in medium-density residential areas and seven
in low-density residential areas. The total number of dump sites that were less than 1000 kg
was only eight for all the land uses, representing 16% of the total number of dump sites. In the
high-density residential areas, there were nine dumpsites between 10 000 and 2000 kg, and
three dumpsites each in the medium-density and low-density residential areas. There were 25
dump sites above 2000 kg in the high-density residential areas and one each above 2000 kg in
the medium-density and low-density residential areas.
There did not seem to be a definite pattern in the way that the sizes of the dump sites were
distributed across the dominant land uses. This was especially true for both medium-density
and low-density residential areas, where the distribution was haphazard – suggesting that there
was no relationship between the size of a dump site and the land use, but rather that the size of
the dump site depended on the type of waste and the availability of dumping space. The
numbers of dump sites per land use were enumerated and the figures were used to determine
if there were any linkages between the land use type and the number of dump sites. From the
research, it emerged that out of the 50 dump sites that were studied, 37 were located in high-

80
density residential areas and six and seven were located in medium-density and low-density
residential areas respectively. It can therefore be said that the number of dump sites was
closely related to the dominant use type. The fact that most of the dump sites were located in
the high-density residential areas (accounting for 74% of the total number of dump sites that
were studied) could be attributed to the high population sizes in these areas compared to the
other areas.
5.4 CLASSIFICATION OF WASTE BY TYPE
The waste was classified according to type so that the researcher could ascertain the main
types of waste in the various land-use types and Harare in general. According to Mensah and
Larbi (2005), classification is done so that the materials that make up the bulk of the waste are
known. The waste must also be categorised because this will help to determine the
biodegradability of the toxicity and the ease with which the waste can be handled.
The types of waste found at each dump site were classified to generate primary data about the
source, transporting equipment and risks involved in handling the waste. It was not an
objective of the study to come up with a new way to classify solid waste but rather to classify
the waste by using traditional methods to determine the types of waste in Harare. The main
waste types were food and garbage which result from the preparation, cooking and serving of
food. Other waste types came from green markets: the handling, storage and sale of meat and
vegetables. These wastes are mainly generated by households, institutions and commercial
entities such as hotels, shops and restaurants. There were also rubbish waste, including
combustibles (primarily organic), paper, cardboard, wood, plastics, yard trimmings, cloth,
leather and rubber. In this group (rubbish), there were also non-combustible (inorganic) metals,
tin cans, ceramics, glass and crockery. Some of the most common wastes in the study areas
were bulk wastes which included large auto parts, tyres, discarded furniture, stoves,
refrigerators, tree branches and other large appliances. Street waste was a common sight
during the investigation. These included street sweepings, dirt, leaves, animal droppings and

81
the contents of litter receptacles. This type of waste mainly comes from streets, sidewalks,
alleys, vacant lots and parks. Some wastes were classified under construction and demolition
waste. These wastes were sporadically spread across the study areas as very little construction
activity took place in the city due to the economic challenges in the country. They were seen
mainly in residential areas where people from the Diaspora were building houses. Other
construction wastes that were seen in Harare were the remnants of the notorious
Murambatsvina (Operation Restore Order) of May 2005, when the government went on a
demolition spree pulled down all the structures which did not meet municipal standards. Nine
years down the line, at the time when the research was conducted, the heaps of waste still
haunted the city, which did not have the capacity to dispose of the waste. Although some
wastes were classified under dead animals for the sake of convenience, this type of waste was
not common (here and there a dead rat, bird or dog could be seen but that did not warrant
much debate).
5.5 WASTE PROFILES IN HARARE
UNEP (2010:53) defines a waste profile as a description of the material characteristics
(chemical, physical and biological composition) of waste, together with information about the
waste from when it is generated to when it is disposed of. Simply put, a waste profile refers to
the materials that make up the waste. The waste profile is important because it helps in
determining the processing unit, transportation, destruction and reduction of the waste.
For this study, the waste profiles were first looked at in terms of land use and for the city of
Harare in general. The main profiles that were considered were food, paper, plastic, glass,
textile, agricultural waste, yard trimmings, metal, wood and others. Of the land-use types
studied, the high-density residential areas had the least amount of food waste and this was
mainly due to low levels of income. According to the Word Food Programme (WFP) (2013) the
income of more than half the population of Harare stands at US$300 per month and this is far
below the PDL, which (according to the Zimbabwe Central Statistical Office(2014)was pegged at

82
US$550 (a pie in the sky for most of the residents of Harare). For this reason, therefore, there
was very little food waste in the high-density areas, which accounted for only 5.2% (less than
half the average for the city, which stood at 10.92%). There was also more wood waste in the
high-density residential areas compared to the other land-use zones – a situation that was
explained by the prevalent use of firewood for cooking since ZESA struggled to supply enough
power and residents had to resort to wood as an alternative source of energy. The CBD had the
highest percentage of waste (17.2%) and this was explained as being due to the high number of
food outlets and vendors selling food from every available space in the city. There was more
agricultural waste in the high-density residential areas than in the other land-use zones. The
reasons for this distribution were that most of the residents in these areas supplemented their
disappointing salaries by growing their own food, especially maize (which is the staple crop).
The emergence of urban agriculture (which was the brain child of the agrarian reform
accelerated by the government after the controversial land redistribution)led to many residents
engaging in some form of agriculture or the other, leading to an increase in agricultural waste
(26.3% compared to 13.6% for medium-density and low-density residential areas, industry and
the CBD combined). What was interesting was that for metal waste, industry had a slightly
higher percentage and this was attributed to the increase of informal industries in residential
areas, mainly due to the closure of companies and the resultant high levels of unemployment.
Compared to the other residential areas, the low-density residential areas had the highest
percentage of food (20.1%), plastic (29.4%) and paper (21.4%)waste. The reasons for this were
that these were high-income residential areas; hence the people could afford plenty of food
and threw away leftovers. Plastic waste was mainly generated from the packaging of food and
goods, while paper waste came from stationery, packaging and wrapping goods, food and
parcels. For glass, textiles, yard trimmings and other wastes, the differences between the land-
use zones were not much (±1%).The main reason for this was because these wastes did not
accrue from regular activities and did not normally have much to do with land use but were
rather a result of occasional and/or activity-based efforts. Although textiles can be explained in
a slightly different manner (like durability and that it requires a decision for one to throw away

83
old clothes or linen), it was not instantaneous as with other types of waste which could be
irritating or offensive.
On average, the waste profiles in Harare compared fairly well with those of other cities in
developing countries – in some streams even with developing countries, though food waste
was well below the level for most cities (which was ±15% of all waste). The waste profiles in
Harare were dominated by plastic and paper, accounting for 48.94% (almost half of all the
waste generated in the city). This emanated from low levels of recycling which, according to
the Harare City Council’s Department of Waste Management (2014),was 20% less than half of
South Africa’s– which was 42% (Makarati & Chikobvu 2011:15). It is ironic that in a city where
poverty is common, the concept “recycle, re-use and reduce” was still in its infancy –
contradicting the commonly held view that there is more sustainability in poverty than in
affluence.
5.6 CURRENT WASTE MANAGEMENT STRATEGIES IN HARARE
Although the research findings revealed that most of the waste management strategies in use
in Harare conformed to international standards, the level of compliance to even very basic
norms like recycle and re-use still differed greatly from regional and international standards.
Waste management in Harare (and in Zimbabwe as a whole) is mainly monitored by the EMA,
which is an arm of the government, but city councils have their own by-laws on waste
management. It has been observed that the inability of the city council to effectively manage
waste is mainly due to inadequate personnel. The Department of Waste Management (2014)
indicated that from the required 1 227 personnel member, the department had only 1020
(which was 16.87% less than the required personnel). The problem was compounded by
inadequate and/or obsolete equipment.
A number of waste handling methods were used in Harare, especially at household level, and
this was a reflection of the city council’s commitment to waste management. Most generators

84
mixed their waste (60%, as shown in Figure 21), which shows that waste was not separated at
the source. It is disappointing to note that only a paltry 7% separated waste at the source,
which made the characterisation and management of non-formal solid dump sites difficult. This
shows that the culture of separating waste was still in its infancy in Harare (and the whole
country in genera). 28% of the waste generated in Harare was handled by wrapping, indicating
that quite a great deal of the waste was managed by using very rudimentary methods not
befitting a city in the 21stcentury. Wrapping waste also shows a lack of handling facilities. Only
3% of the solid waste generated was shredded, which is quite a small percentage compared to
other cities in the region. It shows that the bulk of the waste was disposed of in their raw and
bulk state, which made it expensive to transport since it was voluminous and required more
space for disposal. In addition, very little compacting took place (as is shown by a mere 2%),
mainly due to lack of equipment. The waste handling mechanisms that were used in Harare
were still very traditional and did not reflect any efforts by the city council to modernise the
mechanisms. This has also attributed to the problem of non-formal solid waste dumps which
are now engulfing the city.
The city of Harare battled to provide its residents with enough and reliable waste receptacles
on time. According to the Harare City Council’s Department of Waste Management (2014 ), the
city provided plastic bags to residents once every three months. This is both insignificant and
unsustainable, given the volumes of waste generated per day (let alone per month). Metal and
plastic bins were mainly given to business entities and institutions like schools and hospitals.
Plastic bags constituted 66% of the receptacles used to temporarily store waste before disposal,
which is a substantial percentage. From the research, it emerged that the plastic bags had
shortcomings – like aiding in the rotting of waste generating offensive odours, especially in
summer given that Zimbabwe is a tropical country where the temperatures are always high –
and black plastic bags were least preferred to metal bins. Plastic bins accounted for only 9% of
all the receptacles used in Harare and were only given to businesses and institutions. Increasing
the number of these plastic bins and giving them to households could be a good move that will
go a long way in solving the problem of using non-conventional receptacles since they are both

85
durable and user friendly and can accommodate more waste, even though the city council
alleged that they could not afford the costs of these plastic bins (as indicated in the research).
From Figure 22, it can be seen that only 3% of all the receptacles used in Harare were metal
bins and these were only accessed by businesses and institutions. These metal bins were big
and durable but still user friendly since they had handles for convenience and hygienic reasons.
However, the issue of affordability was again raised by the city council, which always
complained of working on a strict budget due to economic hardships and the non-payment of
rates by nearly 40% of the residents. Some residents resorted to using sacks for the temporary
storage of waste (6%).This is usually the norm when residents have to wait for the next issue of
plastic bags from the city council, which only lasts a week. Some households used cardboard
boxes to store waste before disposal and this accounted for 8% of the receptacles used in
Harare. These cardboard boxes are not ideal for storing waste since they leak if the waste
produces fluids; they become wet, produce odours and are difficult to handle. Mealie-meal
bags were also used (8%) and this indicated desperate situation, where residents could not
afford to buy the recommended plastic bags while they waited for the allocation from the
municipality (which was only four times per year). Considering their poor durability and that
waste was collected weekly – combined with the fact that these plastic bags were carried off
with the waste – it meant that for the other 48 weeks of the year, the residents had to make do
with whatever they could lay their hands on since they could not afford to buy the black plastic
bags.
It is evident from the above scenario that the inability of the city of Harare to supply residents
with proper and conventional receptacles for the storage of waste could be blamed for poor
waste handling at a household level that led to the unprecedented and unacceptable levels of
using non-formal receptacles. This caused health problems like the cholera and dysentery
outbreaks in the suburbs of Budiriro, Glenview, Mbare, Kuwadzana and Mufakose which
brought untold levels of human suffering and loss of life. A number of waste disposal methods
were used in Harare, many of which were outdated and had been cited as the chief causes of
the environmental woes in the city. 21% of the waste was disposed of by burning, which

86
(according to the city council) caused air pollution, urban heat islands and in some instances
fires. Burning waste also causes soot, which eventually lands on buildings and distorts the visual
beauty of buildings. Burning (especially the burning of tyres, polyvinylchloride [PVC] products
and rubber) has also been linked to chemical pollution. Composting accounted for 18% of the
methods used. When left unchecked, organic manure can be a haven for rodents and other
vectors; hence, it is not ideal for urban waste disposal due to lack of space. Compost also
generates odours, which leads to air pollution. Burying waste is also a common practice in
Harare (5% according to the data in Figure23). This is a very poor method of waste disposal,
especially when done in residential areas.
5.7 ADVICE ON SUSTAINABLE WASTE MANAGEMENT STRATEGIES
The city of Harare was found wanting in many aspects of its waste management, especially with
respect to the characterisation and management of non-formal solid waste disposal sites,
handling waste, the provision of waste handling facilities at household level and the
involvement of key stakeholders.
5.7.1 Integrated environmental management system
Puorideme (2010) defines an integrated environmental management system as a
comprehensive solid waste model that combines elements of waste prevention, recycling,
composting and disposal with active stakeholder participation that ensures efficient and
sustainable waste management. The definition gives a clear guideline on how municipalities
should manage waste. From the research, it was found that there was very little stakeholder
participation in waste management in Harare and this is a major shortcoming that residents
capitalise on when not complying with city by-laws. The residents should be empowered and
must be made to feel that they own the city. Environmental lobby groups, the government and
the corporate world must all be embraced because they are all very important cogs in the
environmental management wheel. Natural and obvious efforts must be directed towards
reducing waste by innovatively designing and manufacturing products with less materials and
materials that are less toxic or non-toxic, recyclable and biodegradable. An integrated

87
environmental system is therefore suggested,-in Figure 23-where all stakeholders are involved,
their responsibilities are outlined and they are made aware of the responsibilities of their
counterparts. To this effect, an environmental management window of responsibilities model is
suggested for the city of Harare. The municipality is mainly mandated to provide infrastructure
like landfills, waste management equipment like skip bins, waste collection trucks, bins and
enforcement of by-laws. The main roles of the residents are to make sure that waste is
disposed of at designated areas, pay waste collection fees to the municipality, report illegal
dumping and also help with ideas that enhance good waste management practices. Industry
naturally helps with relevant technology and trends in waste management so as to reduce costs
as well as improving efficiency. Government ensures that national environmental laws are
adhered to by both the municipality and the residents, help with technical and financial
assistance. The legislature help with interpretation of the laws and by-laws pertaining to
environmental management and waste management while lobby groups are charged with
information dissemination as well as environmental awareness campaigns.
1
2
4 3
1= Municipality
2= Residents
3= Industry
4= Legislature/lobby groups/government
Figure 23: Environmental management window of responsibilities (EMWR) model
(Source Author: 2014)

88
The four panes represent the four natural stakeholders: the municipality, residents, industry
and legislature. The outer frame of the window represents a common goal, thus embracing
everyone; the dividing lines assign responsibilities to each pane while every pane is a group of
stakeholders with distinct responsibilities. The window panes are of the same size, meaning
that all the stakeholders have equal responsibilities. Each pane is self-contained (which means
its roles are clear and peculiar to that pane) and is attached to the others (which show
integration, interdependence and indispensability). It is evident that members of each pane are
aware of what members of the other panes are doing and what they are supposed to be doing.
Increasing the size of one pane reduces the size of another pane, leading to more
responsibilities on one part while responsibilities are diminished on the other part.
The model is a window because it means that everything is clear for everyone. Thus, from the
model, one can surmise that in order for effective waste management to be realised, all
stakeholders must participate fully according to their areas of responsibility. Though
responsibilities may overlap as a way of helping struggling members the sole responsibility
remains with the stakeholders in that pane and this must not result in pushing other
stakeholders into obscurity which lead to disintegration, despondency and non-compliance.
5.7.2 Contracting system
From the information obtained, it is noted that the Harare City Council failed to collect waste
on time and that insufficient waste-collecting trucks is one of the reasons for this. This has led
to an ever-increasing number of illegal dump sites in the city. It is therefore proposed that a
contracting system be introduced whereby private companies are contracted to collect and
transport waste to landfills. This should be done through a tender system in order to minimise
incidences of corruption and at the same time secure the best service provider. The contract
should be reviewed after a stipulated period in order to curb complacency and incompetence.

89
5.7.3 Environmental awareness
The Harare City Council is advised to embark on massive environmental awareness campaigns
to make residents aware of the need for a cleaner and safe environment that can only be
realised through good solid waste management, shared responsibilities and a sense of
ownership. This can be achieved through clean-up campaigns and promotions like cleanest
suburb of the year, cleanest home of the suburb and cleanest school/hospital of the city. This
will encourage residents and institutions to compete for recognition. Cleaner institutions,
homes and suburbs can be rewarded with certificates and monetary prizes. Promotions on the
use and return of waste should be encouraged since this will lead to more waste being reused
and/or recycled. Better separation at the source is another way to reduce waste as the
separated waste will be easy to recycle. The city council can extend theuse colour-coded bins to
other areas to encourage residents and make it easy for them to recognise which type of waste
to put in which bin. This will also automatically promote the idea of recycling.
5.7.4 Human resources development
In recent years, it has become quite natural and obvious that human capital supersedes all
forms of capital, including land, money, and even gold and diamonds. Therefore, the city of
Harare is advised to invest in human development. The research data revealed that 90% of the
employees in the Department of Waste Management had only primary and secondary
education and many did not have any form of training. This is seen as militating against service
delivery. Residents complained about council workers being very discourteous, and this can
only be attributed to a lack of public relations and customer care training. This was also cited as
the reason why most residents did not comply with the city’s by-laws, did not attend council
meetings and did not pay their rates (and those who did pay did not do so on time).
The research survey revealed that the council operated with a skeletal workforce of 1020
employees instead of 1227. It has already been indicated that Harare had an urban population
90
of 1 485231 at the time of the research and that the Department of Waste Management’s staff
compliment of 1020 translated to one worker servicing about 1456 people. This is
disproportional and was one of the reasons why waste was not collected on time. The
researcher therefore advises that more workers be hired to relieve the already strained human
resources of the city council. This will help to increase the frequency of waste collection and will
improve waste management in the city.
5.7.5 Legislation
Legislation on waste management should be reviewed often, as some pieces of legislation are
outdated. For instance, the Domestic Waste Collection Act of 1981a states that domestic waste
shall be collected once a week but it is silent on what should happen in a week where there are
public holidays. The growth of the city was also not considered. It appears that most of the by-
laws have been overtaken by events and are no longer relevant to modern city standards. The
Waste Disposal Act of 1979 states that council may demand that the owner of a premise and
generator of waste remove all domestic waste and deposit it at a disposal site. This is
tantamount to saying that the city has no obligation to remove waste from private premises.
The Act further suggests that residents may not complain to the city council for the non-
collection of waste. While the current fines for dumping waste in undesignated places (US$250
for trucks dumping waste, US$50 for dumping domestic waste and US$20 for littering) are
plausible, it is felt that enforcement should be strengthened and should be applied unilaterally.
While the disconnection of water due to non-payment of rates is seen as more radical, in some
quarters it is regarded as primitive and insensitive and could be replaced by more proactive and
non-humiliating punishments like instituting legal action and community services in council
facilities like parks, schools, farms and stadiums. The council is also advised aggressively
promote the increasingly popular concept of the 3Rs (recycle, re-use and reduce) at household
level.

91
5.8 SUMMARY
In this chapter, the locational attributes of non-formal solid waste disposal dumping sites were
explored and measured and some internal linkages within the locational attributes were
established. Solid waste was classified according to type for the study, while variations in waste
profiles were studied and analysed. Various waste management strategies used in Harare were
discussed. Lastly, some advice on sustainable waste management was offered.
92
CHAPTER 6: CONCLUSION AND RECOMMENTATIONS
6.1 SUMMARY
In chapter one, an introduction to the research is provided. The context of non-formal waste
dumps in Harare, Zimbabwe is placed in the wider context of contemporary urban problems.
The research problem is identified, the purpose of the research specified together with the key
objectives of the study. The chapter is rounded up with a definition of key concepts. In chapter
two, presented a survey of the state of contemporary literature on the management of solid waste
in urban environments. It was established that there existed widespread challenges in the way
municipal solid waste was managed. It was noted that developing countries faced severe
challenges which called for country specific solutions. Chapter three looked at the way the
research was carried out. Built on a descriptive, non-experimental research design, instruments
were designed and piloted before application in data collection. Field sampling was carried out to
isolate a sample of sites for observation in Harare City. Field observation was the main
instrument for primary data on the characterisation of waste dumps while secondary data was
retrieved from Harare City Council. This second set of data provided information on current
waste management approaches. The data so collected was analysed using SAS JMP. The results
of the research were presented in chapter four. Applicable Excel generated graphics that capture
the characteristics of non-formal waste dumps were presented and described with respect to the
key objectives of the study. The testing of the hypotheses was carried out using. The results show
a great deal of gaps in available knowledge and techniques in the current practices in solid waste
management in Harare. Chapter five presented the discussion of the findings. These were bench
marked against similar findings in the literature. Possible interventions to improve the
performance of waste management are indicated. Chapter six having, recognised the importance
of the research findings this chapter therefore presents the conclusion and recommendations for
improving the management of solid waste with special emphasis on non-formal disposal sites.
The recommendations call for a more integrated approach which enhances greater
environmental, economic, social and political sustainability.

93
6.2 CONCLUSION
The problem of illegal waste dumps in Harare has attracted considerable attention from the
civics, academics, environmental lobby groups, the government and the general public. This has
led to a barrage of criticism against the municipality, especially the Department of Waste
Management. Although the problem of non-formal solid waste disposal sites in Harare may
mainly be linked to population growth, urbanisation and the general poor performance of the
economy (as the municipality wants people to believe), these are not reasons enough to
exonerate the municipality which – in every sane person’s view – is characterised by
incompetence, corruption and political interference. The practical solutions that have been
advanced in this research may still come to nought if they are not implemented from an
integrated solid waste management perspective. Although funding is key to the success of all
the recommendations that are made, stakeholder involvement, transparency and efficiency on
the part of the municipality are paramount.
6.3 RECOMMENDATIONS
After the field survey and the interactions with residents, organisations, the city council,
government and environmental advocacy groups, and captains of industry, it became
mandatory for the researcher to present a number of recommendations to the mentioned
stakeholders. These recommendations have been structured to suit the various stakeholder
groups for ease of understanding and possible implementation.
6.3.1 Recommendations to the Department of Waste Management
The following recommendations are made to the department:

94
• Implement an integrated environmental management system. The city of Harare should
embrace the now internationally acclaimed approach to waste management which co-
operates all the functional units of waste management and all the stakeholders for the
speedy and efficient collection of waste in the city.
• Colour coded bins provide colour coded bins to residents so that they can segregate
waste at household level.
• Use durable waste/garbage bins. It is recommended that the city council supply
residents with more durable waste bins (e.g. the metal ones or the plastic ones with
handles and wheels for easy handling of waste). Although these bins may initially be
expensive, the long-term advantages far outweigh the disadvantages. The number of
bins supplied must be based on the size of the household (unlike the present situation
where there is only one bin per household in three months).
• Involve stakeholders. From the research, it emerged that there was minimal stakeholder
participation in most of the issues pertaining to waste management in Harare. It is
suggested that the Harare City Council involve all the stakeholders in waste
management if its ambitions to be a world-class city by 2025 are to be realised.
• Provide open places to make compost from biodegradable waste. Increase the number
of colour-coded bins in public places. This encourages waste separation, which will
eventually promote recycling and re-use. At the time of the research, these bins were
only seen in the CBD.
• Review city by-laws governing the management of waste. The research unearthed a
number of archaic laws that were crafted more than thirty 30 years ago and are no
longer relevant to modern methods of waste management. Here reference is made to
the 1979 Policy on Waste Management, which states that only the city of Harare has the
responsibility for the removal of all domestic waste from premises. This is only possible
in a functional municipality with the capacity to manage waste.

95
• Conduct a waste audit. An audit should be carried out at six-month intervals in order to
establish the nature and amount of the waste generated, with a view to putting in place
a collection frequency that meets the generation rate.
• Provide greater autonomy. The Department of Waste Management should be given
greater autonomy for effective performance. They should always have contingency
measures to deal with the increasing volumes of solid waste, especially in summer when
there is increased agricultural waste.
• Develop a cost recovery scheme. This can be achieved by imposing a levy on the
residents, shops and market vendors as a way of financing the collection of waste.
• Educate the public. Posters with environmental information should be regularly made
available to the public to educate them about good environmental management and
the importance of public participation in environmental issues, and current trends and
developments in waste management.
• Offer rewards/incentives. The Harare City Council should consider awarding trophies or
price money for, say, the cleanest suburb of the month, the cleanest market of the city
or even the most improved suburb of the city.The maximum number of persons per
household should be fixed and be accompanied by the appropriate infrastructure to
avoid overcrowding, which ultimately leads to more waste being generated per
household.
• Invest in waste management much effort and resources should be channelled to skilling
of waste management personnel.
6.3.2 Recommendations to the residents of Harare
The following recommendations are made:
• Start segregation of waste at household level so as to promote recycling and re-use.
• Inculcate in children waste management skills so that they will grow up as responsible
citizens.

96
• For the purpose of composting, organic waste should be separated from other waste at
the source.
• All types of waste that are recyclable should be segregated at the source and put in
separate facilities for recycling.
• Littering should be avoided by putting rubbish in bins or holding on to it until a bin is
accessed. For instance, if someone has generated waste (e.g. fruit peels, cans, food
wrappers or newspapers) in areas where bins are not readily available.
• Residents should be encouraged by the city council and environmental groups to attend
and participate in community and municipal environmental meetings, campaigns and
programmes.
• The Harare City Council should provide vendors with proper structures that have waste
disposal facilities so that they can conduct their business and store their wares at night
for a nominal fee.
• Residents should have a sense of ownership and respect for the city. This will lead to
more responsibility and accountability, thereby reducing littering and the illegal
dumping of waste.
6.3.3 Recommendations to the government
The following recommendations are offered:
• Environmental laws should be reviewed regularly to keep pace with the latest trends in
waste management. Since the country has adopted a multi-currency system and
abandoned the Zimbabwe Dollar, all fines and levies must be quoted in US$ to avoid
confusion and prejudice.
• Public and private partnerships in small-scale recycling enterprises that handle some of
the waste components should be established.
• The Ministry of Education, Sports and Culture should include environmental education
in the curriculum, with the aim of making it an examinable subject at both ordinary and

97
advanced level in future. This will automatically emphasise the importance of managing
the environment. Students may also be entered in competitions where they design
projects and models on environmental management.
6.3.4 Recommendations to the industry
The following recommendations are made:
• Packaging material should be made from biodegradable material and using plastic
packaging should be avoided as much as possible.
• Manufacturing companies must come up with designs for products that produce less
waste.
• Wherever possible, industry should strive to use recyclable resources such as raw
material, since this will reduce the eventual waste that finds its way to the landfill.
• Encourage consumers of their products to sell back or return all recycle able products
after use.
The chapter availed some recommendations to the main stakeholders involved in
managing waste in Harare. All the recommendations were tailor made to meet each
individual group’s mandate and abilities with the view of wanting to mainly achieve an
integrated solid waste management system in a more sustainable way while encouraging
a culture of responsibility and accountability
98
LIST OFREFERENCES
Awoso, JA & Tariwo, AM. 2010. Waste disposal and pollution in urban areas. A workable
remedy for the environment in developing countries. Journal of Environmental
Science6(1):26–32.
Bere, S. 2011. Waste management issues in Zimbabwe. Journal of Sustainable Development in
Africa 21(6):1120–1128.
Bere, S. 2013. Waste management challenges and solutions in Zimbabwe. Journal of
Sustainable Development in Africa 13:120–129.
Bryman,A.2007.Social research methods. New York: Oxford University Press.
Burnley, SJ. 2010. A review of municipal solid waste composition in the United Kingdom. Waste
Management 27:1274–1285.
Central Intelligence. 2010. The State of Health and Safety in Zimbabwe. Proceedings from An
Urban waste management work shop: Harare 13 July 2010.
City of Harare. 2013Waste Management By-laws Statutory Instrument 477 0f 2006. Harare:
Harare.
City of Harare.2014. Draft National Environmental Management.Waste Management Bill.
Harare: Government Printers.
Cherubini, F. 2010. Life cyclesassessment of urban waste management. Journal of Waste
Management 10:1016–1023.
Chifamba, P. 2010. Trace metal contamination of water at solid waste disposal in Kariba,
Zimbabwe. African Journal of Aquatic Sciences32(1):7178.
Chigwinya, A & Mudzengerere, F. 2012. Waste management in Bulawayo City Council in
Zimbabwe: In search of sustainable waste management in the city. Journal of Sustainable
Development in Africa14(1):228–243.
Chikoko, V & Moyo, S. 2003.Dissertation guidelines for the Master of Education in Educational
Administration. Harare: Zimbabwe Open University.

99
Chung, S. 2010. Local waste management constraints and waste administration in China.
Journal of Waste Management 28:272–278.
Faccia, D. 2011. Municipal solid waste in the United States of America. Journalof Environmental
Science 27:720–733.
Fuggle, FL & Rubie, MA.2006.Environmentalmanagement in South Africa. Pretoria: McMillan.
Geng, Y, Zhu, Q, Doberstein, B & Fujita, T. 2009. Implementing China’s circular economy
concept at the regional level: A review of progress in Dalian, China.Journal of Waste
Management 29:996–1002.
Government of the Republic of South Africa. 2006. Draft National Environmental Management:
Waste Management Bill. Pretoria: Government Printer.
Government of Zimbabwe. 2002.Environmental Management Act (Chapter 20:27). Harare:
Government Printers.
Government of Zimbabwe. 2013.Environmental management policies and strategies for
environmental impact assessment. Harare: Government Printers.
Gwimbi, P& Dirwai, C. 2003.Research methods in Geography and Environmental Studies.
Harare: Zimbabwe Open University.
Halfman, DA. 2010. Solid waste management. Journal of Environmental Science 2(11):1023–
1027.
Jambwa, D. 2011. Municipal solid waste disposal challenges in the city of Chinhoyi, Zimbabwe.
Journal of Sustainable Development in Africa 13(2):615–621.26.
Johns, B and Sall, J. 2011. JMP statistical discovery software. Wiley international planning
review. Computational statistics 3(3): 188;194.
Kemal,SA2007: Solid Waste Management. European Journal of Sustainable
Development,2(2)452-500.
Kutiwa, S, Boon, E and Devuyst, D 2010: Urban Agriculture in Low income households of
Harare: an adaptive response to economic crisis. Journal of Human Ecology,32(2)85-96.

100
Mader. J E. 2011. Applying the Integrated Solid waste Management Frame work to the waste
collection System. Aguascalientes. AGS : Mexico.
Madebwe, V & Mudebwe, C.2010. Demolition waste management in the aftermath of
Zimbabwe’s Operation Restore Order(Murambatsvina). The Case of Gweru,
Zimbabwe.JournalofAppliedSciencesResearch2(4):217–221.
Magadu, S. 2013. Urban solid waste management. European Journal of Sustainable
Development 2(1):68–98.
Makarati, F & Chikobvu, D.2011. Solid waste management in Zimbabwe. Journal of Sustainable
Development in Africa 13(7):184–199.
Mangizvo, RV. 2010. Challenges of solid waste management in the central business district of
the city of Gweru in Zimbabwe. Journal of Sustainable Development in Africa 9(3):134–
145.
Manyanhaire, IO & Munasirei, D. 2010. Analysis of a domestic solid waste management system:
A case study of Sakubva high-density suburb in Mutare, Zimbabwe. Journal of Sustainable
Development in Africa 11(2):127–140.
Manyuchi, M & Phiri, D. 2012.Waste management in Zimbabwe. Landfill design and
management. Harare: Harare institute of technology.
Mapira, J. 2012. Challenges of solid waste disposal and management in the city of Masvingo,
Zimbabwe. Journal of Social Development in Africa 26(2):26–34. Matate, N & Trois, L.
2010. Towards zero waste in emerging countries – A South African experience. Journal of
Waste Management 28:1480–1490.
Mawire, W. 2010. Waste management. The Zimbabwean, 19 November.
Mbanga, W. 2011. Editorial comment. The Zimbabwean, 24 August.Momoh, A & Oladebeye,
DH. 2010. Waste management. Journal of Human Sciences4(2):201–216.

101
Momoh, J J and Oladebeye, D H.2010. Assessment of awareness of attitude and willingness of
people to participate in household solid recycling programmes in Odo-Eketi, Nigeria.
Journal of Applied Sciences in Environmental Sanitation: (2) 231-253.
Mensah, A and Labi, E 2005. Solid waste disposal in Ghana. www. Trend wastenet{ Accessed 20
September 2014}.
Mondal, P. 2010, Major classification of waste. Journal of Waste Management: 22(2):78–89.
Mouton, J. 2001.How to succeed in your master’s and doctoral studies:SA South African guide
and resource book. Pretoria: Van Schaik.
Muchadehama, D. 2012. Improved local governance, answer to service delivery. Daily News on
Sunday, Zimbabwe, 12 August:1.
Mudau, VN, Ruhiiga, TM & Malan, PW. 2013. A review of efficiency parameters in South Africa’s
municipal solid waste management. Asia Life Science, supplement 9:157–172.
Musademba, D, Musiyandaka, S,Muzinda, A, Nhemachena, B & Jambwa, D. 2011. Municipality
solid waste (MSW) managementchallenges of Chinhoyi Town in Zimbabwe: Opportunities
of waste reduction and recycling. Journal of Sustainable Development in Africa
13(2):148–153.
Munzwa, L 2010. Urban Development In Zimbabwe: A Human Settlement Perspective Number
5(14) February 2010.
Nyakudya, IW& Stroosnijder, L. 2011. Water management options based on rainfall analysis of
rain fed maize (ZEA mays L>) production in Rushinga district, Zimbabwe. Agricultural
Water Management98:1649–1660.
Okot-Okumu, J. 2012. Waste management – An integrated version. International Journal of
Urban and Regional Research 28(4):874–894.
Okot-Okumu, J & Nyenje, R. 2011. Solid waste management in African cities. International
Journal of Urban and Regional Research 28:728–752.
Practical Action Zimbabwe. 2010. Proceedings of emerging issues in urban waste management
workshop, Harare, 10 February.
Puopiel, F. 2010. Solid waste management in Ghana. The case study of Tamale Metropolitan
Area. Thesis in Development Policy and Planning, Kwame Kuruma University, Kumali.

102
Puorideme, D. 2010. Solid waste management in Ghana. Master of Science thesis in
Development Policy and Planning, Kwame Kuruma University, Kumali.
Ruhiiga, TM. 2013a. Managing explosive urbanisation in Africa. Journal of Human
Ecology42(1):43–52.
Ruhiiga, TM. 2013b.Growth of urban agglomeration nodes in Eastern Africa. Journal of Human
Ecology 41(3):237–246.
Seng, B & Seng, H. 2010. Municipal solid waste in Cambodia. Journal of Waste Management
and Research 29:491–500.
Taylor, D& Proctor, M. 2001.Literature review: A few tips for conducting it.
http://www.utoronto.ca/writing/litrev.html (accessed 27 September).
Tapera, R.. The 2013importance of integrated solid ate management in independent Zimbabwe:
The case study of Glenview Area 8, Harare. Global Journal of Biology, Agriculture and
Health Sciences. 33: 68-72.
Tevera, DS . 1991 Solid waste disposal in Harare and it’s effects on the environment: Some
Preliminary Observation: The Zimbabwe Science News. 25(1): 32-34.
United NationsEnvironmental Programme. 1996. Solid waste management. Journal of
Sustainable Development in Africa 2(2)78-92.
United Nations Environmental Programme. 2000. Solid waste management. Journal of
Sustainable Development in Africa18:323-361.
United Nations Environmental Programme.2002. Environmental management in Zimbabwe. A
Geographical Journal in Zimbabwe27:43-47.
United Nations Environmental Programme. 2005. Environmental management in Zimbabwe. A
Journal of Sustainable Development in Africa 19: 173-177.
United Nations Environmental management Proramme.2006. Environmental management in
Zimbabwe. A Journal of Sustainable Development in Africa 22:46-69.
United Nations Environmental management Proramme.2007. Environmental management in
Zimbabwe. A Journal of Sustainable Development in Africa 25: 55-73.
103
United Nations Environmental Programme. 2010. Environmental management in Zimbabwe.
Journal of Sustainable Development in Africa14:201-253.
United Nations Environmental management Programme. 2011. Hazardous substances.
Geographical in Zimbabwe.17(2):53-70.
United States Environmental Protection Agency. 2010.Policies for waste management.
Washington: Public Health Services.
Zimbabwe Central Statistical Office. 2013. Census 2012 Report. Harare: Government Printers.
Zimbabwe Central Statistical Office. 2014. Consumer Report . 15 October 2014.
Waugh, D. 2006.Geography: An integrated approach.Cape Town: McMillan.
World Food Programme. 2013 Food Security in Zimbabwe. Report on state of food security in
Zimbabwe by WFO 18 September 2013.

104
APPENDICES
APPENDIX 1: INTERVIEW SCHEDULE FOR THE DEPARTMENT OF WASTE MANAGEMENT
My name is CastonMahamba. I am a student for the MSc degree in Environmental
Management the University of South Africa. I am conducting research on the characterisation
and management of non-formal solid waste disposal sites in Harare, Zimbabwe.
Could you kindly assist me in gathering information by completing the attached questionnaire?
Information generated will only be for academic purposes and will be treated with a high sense
of confidentiality. Your co-operation will be highly appreciated.
A set of objectives are advanced for this study as follows:
• Measure the locational attributes of non-formal solid waste dumps.
• Analyse the internal linkages of the locational attributes.
• Classify waste by type across the study area.
• Analyse the variations in profiles of waste in the study area.
• Describe current waste management approaches used in Harare.
• Generate advice on sustainable waste management strategies.
SECTION A: MUNICIPAL CAPACITY TO DEAL WITH SOLID WASTE
LEVEL OF EDUCATION OF WASTE MANAGEMENT PERSONNEL
Primary
Secondary
Tertiary
SECTION B: INVENTORY OF EQUIPMENT
105
Skip bins
Refuse trucks
Skip trucks
Tractors
SECTION C: DEPARTMENT OF WASTE MANAGEMENT
(1) How big is the workforce in your department?
(2) How many skip bins do you have and how big are they?
(3) How many waste collection vehicles are servicing the city, for example trucks and tractors.
(4) How do you ensure that the public refrains from illegal dumping?
(5) What problems do you encounter as a city in handling solid waste?
(6) What plans do you have to improve your performance?
SECTION D: MUNICIPAL CAPACITY TO DEAL WITH WASTE
FREQUENCY OF GARBAGE COLLECTION BY THE DEPARTMENT OF WASTE MANAGEMENT
Twice a week
Once a week
Fortnightly
Monthly
Rarely
106
APPENDIX 2:OBSERVATIONPARAMETERS
Observation will be mainly carried out on disposal sites to check the following:
(1) Location of dump sites
(2) Number of dump sites
(3) Types of waste
(4) Composition of solid waste
(5) Size of waste dump
(6) Physical properties of solid waste
(7) Presence of municipal posters discouraging and warning residents about the negative
effects of littering

107
APPENDIX 3: VOLUMES OF WASTE FOR SAMPLED DUMP SITES
DUMP
SITE
CODE
VOLUME OF WASTE IN
KG
SMALL (LESS
THAN 1000KG)
MEDIUM (LESS
THAN 2000
KG)
LARGE (MORE
THAN 2000
KG)
LAND USE
004 2100 High density
034 2300 High density
O43 1300 High density
052 2800 High density
077 1500 High density
083 2100 High density
121 2700 High density
194 3000 High density
195 2000 High density
197 1800 High density
198 1300 High density
202 2000 High density
212 2600 High density
223 3000 High density
224 2700 High density
227 2100 High density
237 2300 High density
238 3300 High density
283 1700 High density
297 3100 High density
317 2900 High density
341 2200 High density
343 1900 High density
345 2800 High density

108
368 1900 High density
372 2300 High density
400 1800 High density
409 3000 High density
412 2700 High density
426 3100 High density
451 1100 Medium
486 800 Medium
487 1000 Medium
494 700 Medium
513 1100 Medium
522 800 Medium
531 2800 High density
544 200 High density
565 2100 High density
576 600 Low density
591 500 Low density
618 800 Low density
619 1000 Low density
326 500 Low density
649 400 Low density
670 500 Low density

109
APPENDIX 4: TYPES OF WASTE FOR SELECTED DUMP SITES
TYPES OF WASTE %
Dump
code
Food Plastic Paper Wood Glass Metals Textile Yard
trimmings
Agricultural Other
004 10.0 20.5 26.0 7.4 8.4 13.4 3.3 1.4 10.0 2.1 100
007 8.2 24.0 27.0 7.0 6.0 14.0 2.8 1.0 8.0 2.0 100
012 9.0 15.0 16.5 12.5 5.5 13.0 3.0 3.0 18.5 4.0 100
025 11.0 13.1 15.0 15.9 5.0 12.0 4.6 4.4 16.0 3.0 100
033 8.8 11.1 16.1 14.0 7.0 17.0 3.5 3.5 17.0 2.0 100
034 9.9 13.0 13.1 11.0 5.0 14.3 4.3 4.4 19.0 6.0 100
043 10.0 10.7 9.1 13.0 4.8 12.1 8.0 8.5 13.5 4.0 100
052 10.0 20.0 26.5 7.0 5.0 12.5 3.0 3.0 10.0 3.0 100
077 8.7 13.2 17.0 12.1 4.9 14.1 4.0 3.9 18.1 4.0 100
083 12.0 21.0 13.4 15.6 5.0 14.7 4.3 3.0 12.0 2.0 100
121 9.9 20.1 15.0 13.5 8.0 12.5 5.0 2.9 11.0 2.1 100
193 11.0 15.7 21.0 11.0 6.3 13.0 4.0 6.2 9.8 3.0 100
194 10.0 20.0 17.0 12.0 7.0 11.0 3.2 4.4 11.4 3.0 100
195 12.0 9.9 17.0 11.1 6.0 15.6 4.0 6.4 12.0 6.0 100
197 10.0 21.0 11.0 15.0 3.8 11.2 6.2 4.8 15.0 2.0 100
202 13.9 14.2 12.7 20.0 5.0 9.9 4.4 0.9 16.0 3.0 100
212 15.0 13.0 11.6 15.4 5.7 12.0 5.7 5.0 12.6 4.0 100
223 11.0 17.0 13.9 13.0 6.1 14.0 3.8 4.0 14.2 3.0 100
234 12.0 11.0 13.0 12.8 5.2 16.0 5.0 2.0 20.0 3.0 100
237 11.0 12.0 18.0 13.0 6.0 13.2 5.8 3.0 14.0 4.0 100
283 13.0 9.5 13.5 10.1 6.6 14.3 5.0 2.0 14.0 3.0 100
297 11.0 21.0 17.2 8.8 5.5 13.5 4.0 3.0 12.0 4.0 100
317 10.0 13.0 21.0 12.4 4.8 12.2 4.7 3.9 15.0 3.0 100
341 13.0 16.0 14.0 11.9 5.8 13.0 4.5 4.5 13.0 4.3 100
343 11.0 1.07 14.0 9.9 4.9 14.1 5.1 4.0 17.0 3.0 100
345 10.0 12.0 15.0 11.3 4.7 16.0 4.9 4.1 20.0 3.0 100
368 9.9 17.0 13.0 11.9 5.0 16.0 4.0 4.2 16.1 2.9 100

110
372 11.8 12.0 18.2 10.8 4.2 13.0 6.0 4.4 13.6 6.0 100
400 14.0 1.2 17.0 11.9 5.1 12.0 6.0 5.0 13.0 4.0 100
409 9.0 16.0 12.6 12.4 5.0 16.0 5.2 4.2 17.6 2.0 100
412 11.4 14.6 11.9 16.0 4.1 12.0 3.3 4.7 18.0 4.0 100
426 10.0 16.0 14.0 12.3 6.2 15.5 3.0 5.0 15.0 3.0 100
451 15.0 11.0 17.6 10.1 5.3 17.0 5.0 2.9 12.1 4.0 100
486 14.9 12.0 16.0 13.1 7.0 13.9 4.1 3.0 12.9 3.1 100
487 12.0 11.9 15.1 14.8 3.2 11.9 5.1 4.2 17.8 4.0 100
494 16.9 13.0 18.0 14.3 3.7 7.0 4.4 5.1 14.6 4.0 100
513 13.0 13.0 17.0 13.1 6.9 12.0 4.2 5.0 12.2 4.6 100
522 14.5 10.0 10.0 14.5 7.2 16.8 7.0 6.0 12.0 2.0 100
531 11.0 15.0 19.0 7.3 5.0 10.3 6.4 5.0 18.0 3.0 100
539 12.0 12.0 16.0 11.2 4.8 11.0 7.0 4.0 17.9 4.1 100
544 23.0 17.0 31.0 6.0 6.3 5.4 6.3 4.3 5.2 3.0 100
565 20.0 22.0 24.0 7.4 3.5 4.1 7.0 5.0 4.0 3.0 100
576 22.0 23.0 21.0 8.0 4.0 5.9 5.1 4.0 5.0 2.0 100
591 25.0 17.0 25.0 7.9 5.1 6.0 4.0 3.1 6.9 4.0 100
613 23.0 26.0 22.0 5.0 4.0 4.8 3.2 4.0 5.0 3.0 100
619 22.0 24.0 26.0 4.2 3.4 5.0 4.0 3.2 6.2 2.0 100
632 20.0 27.0 22.0 5.0 3.9 6.1 6.0 2.0 6.4 1.6 100
647 19.0 26.0 23.8 5.8 4.4 7.0 3.9 3.0 4.1 3.0 100
670 24.0 25.5 24.5 5.9 3.1 3.8 4.2 4.0 3.0 2.0 100

111
APPENDIX 5: ETHICAL APPROVAVAL FROM UNISA

112
APPENDIX 6: AUTHORISATION LETTER FROM THE CITY OF HARARE

113
APPENDIX 7:LETTER OF INTRODUCTION FROM THE UNIVERSITY OF SOUTH AFRICA

114