characterising an intense pm pollution episode in …menut/pp/2017-atmenv-petit.pdf · e atmo...
TRANSCRIPT
lable at ScienceDirect
Atmospheric Environment 155 (2017) 68e84
Contents lists avai
Atmospheric Environment
journal homepage: www.elsevier .com/locate/atmosenv
Characterising an intense PM pollution episode in March 2015 inFrance from multi-site approach and near real time data: Climatology,variabilities, geographical origins and model evaluation
J.-E. Petit a, *, T. Amodeo b, F. Meleux b, B. Bessagnet b, L. Menut c, D. Grenier d, Y. Pellan d,A. Ockler a, B. Rocq e, V. Gros f, J. Sciare f, g, O. Favez b, **
a Air Lorraine, 20 rue Pierre Simon de Laplace, 57070 Metz, Franceb INERIS, rue Jacques Taffanel, 60550 Verneuil-en-Halatte, Francec Laboratoire de M�et�eorologie Dynamique, Palaiseau, Franced Air Rhone-Alpes, 3 all�ee des Sorbiers, 69500 Bron, Francee Atmo Picardie, 22 boulevard Michel Strogoff, 80332 Longueau, Francef Laboratoire des Sciences du Climat et de l’Environnement, CEA/Orme des Merisiers, 91191 Gif-sur-Yvette, Franceg The Cyprus Institute, Energy Environment Water Research Center, Nicosia, Cyprus
h i g h l i g h t s
� A severe particulate matter pollution episode in France has been studied in four sites across the country.� Climatology analysis shows the role of atmospheric variability in the formation of such episode.� Spatial heterogeneities highlight the role of local sources and processes, as well as transboundary transport.� The performance of Chemistry-Transport Model CHIMERE depends on air mass origin.
a r t i c l e i n f o
Article history:Received 8 November 2016Received in revised form5 February 2017Accepted 6 February 2017Available online 8 February 2017
Keywords:AerosolPollutionFranceAerosol chemical speciation monitorACSMAethalometerModel
* Corresponding author.** Corresponding author.
E-mail addresses: [email protected] (O. Favez).
http://dx.doi.org/10.1016/j.atmosenv.2017.02.0121352-2310/© 2017 Elsevier Ltd. All rights reserved.
a b s t r a c t
During March 2015, a severe and large-scale particulate matter (PM) pollution episode occurred inFrance. Measurements in near real-time of the major chemical composition at four different urbanbackground sites across the country (Paris, Creil, Metz and Lyon) allowed the investigation of spatio-temporal variabilities during this episode. A climatology approach showed that all sites experienced clearunusual rain shortage, a pattern that is also found on a longer timescale, highlighting the role of synopticconditions over Wester-Europe. This episode is characterized by a strong predominance of secondarypollution, and more particularly of ammonium nitrate, which accounted for more than 50% of submicronaerosols at all sites during the most intense period of the episode. Pollution advection is illustrated bysimilar variabilities in Paris and Creil (distant of around 100 km), as well as trajectory analyses applied onnitrate and sulphate. Local sources, especially wood burning, are however found to contribute to local/regional sub-episodes, notably in Metz. Finally, simulated concentrations from Chemistry-Transportmodel CHIMERE were compared to observed ones. Results highlighted different patterns dependingon the chemical components and the measuring site, reinforcing the need of such exercises over otherpollution episodes and sites.
© 2017 Elsevier Ltd. All rights reserved.
.eu (J.-E. Petit), olivier.favez@
1. Introduction
Particulate pollution is nowadays subject to extensive studiesnotably due to particulate concentrations that exceed the recom-mended limits and demonstrated health effects on a short- andlong-term perspective (Ramgolam et al., 2009; IARC, 2013). Also,increasing population density within urban areas tends to enhance
J.-E. Petit et al. / Atmospheric Environment 155 (2017) 68e84 69
the exposure to pollution. Worldwide, frequent PM pollution epi-sodes occur, where the North-China Plain (e.g. Zhang et al., 2015)and the Indo-Gigantic Plain (e.g. Chakraborty et al., 2015) experi-ence themost severe and intense ones. In China for example, Huanget al. (2014) have recently highlighted strong specificities (i.e.spatial variability) in urban areas, in terms of chemical composition,and also sources, even if the overall aerosol burden is dominated bysecondary material. France, as well as Western-Europe, isfrequently subject to large-scale PM pollution episodes, notablyduring winter and spring (Bessagnet et al., 2005; Sciare et al., 2011;Favez et al., 2012; Bressi et al., 2013; Waked et al., 2014; Rouïl et al.,2015). The Paris region, being the most densely inhabited region inFrance, has benefited over the years from extensive studies on thechemical characterization of the particulate phase in order to betterunderstand the sources and the formation of aerosol pollution.Intensive campaigns and 1-year daily filter sampling have high-lighted the predominance of ammonium nitrate during pollutionepisodes, and strongly influenced by long-range transportedpollution (70% on average of PM pollution is thought to originateoutside of the Paris region), pointing to large scale episodes inNorth-Western Europe dominated by secondary pollution(Beekmann et al., 2015), which has been also supported from mo-bile (Von der Weiden-Reinmüller et al., 2014) and aircraft (Freneyet al., 2014) measurements over the region during winter andsummer. Long-termmeasurements in near real time between mid-2011 and mid-2013 have emphasized episode-to-episode vari-ability, where significant discrepancies were observed in terms ofsources, meteorological conditions, geographical origins and (trans-)formation processes (Petit et al., 2015), concluding that eachepisode was actually representative of itself only.
However, if global homogeneity is found over the Paris region,little is known about spatial variability at a bigger geographicalscale than the Ile-de-France region, although significant discrep-ancies have already been observed at the national scale from filtermeasurements (Favez et al., 2012; Rouïl et al., 2015). Due to poor
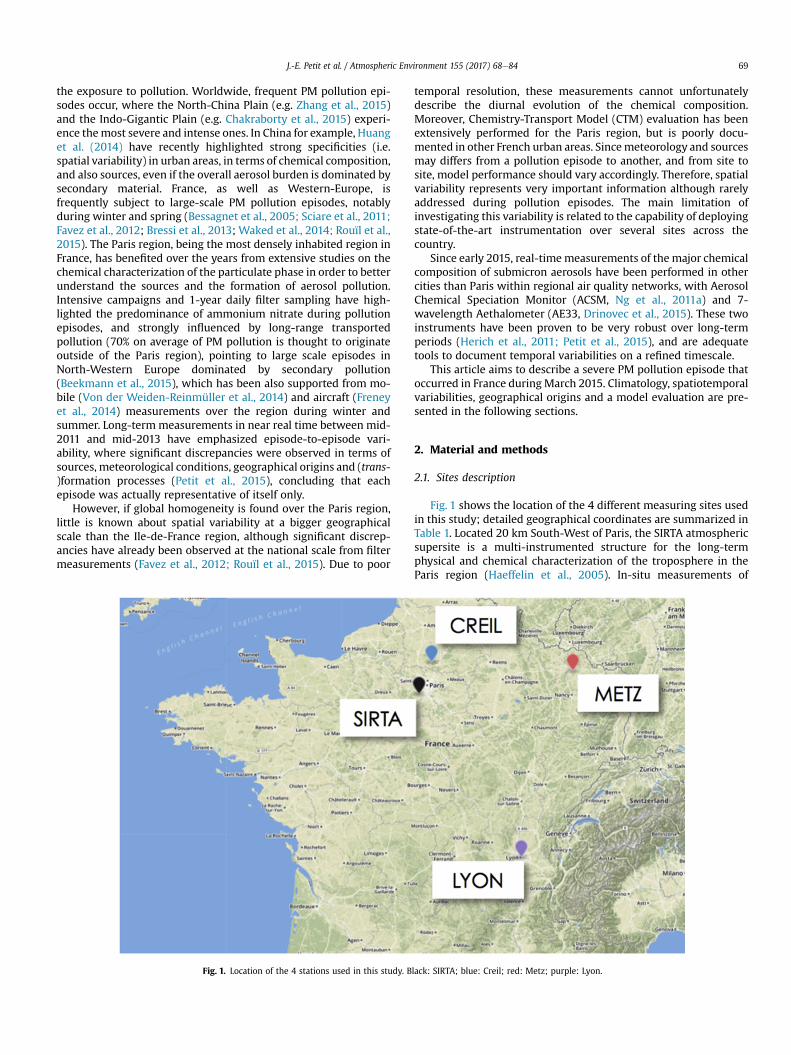
Fig. 1. Location of the 4 stations used in this study. B
temporal resolution, these measurements cannot unfortunatelydescribe the diurnal evolution of the chemical composition.Moreover, Chemistry-Transport Model (CTM) evaluation has beenextensively performed for the Paris region, but is poorly docu-mented in other French urban areas. Sincemeteorology and sourcesmay differs from a pollution episode to another, and from site tosite, model performance should vary accordingly. Therefore, spatialvariability represents very important information although rarelyaddressed during pollution episodes. The main limitation ofinvestigating this variability is related to the capability of deployingstate-of-the-art instrumentation over several sites across thecountry.
Since early 2015, real-timemeasurements of the major chemicalcomposition of submicron aerosols have been performed in othercities than Paris within regional air quality networks, with AerosolChemical Speciation Monitor (ACSM, Ng et al., 2011a) and 7-wavelength Aethalometer (AE33, Drinovec et al., 2015). These twoinstruments have been proven to be very robust over long-termperiods (Herich et al., 2011; Petit et al., 2015), and are adequatetools to document temporal variabilities on a refined timescale.
This article aims to describe a severe PM pollution episode thatoccurred in France during March 2015. Climatology, spatiotemporalvariabilities, geographical origins and a model evaluation are pre-sented in the following sections.
2. Material and methods
2.1. Sites description
Fig. 1 shows the location of the 4 different measuring sites usedin this study; detailed geographical coordinates are summarized inTable 1. Located 20 km South-West of Paris, the SIRTA atmosphericsupersite is a multi-instrumented structure for the long-termphysical and chemical characterization of the troposphere in theParis region (Haeffelin et al., 2005). In-situ measurements of
lack: SIRTA; blue: Creil; red: Metz; purple: Lyon.

Table 1Coordinates and typology of the 4 different sites.
Latitude (�) Longitude (�) Background
SIRTA 48.71 2.15 Regional/semi-urbanCreil 49.26 2.47 UrbanMetz 49.11 6.22 UrbanLyon 45.76 4.85 Urban
J.-E. Petit et al. / Atmospheric Environment 155 (2017) 68e8470
aerosols have continuously been performing there since mid-June2011 (Petit et al., 2015). The 3 other stations, in Creil, Metz andLyon are part of their respective regional air quality network,namely Atmo Picardie (http://www.atmo-picardie.com), Air Lor-raine (http://www.air-lorraine.org) and Air Rhone-Alpes respec-tively (http://air-rhonesalpes.fr). These stations are representativeof urban background air quality. The chemical characterization ofsubmicron aerosols has been continuously performed in Lyon andMetz since early 2015, while in Creil a specific instrumentation hasbeen deployed only from February to April 2015.
2.2. Instrumentation
Recently developed, the Aerosol Chemical Speciation Monitor(Aerodyne Research Inc. Ng et al., 2011a) offers the measurementsof the major chemical composition of non-refractory submicronaerosols. Concentrations of organic matter (OM), nitrate (NO3
�),sulphate (SO4
2-), ammonium (NH4þ) and chloride (Cl�) are deter-
mined at time resolution around 30 min. Briefly, particles aresampled at 3 L/min, and sub-sampled at 0.1 L/min through afocusing lens allowing a submicron aerosol beam to be focused on a600�C-heated vaporizer. Particles are flash-vaporized, and quasi-instantaneously ionized and fragmented by electron impact at70 eV. Produced fragments are separated by a quadrupole analyserbefore their detection; a fragmentation panel (Allan et al., 2004)eventually allows the calculation of chemical species followingtheir fragmentation patterns.
The determination of the response factor of the ACSM is per-formed by injecting generated 300 nm ammonium nitrate particlesinto the ACSM and a Condensation Particle Counter (CPC). The fullprocedure is available in Ng et al. (2011a). Table 2 summarizes theresponse factors and relative ion efficiencies (RIE) used for thedifferent ACSMs. As ammonium sulphate calibration is still subjectto investigation, it was decided here, for consistency, to apply adefault RIESO4 of 1.2 for all ACSMs. This is however confirmed by anoverall neutrality of secondary inorganic aerosols, observed for allsites.
Collection efficiencies (CE) have been corrected following theammonium nitrate mass fraction by the algorithm proposed in
Table 2Response factors and RIEs used for the 4 ACSMs.
Response factor (10�11 A/mg/m3) RIENH4 RIESO4
SIRTA 4.22 5.25 1.2Creil 4.32 6.18 1.2Metz 2.06 8.00 1.2Lyon 5.34 6.41 1.2
Table 3Manually-determined compensation parameters k at SIRTA and Metz.
period k1 k2 k3
SIRTA 14/03e21/03 0.0058 0.0061 0.006METZ 18/03e21/03 0.0041 0.00419 0.004
Middlebrook et al. (2012). An additional CE correction has beenapplied in Metz between 05/03 and 11/03 following the recom-mendation of Alfarra et al. (2007), where a fixed CE of 0.7 was usedduring a wood-burning-dominated episode.
Finally, intercomparability between the chemical speciesmeasured by ACSMs is ensured from a recent intercomparisonexercise that assessed satisfying reproducibility for OM, NO3
�, SO42-
and NH4þ (Crenn et al., 2015). Extended uncertainty of 15, 19, 28 and
36% has respectively been calculated for these species. Althoughmore significant discrepancies are observed for mass fragments(and notably m/z 44), this paper focuses on the variability of thechemical components; the interpretation is thus not subject tothose uncertainties.
Absorption measurements were performed by 7-wavelengthaethalometers (AE33, Magee Scientific). The AE33 model specif-ically uses a Dual-Spot technology enabling the automaticcompensation of the loading effect (Drinovec et al., 2015) over the 7wavelengths, from near UV to near IR. 1-Min Black Carbon (BC) data(at any wavelength) below or equal to 0, or associated with anAngstrom exponent (calculated from the 7 wavelengths, and nottwo as traditionally performed) below 0.75 or above 3, or regres-sion coefficient (r2) below 0.9, were discarded. Possibly due to highscattering, which is not corrected within the AE33, during thepollution episode linked to high ammonium nitrate concentrations,loss of automatic compensation has been observed at SIRTA andMetz during several days. The associated data were thus manuallyre-compensated with fixed k values empirically determined tominimize the jumps between spot changes. Table 3 lists the kcombinations used for the 2 different sites.
BC concentrations were apportioned in Paris, Lyon and Metz,taking advantage of the multi-wavelength measurement of theAE33. Assuming that biomass burning and fossil fuel combustionare the two predominant sources of BC, and that the first cited ismostly responsible of the enhanced absorption observed at near-UV wavelengths, the contribution of the two sources to BC can bedeconvolved (see Sandradewi et al., 2008). Although some limita-tions of this methodology have been observed in India (Garg et al.,2016), it has already been successfully applied in Paris (Sciare et al.,2011; Petit et al., 2014) as well as other cities in France (Favez et al.,2010) and elsewhere (Herich et al., 2011; Briggs and Long, 2016).
One source of uncertainties in this approach is the choice of theAngstrom absorption exponents of fossil fuel and biomass burning(aff and awb, respectively) that may vary from site to site. Here, thesetwo parameters were determined at each site from the diurnaldistribution of the Angstrom exponent. Then, a sensitivity test wasperformed by documenting the impact of small changes in awb andaff by varying the initial values by ± 0.05 with a step of 0.01. Theoptimized exponents are found for a minimum number of BCff < 0(i.e. BCwb > BC) (Table 4). It is to note that these small variations of
k4 k5 k6 k7
25 0.0064 0.00655 0.0069 0.00739 0.0044 0.00443 0.00426 0.00434
Table 4Absorption exponents used at each site for wood burning (wb) and traffic(ff).
awb aff
SIRTA 2 1Metz 1.95 1Lyon 1.85 1.05

J.-E. Petit et al. / Atmospheric Environment 155 (2017) 68e84 71
exponents (a ± 0.05) don't lead to significant discrepancies in termsof concentrations, except for low values (<0.5 mg/m3). The awbvalues listed in Table 4 significantly differ from a recent studywhich recommends 1.68 as more suitable value (Zotter et al., 2016).However, at SIRTA for example, applying this coefficient leads tomuch higher BCwb concentrations (þ115% on average) compared tothe decrease of BCff (�31% on average), and thus to a higheroccurrence of (BCff þ BCwb) > BC.
Urban background PM10 and PM2.5 concentrations were pro-vided at SIRTA from TEOM-FDMS (Tapered Element OscillatingMicrobalancee Filter Dynamics Measurement System) and in Creil,Metz and Lyon from BAM (Beta Attenuation Monitoring) instru-ment. Note that, for Metz, co-located particle mass measurementsat only PM10 were available at the station. This is why PM10 andPM2.5 concentrations were retrieved from another urban back-ground station located 5 km away. Comparison of PM10 at both sitesshows excellent consistency, with slope of 1.02 and r2 of 0.79, for 1-h averages from 01/01/2015 to 18/08/2015.
The instrumentation used in this study are summarized inTable 5.
2.3. Cluster and Concentration-Weighted Trajectory
Since wind direction measured at punctual site is not neces-sarily representative of the supra-regional origin of the air mass,backtrajectories were calculated every 3 h at the 4 measuring sta-tions using the PC-based version of HYSPLIT v4.1 (Draxler, 1999;Stein et al., 2015), using the ending (lon, lat) couples listed inTable 1, and an ending altitude of 100 m above ground level (a.g.l.).Weekly Global Data Assimilation System (GDAS) files with a 1�
resolution were used. Cluster analysis was subsequently applied tothe obtained backtrajectories, and allowed the gathering in moregeneral geographical origin. The optimal number of clusters wasassessed from the total spatial variance (TSV) variation (Elbowapproach). 6, 9, 7 and 7 clusters were respectively used at SIRTA,Creil, Metz and Lyon. Their mean trajectories are represented inFig. 2.
More precise geographical origin work has also been performedby Concentration-Weighted Trajectory (CWT). This approach cou-ples concentration data measured at a receptor site with back-trajectories and helps to localize air parcels responsible for highmeasured concentrations at the receptor site (Ashbaugh et al.,1985). CWT values is computed by:
Cij ¼PN
l Cl$tijltijl
;
where Cij is the estimated concentration in each ijth air parcel, Cl theconcentration measured at tl, N the total number of concentrationvalues, and tijl the residence time (in hour) in each ijth cell of tra-jectory arriving at the receptor site at tl. In order to match the timeresolution of backtrajectories, all concentrations were averagedupon a 3-h basis. Similarly to Waked et al. (2014) and Bressi et al.(2014) for Potential Source Concentration Function (PSCF)
Table 5Summary of instruments used in this study at each site.
SIRTA C
PM1 NR chemical composition ✓ (ACSM) ✓
Black Carbon ✓ (AE33) 7
PM2.5 ✓ (TEOM-FDMS) ✓
PM10 ✓ (TEOM-FDMS) ✓
a As described above, PM concentrations in Metz were retrieved from BAM measurem
calculations, precipitation data have been calculated along trajec-tories and have been used to remove endpoints after rain occurred.Endpoints at altitudes above 3000 m a.g.l. were also discarded.
Trajectory-based approaches conceptually fails to providemeaningful information for pollutants that can have local/regionalcontributions. Removing these signals is particularly difficultwithout comprehensive source apportionment, but is essential toprevent additional noise in the analysis. Here, wind speed valueswere used to discriminate periods when only local/regional emis-sions occur. We empirically chose the 10th percentile value of thewind speed at each site to create a sub-set, where only local/regional pollution is present. The choice of a variable thresholddepending on the site is mainly justified by different dispersionconditions, linked to the surrounding geomorphologies (e.g. see theaverage wind roses Fig. S1). This does not prevent from local con-tributions in the analysis, but does remove the periods where noadvection occurs.
Calculations and graphing have been performed on Igor© withZeFir, an Igor package for the evaluation of the geographical originsof atmospheric pollution (Petit et al., 2017).
2.4. Chemical composition from chemical transport model (CTM)
The chemistry transport model used here to retrieve thechemical composition of submicron aerosols is CHIMERE, largelyused through Prev'air (http://www.prevair.org), the national plat-form of air quality forecasting. The details of the different modulesused in CHIMERE can be found in Menut et al. (2013). Briefly,chemical mechanisms are modelled through MELCHIOR (Lattuati,1997), thermodynamic partitioning is computed from ISORROPIAmodel (Nenes et al., 1998), meteorological parameters are retrievedfrom global GFS data, and refined with MM5 input. Finally, gaseousand particulate emissions are derived from EMEP annual totals, anddownscaled from land-use data for spatially-refined data.
Simulated NO3, SO4, OM, BC, ambient temperature and relativehumidity at Dþ1 are presented in this study. Normalized Mean Bias(NMB) between measured and modelled concentrations arecalculated as:
NMB ¼ 1N
PNi ðmi � oiÞ
o
where mi, oi, N and o respectively represent modelled and observedconcentrations, number of points, and average observedconcentration.
3. Results & discussions
3.1. Climatology
Monthly averaged meteorological parameters (temperature,accumulated rainfall and hours of sunshine) were compared, at allsites, with their monthly normal values at that period of the year.Results are illustrated in Fig. 3. Although the four sites are subject to
REIL LYON METZ
(ACSM) ✓ (ACSM) ✓ (ACSM)✓ (AE33) ✓ (AE33)
(TEOM-FDMS) ✓ (TEOM-FDMS) ✓a
(TEOM-FDMS) ✓ (TEOM-FDMS) ✓a (BAM)
ents from another urban background station.

Fig. 2. Mean Trajectories for each cluster at all measuring sites. The colour of each cluster represents its global geographical origin, and is consistent throughout this paper.
J.-E. Petit et al. / Atmospheric Environment 155 (2017) 68e8472
a different climatology (except Creil and SIRTA which are relativelyclose to each other), the striking feature is a clear rainfall shortageat all sites, from �13% in Lyon to �44% in Creil. This was alsoobserved in the region of Paris during high PM polluted episodes inMarch 2012 and 2013 (Petit et al., 2015), as well as during thepollution episode of March 2014 described in Dupont et al. (2016).Indeed, low rainfalls reduce the removal of particles by wet depo-sition and enhance their persistence within the atmosphere.Moreover, rainfalls were essentially concentrated at the beginningand at the end of the month, letting around 20 dry days at all sites.Consequently, March 2015 was more sunny than usual, except inLyon, which shows a slight shortage close to normal. Thus, tem-perature does not appear here to be the key meteorologicalparameter that controls the formation of this pollution episode, but
Fig. 3. Differences to normal values (calculated over a 30-year period) for differentmeteorological parameters (temperature, rainfall amount and hours of sunshine) at allsites during March 2015.
could however drive the diurnal temporal variability of certainspecies, notably regarding semi-volatile aerosols. This feature isobserved over a wider geographical scale, as Western Europeexperienced precipitation shortage, especially Northern France, theNetherlands, Belgium, Luxemburg,Western Germany and SouthernUnited Kingdom (UK) (Fig. S2a). Large-scale precipitation patternscan be linked to synoptic atmospheric circulation (Jones and Lister,2009). Indeed, March 2015 is associated with a positive sea-levelpressure anomalies (Fig. S2b), between 4 and 6 hPa over these re-gions, and Lavers et al. (2013) have shown the relationships be-tween pressure fields and precipitation at the European scale.
This trend is also observed on a much longer perspective whencorrelating PM10 and precipitation difference to normal from 2007to 2015 (Fig. 4). Normal precipitation values were not available inCreil, but given i) the relative proximity to Paris and ii) the ratherflat orography in this area of the Parisian Basin, we hypothesize thatresults in Creil can be somewhat similar to what is observed inParis. Monthly PM10 ‘normal’ values were calculated from monthlyaverages between 2007 and 2015; due to the implementationwithin monitoring networks of FDMS measurements in 2007, anyprior concentrations are not fully comparable. It globally appearedthat the highest PM10 to normal positive differences (from 8 tohigher than 25 mg/m3) occurred at the highest PM10 concentra-tions, and are associated with unusual rain shortage. Interestingly,these extreme events are observed mostly during spring, except inLyonwhere they are more associated to winter months; suggestingthus different sources and/or atmospheric processes involved.Then, March 2015 in Lyon and Paris is not unusually more polluted,with differences to normal that are close to 0 (around 3 mg/m3 inabsolute value), whereas in Metz appears to be, withþ8.4 mg/m3 ofPM10 difference, among the most heavy-polluted months sinceJanuary 2007.
Long term scenario simulations report that precipitation, morethan temperature, controls the evolution of PM2.5 concentrations

Fig. 4. Monthly PM10 and precipitation differences to normal from January 2007 to September 2015. Colour of marker corresponds to the month of the year, size of the marker to theaverage PM10 concentrations (in mg/m3). The month of March 2015 has a thicker stroke. Mind the differences in X-axes and markers' size scale.
J.-E. Petit et al. / Atmospheric Environment 155 (2017) 68e84 73

J.-E. Petit et al. / Atmospheric Environment 155 (2017) 68e8474
(e.g. Jacob andWinner, 2009; Dawson et al., 2009; Peel et al., 2013).Indeed, it is found that increasing precipitation frequency leads todecreasing PM2.5. Our results, based on surface measurements,meet their conclusions from another angle: most intense pollutionepisodes are mostly associated with unusually dry conditions.Recent climatological studies linked haze pollution episodes inChina with autumnal Artic ice melting (Wang and Chen, 2016), orsynoptic weather patterns (Zhang et al., 2016). In Europe, it hasbeen proven that atmospheric circulation has been the root of anunusually wet month of June 2012 in Western Europe (Yiou andCattiaux, 2013). On the other hand, atmospheric circulationfavouring dry conditions during spring could enhance a risk ofpollution events. Moreover, climatic predictions for France report aslight decrease of precipitation in Northern France (Habets et al.,2013), and an increase of dry spells depending on the scenario(Kovats et al., 2014), leading again to an increased risk of springtimePM pollution episodes due to unfavourable meteorological condi-tions. Pausata et al. (2013) have concluded that the North-AtlanticOscillation Index (NAOI) can be a useful tracer of the impact ofthe change of atmospheric circulation linked with PM pollution.Indeed, variations of precipitation patterns control the evolution ofaerosol concentrations, being thus linked to changes of NAO phases(Pokrovsky, 2009; Jerez et al., 2013). However, in our case andapplied to our dataset, no clear connection between NAOI and PManomalies or rainfall anomalies were found (Fig. S3). A morecomprehensive study, including weather regimes with additionalsites may provide more precise outcomes, similarly to Pope et al.(2015) on NOx data over UK.
3.2. Spatial variability
The box and whiskers plot in Fig. 5 illustrates the statisticaldistribution of the chemical composition retrieved from ACSM andAE33 instruments, where arithmetic mean and maximum, p10, p25,p50, p75 and p90 values were calculated. There absolute values arelisted in Table 6.
Metz exhibits the highest medians for the major chemicalcomponents (OM, NO3, SO4 and NH4), and the highest InterQuartileRange (IQR ¼ p75-p25) for the latter species (respectively 10.38,9.96, 1.61, and 3 mg/m3), indicating very pronounced variability interms of concentrations. Moreover, highest maximumvalues of OM
Fig. 5. Statistical distribution of the chemical composition at 4 sites. 10th, 25th, 50th, 75th, ato the arithmetic mean and maximum values.
and BCwb are also found in Metz; wood burning may thus be astrong pollution source in this area of France. It is however in Creiland at SIRTA that highest maximum nitrate concentrations areobserved (59.4 and 51.7 mg/m3, respectively).
Creil and SIRTA show a very similar distribution with compa-rable median values for all species (except chloride that is foundmuch higher in Creil due to close-by industrial activities). But giventhe fact that Creil is located around 100 km NNE of SIRTA and thatmeasurements at SIRTA are more representative of regional back-ground pollution, this can be whether due to i) homogeneousconcentrations over very large scale and similar meteorologicalconditions, and/or ii) regionally formed ammonium nitrate in theIdF area to compensate atmospheric dilution.
BCff distribution is narrower in SIRTA than in Lyon andMetz, butas mentioned above, SIRTA is less exposed to high urban traffic andis more representative of regional concentrations for BC whencompared to BC measurements downtown Paris (Petit et al., 2014).
3.3. Temporal variability
Temporal variability of the chemical composition of submicronaerosols at all sites is presented in Fig. 6. Additionally, the origin ofthe air mass is illustrated in the background, where each 3-h bincolour corresponds to one cluster, as defined in Fig. 2. Averagecomposition by cluster at each site is presented in Fig. S6. All sitesexhibit the highest PM1 concentrations between March 18th and21st. The average chemical composition during this period showswith a clear predominance of secondary inorganic aerosols (be-tween 60.8 and 71.2% of PM1), and notably ammonium nitrate, at allsites. This meets previous observations in Western Europe duringpollution episode (Putaud et al., 2010; Petit et al., 2015; Beekmannet al., 2015), but also in Asia (Huang et al., 2014) or in United States(e.g. Kim et al., 2010). However, in Metz, high PM1 concentrationsare also observed between March 7th and 11th, dominated byorganic matter (20 mg/m3 in average, representing 45.9% of PM1).Significant amount of BC were also found (4.6 mg/m3 on averageduring this period, with a maximum 30-min value of 21.6 mg/m3),with maximum daily amplitude of 20 mg/m3, which has been rarelyseen in urban background in Europe. In details, BCff makes themajority of BC on average during this period (75%), which isconsistent with what is regularly observed, meaning that traffic is
nd 90th percentiles were used. Black dots and coloured arrows respectively correspond

Table 6Mean, maximum, 10th, 25th, 50th, 75th, and 90th percentiles for each chemical component at all sites.
mean max p10 p25 p50 p75 p90
OM SIRTA 6.2 28.9 0.9 2.1 5.4 9.1 12.9Creil 6.9 40.5 1.2 2.6 5.8 9.6 15.1Lyon 5.9 30 1.9 2.9 4.5 7.6 12.1Metz 9.5 59.8 1.5 3.4 8.1 13.8 22.1
NO3 SIRTA 6.6 54.9 0.2 0.9 5.3 9.2 14.3Creil 6.5 51.7 0.2 0.9 4.1 8.4 14.5Lyon 4.1 34 0.3 0.6 1.7 5 10.5Metz 7.7 31.4 0.4 1.7 6 11.6 17.5
SO4 SIRTA 1.1 8.2 0.1 0.3 0.7 1.5 2.6Creil 1.4 15.6 0.3 0.5 1.1 1.9 3.1Lyon 0.9 7.9 0.2 0.4 0.6 1 1.5Metz 2.6 6.9 0.3 0.6 1.1 2.2 3.6
NH4 SIRTA 2.1 14.3 0.1 0.4 1.6 2.9 4.9Creil 2.1 12.6 0.2 0.6 1.7 3 4.6Lyon 1.3 11.6 0.1 0.3 0.7 1.5 3.2Metz 1.6 10.6 0.3 0.7 2.2 3.7 5.4
Cl SIRTA 0.1 0.7 0 0 0.1 0.2 0.3Creil 0.4 8.5 0.1 0.2 0.3 0.5 0.9Lyon 0.1 4.1 0 0 0.1 0.1 0.2Metz 0.2 5.8 0 0.1 0.2 0.3 0.4
BCff SIRTA 0.6 4.2 0.1 0.1 0.3 0.7 1.2Creil e e e e e e e
Lyon 1.4 10.6 0.3 0.6 1 1.7 3.1Metz 1.8 4.7 0.2 0.4 0.9 1.6 2.7
BCwb SIRTA 0.2 1.3 0 0.1 0.2 0.5Creil e e e e e e e
Lyon 0.3 2 0.1 0.1 0.2 0.6Metz 0.5 17.3 0.1 0.2 0.3 0.9
J.-E. Petit et al. / Atmospheric Environment 155 (2017) 68e84 75
still a major source of BC. But BCwb went up to 4.7 mg/m3,emphasizing the role of local/regional emissions such as woodburning. Fresh wood-burning-related concentrations is supportedby distribution of the fraction of m/z60 (denoted f60) and m/z44(f44) (Cubison et al., 2011). Indeed, m/z60, related to the C2H4O2
þ ion(Schneider et al., 2006; Alfarra et al., 2007), is usually used as a keytracer of Biomass Burning Organic Aerosol (BBOA), while m/z44 canbe a surrogate of Secondary Organic Aerosol (SOA). This period ischaracterized by significantly lower f44 and higher f60 than the restof the dataset (Fig. 7), which is characteristic of freshwood-burningemissions (Cubison et al., 2011; Ortega et al., 2013). Low tempera-tures and wind speeds (average of 5.2 �C and 0.67 m/s, respec-tively), combined with the orography of the Moselle valley werefavourable to the local/regional pollution built-up during thisperiod. This 4-day episode clearly contributed to the PM “anomaly”for March 2015, as described in Section 3.1. Also, the differencebetween predicted NH4 (from ion balance) and measured NH4shows in Metz a clearly positive bias during this period (Fig. 8a andb). There might be several reasons for such as phenomena,including the presence of sulphate in the forms of H2SO4 orNH4HSO4 (Zhang et al., 2007). However, North of France isconsidered as displaying excess NH3, especially in this period of theyear (e.g., Fortems-Cheiney et al., 2016; Petetin et al., 2016), so thatwe can assume H2SO4 and NH4HSO4 (as well as HNO3) to be quitelimited in the particulate phase. Another possibility might be thesignificant presence of organonitrate (ON) causing “virtual” nitrateconcentrations within ACSM measurements (Farmer et al., 2010).Assuming that the positive bias between predicted and measuredammonium is entirely due to ON only, its concentration can be re-calculated (Farmer et al., 2010). During the wood-burning-dominated sub-episode, ON would then have reached significantconcentrations, oscillating around 5 mg/m3, representing onaverage 29% of total nitrate (Fig. 8c). As highlighted by Kiendler-Scharr et al. (2016) in Europe, this result emphasizes the role ofNO3-based oxidation processes in the formation of secondaryorganic aerosols. Moreover, enhanced concentrations are observed
during the evening and the night, and to a lesser extent during theearly morning, suggesting quick formation of radical NO3.
Then, temporal variabilities observed in Creil and SIRTA differsfromwhat is observed in Lyon or Metz, with a pronounced diurnalprofile. The 2 sites have also strong co-variability, in terms ofchemical composition and meteorological conditions (T, RH and airmass). Indeed, the sum of the Pearson coefficient r2 with theseparameters (
P
ir2i where i¼ {OM, NO3, SO4, T, RH, cluster}) between
the 2 sites is equal to 4.3, with individual r2 being always above 0.6.This contrasts with the value of 2.25, 2.15, and 2.29 obtained whencomparing SIRTA and Metz, SIRTA and Lyon, and Metz and Lyon,respectively. Thus, the pollution episode experienced within theParisian Basin is rather homogeneous, and in these conditions,measurements performed at SIRTA are representative of a largegeographical zone. The “sawtooth” pattern, characterized asintense daily cycles of PM dominated by secondary inorganicaerosols, is somewhat similar to what is usually observed duringpollution episodes in China (Jia et al., 2008; Li et al., 2016), and isexplained by synoptic cycles, especially the passage of cold fronts.Increasing background, feature associated with these pollutionepisodes, is however not seen in our case; but, interestingly, thedaily PM1 amplitude is progressively increasing, with a 24-hmaximum amplitude going up to 103 and 92 mg/m3 at SIRTA andCreil, respectively. Also, a dense cloud layer has been observed overNorthern France between 19/03 and 21/03 (Figs. S3), limiting theamount of sunshine, and thus the convective potential of loweratmospheric layers.
Aerosol aging can be highlighted during this pollution episodewhen comparing organic f44 versus f43 (Ng et al., 2011b) averageschange from a period to another (Fig. 9). Within Oxidized OrganicAerosols (OOA), m/z 44 is mostly relative to acids and acid-derivedcompounds (Duplissy et al., 2011), while m/z 43 mainly refers toC2H3Oþ and originates from non-acid oxidation products. Crennet al. (2015) and Fr€ohlich et al. (2015) have shown a large vari-ability in f44 signals between ACSMsmaking the intercomparabilityprone to non-negligible uncertainties; however, it doesn't prevent

Fig. 6. Temporal variability of the chemical composition measured in SIRTA, Creil, Lyon and Metz. Mind the different scales for BC. Background colours refer to air mass clusters,defined in Section 2.
J.-E. Petit et al. / Atmospheric Environment 155 (2017) 68e8476

Fig. 7. f44 vs f60 plot in Metz. Marker size is function of OM concentrations.
J.-E. Petit et al. / Atmospheric Environment 155 (2017) 68e84 77
from interpreting the change of this ratio from a single instrument.Also, Pieber et al. (2016) have recently pointed out f44 contributionsfrom ammonium nitrate which could cause an overestimation ofthe m/z signal, and accordingly proposed a correction in the frag-mentation table based on calibration data. Tests on ACSMs of SIRTAand Metz showed very little influence of this artefact: indeed,comparison of f44 with and without correction gave slopesrespectively equal to 1.0014 and 0.9998, with r2 higher than 0.99.Two distinct periods, March 13e14-15 and March 18e19-20, wereused to calculated average organic fractions (Fig. 9). All sites haveaverage f44 at least higher than 0.15, meaning that f44 is duringthese periods more relative of OOA rather than Hydrocarbon-likeOrganic Aerosol (HOA) (Ng et al., 2011b). SIRTA and Creil exhibit asubstantial change in particulate organic composition, since f44 hasincreased values during the most intense part of the pollutionepisode, concomitantly with a decrease of f43. This is characteristicof an increase of O:C ratio and also the contribution of Low-Volatility Oxidized Organic Aerosol (LV-OOA). This change
Fig. 8. a) Temporal variations of the difference between predicted NH4 from ionic balance anthe date, the black box refers to the period from 06/3 to 10/03; c) calculated organonitrate
supports the finding of Morgan et al. (2010), where flights overEurope have highlighted significant transformation occurred,especially regarding secondary organic aerosols. The geographicalcoverage of this study does not offer the possibility to determinewhere these oxidation processes occurred, but the observed sig-nificant change in f43 vs f44 space occurred when the origin of airmasses also changes from NE to N. Given the relatively high windspeeds (average of 11.1 km/h between 18/03 and 21/03 at SIRTA),this indicates advection of aged aerosols over the Parisian basin.Interestingly, no change is noticeable in Lyon and Metz, suggestingthat submicron organic aerosol composition have remained rela-tively constant, or, at least, with the same oxidation properties.Metz and Lyon have therefore been less impacted by long-rangeadvection.
The PM1 fraction dominates PM10 at all sites, representingaround 66%, 61% and 56% on average respectively in SIRTA, Metzand Lyon, but the other interesting feature also lies in the increaseof the fraction between 1 and 2.5 mmduring the episode. PM1 is thesum of all chemical components measured by both ACSM andAE33; PM2.5 and PM10 were retrieved from TEOM-FDMS mea-surements (Fig. 10). PM1-2.5 and PM2.5-10 are thus calculated bydirect subtraction. At SIRTA, this increase started on March 16thand stayed rather constant throughout the episode, while itappeared in Metz on March 19th. It is another indicator of signifi-cant aging of aerosols. The rather flat pattern of PM1-2.5 over the dayin Lyon and SIRTA should be related to rather low volatile com-pounds. Suggested from Fig. 8, organic matter in this fraction couldbe more oxidized, although no direct measurements can supportthis hypothesis. Lyon experienced poor variations in f44 compara-tively to f43, concomitantly with PM1-2.5 fraction being fairly con-stant in terms of contribution.
3.4. Geographical origins
From above results, concentrations measured at SIRTA duringthis large scale episode can be representative of a large geograph-ical window in the Parisian basin. However, since no BC data areavailable in Creil, Creil data will not be considered hereinafter.
d measured NH4; b) predicted NH4 versus measured NH4. Markers are colour-coded bys and inorganic nitrate; d) average diurnal variation of calculated organonitrates.

Fig. 9. Change of f44 relatively to f43 at all sites between March 13e14-15 and March18e19-20. Error bars are ± 1s.
J.-E. Petit et al. / Atmospheric Environment 155 (2017) 68e8478
Fig. 11 presents the results of the CWT analysis on NO3 and SO4in SIRTA, Lyon and Metz. 3-h concentration data were used, whichresult in a 240-point dataset for each site. The temporal variabilitiesdescribed in Section 3.2. ensure the statistical representativeness ofthe results. Two maps are merged together for each pollutant ateach site: “Total” refers to the entire dataset, while “local/regional”corresponds to a subset associated to low wind speed.
For sulphate, CWT strengthens the rather advected patterncommonly observed in Western Europe. Indeed, Pay et al. (2012)have shown that Belgium, Netherlands and Western Germany arean intense and wide-spread zone of SO2 emissions. Bressi et al.(2014) and Waked et al. (2014) have also shown that SO4 concen-trations, respectively measured in Paris (France) and Lens (France),are largely influenced by these regions. Here, the striking feature
Fig. 10. Temporal variations of PM1, PM1-2.5 and PM2.5-10 fractions
lies in the fact that no similarities in terms of geographical originare found at SIRTA, Metz and Lyon, meaning that they are impactedby different air parcels, and thus potentially by different kind ofsources. This is of prime interest because it reinforces the idea ofsite-to-site discrepancies, and shall be linked to the top-oclimatology. Indeed, for SIRTA, a clear hotspot is localized aroundthe mouth of the Rhine River, where intense shipping and indus-trial activities (notably petrochemical refining) occur. Whereas forMetz, emissions, which could originate from Eastern Germany/Northern Czech Republic, and probablyWestern Poland, potentiallyfrom coal-fired power stations, may be highlighted. These regionsare identified as strong SO2 emitters, from the 2005 Europeanemission inventory (http://www.eea.europa.eu/data-and-maps/figures/so2-annual-average-2005) and Pay et al. (2012). Finally,for Lyon, estimated concentrations follow a quasi-straight patternthrough the Rhone, Moselle and Ruhr valley, the latter one hostingheavy industrial activities. Contributions of local/regional concen-trations are relatively low, especially at SIRTA, which is consistentwith the advected pattern of SO4. Higher contributions areobserved in Metz and Lyon (up to around 1 mg/m3), probably due toa higher persistence of air masses in these regions, which allowsthe formation of ammonium sulphate on a regional scale.
Similar maps are obtained for nitrate, which highlight one of thelimits of trajectory analyses applied to secondary pollutants,especially on particulate nitrate and sulphate, because these twocompounds have a different formation chemistry, and the sourcesof their precursors may differ. This result is observed mainlybecause nitrate and sulphate concentrations are relatively wellcorrelated in time: r2 of 0.76, 0.59 and 0.89 are respectivelyobserved at SIRTA, Metz and Lyon when comparing nitrate andsulphate timeseries. High concentrations of both compounds arethus attributed to the same backtrajectories. Pay et al. (2012) stillreport high NOx emissions in Northern Belgium and Netherlands,so even if the sources are different, a conjoint emission zone isconceivable. The most interesting feature for nitrate lies in the factthat contributions at lowwind speeds are much higher, going up toaround 7, 10 and 7 mg/m3 in SIRTA, Metz and Lyon, respectively,being around 40%, 80% and 45% of the total. This emphasizes a
in SIRTA, Lyon and Metz between 13/03/2015 and 23/03/2015.

Fig.
11.CW
Tmap
sforSO
4an
dNO3,at
SIRT
A,M
etzan
dLyon
.“To
tal”
istheen
tire
dataset;“loc
al/reg
iona
l”is
thesu
bset
associated
withlow
windsp
eedva
lues.S
cale
size
sfor“loc
al/reg
iona
l”areprop
ortion
al.L
og(tþ1
)represen
tthe
trajectory
dens
ity(occurrenc
eof
back
trajectory
endp
ointswhich
fallinto
apa
rticular
cell(colorba
rha
sno
unit).
J.-E. Petit et al. / Atmospheric Environment 155 (2017) 68e84 79

J.-E. Petit et al. / Atmospheric Environment 155 (2017) 68e8480
significant role on average of local/regional formation of ammo-nium nitrate, especially in the region of Metz.
Forcing backtrajectories with local/regional concentrationsrepresents a unique opportunity to evaluate their impacts on thetotal result. For example, at SIRTA, highest concentrations of “localsignal” are displayed on the South-East of the receptor site, and isthe consequence of the path of the associated trajectories. PreviousPSCF results for Paris, published in Bressi et al. (2014) have shownpotential areas for road traffic and biomass burning located on theSouth of Paris; in Lens, Waked et al. (2014) have shown biomassburning on the SE, although these sources are believed to be quitelocal. Thus, these observations could just be the outcome ofenhanced measured concentrations during stagnant air masses,and should not necessarily be representative of the highlighted airparcels. This finally emphasizes the need of removing these periodsfrom any trajectory-based approach, which can be done with awind speed threshold, or by prior identification of trajectory clus-ters; and would also need to be cross-validated by emission sce-narios through CTMs.
3.5. Model evaluation
Fig. 12 presents the Normal Mean Bias and correlation r valuesfor each major chemical component at each site. Although pre-sented here for the sake of consistency, discrepancies observed forOM will not be discussed, as simulated concentrations were ob-tained with a CHIMERE simulation issued from the PREV’AIRforecasting system (Rouil et al., 2009), excluding the Volatility-BasisSet, introduced by Zhang et al. (2013). The volatility of PrimaryOrganic Aerosol as well as aging of semi-volatile organic com-pounds are thus not taken into account, mainly because theemissions of these species are very uncertain. In Europe, the mainlack is probably attributed to wood burning emissions; Denier vander Gon et al. (2015) proposed an updated version of the Europeaninventory doubling at least the organic matter emissions fromresidential emissions compared to standard official emissions ifSVOC emissions are included. Previous model evaluation exerciseson organics have already highlighted strong underestimation,linked to the amount of Secondary Organic Aerosols (Bessagnetet al., 2016). To perform such a work, prior organic source
Fig. 12. Normalized Mean Bias (NMB) and Pearson coefficients (r) between observed and moand Metz.
apportionment is critical, and should thus be presented in anotherdedicated study.
Black carbon is strongly overestimated at SIRTA by more than60%, correlating with previous evaluations at SIRTA that havealready been reported by Petetin et al. (2014, 2015) for the entireParis region and by Sciare et al. (2011) in downtown Paris during aspringtime pollution episode, and Zhang et al. (2013) during theMEGAPOLI campaign. At the same time, BC is inversely stronglyunderestimated at Metz and Lyon (�79.1% and �68.5% respec-tively). Diurnal variations (Fig. S9) shows however satisfying cor-relation with a bimodal pattern, linked to daily commuting (i.e.traffic) with the evening peak being enhanced by wood-burningemissions; R values for the entire dataset are between 0.5 and0.74. Therefore, if a homogenous error is made on emission factorsat the national scale, the discrepancies observed here shall berelated to a misknowledge of source activities (mainly traffic andwood-burning).
NMB values for nitrate range from �4.8% to �18%, which issatisfactory given the complexity of nitrate formation, and thatammonium nitrate is the major compound of submicron aerosolduring most pollution episodes in these periods. From diurnalvariations, night-times formation is also well simulated at all sites,meaning that the chemical processes governing the formation ofammonium nitrate are well described by the model. In Paris, theregional contribution of nitrate has been previously found to beoverestimated over Paris region on an annual basis (Petetin et al.,2014). Here, the highest concentrations appear to be under-estimated by about 10e30 mg/m3 in absolute values (Fig. S7),although temporal homogeneity in the chemical composition overthe Parisian Basin, trajectory analysis and f44 vs f43 space underlinea significant advected pattern in this region. Nitrate underestima-tion have been shown during a springtime pollution episode withcontinental influence in 2007 in the Paris area (Sciare et al., 2011)and also in Bessagnet et al. (2005). This is similar to significantdiscrepancies observed in pollution episodes between 2011 and2013 in terms of meteorology, chemical composition and variability(Petit et al., 2015), and that model performance for nitrate may beepisode-dependent. Another dependence may be the origin of airmasses, because they are associated with specific meteorologicalconditions, chemical transformations and long-distance sources.
delled concentrations of NO3 (blue), SO4 (red), OM (green) and BC (black) at SIRTA, Lyon

Fig.
13.NMBva
lues
(bars)
andav
erag
eco
ncen
tration(stick
andmarke
rs)of
NO3an
dSO
4follo
wingthedifferen
tairmassoriginsof
Fig.
2.
J.-E. Petit et al. / Atmospheric Environment 155 (2017) 68e84 81
Fig. 13 illustrates the influence of the air mass origin on the per-formance of the model (NMB statistic for NO3 and SO4 datasets,divided by the different clusters). Large NMB values are shown foroceanic air masses, but are usually associated with low concen-trations in average, making the absolute bias low. The missingcoarse nitrate processes in the model could explain the over-estimation of ammonium nitrate formation under westerly windconditions, sodium should compete with ammonium to producecoarser particles that have shorter life time. Following other morepolluted air masses (from N to E), model performance changes,without any pattern from a sampling site to another one: Northerncluster is associated to an underestimation of NO3 at SIRTA and inMetz (�50% and �40%, respectively), while it is overestimated inLyon (þ42%). In Metz, nitrate was relatively well simulated duringthe episode at the beginning of the month, which were character-ized by stagnant air masses, low temperatures, and a predominanceof local sources (Fig. S7). However, the performances are signifi-cantly impaired from March 19th to 21st, where the advection andaging processes occurred. These results are in line with Bessagnetet al. (2014) who reported a general underestimation of nitrateconcentrations for the highest values, and an overestimation of thelowest concentrations, leading to global good performance onaverage.
Similarly to nitrate, modelled sulphate agrees relatively wellwith observations, NMB ranging from �26.1% in Lyon to þ13% atSIRTA. CHIMERE also failed at reconstructing SO4 concentrations inLyon during the most intense part of the pollution episode;explaining the poor time correlation coefficient of 0.22 at this sitefor this pollutant. Diurnal variations also display a systematic trendfor modelled SO4 (Fig. S8), with a substantial increase during themorning, and continuous slight decrease during the afternoon,contrasting with the rather flat pattern of the observed concen-trations. This may be linked to SO2 diurnal emissions used inCHIMERE (not shown here) that also exhibit such an increase.
4. Conclusion
The present study investigates, for the first time in France, thespatiotemporal variability of an intense PM pollution episode,which occurred during March 2015. State-of-the-art instrumenta-tion provided near real-time information of the chemical compo-sition of submicron aerosols at four different sampling sites acrossthe country (Paris, Creil, Lyon and Metz).
The first noticeable feature of this episode is the low amount ofrainfall compared to normal at all sites. Rain shortage have beenalso associated with most of unusual PM10 monthly concentrationsduring spring since 2007. Previous climatological studies haveshown that precipitation frequency, more than temperature, con-trols the evolution of PM concentrations over time; we showedhere the influence of springtime droughts, which are linked to PMexceedances through pollution episodes. Moreover, climatic pre-dictions appear to be unfavourable, and could facilitate a bit morethe formation of pollution episodes in France during spring;meaning that additional efforts on emission controls would need tobe made in order to thwart this risk factor. This is one of the fewclimatology analysis applied to PM pollution episode in France, oreven in Europe, therefore this kind of study would need to beextended to a wider spatiotemporal scale.
This PM pollution episode can be considered as large-scalebecause the increase of PM concentration was observed nation-wide at around the same moment. More specifically, ammoniumnitrate dominated the PM1 chemical composition during most ofthe episode, which is a feature that is now commonly observed inWestern Europe during spring. From trajectory analyses, we haveshown that transboundary advection had a clear influence on

J.-E. Petit et al. / Atmospheric Environment 155 (2017) 68e8482
NH4NO3 measured in Paris and Creil, still emphasizing interna-tional efforts of cooperation to better constrain our understandingof pollution formation. Also, aerosol aging was highlighted throughthe increase, in SIRTA, Lyon and Metz, of the contribution of thePM1-2.5 fraction. In Metz and SIRTA, the periods when PM1-2.5respectively increased also correspond to the periods when loss ofautomatic compensation with AE33 measurements were observed.There shall be no causal link between these two facts at this stage,but should be further investigated, especially regarding thechemical composition of this PM fraction.
If homogeneity is found at SIRTA and Creil regarding chemicalcomposition and temporal variations (sawtooth patternwith strongdaily variations), it significantly differs from what was observedelsewhere. In particular, a strong sub-episode occurred in Metzduring early March, when chemical compositionwas dominated byorganic matter and black carbon. f60 vs f44 distribution, and highBCff concentrations, respectively emphasize the role of primarylocal sources, such as wood burning and traffic, during large scalepollution episodes.
Finally, performance of CHIMERE has been evaluated on theselected species (nitrate, sulphate, organic matter and black car-bon). Results on secondary inorganics are very satisfactory onaverage, but hide significant discrepancies from site to site, and alsoexhibit a dependence on the air mass origin. For instance, nitrate atSIRTA is on average very well modelled, with a normalized meanbias of �4.8%, but weaker performance is observed i) during pe-riods associated with transboundary transport, and ii) in Lyon,where the episode stayed completely unseen. For carbonaceousspecies, while model performance with organic matter should beperformed after source apportionment, BC still reflects a lack ofknowledge of the activity and emission factors of certain source,and that these information need to be geographically refined,because site-to-site variability is also observed. The impact ofemission inventories, especially regarding secondary pollutantslike ammonium nitrate and sulphate, should be further investi-gated on a larger temporal scale (e.g. a year), with European, na-tional and/or regional inventories.
On a broader perspective, this study suggests the need ofspatially resolved real-time data of PM chemical composition.Through the rapid deployment of ACSM and AE33 instruments inFrance, but also in Europe, and international collaborative efforts,atmospheric phenomenon like transboundary pollution advectionshould be better documented and constrained over a continentalscale. Through large scale evaluations or real-time data assimila-tion, these in-situ measurements are also great opportunities forbuilding strong connections with modelling studies, which areessential for air quality forecasting but also in our understanding ofspecific formation processes.
Acknowledgements
The authors gratefully acknowledge the regional associations forair quality monitoring for having provided the real time data. Thefirst author is also thankful to Luka Drinovec and Grisa Mocnik fromAerosol d.o.o. for their help on the AE33 data. CEA, CNRS and theIle-de-France region are acknowledged for financial support to theaerosol measurements at the SIRTA station. Both reviewers arefinally acknowledged for having significantly contributed to theimprovement of this article. This work was partly funded by theFrench Ministry of Environment (“Bureau de l’Air du Minist�ere del’Ecologie, du D�eveloppement durable, et de l’Energie”) andincluded in the CARA air quality monitoring and research projectcoordinated by the French reference laboratory for air qualitymonitoring (LCSQA).
Appendix A. Supplementary data
Supplementary data related to this article can be found at http://dx.doi.org/10.1016/j.atmosenv.2017.02.012
References
Alfarra, M.R., Prevot, A.S.H., Szidat, S., Sandradewi, J., Weimer, S., Lanz, V.A.,Schreiber, D., Mohr, M., Baltensperger, U., 2007. Identification of the massspectral signature of organic aerosols from wood burning emissions. Environ.Sci. Technol. 41 (16), 5770e5777.
Allan, J.D., Delia, A.E., Coe, H., Bower, K.N., Alfarra, M.R., Jimenez, J.L.,Middlebrook, A.M., Drewnick, F., Onasch, T.B., Canagaratna, M.R., Jayne, J.T.,Worsnop, D.R., 2004. A generalised method for the extraction of chemicallyresolved mass spectra from Aerodyne aerosol mass spectrometer data.J. Aerosol Sci. 35 (7), 909e922. http://dx.doi.org/10.1016/j.jaerosci.2004.02.007.
Ashbaugh, L.L., Malm, W.C., Sadeh, W.Z., 1985. A residence time probability analysisof sulfur concentrations at Grand Canyon National Park. Atmos. Environ. 19 (8),1263e1270, 1967.
Beekmann, M., Pr�evot, A.S.H., Drewnick, F., Sciare, J., Pandis, S.N., Denier van derGon, H.A.C., Crippa, M., Freutel, F., Poulain, L., Ghersi, V., Rodriguez, E., Beirle, S.,Zotter, P., von der Weiden-Reinmüller, S.-L., Bressi, M., Fountoukis, C.,Petetin, H., Szidat, S., Schneider, J., Rosso, A., El Haddad, I., Megaritis, A.,Zhang, Q.J., Michoud, V., Slowik, J.G., Moukhtar, S., Kolmonen, P., Stohl, A.,Eckhardt, S., Borbon, A., Gros, V., Marchand, N., Jaffrezo, J.L., Schwarzenboeck, A.,Colomb, A., Wiedensohler, A., Borrmann, S., Lawrence, M., Baklanov, A.,Baltensperger, U., 2015. In-situ, satellite measurement and model evidence fora~dominant regional contribution to fine particulate matter levels in the ParisMegacity. Atmos. Chem. Phys. Discuss. 15 (6), 8647e8686. http://dx.doi.org/10.5194/acpd-15-8647-2015.
Bessagnet, B., Hodzic, A., Blanchard, O., Lattuati, M., Lebihan, O., Marfaing, H.,Rouil, L., 2005. Origin of particulate matter pollution episodes in wintertimeover the Paris Basin. Atmos. Environ. 39 (33), 6159e6174. http://dx.doi.org/10.1016/j.atmosenv.2005.06.053.
Bessagnet, B., Pirovano, G., Mircea, M., Cuvelier, C., Aulinger, A., Calori, G., Ciarelli, G.,Manders, A., Stern, R., Tsyro, S., García Vivanco, M., Thunis, P., Pay, M.-T.,Colette, A., Couvidat, F., Meleux, F., Rouïl, L., Ung, A., Aksoyoglu, S.,Baldasano, J.M., Bieser, J., Briganti, G., Cappelletti, A., D'Isidoro, M., Finardi, S.,Kranenburg, R., Silibello, C., Carnevale, C., Aas, W., Dupont, J.-C., Fagerli, H.,Gonzalez, L., Menut, L., Pr�evot, A.S.H., Roberts, P., White, L., 2016. Presentation ofthe EURODELTA III intercomparison exercise e evaluation of the chemistrytransport models' performance on criteria pollutants and joint analysis withmeteorology. Atmos. Chem. Phys. 16 (19), 12667e12701. http://dx.doi.org/10.5194/acp-16-12667-2016.
Bressi, M., Sciare, J., Ghersi, V., Bonnaire, N., Nicolas, J.B., Petit, J.-E., Moukhtar, S.,Rosso, A., Mihalopoulos, N., F�eron, A., 2013. A one-year comprehensive chemicalcharacterisation of fine aerosol (PM2.5) at urban, suburban and rural back-ground sites in the region of Paris (France). Atmos. Chem. Phys. 13 (15),7825e7844. http://dx.doi.org/10.5194/acp-13-7825-2013.
Bressi, M., Sciare, J., Ghersi, V., Mihalopoulos, N., Petit, J.-E., Nicolas, J.B.,Moukhtar, S., Rosso, A., F�eron, A., Bonnaire, N., Poulakis, E., Theodosi, C., 2014.Sources and geographical origins of fine aerosols in Paris (France). Atmos.Chem. Phys. 14 (16), 8813e8839. http://dx.doi.org/10.5194/acp-14-8813-2014.
Briggs, N.L., Long, C.M., 2016. Critical review of black carbon and elemental carbonsource apportionment in Europe and the United States. Atmos. Environ. 144http://dx.doi.org/10.1016/j.atmosenv.2016.09.002.
Chakraborty, A., Bhattu, D., Gupta, T., Tripathi, S.N., Canagaratna, M.R., 2015. Real-time measurements of ambient aerosols in a polluted Indian city: sources,characteristics, and processing of organic aerosols during foggy and nonfoggyperiods: real-time submicron aerosol properties. J. Geophys. Res. Atmos. 120(17), 9006e9019. http://dx.doi.org/10.1002/2015JD023419.
Crenn, V., Sciare, J., Croteau, P.L., Verlhac, S., Fr€ohlich, R., Belis, C.A., Aas, W.,€Aij€al€a, M., Alastuey, A., Arti~nano, B., Baisn�ee, D., Bonnaire, N., Bressi, M.,Canagaratna, M., Canonaco, F., Carbone, C., Cavalli, F., Coz, E., Cubison, M.J.,Esser-Gietl, J.K., Green, D.C., Gros, V., Heikkinen, L., Herrmann, H., Lunder, C.,Minguill�on, M.C., Mo�cnik, G., O'Dowd, C.D., Ovadnevaite, J., Petit, J.-E.,Petralia, E., Poulain, L., Priestman, M., Riffault, V., Ripoll, A., Sarda-Est�eve, R.,Slowik, J.G., Setyan, A., Wiedensohler, A., Baltensperger, U., Pr�evot, A.S.H.,Jayne, J.T., Favez, O., 2015. ACTRIS ACSM intercomparison e Part 1: reproduc-ibility of concentration and fragment results from 13 individual QuadrupoleAerosol Chemical Speciation Monitors (Q-ACSM) and consistency with co-located instruments. Atmos. Meas. Tech. 8 (12), 5063e5087. http://dx.doi.org/10.5194/amt-8-5063-2015.
Cubison, M.J., Ortega, A.M., Hayes, P.L., Farmer, D.K., Day, D., Lechner, M.J.,Brune, W.H., Apel, E., Diskin, G.S., Fisher, J.A., Fuelberg, H.E., Hecobian, A.,Knapp, D.J., Mikoviny, T., Riemer, D., Sachse, G.W., Sessions, W., Weber, R.J.,Weinheimer, A.J., Wisthaler, A., Jimenez, J.L., 2011. Effects of aging on organicaerosol from open biomass burning smoke in aircraft and laboratory studies.Atmos. Chem. Phys. 11 (23), 12049e12064. http://dx.doi.org/10.5194/acp-11-12049-2011.
Dawson, J.P., Racherla, P.N., Lynn, B., Adams, P.J., Pandis, S.N., 2009. Impacts ofclimate change on regional and urban air quality in the eastern United States:Role of meteorology. J. of Geophys. Res 114, D05308. http://dx.doi.org/10.1029/
J.-E. Petit et al. / Atmospheric Environment 155 (2017) 68e84 83
2008JD009849.Denier van der Gon, H.A.C., Bergstr€om, R., Fountoukis, C., Johansson, C., Pandis, S.N.,
Simpson, D., Visschedijk, A.J.H., 2015. Particulate emissions from residentialwood combustion in Europe e revised estimates and an evaluation. Atmos.Chem. Phys. 15 (11), 6503e6519. http://dx.doi.org/10.5194/acp-15-6503-2015.
Draxler, R., 1999. Hysplit4 User's Guide.Drinovec, L., Mo�cnik, G., Zotter, P., Pr�evot, A.S.H., Ruckstuhl, C., Coz, E.,
Rupakheti, M., Sciare, J., Müller, T., Wiedensohler, A., Hansen, A.D.A., 2015. The“dual-spot” Aethalometer: an improved measurement of aerosol black carbonwith real-time loading compensation. Atmos. Meas. Tech. 8 (5), 1965e1979.http://dx.doi.org/10.5194/amt-8-1965-2015.
Duplissy, J., DeCarlo, P.F., Dommen, J., Alfarra, M.R., Metzger, A., Barmpadimos, I.,Prevot, A.S.H., Weingartner, E., Tritscher, T., Gysel, M., Aiken, A.C., Jimenez, J.L.,Canagaratna, M.R., Worsnop, D.R., Collins, D.R., Tomlinson, J., Baltensperger, U.,2011. Relating hygroscopicity and composition of organic aerosol particulatematter. Atmos. Chem. Phys. 11 (3), 1155e1165. http://dx.doi.org/10.5194/acp-11-1155-2011.
Dupont, J.-C., Haeffelin, M., Badosa, J., Elias, T., Favez, O., Petit, J.E., Meleux, F.,Sciare, J., Crenn, V., Bonne, J.L., 2016. Role of the boundary layer dynamics ef-fects on an extreme air pollution event in Paris. Atmos. Environ. 141, 571e579.http://dx.doi.org/10.1016/j.atmosenv.2016.06.061.
Farmer, D.K., Matsunaga, A., Docherty, K.S., Surratt, J.D., Seinfeld, J.H., Ziemann, P.J.,Jimenez, J.L., 2010. Response of an aerosol mass spectrometer to organonitratesand organosulfates and implications for atmospheric chemistry. Proc. Natl.Acad. Sci. 107 (15), 6670e6675. http://dx.doi.org/10.1073/pnas.0912340107.
Favez, O., El Haddad, I., Piot, C., Bor�eave, A., Abidi, E., Marchand, N., Jaffrezo, J.L.,Besombes, J.L., Personnaz, M.B., Sciare, J., Wortham, H., George, C., D’anna, B.,2010. Inter-comparison of source apportionment models for the estimation ofwood burning aerosols during wintertime in an Alpine city (Grenoble, France).Atmos. Chem. Phys. 10, 5295e5314. http://dx.doi.org/10.5194/acp-10-5295-2010.
Favez, O., Petit, J.-E., Bessagnet, B., Meleux, F., Chiappini, L., Lemeur, S., Labartette, C.,Chappaz, C., Guergnion, P.-Y., Saison, J.-Y., Chretien, E., Pallares, C., Verlhac, S.,Aujay, R., Malherbe, L., Beauchamp, M., Piot, C., Jaffrezo, J.-L., Besombes, J.-L.,Sciare, J., Rouïl, L., Leoz-Garziandia, E., 2012. Main properties and origins ofwinter PM10 pollution events in France. Pollut. Atmos. 163e182.
Fortems-Cheiney, A., Dufour, G., Hamaoui-Laguel, L., Foret, G., Siour, G., VanDamme, M., Meleux, F., Coheur, P.-F., Clerbaux, C., Clarisse, L., Favez, O.,Wallasch, M., Beekmann, M., 2016. Unaccounted variability in NH3 agriculturalsources detected by IASI contributing to European spring haze episode: agri-cultural NH3 Detected by IASI. Geophys. Res. Lett. 43 (10), 5475e5482. http://dx.doi.org/10.1002/2016GL069361.
Freney, E.J., Sellegri, K., Canonaco, F., Colomb, A., Borbon, A., Michoud, V., Doussin, J.-F., Crumeyrolle, S., Amarouche, N., Pichon, J.-M., Bourianne, T., Gomes, L.,Prevot, A.S.H., Beekmann, M., Schwarzenb€oeck, A., 2014. Characterizing theimpact of urban emissions on regional aerosol particles: airborne measure-ments during the MEGAPOLI experiment. Atmos. Chem. Phys. 14 (3),1397e1412. http://dx.doi.org/10.5194/acp-14-1397-2014.
Fr€ohlich, R., Crenn, V., Setyan, A., Belis, C.A., Canonaco, F., Favez, O., Riffault, V.,Slowik, J.G., Aas, W., Aij€al€a, M., Alastuey, A., Arti~nano, B., Bonnaire, N.,Bozzetti, C., Bressi, M., Carbone, C., Coz, E., Croteau, P.L., Cubison, M.J., Esser-Gietl, J.K., Green, D.C., Gros, V., Heikkinen, L., Herrmann, H., Jayne, J.T.,Lunder, C.R., Minguill�on, M.C., Mo�cnik, G., O'Dowd, C.D., Ovadnevaite, J.,Petralia, E., Poulain, L., Priestman, M., Ripoll, A., Sarda-Est�eve, R.,Wiedensohler, A., Baltensperger, U., Sciare, J., Pr�evot, A.S.H., 2015. ACTRIS ACSMintercomparison e Part 2: intercomparison of ME-2 organic source appor-tionment results from 15 individual, co-located aerosol mass spectrometers.Atmos. Meas. Tech. 8 (6), 2555e2576. http://dx.doi.org/10.5194/amt-8-2555-2015.
Garg, S., Chandra, B.P., Sinha, V., Sarda-Esteve, R., Gros, V., Sinha, B., 2016. Limitationof the Use of the Absorption Angstrom Exponent for Source Apportionment ofEquivalent Black Carbon: a Case Study from the North West Indo-GangeticPlain. Environ. Sci. Technol. 50 (2), 814e824. http://dx.doi.org/10.1021/acs.est.5b03868.
Haeffelin, M., Barth�es, L., Bock, O., Boitel, C., Bony, S., Bouniol, D., Chepfer, H.,Chiriaco, M., Cuesta, J., Delano€e, J., 2005. SIRTA, a ground-based atmosphericobservatory for cloud and aerosol research. Ann. Geophys 253e275.
Habets, F., Bo�e, J., D�equ�e, M., Ducharne, A., Gascoin, S., Hachour, A.L., Martin, E.,Pag�e, C., Sauquet, E., Terray, L., Thi�ery, D., Oudin, L., Viennot, P., 2013. Impact ofclimate change on the hydrogeology of two basins in northern France. ClimaticChange 121, 771e785. http://dx.doi.org/10.1007/s10584-013-0934-x.
Herich, H., Hueglin, C., Buchmann, B., 2011. A 2.5 year's source apportionment studyof black carbon from wood burning and fossil fuel combustion at urban andrural sites in Switzerland. Atmos. Meas. Tech. 4 (7), 1409e1420. http://dx.doi.org/10.5194/amt-4-1409-2011.
Huang, R.-J., Zhang, Y., Bozzetti, C., Ho, K.-F., Cao, J.-J., Han, Y., Daellenbach, K.R.,Slowik, J.G., Platt, S.M., Canonaco, F., Zotter, P., Wolf, R., Pieber, S.M., Bruns, E.A.,Crippa, M., Ciarelli, G., Piazzalunga, A., Schwikowski, M., Abbaszade, G.,Schnelle-Kreis, J., Zimmermann, R., An, Z., Szidat, S., Baltensperger, U.,Haddad, I.E., Pr�evot, A.S.H., 2014. High secondary aerosol contribution to par-ticulate pollution during haze events in China. Nature 514. http://dx.doi.org/10.1038/nature13774.
IARC, 2013. Outdoor Air Pollution a Leading Environmental Cause of Cancer Deaths.press release n�221.
Jacob, D.J., Winner, D.A., 2009. Effect of climate change on air quality. Atmos.
Environ. 43, 51e63. http://dx.doi.org/10.1016/j.atmosenv.2008.09.051.Jerez, S., Jimenez-Guerrero, P., Mont�avez, J.P., Trigo, R.M., 2013. Impact of the North
Atlantic Oscillation on European aerosol ground levels through local processes:a seasonal model-based assessment using fixed anthropogenic emissions.Atmos. Chem. Phys. 13 (22), 11195e11207. http://dx.doi.org/10.5194/acp-13-11195-2013.
Jia, Y., Rahn, K.A., He, K., Wen, T., Wang, Y., 2008. A novel technique for quantifyingthe regional component of urban aerosol solely from its sawtooth cycles.J. Geophys. Res. 113 (D21) http://dx.doi.org/10.1029/2008JD010389.
Jones, P.D., Lister, D.H., 2009. The influence of the circulation on surface tempera-ture and precipitation patterns over Europe. Clim. Past. 5 (2), 259e267.
Kiendler-Scharr, A., Mensah, A.A., Friese, E., Topping, D., Nemitz, E., Prevot, A.S.H.,€Aij€al€a, M., Allan, J., Canonaco, F., Canagaratna, M., Carbone, S., Crippa, M., DallOsto, M., Day, D.A., De Carlo, P., Di Marco, C.F., Elbern, H., Eriksson, A., Freney, E.,Hao, L., Herrmann, H., Hildebrandt, L., Hillamo, R., Jimenez, J.L., Laaksonen, A.,McFiggans, G., Mohr, C., O'Dowd, C., Otjes, R., Ovadnevaite, J., Pandis, S.N.,Poulain, L., Schlag, P., Sellegri, K., Swietlicki, E., Tiitta, P., Vermeulen, A.,Wahner, A., Worsnop, D., Wu, H.-C., 2016. Ubiquity of organic nitrates fromnighttime chemistry in the European submicron aerosol: organic Nitrates inEuropean PM1. Geophys. Res. Lett. 43 (14), 7735e7744. http://dx.doi.org/10.1002/2016GL069239.
Kim, E., Turkiewicz, K., Zulawnick, S.A., Magliano, K.L., 2010. Sources of fine particlesin the South Coast area, California. Atmos. Environ. 44 (26), 3095e3100. http://dx.doi.org/10.1016/j.atmosenv.2010.05.037.
Kovats, R.S., Valentini, R., Bouwer, L.M., Georgopoulou, E., Jacob, D., Martin, E.,Rounsevell, M., Soussana, J.-F., 2014. Europe. In: Barros, V.R., Field, C.B.,Dokken, D.J., Mastrandrea, M.D., Mach, K.J., Bilir, T.E., Chatterjee, M., Ebi, K.L.,Estrada, Y.O., Genova, R.C., Girma, B., Kissel, E.S., Levy, A.N., MacCracken, S.,Mastrandrea, P.R., White, L.L. (Eds.), Climate Change 2014: impacts, Adaptation,and Vulnerability. Part B: Regional Aspects. Contribution of Working Group II tothe Fifth Assessment Report of the Intergovernmental Panel on Climate Change.Cambridge University Press, Cambridge, United Kingdom and New York, NY,USA, pp. 1267e1326.
Lattuati, M., 1997. Contribution à l’étude du bilan de l’ozone troposphérique àl’interface de l’Europe et de l’Atlantique Nord: Modélisation lagrangienne etmesures en altitude. Ph.D. thesis. Univ. Pierre et Marie Curie, Paris, France.
Lavers, D., Prudhomme, C., Hannah, D.M., 2013. European precipitation connectionswith large-scale mean sea-level pressure (MSLP) fields. Hydrol. Sci. J. 58 (2),310e327. http://dx.doi.org/10.1080/02626667.2012.754545.
Li, H., Duan, F., He, K., Ma, Y., Kimoto, T., Huang, T., 2016. Size-dependent charac-terization of atmospheric particles during winter in beijing. Atmosphere 7 (3),36. http://dx.doi.org/10.3390/atmos7030036.
Menut, L., Bessagnet, B., Khvorostyanov, D., Beekmann, M., Blond, N., Colette, A.,Coll, I., Curci, G., Foret, G., Hodzic, A., Mailler, S., Meleux, F., Monge, J.-L., Pison, I.,Siour, G., Turquety, S., Valari, M., Vautard, R., Vivanco, M.G., 2013. CHIMERE2013: a model for regional atmospheric composition modelling. Geosci. Model.Dev. 6 (4), 981e1028. http://dx.doi.org/10.5194/gmd-6-981-2013.
Middlebrook, A.M., Bahreini, R., Jimenez, J.L., Canagaratna, M.R., 2012. Evaluation ofcomposition-dependent collection efficiencies for the aerodyne aerosol massspectrometer using field data. Aerosol Sci. Technol. 46 (3), 258e271. http://dx.doi.org/10.1080/02786826.2011.620041.
Morgan, W.T., Allan, J.D., Bower, K.N., Highwood, E.J., Liu, D., McMeeking, G.R.,Northway, M.J., Williams, P.I., Krejci, R., Coe, H., 2010. Airborne measurements ofthe spatial distribution of aerosol chemical composition across Europe andevolution of the organic fraction. Atmos. Chem. Phys. 10 (8), 4065e4083. http://dx.doi.org/10.5194/acp-10-4065-2010.
Nenes, A., Pandis, S.N., Pilinis, C., 1998. ISORROPIA: a new thermodynamic equi-librium model for multiphase multicomponent inorganic aerosols. Aquat.Geochem. 4 (1), 123e152.
Ng, N.L., Herndon, S.C., Trimborn, A., Canagaratna, M.R., Croteau, P.L., Onasch, T.B.,Sueper, D., Worsnop, D.R., Zhang, Q., Sun, Y.L., 2011a. An aerosol chemicalspeciation monitor (ACSM) for routine monitoring of the composition and massconcentrations of ambient aerosol. Aerosol Sci. Technol. 45 (7), 780e794.
Ng, N.L., Canagaratna, M.R., Jimenez, J.L., Chhabra, P.S., Seinfeld, J.H., Worsnop, D.R.,2011b. Changes in organic aerosol compositionwith aging inferred from aerosolmass spectra. Atmos. Chem. Phys. 11 (13), 6465e6474. http://dx.doi.org/10.5194/acp-11-6465-2011.
Ortega, A.M., Day, D.A., Cubison, M.J., Brune, W.H., Bon, D., de Gouw, J.A.,Jimenez, J.L., 2013. Secondary organic aerosol formation and primary organicaerosol oxidation from biomass-burning smoke in a flow reactor during FLAME-3. Atmos. Chem. Phys. 13 (22), 11551e11571. http://dx.doi.org/10.5194/acp-13-11551-2013.
Pausata, F.S.R., Pozzoli, L., Dingenen, R.V., Vignati, E., Cavalli, F., Dentener, F.J., 2013.Impacts of changes in North Atlantic atmospheric circulation on particulatematter and human health in Europe: NAO impacts on PM and human health.Geophys. Res. Lett. 40 (15), 4074e4080. http://dx.doi.org/10.1002/grl.50720.
Pay, M.T., Jim�enez-Guerrero, P., Baldasano, J.M., 2012. Assessing sensitivity regimesof secondary inorganic aerosol formation in Europe with the CALIOPE-EUmodeling system. Atmos. Environ. 51, 146e164. http://dx.doi.org/10.1016/j.atmosenv.2012.01.027.
Peel, J.L., Haeuber, R., Garcia, V., Russel, A.G., Neas, L., 2013. Impact of nitrogen andclimate change interactions on ambient air pollution and human health.Biogeochemistry 114, 121e134. http://dx.doi.org/10.1007/s10533-012-9782-4.
Petetin, H., Beekmann, M., Sciare, J., Bressi, M., Rosso, A., Sanchez, O., Ghersi, V.,2014. A novel model evaluation approach focusing on local and advected

J.-E. Petit et al. / Atmospheric Environment 155 (2017) 68e8484
contributions to urban PM2.5 levels e application to Paris, France. Geosci.Model. Dev. 7 (4), 1483e1505. http://dx.doi.org/10.5194/gmd-7-1483-2014.
Petetin, H., Beekmann, M., Colomb, A., Denier van der Gon, H.A.C., Dupont, J.-C.,Honor�e, C., Michoud, V., Morille, Y., Perrussel, O., Schwarzenboeck, A., Sciare, J.,Wiedensohler, A., Zhang, Q.J., 2015. Evaluating BC and NOx emission inventoriesfor the Paris region fromMEGAPOLI aircraft measurements. Atmos. Chem. Phys.15 (17), 9799e9818. http://dx.doi.org/10.5194/acp-15-9799-2015.
Petetin, H., Sciare, J., Bressi, M., Gros, V., Rosso, A., Sanchez, O., Sarda-Est�eve, R.,Petit, J.-E., Beekmann, M., 2016. Assessing the ammonium nitrate formationregime in the Paris megacity and its representation in the CHIMERE model.Atmos. Chem. Phys. 16 (16), 10419e10440. http://dx.doi.org/10.5194/acp-16-10419-2016.
Petit, J.-E., Favez, O., Sciare, J., Canonaco, F., Croteau, P., Mo�cnik, G., Jayne, J.,Worsnop, D., Leoz-Garziandia, E., 2014. Submicron aerosol source apportion-ment of wintertime pollution in Paris, France by double positive matrixfactorization (PMF2) using an aerosol chemical speciation monitor (ACSM) anda multi-wavelength aethalometer. Atmos. Chem. Phys. 14 (24), 13773e13787.http://dx.doi.org/10.5194/acp-14-13773-2014.
Petit, J.-E., Favez, O., Sciare, J., Crenn, V., Sarda-Est�eve, R., Bonnaire, N., Mo�cnik, G.,Dupont, J.-C., Haeffelin, M., Leoz-Garziandia, E., 2015. Two years of near real-time chemical composition of submicron aerosols in the region of Paris usingan aerosol chemical speciation monitor (ACSM) and a multi-wavelengthaethalometer. Atmos. Chem. Phys. 15 (6), 2985e3005. http://dx.doi.org/10.5194/acp-15-2985-2015.
Petit, J.-E., Favez, O., Albinet, A., Canonaco, F., 2017. A user-friendly tool forcomprehensive evaluation of the geographical origins of atmospheric pollution:Wind and trajectory analyses. Environ. Model. Softw. 88, 183e187. http://dx.doi.org/10.1016/j.envsoft.2016.11.022.
Pieber, S.M., El Haddad, I., Slowik, J.G., Canagaratna, M.R., Jayne, J.T., Platt, S.M.,Bozzetti, C., Daellenbach, K.R., Fr€ohlich, R., Vlachou, A., Klein, F., Dommen, J.,Miljevic, B., Jim�enez, J.L., Worsnop, D.R., Baltensperger, U., Pr�evot, A.S.H., 2016.Inorganic salt interference on CO2þ in aerodyne AMS and ACSM organicaerosol composition studies. Environ. Sci. Technol. 50 (19) http://dx.doi.org/10.1021/acs.est.6b01035.
Pokrovsky, O.M., 2009. European rain rate modulation enhanced by changes in theNAO and atmospheric circulation regimes. Comput. Geosci. 35 (5), 897e906.http://dx.doi.org/10.1016/j.cageo.2007.12.005.
Pope, R.J., Savage, N.H., Chipperfield, M.P., Ord�o~nez, C., Neal, L.S., 2015. The influenceof synoptic weather regimes on UK air quality: regional model studies oftropospheric column NO2. Atmos. Chem. Phys. 15 (19), 11201e11215. http://dx.doi.org/10.5194/acp-15-11201-2015.
Putaud, J.-P., Van Dingenen, R., Alastuey, A., Bauer, H., Birmili, W., Cyrys, J.,Flentje, H., Fuzzi, S., Gehrig, R., Hansson, H.-C, Harrison, R.M., Herrmann, H.,Hitzenberger, R., Hüglin, C., Jones, A.M., Kasper-Giebl, A., Kiss, G., Kousa, A.,Kuhlbusch, T.A.J., L€oschau, G., Maenhaut, W., Molnar, A., Moreno, T.,Pekkanen, J., Perrino, C., Pitz, M., Puxbaum, H., Querol, X., Rodriguez, S.,Salma, I., Schwarz, J., Smolik, J., Schneider, J., Spindler, G., ten Brink, H.,Tursic, J., Viana, M., Wiedensohler, A., Raes, F., 2010. A European aerosolphenomenologye3: physical and chemical characteristics of particulatematter from 60 rural, urban, and kerbside sites across Europe. Atmos.Environ. 44 (10), 1308e1320. http://dx.doi.org/10.1016/j.atmosenv.2009.12.011.ISSN: 1352-2310.
Ramgolam, K., Favez, O., Cachier, H., Gaudichet, A., Marano, F., Martinon, L., Baeza-Squiban, A., 2009. Size-partitioning of an urban aerosol to identify particledeterminants involved in the proinflammatory response induced in airwayepithelial cells. Part. Fibre Toxicol. 6 (10) http://dx.doi.org/10.1186/1743-8977-6-10.
Rouil, L., Honor�e, C., Bessagnet, B., Malherbe, L., Meleux, F., Vautard, R.,Beekmann, M., Flaud, J.-M., Dufour, A., Martin, D., Peuch, A., Peuch, V.-H.,Elichegaray, C., Poisson, N., Menut, L., 2009. Prev’air: an Operational forecastingand Mapping system for air quality in Europe. Bull. Am. Meteorol. Soc. 90 (1),73e83. http://dx.doi.org/10.1175/2008BAMS2390.1.
Rouïl, L., Bessagnet, B., Favez, O., Leoz-Garziandia, E., Meleux, F., 2015. Particulate air
pollution episodes in France: lessons learnt from recent episodes. Pollut. Atmos.101.
Sandradewi, J., Pr�evot, A.S.H., Szidat, S., Perron, N., Alfarra, M.R., Lanz, V.A.,Weingartner, E., Baltensperger, U., 2008. Using aerosol Light absorption mea-surements for the quantitative determination of wood burning and trafficemission contributions to particulate matter. Environ. Sci. Technol. 42 (9),3316e3323. http://dx.doi.org/10.1021/es702253m.
Schneider, J., Weimer, S., Drewnick, F., Borrmann, S., Helas, G., Gwaze, P., Schmid, O.,Andreae, M.O., Kirchner, U., 2006. Mass spectrometric analysis and aero-dynamic properties of various types of combustion-related aerosol particles.Int. J. Mass Spectrom. 258 (1e3), 37e49. http://dx.doi.org/10.1016/j.ijms.2006.07.008.
Sciare, J., d’ Argouges, O., Sarda-Est�eve, R., Gaimoz, C., Dolgorouky, C., Bonnaire, N.,Favez, O., Bonsang, B., Gros, V., 2011. Large contribution of water-insolublesecondary organic aerosols in the region of Paris (France) during wintertime.J. Geophys. Res. Atmos. 116 (D22) http://dx.doi.org/10.1029/2011JD015756 n/aen/a.
Stein, A.F., Draxler, R.R., Rolph, G.D., Stunder, B.J.B., Cohen, M.D., Ngan, F., 2015.NOAA's HYSPLIT atmospheric transport and dispersion modeling system. Bull.Am. Meteorol. Soc. 96 (12), 2059e2077. http://dx.doi.org/10.1175/BAMS-D-14-00110.1.
Waked, A., Favez, O., Alleman, L.Y., Piot, C., Petit, J.-E., Delaunay, T., Verlinden, E.,Golly, B., Besombes, J.-L., Jaffrezo, J.-L., Leoz-Garziandia, E., 2014. Sourceapportionment of PM10 in a north-western Europe regional urban backgroundsite (Lens, France) using positive matrix factorization and including primarybiogenic emissions. Atmos. Chem. Phys. 14 (7), 3325e3346. http://dx.doi.org/10.5194/acp-14-3325-2014.
Wang, H.-J., Chen, H.-P., 2016. Understanding the recent trend of haze pollution ineastern China: roles of climate change. Atmos. Chem. Phys. 16 (6), 4205e4211.http://dx.doi.org/10.5194/acp-16-4205-2016.
Von der Weiden-Reinmüller, S.-L., Drewnick, F., Zhang, Q.J., Freutel, F.,Beekmann, M., Borrmann, S., 2014. Megacity emission plume characteristics insummer and winter investigated by mobile aerosol and trace gas measure-ments: the Paris metropolitan area. Atmos. Chem. Phys. Discuss. 14 (8),11249e11299. http://dx.doi.org/10.5194/acpd-14-11249-2014.
Yiou, P., Cattiaux, J., 2013. Contribution of Atmospheric circulation to wet NorthEuropean summer precipitation of 2012 [in “Explaining Extreme Events of 2012from a Climate Perspective”] Am. Meteorol. Soc. 94 (9).
Zhang, Q., Jimenez, J.L., Worsnop, D.R., Canagaratna, M., 2007. A case study of urbanparticle acidity and its influence on secondary organic aerosol. Environ. Sci.Technol. 41 (9), 3213e3219. http://dx.doi.org/10.1021/es061812j.
Zhang, Q.J., Beekmann, M., Drewnick, F., Freutel, F., Schneider, J., Crippa, M.,Prevot, A.S.H., Baltensperger, U., Poulain, L., Wiedensohler, A., Sciare, J., Gros, V.,Borbon, A., Colomb, A., Michoud, V., Doussin, J.-F., Denier van der Gon, H.A.C.,Haeffelin, M., Dupont, J.-C., Siour, G., Petetin, H., Bessagnet, B., Pandis, S.N.,Hodzic, A., Sanchez, O., Honor�e, C., Perrussel, O., 2013. Formation of organicaerosol in the Paris region during the MEGAPOLI summer campaign: evaluationof the volatility-basis-set approach within the CHIMERE model. Atmos. Chem.Phys. 13 (11), 5767e5790. http://dx.doi.org/10.5194/acp-13-5767-2013.
Zhang, Q., Yan, R., Fan, J., Yu, S., Yang, W., Li, P., Wang, S., Chen, B., Liu, W., Zhang, X.,2015. A heavy haze episode in shanghai in december of 2013: characteristics,origins and implications. Aerosol Air Qual. Res. 15, 1881e1893. http://dx.doi.org/10.4209/aaqr.2015.03.0179.
Zhang, Y., Ding, A., Mao, H., Nie, W., Zhou, D., Liu, L., Huang, X., Fu, C., 2016. Impact ofsynoptic weather patterns and inter-decadal climate variability on air quality inthe North China Plain during 1980e2013. Atmos. Environ. 124, 119e128. http://dx.doi.org/10.1016/j.atmosenv.2015.05.063.
Zotter, P., Herich, H., Gysel, M., El-Haddad, I., Zhang, Y., Mo�cnik, G., Hüglin, C.,Baltensperger, U., Szidat, S., Pr�evot, A.S.H., 2016. Evaluation of the absorptionÅngstr€om exponents for traffic and wood burning in the Aethalometer basedsource apportionment using radiocarbon measurements of ambient aerosol.Atmos. Chem. Phys. Discuss. 1e29. http://dx.doi.org/10.5194/acp-2016-621.